
 Submit a Paper
 Propose a Special lssue
 Open Access
ARTICLE
Bidirectional LSTM-Based Energy Consumption Forecasting: Advancing AI-Driven Cloud Integration for Cognitive City Energy Management
1 Department of Computer Science and Engineering, Srinivasa Ramanujan Centre, SASTRA Deemed University, Kumbakonam, 612001, India
2 Department of Computer Science and Engineering, Faculty of Engineering and Technology, JAIN (Deemed-to-be University), Bangalore, 562112, India
3 School of Science, Engineering and Environment, University of Salford, Manchester, M54WT, UK
4 University Centre for Research and Development, Chandigarh University, Mohali, 140413, Punjab, India
5 Centre for Research Impact and Outcome, Chitkara University Institute of Engineering and Technology, Chitkara University, Rajpura, 140401, Punjab, India
6 Department of Information Systems, College of Computer and Information Science, Princess Nourah bint Abdulrahman University, P.O. Box 84428, Riyadh, 11671, Saudi Arabia
7 College of Computer Science Informatics and Computer Systems Department, King Khalid University, Abha, 61421, Saudi Arabia
8 Department of Computer Science and Artificial Intelligence, College of Computing and Information Technology, University of Bisha, Bisha, 61922, Saudi Arabia
* Corresponding Author: Mahesh Thyluru Ramakrishna. Email:
(This article belongs to the Special Issue: Empowered Connected Futures of AI, IoT, and Cloud Computing in the Development of Cognitive Cities)
Computers, Materials & Continua 2025, 83(2), 2907-2926. https://doi.org/10.32604/cmc.2025.063809
Received 24 January 2025; Accepted 03 March 2025; Issue published 16 April 2025
 View Full Text
 Download PDF
Abstract
Efficient energy management is a cornerstone of advancing cognitive cities, where AI, IoT, and cloud computing seamlessly integrate to meet escalating global energy demands. Within this context, the ability to forecast electricity consumption with precision is vital, particularly in residential settings where usage patterns are highly variable and complex. This study presents an innovative approach to energy consumption forecasting using a bidirectional Long Short-Term Memory (LSTM) network. Leveraging a dataset containing over two million multivariate, time-series observations collected from a single household over nearly four years, our model addresses the limitations of traditional time-series forecasting methods, which often struggle with temporal dependencies and non-linear relationships. The bidirectional LSTM architecture processes data in both forward and backward directions, capturing past and future contexts at each time step, whereas existing unidirectional LSTMs consider only a single temporal direction. This design, combined with dropout regularization, leads to a 20.6% reduction in RMSE and an 18.8% improvement in MAE over conventional unidirectional LSTMs, demonstrating a substantial enhancement in prediction accuracy and robustness. Compared to existing models—including SVM, Random Forest, MLP, ANN, and CNN—the proposed model achieves the lowest MAE of 0.0831 and RMSE of 0.2213 during testing, significantly outperforming these benchmarks. These results highlight the model’s superior ability to navigate the complexities of energy usage patterns, reinforcing its potential application in AI-driven IoT and cloud-enabled energy management systems for cognitive cities. By integrating advanced machine learning techniques with IoT and cloud infrastructure, this research contributes to the development of intelligent, sustainable urban environments.Keywords
Accurate energy demand forecasting is crucial for effective power grid management, aiding utility sectors in optimizing short-term (ST) load decisions. ST forecasting, which covers timeframes from one hour to one week, plays a vital role in ensuring efficient energy distribution [1]. The energy consumption calculation with fluctuation in various sectors is still a challenging task to be handled by the available energy systems (ES) [2]. It reveals that EC all over the globe is swiftly rising. Hence, every nation attempts to employ as low energy as feasible within their nation in disparate regions from buildings to ranches, from factory procedures to automobiles [3].
Energy consumption arises from numerous sources including fossil fuels (coal, oil, natural gas), renewable energy resources (solar, wind, hydrothermal, and geothermal power stations), and nuclear power stations where each of them plays a vital role in addressing the energy demands. The variability exhibited by each of the sources might affect the accuracy of the prediction. A time series analysis to calculate the fluctuation in different meters is a potential task for any analytics model [4]. Forecasting acts as a planning tool to analyze consumption, which is affected by various influencing factors such as weather conditions, economic activities, and technological advancements [5]. Reliable forecasts enable policymakers and industries to develop energy-efficient strategies, reduce waste, and transition towards sustainable energy practices [6].
Electricity demand in cities rose proportionately to its increase in populace [7]; however, this demand encounters an elevated ST difference because of the disposition of factory, business, and residentiary actions in every particular subject. Additionally, accurate forecasting becomes a crucial task in a stable energy supply where the load should be matched with the energy supply [8]. Centered upon these concerns, it remains beneficial to proffer forecasting paradigms capable of prognosticating the energy demand (ED) of single or multiple frameworks meant to reinforce public laws for the production and dispensation of electrical energy (EE). Both the futurity supplying of EE and the present administration of electricity production and dispensation in particular situations greatly need the finest forecasting instruments for portraying disparate circumstances and reinforcing resolution, creating, and preparing in the urbanized preparation scope. To detect the paradigm that perfectly suits the accessible data for giving dependable forecasts, it remains essential to correlate disparate techniques, explain everyone’s benefits and drawbacks, and impartially select the finest choice.
Machine Learning models are implemented in numerous fields due to their effectiveness. The models work by mapping input data to a desired output and making accurate predictions. These models can forecast Energy Consumption (EC) with high precision. Hence, they could be employed by governments to implement energy-saving laws. As an example, machine learning paradigms could perform the time-series analysis in calculating the energy consumption to ensure the reliability of the modern electricity grid [9]. They could also be employed to prognosticate the upcoming usage of disparate energy sources such as electricity or natural gas.
This paper proffers deep learning (DL) approaches for precisely forecasting EC in the RBs with the RE model. For loading the space detected within the knowledge’s body, this study designs establish and substantiates an HMAEC forecasting methodology (FM) centered upon a Bidirectional Long Short-Term Memory-Recurrent Neural Network (BLSTM-RNN). The focuses of the chief apportionments made by this established technique are as follows: Identifying research gaps in the importance of energy consumption forecasting and its relevance in power grid administration involves understanding the existing literature and pinpointing areas that require further investigation. While research in this area is extensive, several potential research gaps exist. Research focusing on the implementation and evaluation of advanced forecasting methods in real-world grid operations could provide valuable insights. The quality and availability of data play a crucial role in the accuracy of energy consumption forecasts. Research exploring the impact of data quality issues, such as missing data, outliers, and measurement errors, on forecasting performance is essential. Energy consumption forecasting inherently involves uncertainty due to factors such as weather variations, economic fluctuations, and technological changes. Many existing forecasting models operate at aggregated temporal and spatial resolutions, which may limit their ability to capture localized variations and short-term dynamics in energy consumption. Energy consumption forecasting not only impacts grid operations but also has broader socioeconomic and environmental implications. The contributions of the article in power consumption forecasting are given below:
• A “real-world dataset” typically refers to a collection of data gathered from actual observations or measurements in the physical or digital world, rather than being artificially generated or simulated.
• Subsequently preprocessing for the extracted data is performed by using fuzzy C-Means clustering model added to normalization also.
• By using bi-directional RNN with LSTM learning model training and validation for the given dataset is performed.
• The obtained results were compared with the existing methods like MSE, MAE, and RMSE.
EE remains very significant in terms of energy’s endurability and the environment. A study on modern energy (ME) projects in South Africa highlights the role of AI-driven predictive analysis in optimizing long-term energy management. This reinforces the advantage of bidirectional LSTM for power fluctuation prediction. Unlike standard predictive strategies, which may struggle with dynamic energy variations, bidirectional LSTM effectively handles temporal dependencies, making it a more robust solution for managing energy fluctuations in real-world applications [10]. The study [11] implements the LSTM model to perform power demand forecasting based on the consumer’s utility. The study [12] assesses the P-V techniques to analyze building energy (BE). Their analysis proved that the P-V technique using Auto-Enconder, along with Neural Network, was employed extensively within the EDn. Their examination exhibited that the ANN paradigm remained extremely famous for extracting energy-related features effectively. This is due to the ability of ANN to learn fluctuating patterns in energy consumption and the generalization of the fluctuation in real-world scenarios. The various factors affecting power consumption including weather conditions, time, user behavior, etc can be captured well by the multi-layered structure and the feature extraction process of ANN. The various error rate measures are considered for analyzing the stability of the model, and they have resulted in better results compared to other existing models. The study [13] analyzes D-D techniques for prognosticating building EC (BEC). This work concentrates on examining the prognosis scopes, the data preprocessing (DP) methodologies, the machine learning prognosis paradigm, and the execution standards employed for assessment. Considering the data dimension, the majority of the investigated works employed a 1-month to 1-year database. The study [14] presents a deep learning approach that integrates Multilayer Perceptron (MLP), Deep Neural Network (DNN), and LSTM to create an effective power usage factor for optimizing energy efficiency. ResNet also performs superiorly in forecasting power consumption due to its in-depth architecture, and it can solve the gradient descent problem through its residual connections. The existing DNN model’s efficiency faces limitations in deeper analysis, whereas ResNet concentrates on smoothening the gradient approach and improving the overall performance of the model. Next, a residual NN was established to stimulate EC in disparate spatiotemporal solutions. Nevertheless, producing the EC data out of a physics-related paradigm remains long drawn out and the weight of the hidden layers (HLs) weight within ResNet could be excerpted for describing the comparisons betwixt utilization in neighboring buildings. The study [15] implements a deep reinforcement learning model to analyze the continuous fluctuations in energy analysis that are experienced by the data centers. The study [16] examines the AI paradigms’ execution in prognosticating measures. The experiential outcome exhibited that the dual strategical analysis based on the nature of the data can be implemented for energy forecasting. The study also summed up the idea that the implementation of AI models in building management and automation systems (BMAS) could extract accurate data promptly. This study has also identified the challenges faced by traditional unidirectional LSTM and transformers, which fail to analyze the dual effects of energy data, i.e., past and futuristic information of the current data. An ensemble analysis of LSTM and CNN gave a better performance in analyzing the power consumption forecasting with small grids [17]. The kernel assignment to the deep neural models such as Feed Forward Neural Network has reduced the MAE when compared to other models [18]. By the assessment of the present knowledge status aforementioned, anyone could detect a real requirement, a space within the present technique concerning attaining a precise LT hourly forecast for the MHEC relating to enormous commercial center-kind electricity consumers (CCECs) devoid of encountering an important fall in the FA, which generally includes happening after the initial 2 weeks. Hence, by following this way, anyone could attain a dependable, precise FM, that fulfills the contractor’s requirements assisting him in attaining durable economic, trade, and administrative commercial procedures. Compared to convolutional neural networks (CNNs), which excel at spatial feature extraction but struggle with sequential dependencies, Bi-LSTM is better suited for handling temporal complexities. Additionally, while architectures like ResNet are effective in deep hierarchical learning, they may not be as specialized in modeling sequential patterns as Bi-LSTM. Furthermore, compared to traditional models such as Support Vector Machines (SVM) and Random Forest, Bi-LSTM demonstrates superior performance in capturing nonlinear dependencies and long-range correlations in power consumption data. By leveraging dropout regularization and efficient backpropagation, Bi-LSTM enhances prediction accuracy while reducing overfitting, making it an optimal choice for energy consumption forecasting in smart grids and cognitive cities.
This section outlines the methodology employed to develop and evaluate a bidirectional LSTM model for forecasting household electricity consumption. The study utilizes a comprehensive dataset, detailing the implementation process from data preprocessing to model evaluation. Fig. 1 represents the complete workflow of the proposed methodology.

Figure 1: Workflow of proposed bidirectional LSTM model
3.1 Data Collection and Preprocessing
The foundation of this study is a dataset consisting of 2,075,259 multivariate time-series observations, meticulously recorded from a single household located near Paris, France. The data collection spanned almost four years, from December 2006 to November 2010, providing a rich longitudinal study of household electricity consumption. This dataset is not only extensive but also intricate, including a variety of electrical measurements that provide a detailed snapshot of household energy use dynamics. The variables recorded in this dataset include basic temporal markers—date and time—and several critical electricity consumption metrics. Among these metrics are:
• Global Active Power: The total active power consumed by the household at a given minute, measured in kilowatts (kW). Active power is the productive power that performs work in the electrical system.
• Global Reactive Power: The total reactive power, measured in kilovolt-amperes reactive (kVAR). Unlike active power, reactive power does not perform work, instead oscillating between the source and load. It is essential for maintaining the voltage levels necessary for equipment operation.
• Voltage: The average voltage level observed during the minute, measured in volts (V). This measurement is indicative of the quality and stability of the electricity supplied to the household.
• Global Intensity: This represents the total current consumed by the household, measured in amperes (A). It provides a direct measure of how intense the usage of electricity is at any given time.
• Sub-metering Values: These are readings from three separate sub-meters in the household, tracking specific categories of electrical appliances or circuits separately.
Initial data integrity checks revealed that approximately 1.25% of the observations were incomplete, presenting a potential challenge for any time-series analysis. Missing values can introduce bias or distort the predictive modeling process, leading to inaccurate forecasts.
In this study, missing values were handled by exclusion, meaning any timestamp containing incomplete data was omitted from the dataset. This approach was chosen to maintain the robustness of the analytical results, ensuring that only complete and accurate data was used for further processing and modeling. The decision to omit rather than impute or replace missing data was based on the rationale that the high granularity of the dataset (minute-level observations) and the relatively low percentage of missingness would allow for this without compromising the dataset’s integrity or the continuity of the time series. Fig. 2 shows the global active power distribution and its normal probability. The raw data collected provided timestamps in separate date and time columns. To facilitate time-series analysis and modelling, these were combined into a single date-time object for each observation. This transformation not only simplifies the dataset structure but also enhances the model’s ability to understand and leverage the inherent temporal relationships in the data. Table 1 presents Kurtosis and Skewness values for a normal distribution. These derived features are pivotal for the subsequent analytical phases, providing the means to dissect the time series into more manageable and interpretable components, each reflecting different aspects of temporal variability in power usage. The resamples of power consumption are presented in Fig. 3.

Figure 2: Power distribution and normal probability plot
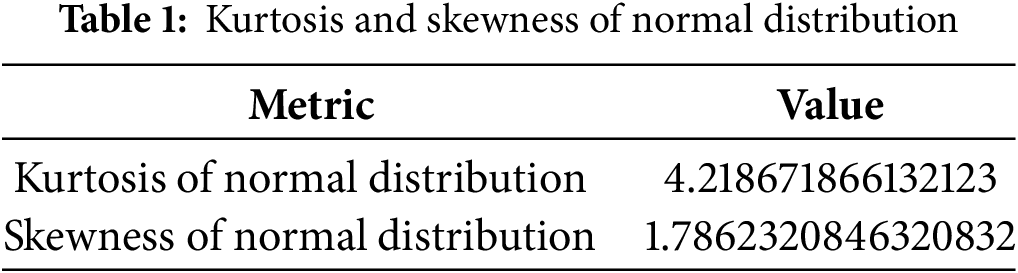

Figure 3: Resampled power consumption on different timestamps
The entire process of collecting the data from the common platform can be obtained, stored, and restored from the cloud. This can be achieved by leveraging cloud-based computational resources, which ensure scalability and efficiency and perform real-time predictions. First, historical power consumption data, along with relevant features such as weather conditions, time of day, and appliance usage, must be preprocessed using cloud-based storage and data pipelines like AWS S3, Google Cloud Storage, or Azure Blob Storage. This data is then cleaned, normalised, and transformed into sequences before being fed into a BiLSTM model, which is trained using cloud-based machine-learning frameworks such as TensorFlow and PyTorch [19]. Once trained, the BiLSTM model is evaluated using validation datasets and optimized for performance through techniques such as dropout regularization and learning rate adjustments. After achieving satisfactory accuracy, the model is saved in a serialized format (e.g., TensorFlow) and deployed as a cloud-based API using services like AWS Lambda or Google Cloud Functions. For real-time power consumption forecasting, the deployed model can be integrated with IoT devices, smart meters, and edge computing nodes, ensuring seamless data flow and low-latency predictions.
Given the wide range of values across different electrical measurements, normalization was imperative to standardize the dataset, thereby optimizing the neural network model’s performance. The MinMaxScaler was employed to scale all numerical features, including electricity consumption metrics and newly engineered time-based features, to a uniform range of 0 to 1. It is shown in Eq. (1).
where:
• x is the original value,
•
•
This scaling not only aids in speeding up the convergence of the model during training but also prevents any one feature from dominating the model’s learning process due to its scale.
Normalization is particularly important in the context of neural networks, as it ensures that the gradient descent algorithm (Eq. (2)) used in training the models operate efficiently and effectively. Without normalization, models can become biased or skewed towards variables with higher magnitudes, and training can become inefficient, leading to longer convergence times or convergence to suboptimal solutions.
where:
•
•
•
By meticulously preparing the dataset through these preprocessing steps, the study ensures that the subsequent modeling not only efficiently but also effectively captures and reflects the underlying dynamics of household electricity consumption, setting a strong foundation for accurate and robust predictive modeling.
The architecture of a model plays a critical role in its success in task execution. This section details the architecture of a sophisticated bidirectional Long Short-Term Memory (LSTM) model, designed specifically for the task of forecasting electricity consumption at a household level. This model leverages the sequential nature of time-series data to predict future values based on past observations, utilizing advanced techniques such as bidirectional learning and dropout regularization to enhance its predictive accuracy and generalization.
The model’s core comprises a bidirectional LSTM architecture, a choice driven by the need to capture both past (backward) and future (forward) dependencies within the data. LSTM networks are a type of recurrent neural network (RNN) specially designed to avoid the long-term dependency problem, allowing them to remember information for extended periods [20]. The bidirectional variant of LSTMs goes a step further by processing the data in two directions with two separate hidden layers, which are then fed forward to the same output layer. This structure enables the model to have both backward and forward information about the sequence at every time point, making it exceptionally well-suited for time-series forecasting where context from both directions is crucial for accurate predictions [21]. The mathematical equations associated with the model are given in Eqs. (3) to (8).
where:
•
•
•
•
The equations represent the key computations in a Long Short-Term Memory (LSTM) unit, which is a fundamental building block of a bidirectional LSTM network. Each step processes an input sequence while maintaining memory of past information. First, the forget gate (
where:
•
•
•
Following the initial layer, a second bidirectional LSTM layer with 50 units further refines the features extracted by the first layer. This layer helps in distilling the information to focus on the most relevant patterns that are predictive of future electricity consumption. Reducing the number of units in successive layers is a common practice in deep learning architectures aimed at progressively compressing the information to the most salient features [22]. To combat the risk of overfitting, especially significant in models dealing with large and complex datasets, dropout regularization (Eq. (10)) is employed between the LSTM layers.
where:
•
•
Overfitting occurs when a model learns not only the underlying pattern but also the noise in the training data to an extent that it negatively impacts the model’s performance on new, unseen data. By randomly omitting subsets of features (units in this case) during training (at a rate of 0.2 or 20% in this model), dropout forces the network to learn more robust features that are useful in conjunction with many different random subsets of the other neurons. This approach not only improves the generalization capabilities of the model but also contributes to a more robust learning process as it prevents the network from relying too much on any single feature. To determine the optimal dropout rate, a grid search is often conducted over a predefined range (e.g., 0.1 to 0.5), evaluating model performance based on validation loss and key metrics such as RMSE and MAE. Additionally, empirical evaluation involves testing different dropout rates on a held-out validation set and analyzing their impact on model stability and convergence. Cross-validation techniques further ensure that the chosen dropout rate generalizes well across different subsets of data.
The architecture concludes with a dense output layer (Eq. (11)) that has a single unit. This layer’s purpose is straightforward yet critical: to consolidate the features learned by the LSTM layers into a final prediction of global active power consumption for the subsequent time step.
where:
The output unit provides a continuous value, representing the model’s prediction of power usage, which is crucial for decision-making in energy management systems. The use of a single unit for output reflects the model’s final goal of predicting a single, continuous variable, which aligns with the typical structure of regression tasks in machine learning [23].
This architecture represents a well-considered approach to handling the complexities of time-series forecasting in the context of household electricity consumption. The use of a bidirectional LSTM allows the model not only to leverage the inherent sequential nature of the data but also to encapsulate the contextual relationships that a unidirectional approach might miss. Moreover, the incorporation of dropout regularization ensures that the model remains generalizable and robust against overfitting, making it well-suited for deployment in real-world scenarios where the model must perform well across varied and unseen data. This model architecture thus provides a strong foundation for the accurate and effective forecasting of electricity consumption, an essential step toward more efficient and sustainable energy management.
3.3 Model Training and Validation
Training and validation are critical phases in the development of any predictive model. They ensure that the model learns the underlying patterns of the training data and that it can generalize well to new, unseen data. This section details the processes of data splitting, training, and the selection of hyperparameters in the context of developing a bidirectional LSTM model for forecasting household electricity consumption. The data set used in this study contains over two million multivariate time-series observations from a single household, tracked over nearly four years. To prepare this dataset for training and validation, it was split into two subsets: training (80%) and testing (20%). This division ensures that most of the data is available for the model to learn from, while still reserving a substantial portion for testing its predictive power. The split was conducted based on time, meaning that the first 80% of the dataset in chronological order was used for training, and the remaining 20% was used for testing. This method preserves the temporal sequence of observations, which is crucial for time-series analysis, ensuring that the training set only contains data from earlier in the timeline and the testing set only from later. This approach avoids the risk of data leakage, where future information could inadvertently be used to train the model, which would give misleadingly optimistic performance metrics.
The training process of the LSTM model was meticulously designed to optimize its performance. The Adam optimizer (Eq. (12)–(16)), known for its effectiveness in handling sparse gradients on noisy problems, was chosen to minimize the mean squared error (MSE) (Eq. (17)) between the predicted and actual values of electricity consumption. MSE is a common loss function for regression tasks, emphasizing larger errors and ensuring that the model pays proportionately more attention to significant mispredictions.
where:
• mt and vt are the first and second moments of the gradients,
• β1 and β2 are the decay rates for the moment estimates (usually set to 0.9 and 0.999, respectively),
• ∇θL(θt) is the gradient of the loss function with respect to the model parameters,
• η is the learning rate,
• ϵ is a small constant to avoid division by zero.
• N is the number of data points,
•
•
Early stopping was implemented as a regularization technique to halt the training process if the model’s performance on the validation set did not improve for several consecutive epochs. This technique helps in preventing overtraining—where the model becomes overly complex, fitting not only the underlying pattern but also the noise in the training data, which can degrade its performance on new data. Selecting the appropriate hyperparameters is fundamental to the success of a machine learning model. Hyperparameters are the adjustable parameters that control the model training process. For this LSTM model, several key hyperparameters were optimized through a series of preliminary experiments:
Batch Size determines the number of training examples utilized to calculate the gradient during training. A suitable batch size ensures that each training epoch is a representative sample of the overall dataset, balancing computational efficiency against the quality of the model’s learning process in our study we used a batch size of 1240.
Number of Epochs refers to the number of times the entire training dataset is passed forward and backward through the model. The optimal number of epochs balances sufficient training to capture the complex dependencies in the data without veering into overfitting and thus we used 20 epochs.
These hyperparameters were tuned to minimize the validation loss, thereby ensuring that the model is neither underfitting nor overfitting. The optimal values were found through a combination of grid search and manual tuning, based on the model’s performance on the validation set. Through careful data management, training procedure design, and hyperparameter optimization, this phase of the project solidifies the foundation for a robust predictive model. This meticulous approach ensures that the model is well-prepared to handle real-world data, providing reliable and accurate forecasts of household electricity consumption.
Training and validation are critical phases in the development of any predictive model. The evaluation of the predictive model forms a fundamental component of the methodology, ensuring that the model’s predictive performance is both reliable and applicable to practical scenarios. For this study, the Bidirectional Long Short-Term Memory (BLSTM) model was selected to forecast electric power consumption, with its performance assessed using two primary metrics: Mean Absolute Error (MAE) and Root Mean Squared Error (RMSE).
Mean Absolute Error (MAE): This metric quantifies the average magnitude of the errors in a set of predictions, without direction. It measures accuracy for continuous variables and is particularly useful in scenarios where the target variable ranges across broad magnitudes. It is shown in Eq. (18).
Root Mean Squared Error (RMSE): RMSE calculates the square root of the average squared differences between predicted and actual observations. It offers a measure of the magnitude of error, giving a sense of how large errors can be expected from the model on average, thus emphasizing larger errors more than MAE due to its squaring of the residual errors. It is shown in Eq. (19).
These metrics are crucial for quantifying the model’s ability to perform accurate predictions and are standard in the field for evaluating regression models, particularly in time-series forecasting. Post-training, visual tools such as line plots comparing actual vs. predicted values and loss plots over epochs are utilized to assess model performance and convergence visually. These visual assessments help in identifying any patterns of underfitting or overfitting and in evaluating the general trend-following ability of the model.
Statistical tests play a crucial role in the validation of the assumptions underlying the forecasting model’s performance. For this study involving electric power consumption, several statistical tests were conducted to ensure the robustness and validity of the findings from the Bidirectional Long Short-Term Memory (BLSTM) model.
Test for Normality: Given the regression nature of the task, testing for normality in the distribution of residuals from the model predictions provides insights into the appropriateness of the model. A normal distribution of residuals often validates the use of certain parametric tests and confidence intervals. The Shapiro-Wilk test was chosen due to its sensitivity to deviations from normality. It is shown in Eq. (20).
where:
•
•
•
Dickey-Fuller Test: Stationarity is a critical aspect of time-series data, which implies that the statistical properties such as mean, variance, and covariance of the data are constant over time. The Dickey-Fuller test, a type of unit root test, was employed to test the null hypothesis that a unit root is present in a time series sample. Rejecting the null hypothesis suggests that the time series is stationary, which is an assumption required for some time-series forecasting models. It is shown in Eq. (21).
where:
•
•
The application of these statistical tests ensures that the model’s assumptions are verified, offering confidence in the predictive capabilities and generalizations of the BLSTM model. Such rigorous testing is essential for affirming the model’s validity and reliability in forecasting electric power consumption accurately.
The extensive analysis of the “Individual Household Electric Power Consumption” dataset, which contains over 2 million instances spanning from December 2006 to November 2010, has yielded significant insights into household power consumption patterns and their implications for energy management and efficiency strategies. This study utilized various statistical and machine learning techniques, focusing on the variable ‘Global_active_power’, to understand consumption dynamics and predict future trends. Initial data processing involved handling missing values and transforming date-time information to integrate the temporal dimensions better into the analysis. Subsequent feature engineering enhanced the dataset’s utility for time series forecasting by extracting and incorporating temporal granularities such as year, quarter, month, day, and weekday versus weekend categorizations. Statistical tests were pivotal in understanding the data’s distribution. The average power distribution is shown in Fig. 4. The Normality test indicated a non-Gaussian distribution (p < 0.05), suggesting the need for data transformation or adopting non-parametric methods for further analysis. The data exhibited positive skewness and high kurtosis, indicating that peak power consumption was not typical behavior but rather an infrequent, extreme event. Visual explorations, including violin plots and time series plots of resampled data, highlighted significant variances in power consumption over different timescales.

Figure 4: Global active power distribution
Notably, seasonal and intra-day patterns suggested higher consumption during specific periods, likely correlating with occupant behavior and environmental factors. These insights are crucial for devising time-of-use energy billing and efficiency interventions. The model’s loss is shown in Fig. 5.

Figure 5: Loss of the proposed model
The model’s performance was evaluated using the Mean Absolute Error (MAE) and the Root Mean Squared Error (RMSE), yielding the following results:
• Train MAE: 0.097982
• Train RMSE: 0.267640
• Test MAE: 0.083100
• Test RMSE: 0.221286
Fig. 6 represents the values obtained by the proposed model.

Figure 6: Model’s error metrics
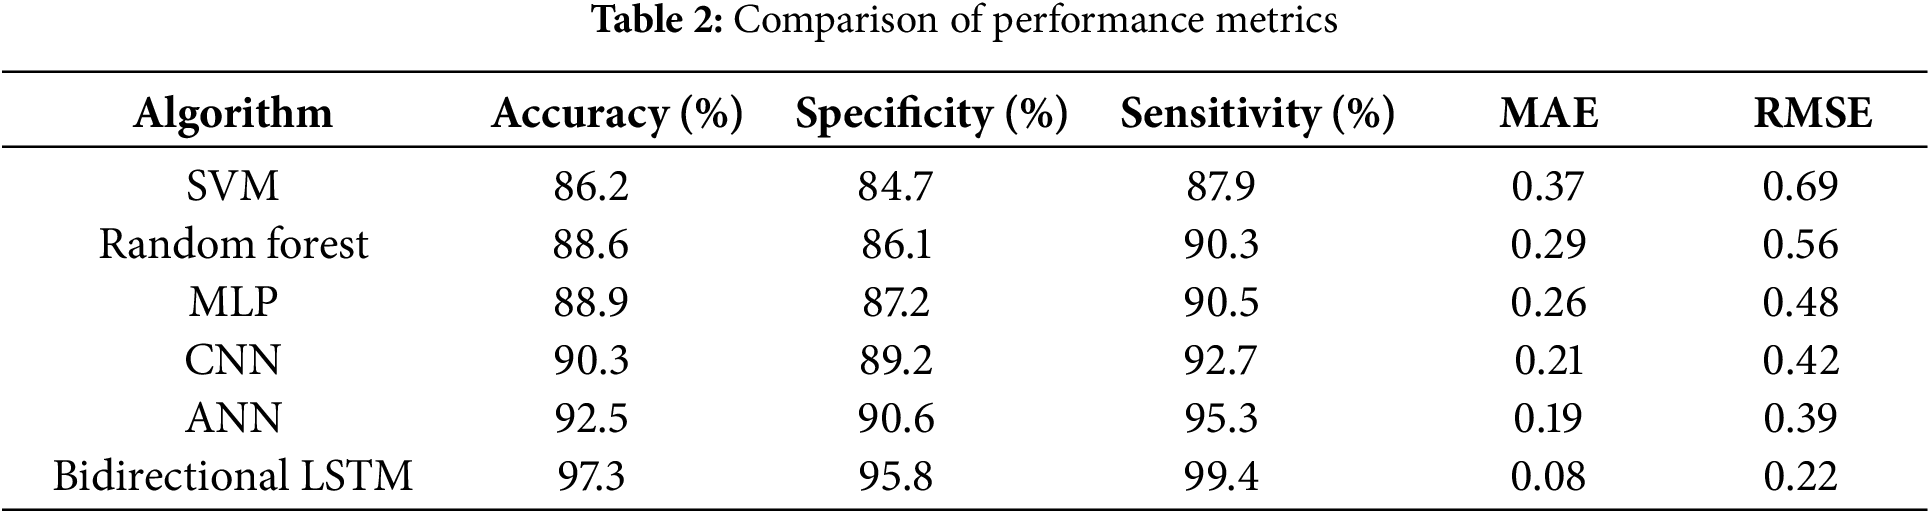
We have also made the comparison of the proposed model with existing state-of-art techniques, including SVM, Random Forest, MLP, ANN, and KNN, where the proposed model has outperformed all the other existing ones in terms of accuracy, specificity, sensitivity, reduction in MAE and, RMSE. The normalized value obtained was projected in Table 2 as given below:
The findings of this study underscore several critical aspects and practical applications that can drive energy management and policy improvements. The identification of peak and low energy usage times provides valuable insights for developing more efficient energy use strategies, leading to potential cost savings and reduced environmental impact. The study also demonstrates the predictive accuracy of the LSTM model, highlighting its promise for applications in smart grid management and demand-response systems. Furthermore, the insights gained could inform policymakers in designing targeted energy conservation programs and optimizing electricity grid operations. The observed non-normal distribution of power consumption indicates variability influenced by external factors, such as weather conditions and occupant behaviors, emphasizing the importance of developing robust and adaptive models capable of accommodating sudden changes in energy usage patterns. This variability has direct implications for energy forecasting models, as traditional models that assume normality may struggle to capture the full range of fluctuations. Consequently, specialized pre-processing techniques, such as outlier detection, transformation methods (e.g., log or Box-Cox transformation), or clustering approaches, may be necessary to model the underlying distribution better. These findings contribute to a deeper understanding of household electricity consumption and pave the way for more effective energy management solutions. These metrics underscore the model’s effectiveness in capturing the underlying patterns and dynamics of the time series data, albeit with room for improvement in reducing the error margins, especially in the training phase. While the study offers a comprehensive analysis of household electricity consumption, it has certain limitations that present opportunities for future research to enhance its scope and utility. One limitation is the simplicity of the modeling approach, as exploring more complex or hybrid models—such as ensemble methods or deep learning architectures—could significantly improve forecasting accuracy by better capturing intricate patterns in the data. Another area for improvement lies in feature expansion; integrating additional predictors like weather conditions, household occupancy data, and appliance-specific energy consumption could provide a more robust and granular understanding of electricity usage dynamics. Fig. 7 represents the actual vs predicted power for the data.

Figure 7: Actual vs. predicted global active power distribution chart
Computational efficiency and latency are critical considerations when using bi-directional LSTM (Bi-LSTM) for real-time power consumption analysis. Several strategies can be employed to reduce computational overhead in bidirectional LSTM models. One approach is to use a smaller hidden layer size or fewer LSTM layers, which directly reduces the number of parameters and computations. Pruning techniques can also be applied to remove redundant weights while maintaining model performance. Additionally, quantization—reducing the precision of model weights—can lower memory usage and speed up inference. While Bi-LSTMs excel at capturing temporal dependencies in sequential data, their bidirectional nature doubles the computational complexity compared to standard LSTMs, as both forward and backward passes must be processed before producing an output. This increased complexity leads to higher inference latency, making real-time deployment more challenging, especially in edge-computing environments with limited resources. The model’s efficiency depends on factors such as hardware acceleration (e.g., GPUs, TPUs), optimized implementations (e.g., TensorRT, ONNX), and sequence length truncation to minimize unnecessary computations. Techniques like quantization, pruning, and knowledge distillation can help reduce the model size and inference time without significantly sacrificing accuracy. Furthermore, real-time forecasting requires balancing model accuracy with speed, potentially integrating Bi-LSTM with lightweight models such as GRUs or attention mechanisms to improve responsiveness. Parallel processing and batch inference can also enhance throughput in high-frequency power monitoring applications [24]. Ultimately, optimizing Bi-LSTM for real-time scenarios requires careful consideration of trade-offs between computational demands and forecasting precision to ensure practical, low-latency deployment. Furthermore, the current model is not optimized for real-time forecasting, which significantly limits its practical applicability in critical scenarios such as dynamic pricing and load balancing in modern power systems. Real-time forecasting demands low-latency predictions with high accuracy to respond swiftly to fluctuations in energy demand and supply. However, the Bi-directional LSTM model, while effective in capturing complex temporal dependencies, introduces computational overhead due to its sequential nature and dual-direction processing, making it less suitable for real-time applications without further optimization. In dynamic pricing, energy rates fluctuate based on demand, requiring instant analysis and forecasting to adjust pricing structures accordingly, which the current model may struggle to achieve due to its inference time. Similarly, load balancing in smart grids relies on real-time predictions to distribute power efficiently, prevent overloads, and maintain grid stability, necessitating a forecasting model with minimal lag. To enhance real-time performance, techniques such as model quantization, pruning, hardware acceleration using GPUs or TPUs, and hybrid approaches that combine Bi-LSTM with faster models like GRUs or attention-based transformers should be explored. Additionally, optimizing data pipelines for streaming input rather than batch processing can further reduce latency, making the model more responsive and practical for real-time deployment in modern energy management systems. To enhance the generalizability of the Bi-directional LSTM model trained on the “Individual Household Electric Power Consumption” dataset to larger, more diverse datasets or different geographic locations, several key adaptations are necessary. First, incorporating additional datasets from various regions, climates, and socio-economic conditions will help the model learn broader consumption patterns beyond a single household or location. Data augmentation techniques, such as generating synthetic variations of power consumption patterns based on seasonality, appliance usage diversity, and grid reliability, can further enrich the training dataset. Transfer learning can also be leveraged by fine-tuning the pre-trained model on new datasets while retaining learned temporal dependencies. Developing a framework for real-time predictions could enable utilities and households to respond proactively to fluctuations in electricity demand, enhancing the efficiency and sustainability of energy systems. Addressing these limitations would not only improve the predictive power of the model but also broaden its applicability in real-world energy management and policy-making contexts. This research has demonstrated the value of advanced statistical and machine learning tools in understanding household electricity consumption. The insights gained not only contribute to the academic field of energy analytics but also have practical implications for energy management, policy-making, and sustainable practices. Future studies will likely build on these foundations, exploring more sophisticated models and broader datasets further to refine our understanding and management of energy consumption.
In this study, we analyzed over two million data points from a household electric power consumption dataset, spanning nearly four years to decode energy usage patterns and forecast future consumption using a Bidirectional Long Short-Term Memory (BLSTM) network. Our extensive data preprocessing, exploratory analysis, and feature engineering revealed key temporal influences on power usage across different scales—daily, weekly, and seasonal. The BLSTM model demonstrated strong forecasting capabilities with a Mean Absolute Error (MAE) of 0.083 and a Root Mean Squared Error (RMSE) of 0.221 on the test dataset, confirming its effectiveness in capturing complex consumption patterns. These findings are crucial for advancing smart grid technologies and optimizing demand-response systems, potentially reducing operational costs and enhancing grid stability. The predictive prowess of the BLSTM underscores the significant potential of machine learning in energy management, allowing for dynamic load management and facilitating the integration of renewable energy sources. To further improve forecasting performance, future research could explore hybrid architectures such as CNN-LSTM for automatic feature extraction, Transformer-LSTM models for enhanced sequential pattern recognition, and GRU-LSTM models for computational efficiency. Additionally, given the potential for real-time implementation, optimization techniques such as model pruning, quantization, and hardware acceleration (e.g., leveraging GPUs or TPUs) should be investigated to reduce computational overhead and enhance deployment efficiency. Furthermore, incorporating external variables such as fluctuating weather conditions and changes in occupant behavior could improve model adaptability. We also plan to validate our future models using diversified datasets to ensure generalizability and robustness in various energy consumption scenarios.
Acknowledgement: This research is supported by Princess Nourah bint Abdulrahman University Researchers Supporting Project number (PNURSP2025R195), Princess Nourah bint Abdulrahman University, Riyadh, Saudi Arabia. The authors extend their appreciation to the Deanship of Research and Graduate Studies at King Khalid University for funding this work through Large Group Project under grant number (RGP.2/245/46). The authors are thankful to the Deanship of Graduate Studies and Scientific Research at University of Bisha for supporting this work through the Fast-Track Research Support Program.
Funding Statement: This research is supported by Princess Nourah bint Abdulrahman University Researchers Supporting Project number (PNURSP2025R195), Princess Nourah bint Abdulrahman University, Riyadh, Saudi Arabia.
Author Contributions: The authors confirm their contribution to the paper as follows: study conception and design: Sheik Mohideen Shah and Meganathan Selvamani; data collection: Mahesh Thyluru Ramakrishna and Surbhi Bhatia Khan; analysis and interpretation of results; Shakila Basheer and Mahesh Thyluru Ramakrishna; draft manuscript preparation: Wajdan Al Malwi and Mohammad Tabrez Quasim. All authors reviewed the results and approved the final version of the manuscript.
Availability of Data and Materials: The datasets used or analysed during the current study available from the corresponding author upon request.
Ethics Approval: Not applicable.
Conflicts of Interest: The authors declare no conflicts of interest to report regarding the present study.
References
1. Bilgili M, Pinar E. Gross electricity consumption forecasting using LSTM and SARIMA approaches: a case study of Türkiye. Energy. 2023;284(1):128575. doi:10.1016/j.energy.2023.128575. [Google Scholar] [CrossRef]
2. Ghiasi M, Wang Z, Mehrandezh M, Jalilian S, Ghadimi N. Evolution of smart grids towards the Internet of energy: concept and essential components for deep decarbonisation. IET Smart Grid. 2023;6(1):86–102. doi:10.1049/stg2.12095. [Google Scholar] [CrossRef]
3. Petropoulos F, Apiletti D, Assimakopoulos V, Babai MZ, Barrow DK, Ben Taieb S, et al. Forecasting: theory and practice. Int J Forecast. 2022;38(3):705–871. doi:10.1016/j.ijforecast.2021.11.001. [Google Scholar] [CrossRef]
4. Ghazal TM. Energy demand forecasting using fused machine learning approaches. Intell Autom Soft Comput. 2022;31(1):539–53. doi:10.32604/iasc.2022.019658. [Google Scholar] [CrossRef]
5. Klyuev RV, Morgoev ID, Morgoeva AD, Gavrina OA, Martyushev NV, Efremenkov EA, et al. Methods of forecasting electric energy consumption: a literature review. Energies. 2022;15(23):8919. doi:10.3390/en15238919. [Google Scholar] [CrossRef]
6. Qiao W, Ma Q, Yang Y, Xi H, Huang N, Yang X, et al. Natural gas consumption forecasting using a novel two-stage model based on improved sparrow search algorithm. J Pipeline Sci Eng. 2025;5(1):100220. doi:10.1016/j.jpse.2024.100220. [Google Scholar] [CrossRef]
7. Wazirali R, Yaghoubi E, Abujazar MSS, Ahmad R, Vakili AH. State-of-the-art review on energy and load forecasting in microgrids using artificial neural networks, machine learning, and deep learning techniques. Elect Power Syst Res. 2023;225(6):109792. doi:10.1016/j.epsr.2023.109792. [Google Scholar] [CrossRef]
8. Farsi B, Amayri M, Bouguila N, Eicker U. On short-term load forecasting using machine learning techniques and a novel parallel deep LSTM-CNN approach. IEEE Access. 2021;9:31191–212. doi:10.1109/ACCESS.2021.3060290. [Google Scholar] [CrossRef]
9. Alizadegan H, Rashidi Malki B, Radmehr A, Karimi H, Ilani MA. Comparative study of long short-term memory (LSTMbidirectional LSTM, and traditional machine learning approaches for energy consumption prediction. Energy Explor Exploit. 2024;01445987241269496. doi:10.20944/preprints202405.1020.v1. [Google Scholar] [CrossRef]
10. Krishnamurthy S, Adewuyi OB, Luwaca E, Ratshitanga M, Moodley P. Artificial intelligence-based forecasting models for integrated energy system management planning: an exploration of the prospects for South Africa. Energy Convers Manag: X. 2024;24:100772. doi:10.1016/j.ecmx.2024.100772. [Google Scholar] [CrossRef]
11. Choi E, Cho S, Kim DK. Power demand forecasting using long short-term memory (LSTM) deep-learning model for monitoring energy sustainability. Sustainability. 2020;12(3):1109. doi:10.3390/su12031109. [Google Scholar] [CrossRef]
12. Ramesh G, Logeshwaran J, Kiruthiga T, Lloret J. Prediction of energy production level in large PV plants through AUTO-encoder based neural-network (AUTO-NN) with restricted boltzmann feature extraction. Fut Internet. 2023;15(2):46. doi:10.3390/fi15020046. [Google Scholar] [CrossRef]
13. Entezari A, Aslani A, Zahedi R, Noorollahi Y. Artificial intelligence and machine learning in energy systems: a bibliographic perspective. Energy Strategy Rev. 2023;45(8):101017. doi:10.1016/j.esr.2022.101017. [Google Scholar] [CrossRef]
14. Ounifi HA, Gherbi A, Kara N. Deep machine learning-based power usage effectiveness prediction for sustainable cloud infrastructures. Sustain Energy Technol Assess. 2022;52(7):101967. doi:10.1016/j.seta.2022.101967. [Google Scholar] [CrossRef]
15. Ma H, Ding A. Method for evaluation on energy consumption of cloud computing data center based on deep reinforcement learning. Elect Power Syst Res. 2022;208(4):107899. doi:10.1016/j.epsr.2022.107899. [Google Scholar] [CrossRef]
16. Himeur Y, Elnour M, Fadli F, Meskin N, Petri I, Rezgui Y, et al. AI-big data analytics for building automation and management systems: a survey, actual challenges and future perspectives. Artif Intell Rev. 2023;56(6):4929–5021. doi:10.1007/s10462-022-10286-2. [Google Scholar] [PubMed] [CrossRef]
17. Almihat MGM, Kahn MTE, Aboalez K, Almaktoof AM. Energy and sustainable development in smart cities: an overview. Smart Cities. 2022;5(4):1389–408. doi:10.3390/smartcities5040071. [Google Scholar] [CrossRef]
18. Zhang Z, Chen Z, Zhao Q, Wang Y, Tian J. Situation awareness and sensitivity analysis for absorption of grid-connected renewable energy power generation integrating robust optimization and radial basis function neural network. J Mod Power Syst Clean Energy. 2023;11(6):1795–803. doi:10.35833/MPCE.2022.000683. [Google Scholar] [CrossRef]
19. Liu Y, Dutta S, Kong AW, Yeo CK. An image inpainting approach to short-term load forecasting. IEEE Trans Power Syst. 2022;38(1):177–87. doi:10.1109/TPWRS.2022.3159493. [Google Scholar] [CrossRef]
20. Zhou Y, Wang R, Li H, Kung SY. Temporal action localization using long short-term dependency. IEEE Trans Multimedia. 2020;23:4363–75. doi:10.1109/TMM.2020.3042077. [Google Scholar] [CrossRef]
21. Hu S, Zhang T, Yang F, Gao Z, Ge Y, Zhang Q, et al. Short-term load forecasting based on mutual information and BI-LSTM considering fluctuation in importance values of features. IEEE Access. 2023;11:176211–25. [Google Scholar]
22. Li C, Dong Z, Ding L, Petersen H, Qiu Z, Chen G, et al. Interpretable memristive LSTM network design for probabilistic residential load forecasting. IEEE Trans Circuits Syst I: Reg Papers. 2022;69(6):2297–2310. doi:10.1109/TCSI.2022.3155443. [Google Scholar] [CrossRef]
23. Fan GF, Han YY, Li JW, Peng LL, Yeh YH, Hong WC. A hybrid model for deep learning short-term power load forecasting based on feature extraction statistics techniques. Expert Syst Appl. 2024;238:122012. doi:10.1016/j.eswa.2023.122012. [Google Scholar] [CrossRef]
24. Rubasinghe O, Zhang X, Chau TK, Chow Y, Fernando T, Iu HH. A novel sequence to sequence data modelling based CNN-LSTM algorithm for three years ahead monthly peak load forecasting. IEEE Trans Power Syst. 2024;39(1):1932–47. doi:10.1109/TPWRS.2023.3271325. [Google Scholar] [CrossRef]
Cite This Article
 Copyright © 2025 The Author(s). Published by Tech Science Press.
This work is licensed under a Creative Commons Attribution 4.0 International License , which permits unrestricted use, distribution, and reproduction in any medium, provided the original work is properly cited.
 Downloads
 Citation Tools