
 Submit a Paper
 Propose a Special lssue
 Open Access
ARTICLE

CloudViT: A Lightweight Ground-Based Cloud Image Classification Model with the Ability to Capture Global Features
1 National Key Laboratory of Intelligent Spatial Information, Beijing, 100029, China
2 School of Artificial Intelligence, Neijiang Normal University, Neijiang, 641100, China
3 CMA Cloud-Precipitation Physics and Weather Modification Key Laboratory, Beijing, 100081, China
4 Gansu Weather Modification Office, Lanzhou, 730020, China
5 School of Computer Science, Chengdu University of Information Technology, Chengdu, 610225, China
6 Department of Epidemiology and Biostatistics, School of Public Health, University at Albany, State University of New York, New York, NY 12144, USA
* Corresponding Authors: Dequan Li. Email: ; Jinrong Hu. Email:
Computers, Materials & Continua 2025, 83(3), 5729-5746. https://doi.org/10.32604/cmc.2025.061402
Received 23 November 2024; Accepted 20 March 2025; Issue published 19 May 2025
 View Full Text
 Download PDF
Abstract
Accurate cloud classification plays a crucial role in aviation safety, climate monitoring, and localized weather forecasting. Current research has been focusing on machine learning techniques, particularly deep learning based model, for the types identification. However, traditional approaches such as convolutional neural networks (CNNs) encounter difficulties in capturing global contextual information. In addition, they are computationally expensive, which restricts their usability in resource-limited environments. To tackle these issues, we present the Cloud Vision Transformer (CloudViT), a lightweight model that integrates CNNs with Transformers. The integration enables an effective balance between local and global feature extraction. To be specific, CloudViT comprises two innovative modules: Feature Extraction (E_Module) and Downsampling (D_Module). These modules are able to significantly reduce the number of model parameters and computational complexity while maintaining translation invariance and enhancing contextual comprehension. Overall, the CloudViT includes 0.93 × 10⁶ parameters, which decreases more than ten times compared to the SOTA (State-of-the-Art) model CloudNet. Comprehensive evaluations conducted on the HBMCD and SWIMCAT datasets showcase the outstanding performance of CloudViT. It achieves classification accuracies of 98.45% and 100%, respectively. Moreover, the efficiency and scalability of CloudViT make it an ideal candidate for deployment in mobile cloud observation systems, enabling real-time cloud image classification. The proposed hybrid architecture of CloudViT offers a promising approach for advancing ground-based cloud image classification. It holds significant potential for both optimizing performance and facilitating practical deployment scenarios.Keywords
Clouds, which are visible aggregates of minute water droplets or ice particles in the atmosphere, play a vital role in the hydrological cycle, climate change, aviation meteorology, and radiation budgets by modifying shortwave and longwave radiation [1]. Different cloud types are closely associated with specific weather patterns, and their distribution and frequency offer critical insights into diverse climatic conditions [2,3]. In the aviation industry, clouds are a significant cause of turbulence, often surpassing clear-air turbulence in severity. Air passengers often encounter bumpy flights when flying into cumulus clouds (Cu). Moreover, when the cloud’s temperature drops below that of its surrounding environment, a density contrast is created, forming a sort of “pothole” in the sky that endangers the smoothness of flights. Particularly, cumulonimbus clouds (Cb) are linked to severe weather conditions such as heavy rain, lightning, hail, strong winds, and occasionally tornadoes, presenting serious challenges for pilots and air traffic controllers. Therefore, the accurate classification of clouds is essential for understanding cloud dynamics and enhancing aviation safety [4].
According to ground observation standards stipulated by the World Meteorological Organization (WMO) [5], clouds are classified into three primary categories: high, middle, and low clouds. This categorization is based on features such as cloud base height, shape, structure, and other relevant properties. The high cloud group is further divided into cirrus (Ci), cirrostratus (Cs), and cirrocumulus (Cc). The middle cloud group is composed of altostratus (As) and altocumulus (Ac). The low cloud group includes cumulus (Cu), cumulonimbus (Cb), stratocumulus (Sc), stratus (St), and nimbostratus (Ns). Additionally, the ten aforementioned types can be further subdivided, resulting in a total of 29 cloud categories. These 29 classifications provide a detailed framework for cloud identification, which is essential for precise meteorological studies. In this work, we primarily utilize the 11 cloud classes provided by the Huayun BJUT-MIP cloud dataset (HBMCD), which include the 10 primary cloud genera recommended by the WMO and an additional “No Cloud” category. This selection ensures a comprehensive and balanced dataset for our model training and evaluation.
Despite advancements in cloud observation technology, several challenges persist in achieving accurate cloud classification, especially using ground-based cloud imagery. While effective, traditional manual classification methods are time-consuming and heavily reliant on expert knowledge, making them impractical for real-time applications. Automated methods based on satellite and ground-based cloud imagery have gained prominence; however, satellite imagery, while offering large-scale observations, often lacks the resolution necessary for capturing localized weather phenomena [6]. Ground-based cloud imagery, by contrast, provides higher resolution and localized details, but its practical application is constrained by limited computational resources, slow inference speeds, and suboptimal accuracy in existing methods.
Traditional deep learning approaches, such as convolutional neural networks (CNNs), are limited by their fixed receptive fields, which hinder the extraction of global contextual information crucial for cloud classification. Furthermore, the high computational complexity and large number of parameters in these models pose challenges for deployment in resource-constrained environments, such as mobile cloud gauges. These limitations highlight the need for a more efficient and accurate model that can balance local feature extraction and global contextual understanding. To address these challenges, this paper introduces the Cloud Vision Transformer (CloudViT) model, a hybrid architecture that integrates CNNs and Transformers to overcome the shortcomings of existing methods. The CloudViT model combines the local feature extraction capabilities of CNNs with the global attention mechanisms of Transformers, ensuring efficient and accurate cloud classification. Additionally, the model incorporates two innovative lightweight modules: the Feature Extraction Module (E_Module) and the Downsampling Module (D_Module). These modules reduce model parameters and computational requirements while preserving translation invariance, local correlation, and global contextual information. This enables the model to extract refined features from diverse cloud imagery and achieve high classification performance. The overall algorithmic flow of CloudViT is illustrated in Fig. 1. The modular design ensures that each component contributes to the balance of computational efficiency and feature extraction capability. The main contributions of this paper are as follows: (1) Introducing a Transformer framework for ground-based cloud image classification to address the limited receptive field of CNNs while ensuring computational efficiency and global contextual awareness; (2) Proposing novel lightweight modules, E_Module and D_Module, which effectively balance computational cost and feature extraction capabilities, enabling the model to process diverse cloud types efficiently.
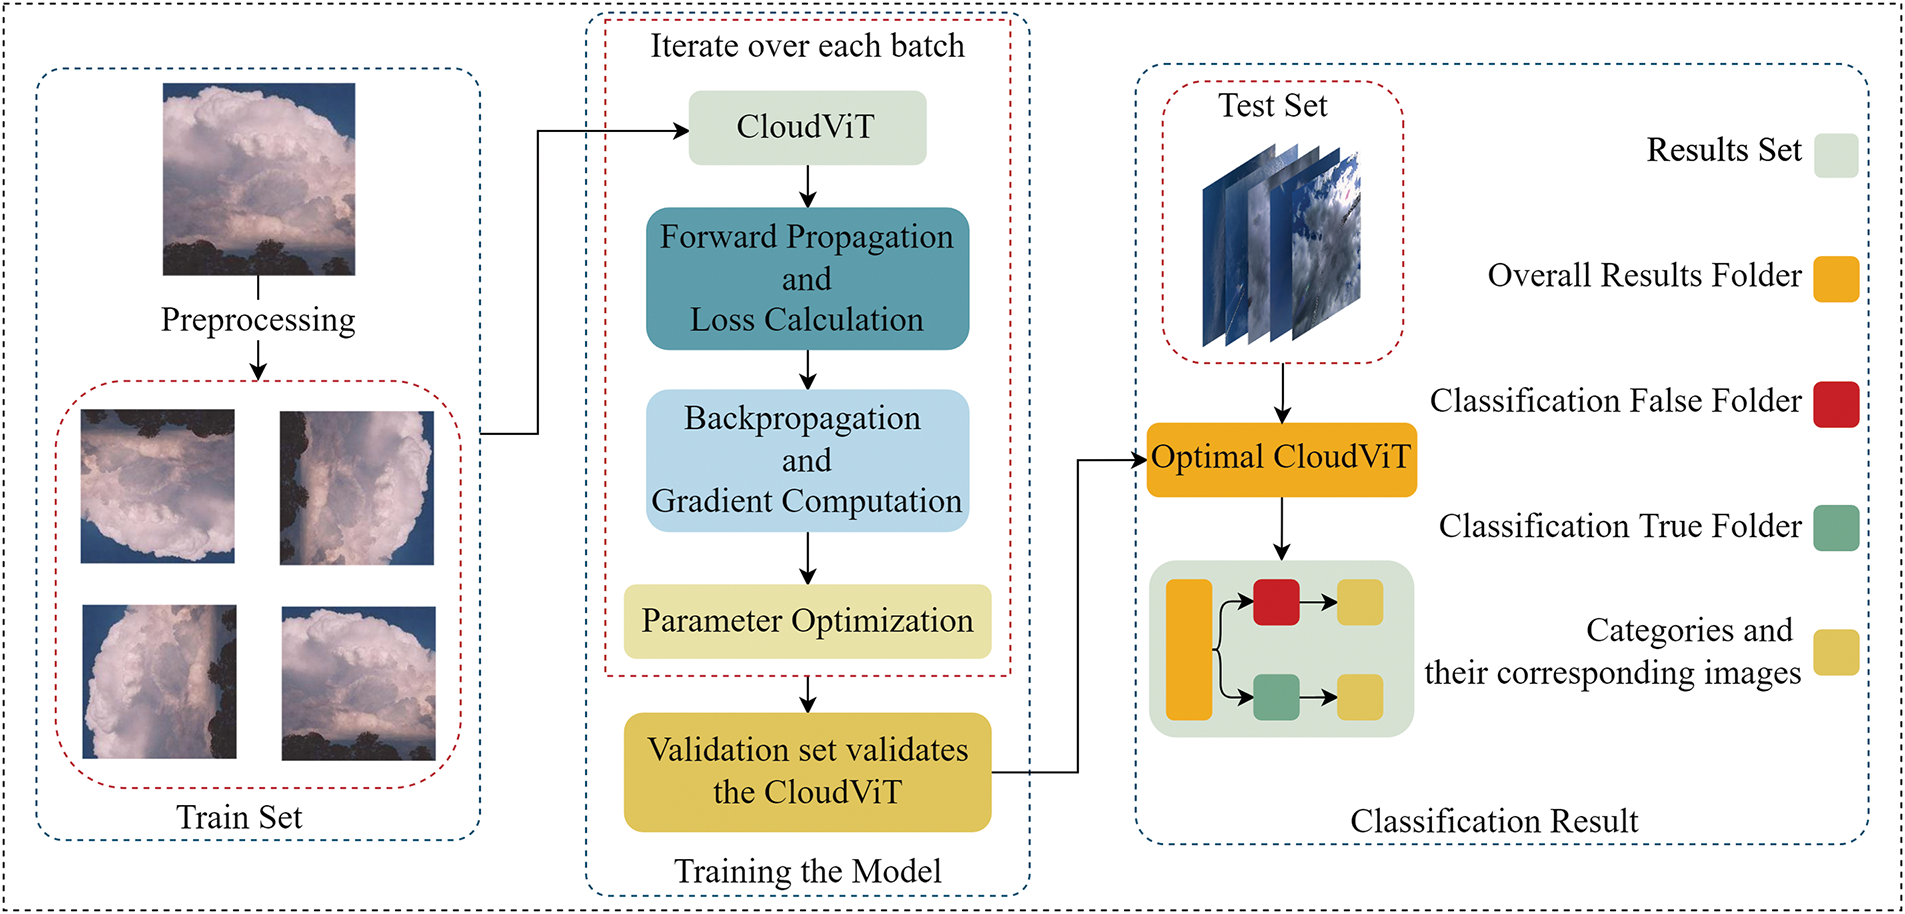
Figure 1: Overall framework diagram of the proposed method
This paper is structured as follows: Section 1 provides the introduction, describing the background and significance of the study. Section 2 reviews the current research status of ground-based cloud image classification. Section 3 presents the methodology, detailing the CloudViT model and its constituent modules. Section 4 describes the experimental setup and analyzes the results. Section 5 summarizes the findings and outlines future research directions.
2.1 Existing Methods and Limitations
In the past few decades, research on the classification of ground-based cloud images can be broadly categorized into two domains on the basis of the ways features are extracted: manual classification and automatic classification. Two approaches in manual classification have been explored: one involves experienced experts utilizing their knowledge to determine cloud types, characteristics, and boundaries, manually labeling distinct regions of clouds; the other approach employs machine learning methods based on traditional features for classifying clouds, using manually extracted features. Automatic classification employs multi-layer neural networks to learn intricate features from complex cloud images and then classify them based on these learned features.
In recent years, manual classification methods have primarily focused on machine learning approaches based on traditional features. For instance, Heinle et al. [7] used predefined statistical features to describe cloud spectral and simple texture information and employed a k-nearest neighbor classifier to classify seven types of clouds on the basis of ground-based observations. Liu et al. [8] also extracted multi-structural features of clouds, such as mean cloud gray value and edge sharpness, from segmented and edge images of infrared sky images, and then used a matrix-based supervised classifier for classification. Liu et al. [8] introduced an illumination invariant completed local ternary pattern descriptor to handle lighting variations for cloud classification. Dev et al. [9] proposed an improved text-based approach that integrates color and texture information. Wang et al. [10] developed a robust feature extraction method using stable local binary patterns. These traditional feature-based classification methods achieved partial automation in cloud image classification compared to manual expert-based classification. However, these methods require adjusting the feature extractors based on specific scenarios. Many of these methods consist of multiple preprocessing stages and utilize various predefined fixed thresholds during feature extraction. They heavily rely on meticulous feature selection and empirical parameters during classification, thus normally lacking comprehensive automation in cloud feature extraction. Moreover, the general applicability and accuracy of these methods are limited, making them hard to apply in practical scenarios.
The emergence of automated ground-based cloud image classification methods originated from the advancement of deep learning, particularly, the remarkable performance of CNN in image classification [11,12]. The capability of CNN models to extract features directly from image data, without the need for additional traditional feature extraction, has led to their widespread application in ground-based cloud image classification. For example, Zhang et al. [13] introduced a CNN model evolved from AlexNet, which can effectively classify ten cloud genus and one contrail class from ground-based cloud images using CNNs. Phung et al. [14] designed suitable CNN models for small datasets and employed regularization techniques to enhance model universality as well as avoid overfitting. Manzo et al. [15] utilized transfer learning and a voting mechanism for cloud image classification. Zhang et al. [16] proposed LCCNet, a lightweight CNN model with a lower parameter count and computational complexity compared to existing network models. Mesut et al. [17] used super-resolution and semantic segmentation to preprocess image data, employed the lightweight classification network ShuffleNet to create ground-based cloud image feature sets, and utilized binary fish optimization for effective feature selection, followed by linear discriminant analysis for classification.
The aforementioned deep learning-based methods for ground-based cloud image classification will verify the capacity to automatically extract image features. Compared to expert-based manual classification and handcrafted feature extractor methods, these approaches offer greater universality, faster inference speeds, and higher accuracy. However, current deep learning methods still face problems such as large model parameter counts, poor global feature extraction capability, non-end-to-end classification methodologies that lead to slower overall processing speeds, and difficulties integrating classification models on mobile devices in real-world applications.
Cloud classification methods using deep learning are more accurate than manual classification and feature extraction techniques. However, these methods have two major limitations. Firstly, they do not consider the effectiveness of classification and model weight simultaneously. Secondly, they ignore ground-based cloud map samples with significant intra-class variations and minor inter-class differences. In addition, most classification methods are composed of pure CNNs, but the limited receptive field of CNNs makes it difficult to capture global features [18]. To solve this problem, several solutions have been proposed [19], such as Atrous convolution [20], enlarged kernel sizes [21], pyramid pooling [22], and non-local operations [23]. Though these methods can alleviate the problem to a certain extent, they do not fully solve it.
In contrast to CNNs, the self-attention mechanism used by Transformers can extract global and long-range dependencies perfectly [24]. However, it cannot ensure local correlations and translation invariance when capturing features. Therefore, adopting a hybrid network that combines both approaches can effectively overcome the limitations of existing deep learning-based ground-based cloud map classification models.
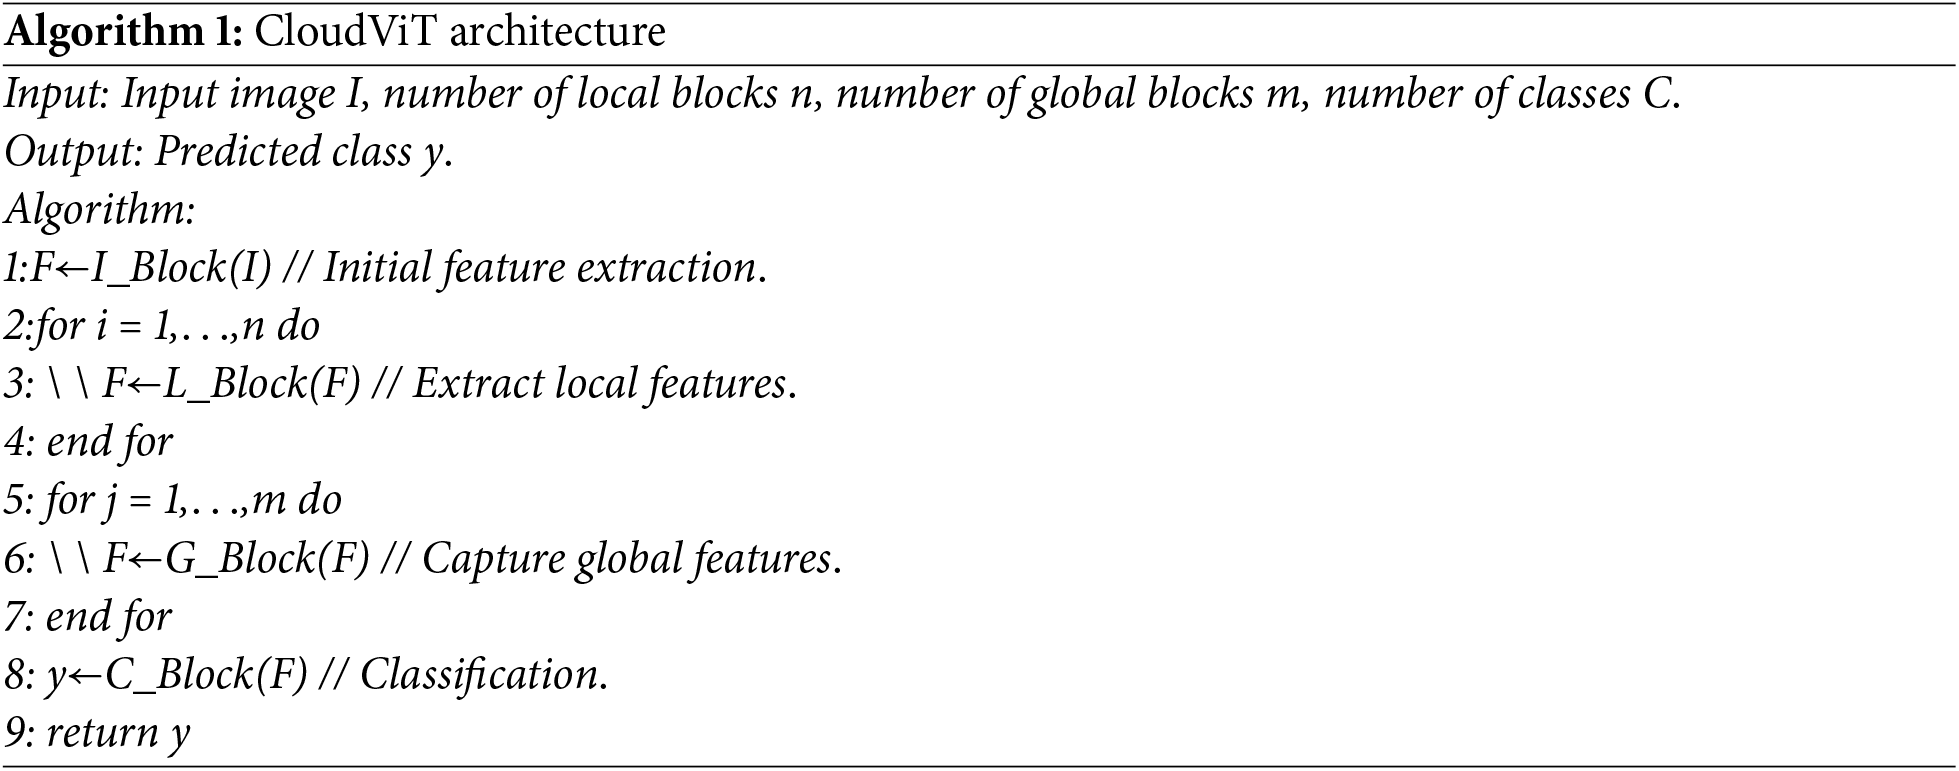
Inspired by the MobileVitv1 [25] and MobileVitv2 [26] models, the CloudViT model comprises of four blocks: Initial Feature Extraction Block (I_Block), Local Feature Extraction Block (L_Block), Global Feature Extraction Block (G_Block), and Classifier Block (C_Block). The main components of this model are shown in Fig. 2. The initial feature extraction block consists of traditional convolution, Sigmoid-weighted linear units (SiLU) [27], and batch normalization (BN), while L_Block and G_Block consist of D_Module, E_Module, and global feature extraction module (G_Module). C_Block mainly includes global average pooling and fully connected layers. The general algorithm flow of the CloudViT model is as follows (Algorithm 1):
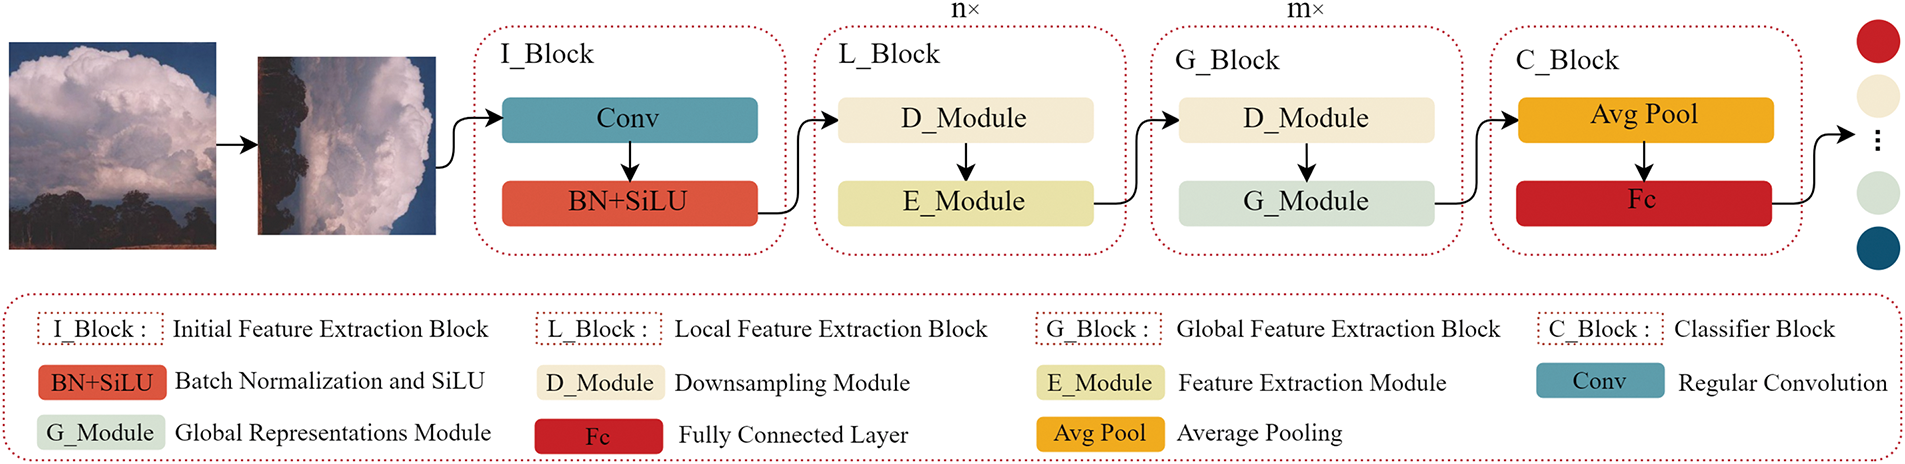
Figure 2: The overall structure of CloudViT model. It mainly includes the Initial Feature Extraction Block (I_Block), the Local Feature Extraction Block (L_Block), the Global Feature Extraction Block (G_Block), and the Classifier Block (C_Block)
The main difference between our method and MobileViTs is the E_Module and D_Module in L_Block and G_Block. Both of these modules adopt a dual branch structure, and the E_Module incorporates channel split technology, feature reuse technology, channel attention mechanism, and ideas similar to residual connections. To achieve downsampling operations, the D_Module utilizes channel shuffle technology, channel attention mechanism, and depthwise separable convolution. To enhance the model’s ability to balance local details and global features when processing images and achieving multi-level feature learning, our method adopts a combination of CNN and Transformer. When processing images, the Initial Feature Extraction Block first extracts the basic abstract features of the image, such as edges, textures, etc. Subsequently, the image undergoes n-layer of L_Block to learn the local details of the image. On this basis, the image enters the m-layer G_Block to integrate global information, enabling the model to understand the correlations and contexts between different parts of the image. Finally, the extracted features are classified using the C_Block. The entire process fully utilizes the advantages of CNN and Transformer, achieving hierarchical feature learning, effectively capturing and integrating images’ local and global features, and improving the classification performance of the model.
Recent studies [28] have shown that using a step size of 2 for downsampling achieves comparable results to pooling layers and even performs better in larger network sizes. Therefore, in our work, E_Module and D_Module adopt depthwise separable convolution, which consists of two parts: feature extraction and pointwise convolution. In the stage of feature extraction, the deep convolution achieves independent and abundant spatial features by convolving data channels separately. In the stage of pointwise convolution, the output of a convolution is calculated by applying a convolution kernel with a size of 1 × 1. When performing downsampling operations, we set the step size to 2 during the pointwise convolution stage. The step size with smaller value can extract more local and elaborate features in the stage of the deep convolution operation. In addition, to address the potential gradient explosion problem caused by network depth, the BN technology is introduced in our model after each convolution operation. In parallel, the SiLU activation function is uniformly used in the proposed model, which can effectively avoid the “inactive neurons” problem because of its smoothness and approximation.
As shown in Fig. 3, the lightweight channel attention mechanism is used in our CloudViT model. It not only can extract global contextual feature information but also can attain local feature information in the cloud map. At last, the lightweight structure design of CloudViT can meet the computing requirement in resource-limited environments, for example, the mobile device of ground-based cloud gauge.
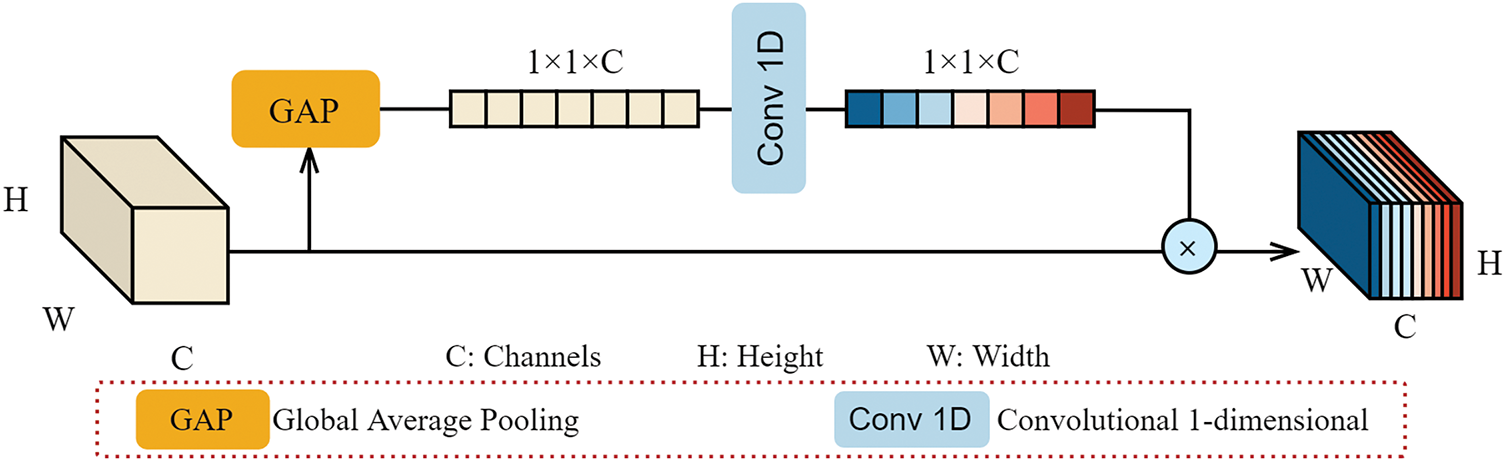
Figure 3: The structure of the lightweight channel attention
Based on what is mentioned above, the D_Module’s structure is shown in Fig. 4a. The input feature map is divided into two branches, which are calculated according to the Eqs. (1) and (2), respectively. Then, this feature information is fed into the lightweight channel attention mechanism module. This process can not only reduce the interference of redundant features and noise but also enhance relevant feature information. Finally, the feature information of the two branches is concatenated to generate a multi-scale feature map, which improves the model’s feature representation ability by integrating the multi-scale information.
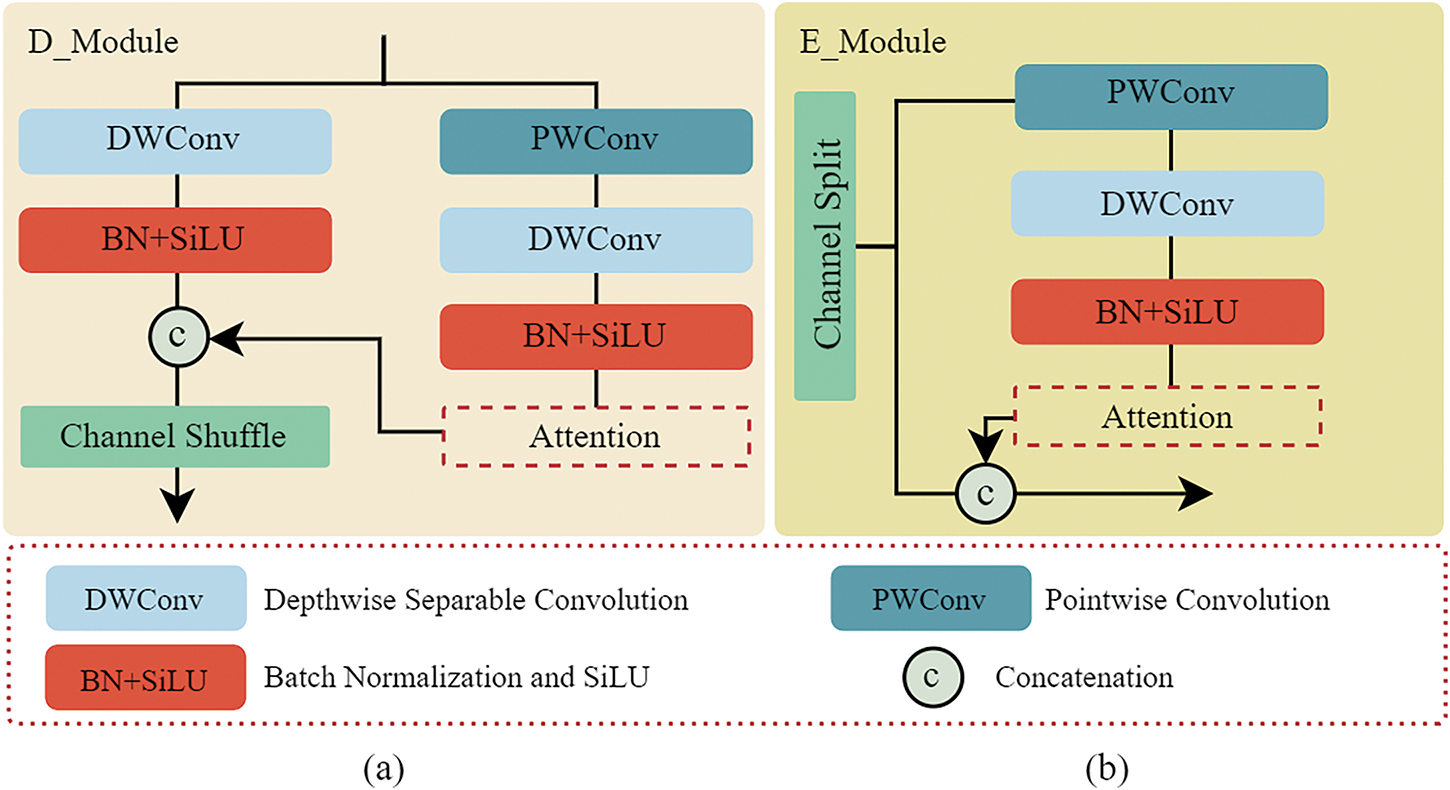
Figure 4: The structure of the (a) D_Module and (b) E_Module
In Eq. (3), the shuffle denotes channel blending, Ifeature denotes input features, and contact denotes splicing operation on two sets of feature maps in channel dimension.
The E_Module can be seen in Fig. 4b. The input feature map is divided into two branches along the channel dimension. Short skip connection is used in the first branch to merge the input feature map directly with the output feature map of the second branch, which is similar to residual connections and combines the local and global feature information of the cloud picture. The shot skip connection helps to enhance the ability of feature representation and alleviate gradient issues for CloudVit. Specifically, the E_Module is calculated by the Eqs. (4) and (5) as follows:
The structure of G_module is shown in Fig. 5. Firstly, the depthwise separable convolution is used in this module to incorporate the features from the last layer. Secondly, the separable self-attention mechanism is used to compensate for spatial feature maps with missing information. The separable self-attention mechanism is calculated by the Eqs. (6)–(8) as follows:
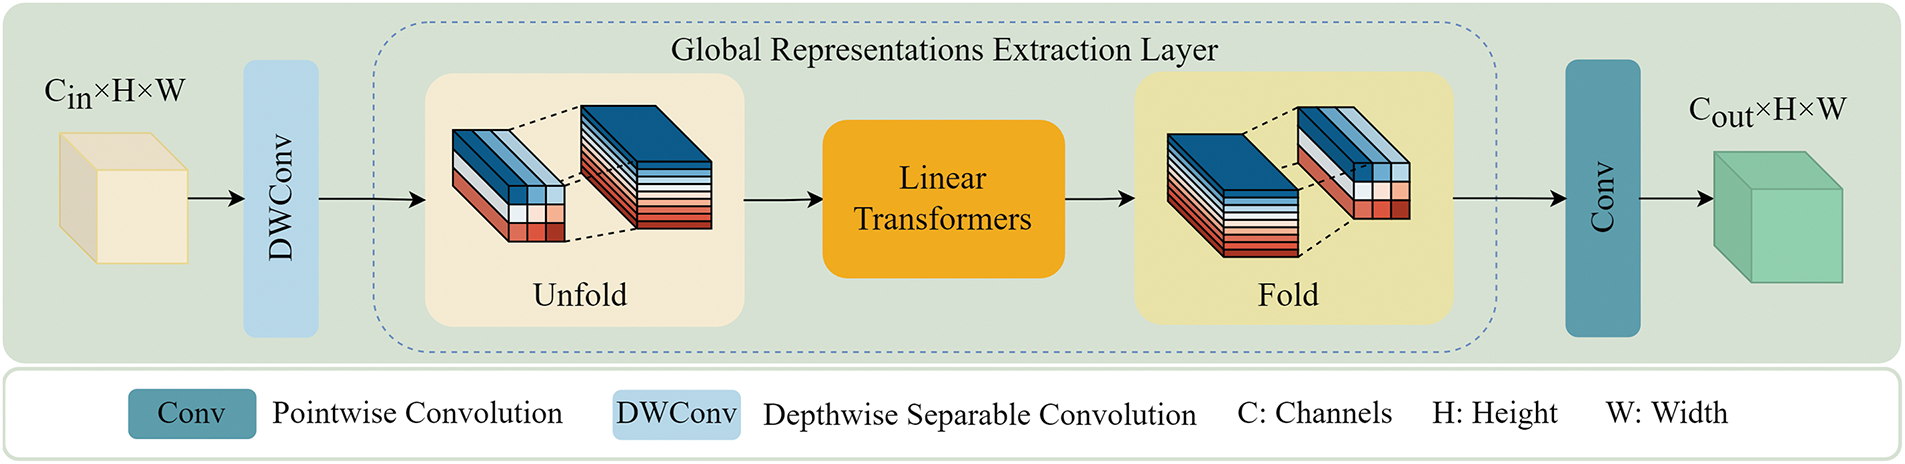
Figure 5: The structure of G_Module
In Eqs. (6)–(8), k represents the k-dimensional vector of the distance between the latent marker L and input x, Cs is the context score of the k-dimensional vector, WI, Wk, Wv, and Wo represent the input weight, key weight, value weight and output weight, respectively. xk represents the output of input x linearly projected onto d-dimensional space using the key branch K with weight WK, and Cv represents the context vector obtained by calculating the weighted sum of Cs and xk.
4 Experimental Setup and Result Analysis
The Huayun BJUT-MIP cloud dataset (HBMCD) is currently the largest ground-based cloud image dataset, which was captured by the whole-sky imager made by Huayun Shengda Meteorological Technology Co. Ltd. (Beijing, China). The HBMCD dataset contains 25,118 cloud images and is categorized into 11 cloud classes including 10 cloud genera categories recommended by WMO and an additional “No Cloud” (No) category. The 10 cloud genera classes are Ac, As, Cb, Cc, Ci, Cs, Cu, Ns, Sc, and St, respectively. All the cloud images were labeled by experts [16]. It is important to note that while the WMO recommends a more detailed classification system that includes 29 subclasses, our study focuses on the primary cloud genera categories. This decision is based on the comprehensive nature of these primary categories, which provide a robust framework for understanding major cloud types and their associated weather patterns. Additionally, the dataset used in this study was labeled by experts based on these primary cloud genera categories, ensuring the accuracy and reliability of the labels. Subsets of samples for each class from this dataset are depicted in Fig. 6.
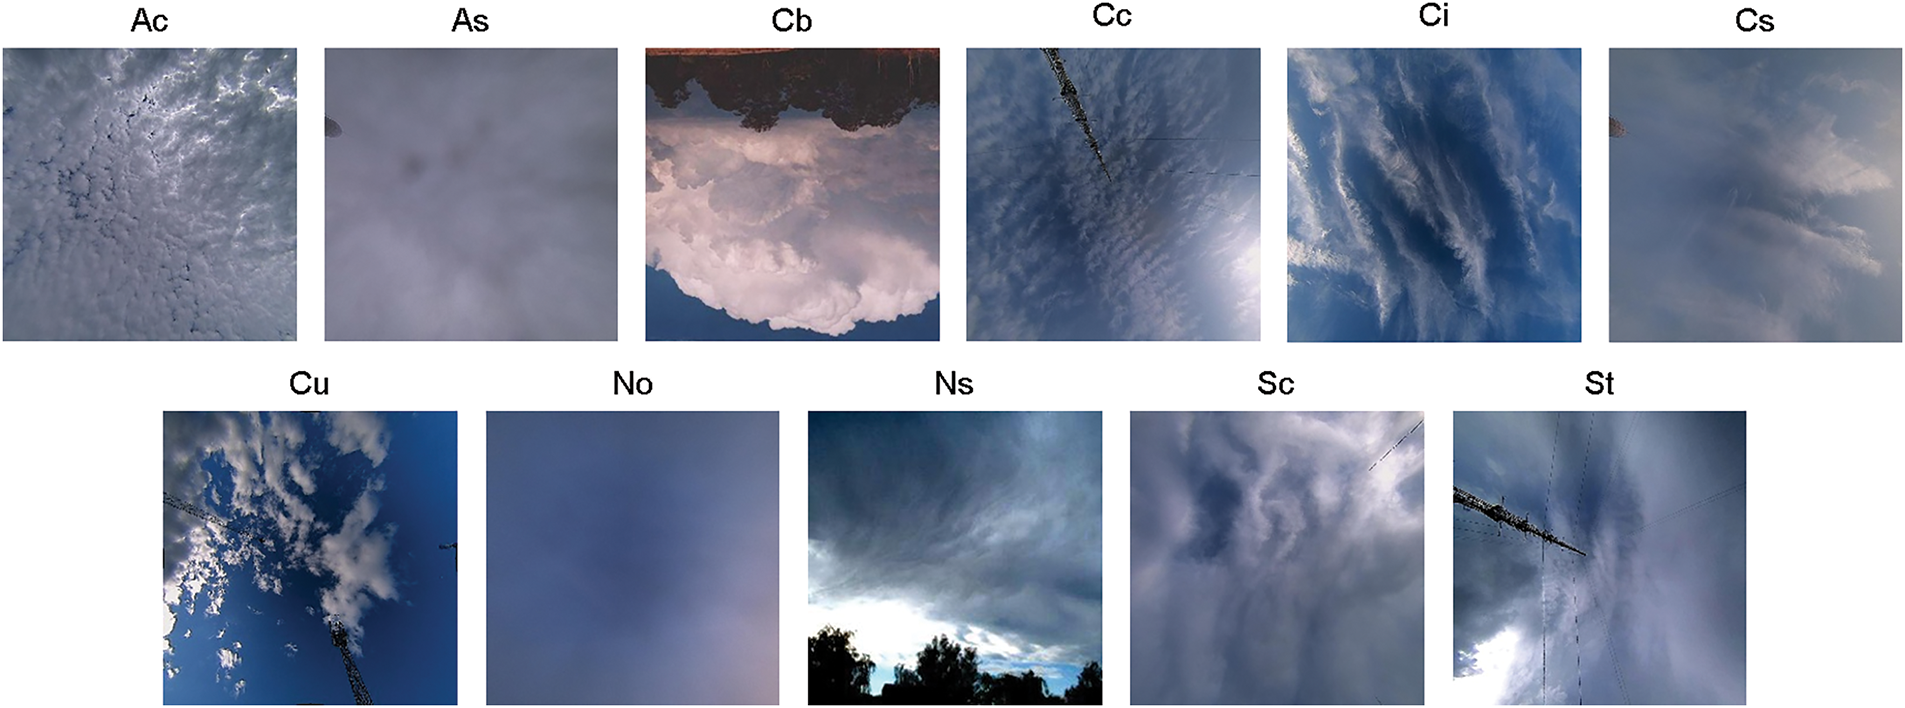
Figure 6: Samples of 11 cloud types in HBMCD dataset
In these experiments, we divided the HBMCD dataset into training, validation, and test sets in a random manner using an 8:1:1 ratio. The specific data distribution of the divided HBMCD dataset is illustrated in Fig. 7. It is evident from the figure that the No class has the highest data volume, while the Ns class has the lowest data volume, approximately one-third of the No class.
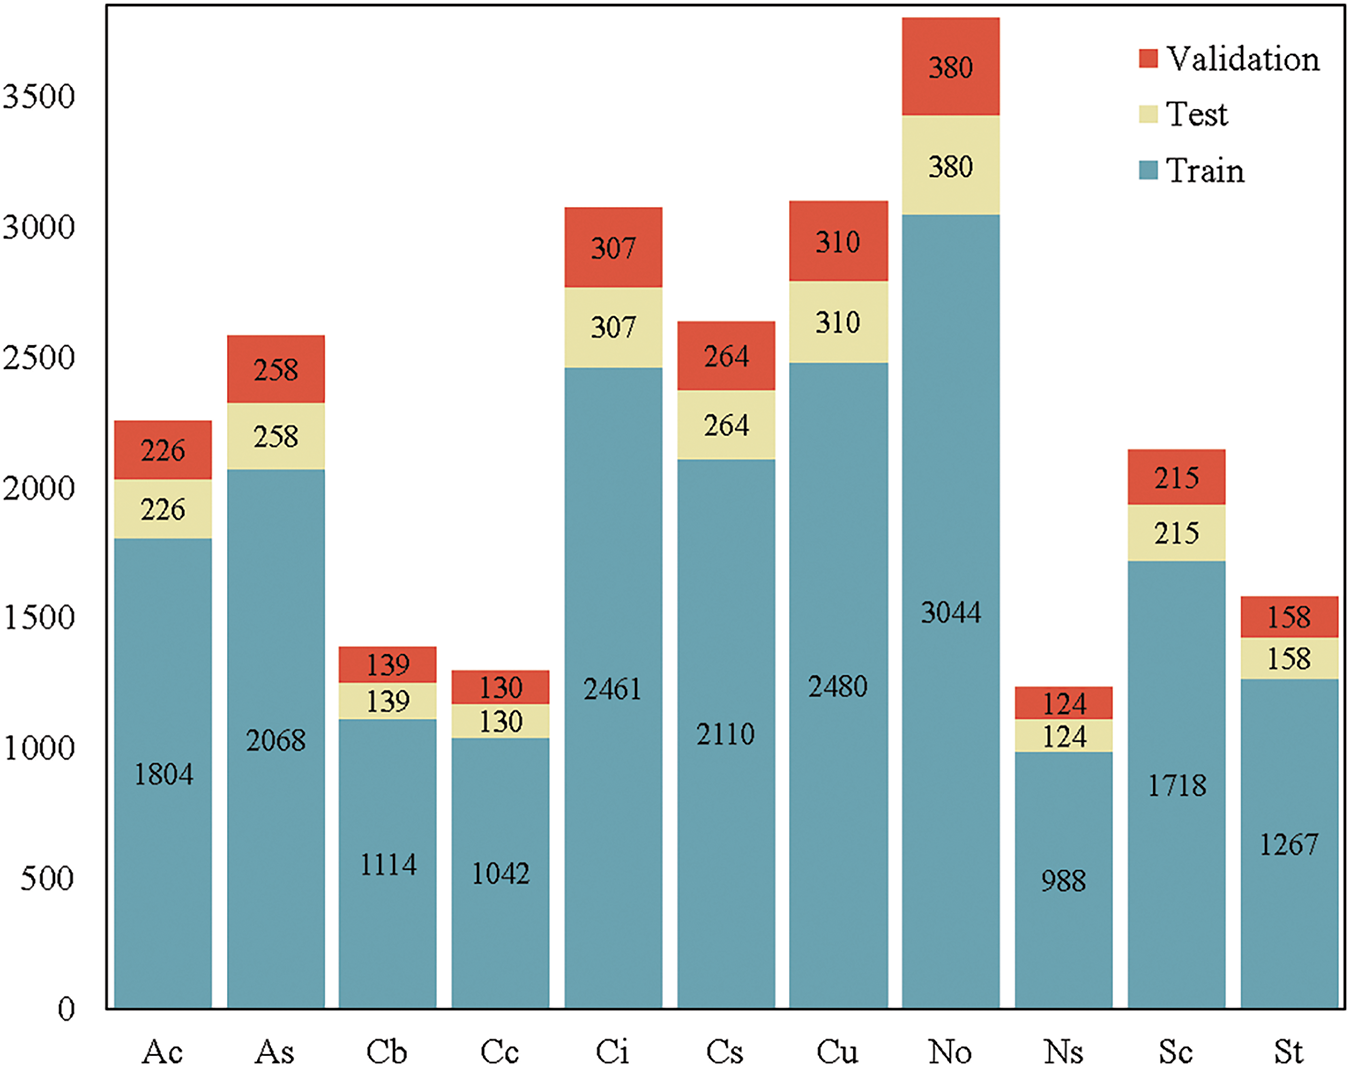
Figure 7: Distribution of the HBMCD dataset
In addition to the HBMCD, the Singapore Whole-sky IMaging CATegories Database (SWIMCAT) is one of the most widely used datasets for ground-based cloud image classification tasks. Introduced by Dev et al. [9], it consists of a total of 748 sky/cloud patch images, with each image having a resolution of 125 × 125 pixels. These images are categorized into five classes: clear sky, patterned clouds, thick dark clouds, thick white clouds, and veil clouds. Subset samples for each class from this dataset are illustrated in Fig. 8.
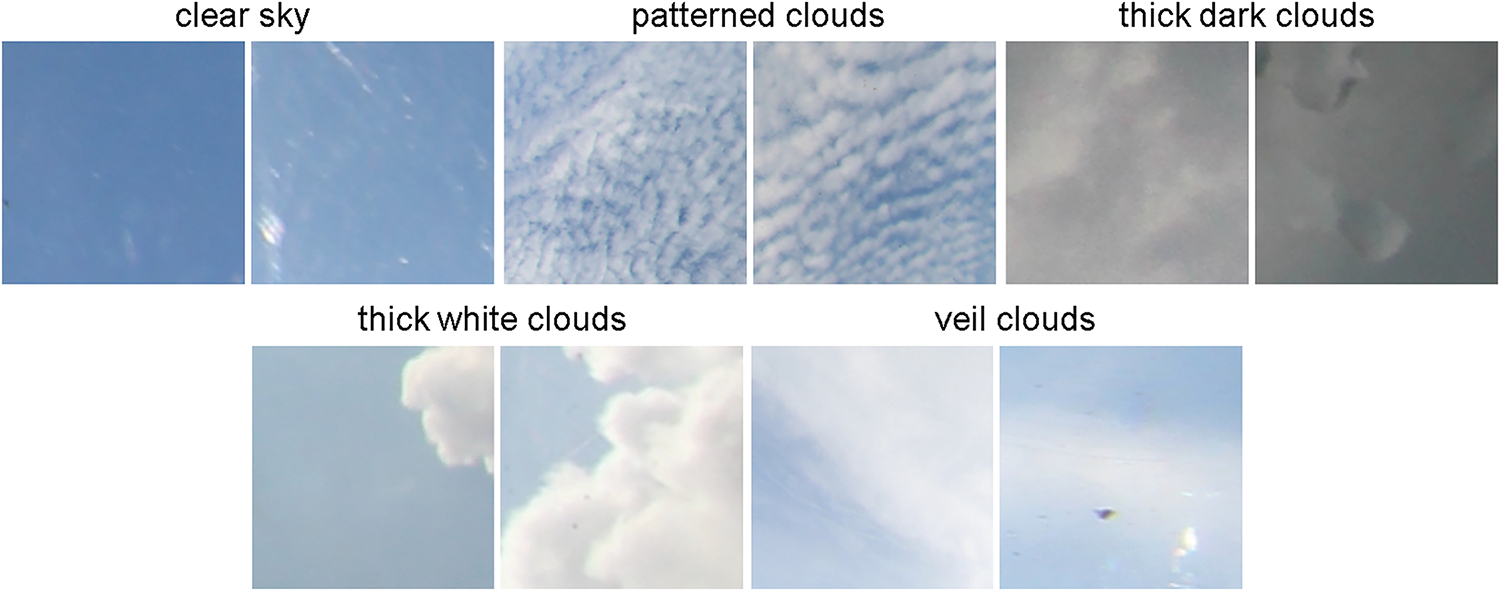
Figure 8: Sample of 5 cloud types in the SWIMACT dataset
Unlike the HBMCD, the SWIMCAT currently has the smallest number of ground-based cloud images available. Therefore, using this dataset can demonstrate the applicability of the proposed model for cloud image classification tasks with a small sample size. In these experiments, the partition strategy for the SWIMCAT aligns with that of the HBMCD dataset. The specific data distribution of the divided SWIMCAT dataset is illustrated in Fig. 9.
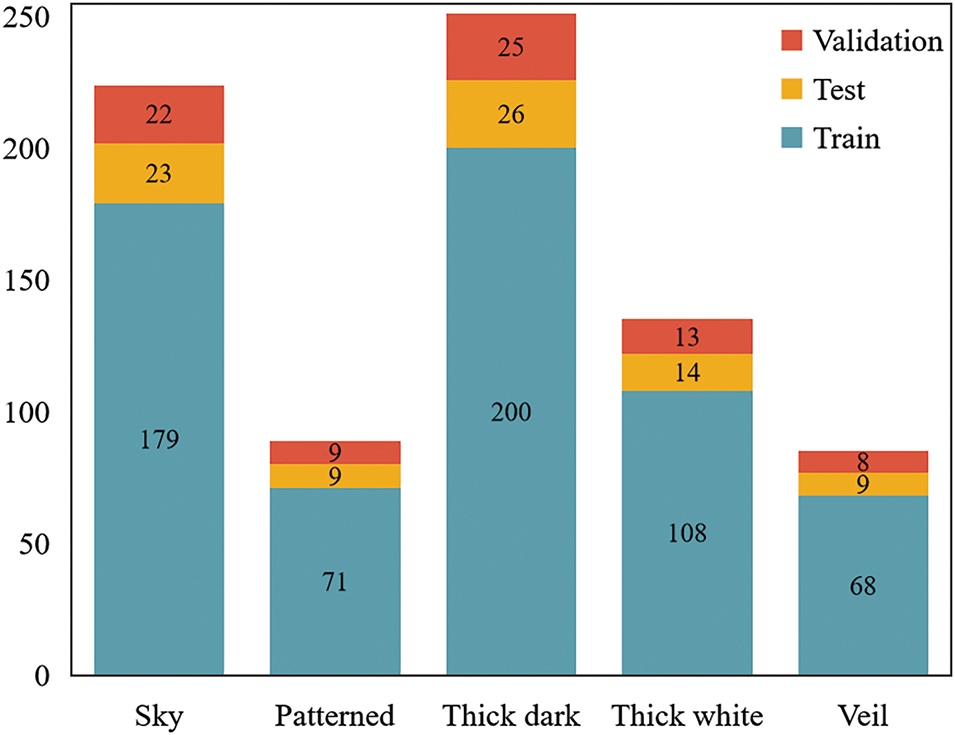
Figure 9: Distribution of the SWIMACT dataset
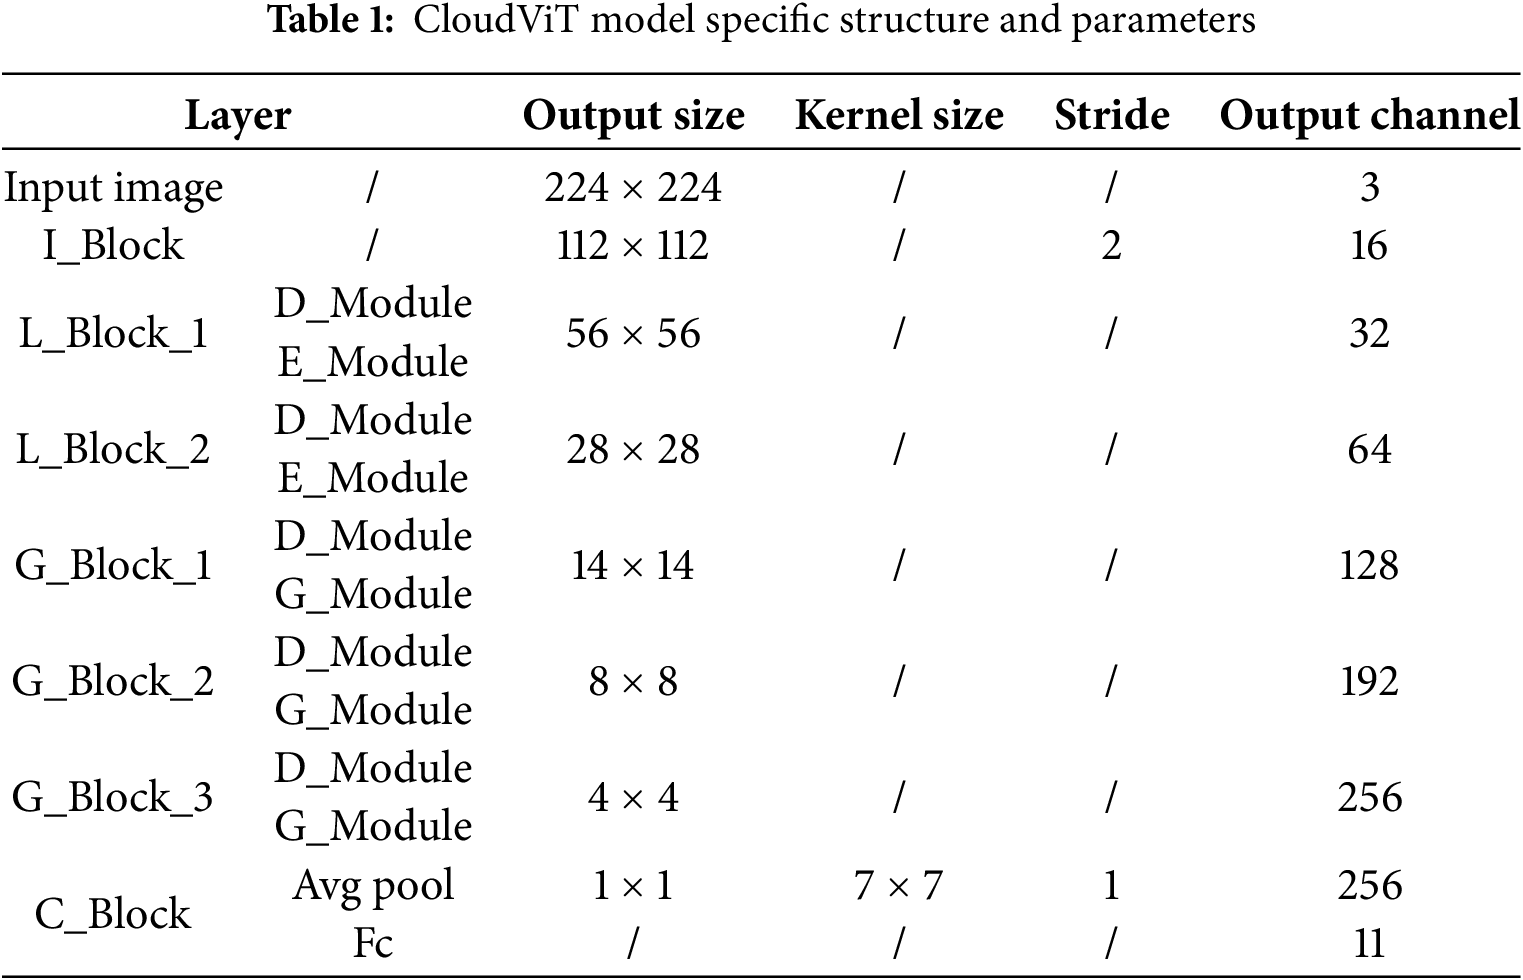
4.2 Experimental Parameters and Evaluation Indexes
Based on the model described in Section 3, we conducted three experiments in this study. The first experiment aimed to evaluate the performance of the proposed model. The second experiment focused on verifying the applicability of the model using a small sample dataset. Lastly, the third experiment involved conducting comparative analyses to examine performance differences among various models. In these experiments, the CloudViT is constituted by two L_Blocks and three G_Blocks. The specific structure of the CloudViT is presented in Table 1. The input size of the samples is set to 224 × 224. To achieve better accuracy, we utilize the cross-entropy function as the loss function in combination with the AdamW optimizer. For learning rate decay, we employ the cosine annealing strategy, with the initial learning rate set to 0.001. The batch size is configured to 32. These hyperparameters were determined through preliminary experiments, where we systematically tested various configurations and found this combination to yield the best performance in terms of both training stability and accuracy. During the training process, an early stopping mechanism is applied, with the maximum training epochs set to 100. This mechanism halts training if the validation set loss does not decrease for a specified number of consecutive evaluations. The model with the highest validation accuracy is selected for testing to ensure optimal performance. To enhance the robustness and generalization of the model, various data augmentation techniques are employed. These include image resizing, cropping, and rotation, which diversify the training data and mitigate overfitting. Additionally, we evaluate the model’s scalability and adaptability by testing it across different datasets and varying data distributions, ensuring that the proposed approach maintains its effectiveness in diverse contexts.
Our experimented to evaluate the performance of different models on cloud images. To analyze how models make decisions, we utilized Grad-CAM [29] to generate feature visualizations. Additionally, we assessed the classification and generalization capabilities of the CloudViT model using various evaluation indexes such as confusion matrix, single-class and multi-class evaluation metrics. The formulae for the various evaluation indicators are as follows:
In these formulae, TP (True Positive) refers to the number of samples correctly predicted as the positive class, FP (False Positive) denotes the number of negative samples incorrectly predicted as the positive class, and FN (False Negative) represents the number of positive samples incorrectly predicted as the negative class.
4.3 Experimental Results and Analysis
This section presents and analyzes the results of the three experiments mentioned in Section 4.2. The core purpose of the first experiment is to comprehensively evaluate the performance of the proposed model and verify its classification accuracy and stability on the HBMCD. The second experiment focuses on testing the applicability and generalization ability of the model on a limited small sample dataset, SWIMCAT, to explore its performance in situations of data scarcity. The third experiment aims to further reveal the advantages and limitations of each model by comparing and analyzing the performance differences between different models.
(1) Overall performance evaluation of the model
In this experiment, we provide a detailed evaluation of the overall performance of the proposed model, including analyses of two key aspects: confusion matrix and multi-class evaluation indicators. The confusion matrix is shown in Fig. 10, our method achieved extremely high classification accuracy for the four cloud types of Cu, No, Ns, and St on the HBMCD dataset without any misclassification.
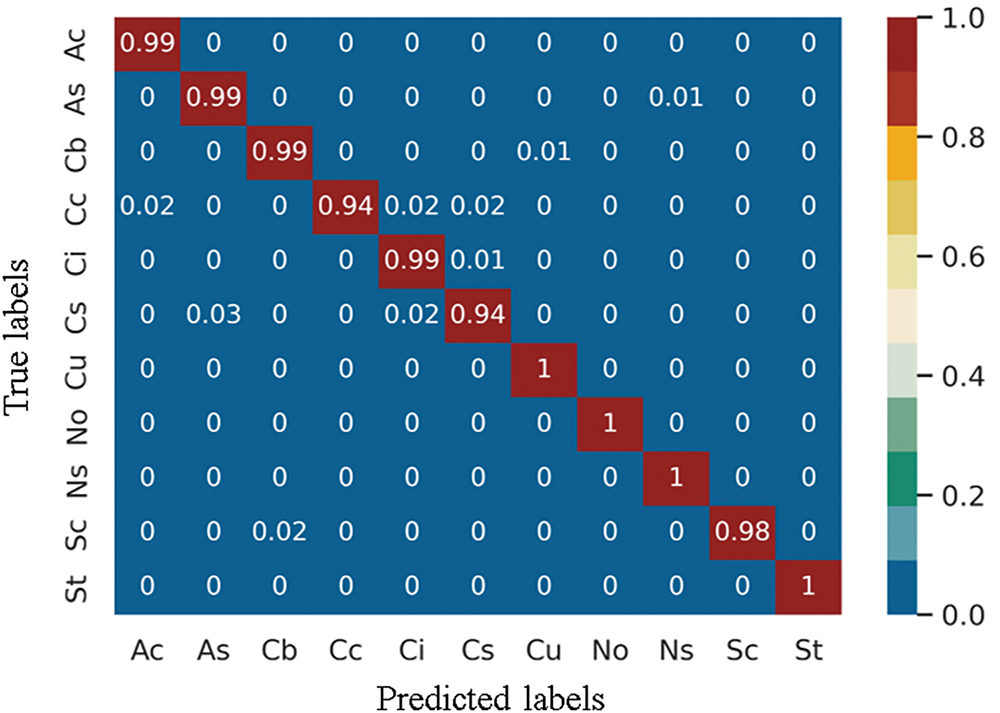
Figure 10: Confusion matrix results on the HBMCD dataset
The evaluation metrics for multi-class classification based on the HBMCD dataset are presented in Table 2. The CloudViT model achieved a micro-precision of 98.45% and a micro-recall of 98.45%, indicating robust overall performance. The macro-precision and macro-recall were 98.38% and 98.31%, respectively, with a slight difference of 0.07%. This minor discrepancy is primarily due to the high similarity between different cloud types in the dataset, which occasionally leads to misclassification of visually similar classes, rather than an imbalance in dataset sample sizes. The confusion matrix (Fig. 10) and single-class evaluation metrics (Table 2) further support this analysis, showing that the model has very few misclassifications overall. For example, certain cloud types like cirrostratus (Cs) and cirrus (Ci) share visual characteristics that can make them difficult to distinguish, contributing to the slight difference between macro-recall and macro-precision. This highlights the model’s effectiveness in handling a diverse and complex dataset while maintaining high accuracy and reliability.
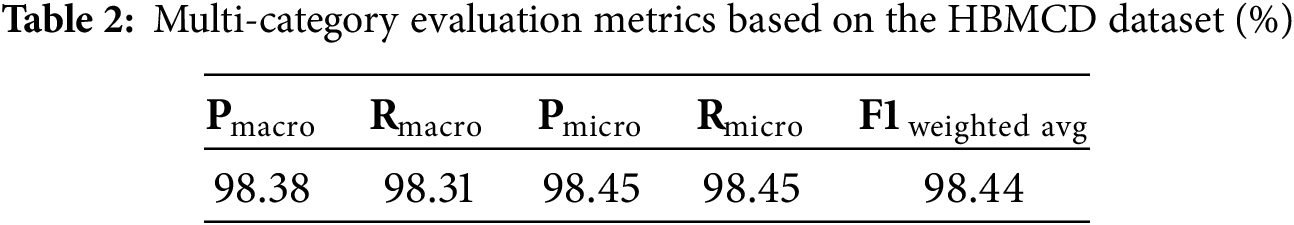
Finally, the weighted average F1-score based on the HBMCD dataset is 98.45%. This indicates that CloudViT not only overcomes the challenge of imbalanced dataset sample sizes but also maintains high accuracy and recall. Therefore, CloudViT delivers excellent results in the HBMCD dataset classification task.
(2) Model performance on small sample datasets
To ensure a comprehensive understanding of the classification performance of our method on small sample datasets, we comprehensively used a confusion matrix and single-class evaluation indicators for analysis and evaluation. These single-category evaluation indicators include accuracy, recall, and F1 score. The overview of the confusion matrix is shown in Fig. 11, while the specific values of single-category evaluation indicators are detailed in Table 3. These data and charts provide information on the classification performance of the research method in this section on small sample datasets.
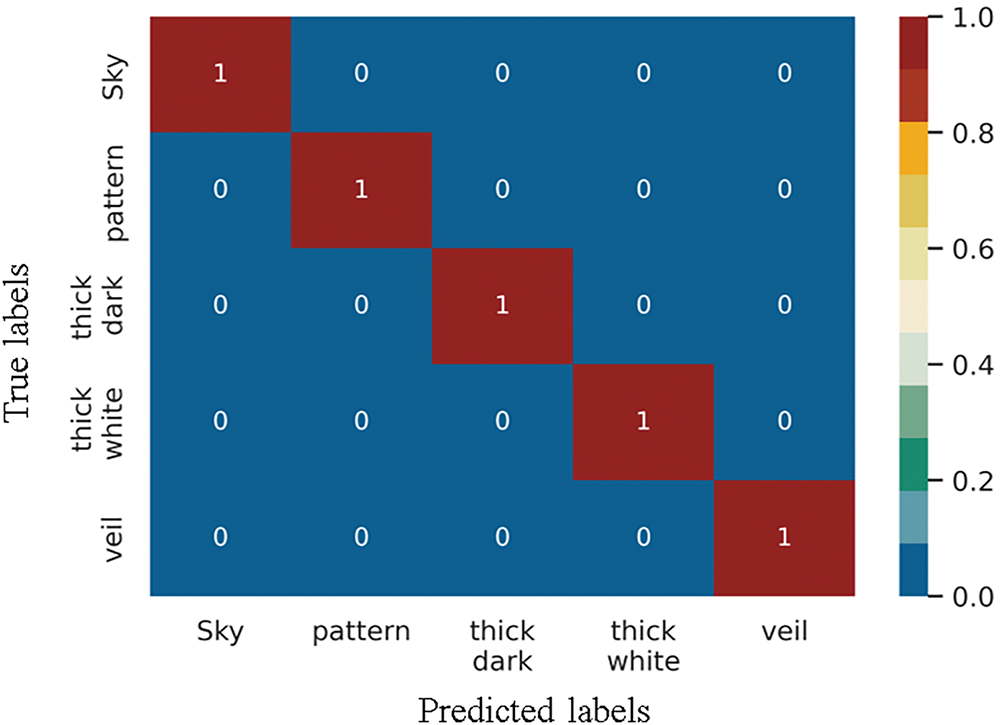
Figure 11: Confusion matrix based on SWIMCAT dataset
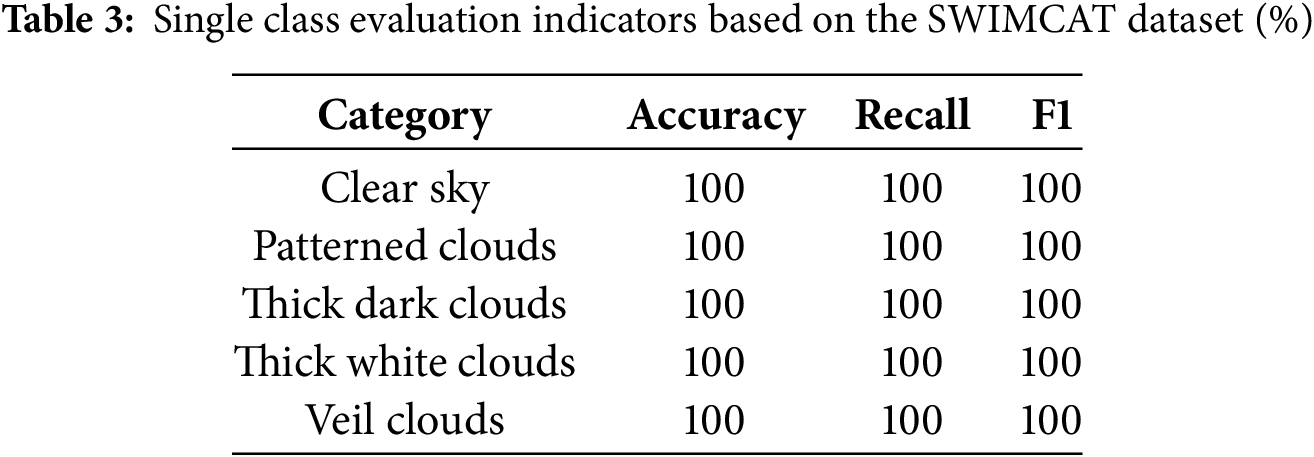
As shown in the confusion matrix in Fig. 11, our method achieved 100% accuracy in cloud classification for all categories on the SWIMCAT dataset. This result indicates that the model can effectively distinguish all cloud types in the SWIMCAT dataset, demonstrating extremely high classification accuracy and stability. According to the data in Table 3, we can see that in the SWIMCAT, the single-category evaluation indicators of each category have reached a perfect 100%. This further demonstrates the effectiveness of our method on small sample datasets.
(3) Comparative experiments
We chose HBMCD as the core experimental dataset when analyzing the differences between the research method in this paper and other ground-based cloud image classification methods because of the diversity and complexity of the HBMCD dataset. To comprehensively evaluate the performance of different techniques, we conducted an in-depth experimental analysis covering the visualization of feature maps and consideration of multi-category evaluation metrics. In addition, we conducted a comprehensive evaluation of the overall classification accuracy, parameter count, and Flops to demonstrate the performance characteristics of various methods more comprehensively.
Various types of clouds can be characterized as unique texture features that describe their visual appearance. Our method used the Grad-CAM [29] method on the HBMCD dataset to better understand how models make decisions by generating heatmaps for the last layer in the CloudNet, LCCNet, ShuffleNet, and CloudViT models. As shown in Fig. 12, these heatmaps illustrate the regions to which the four models pay more attention when classifying the eight categories of images in the HBMCD dataset (Ac, Cb, Cc, Ci, Cs, Cu, Ns, and Sc).
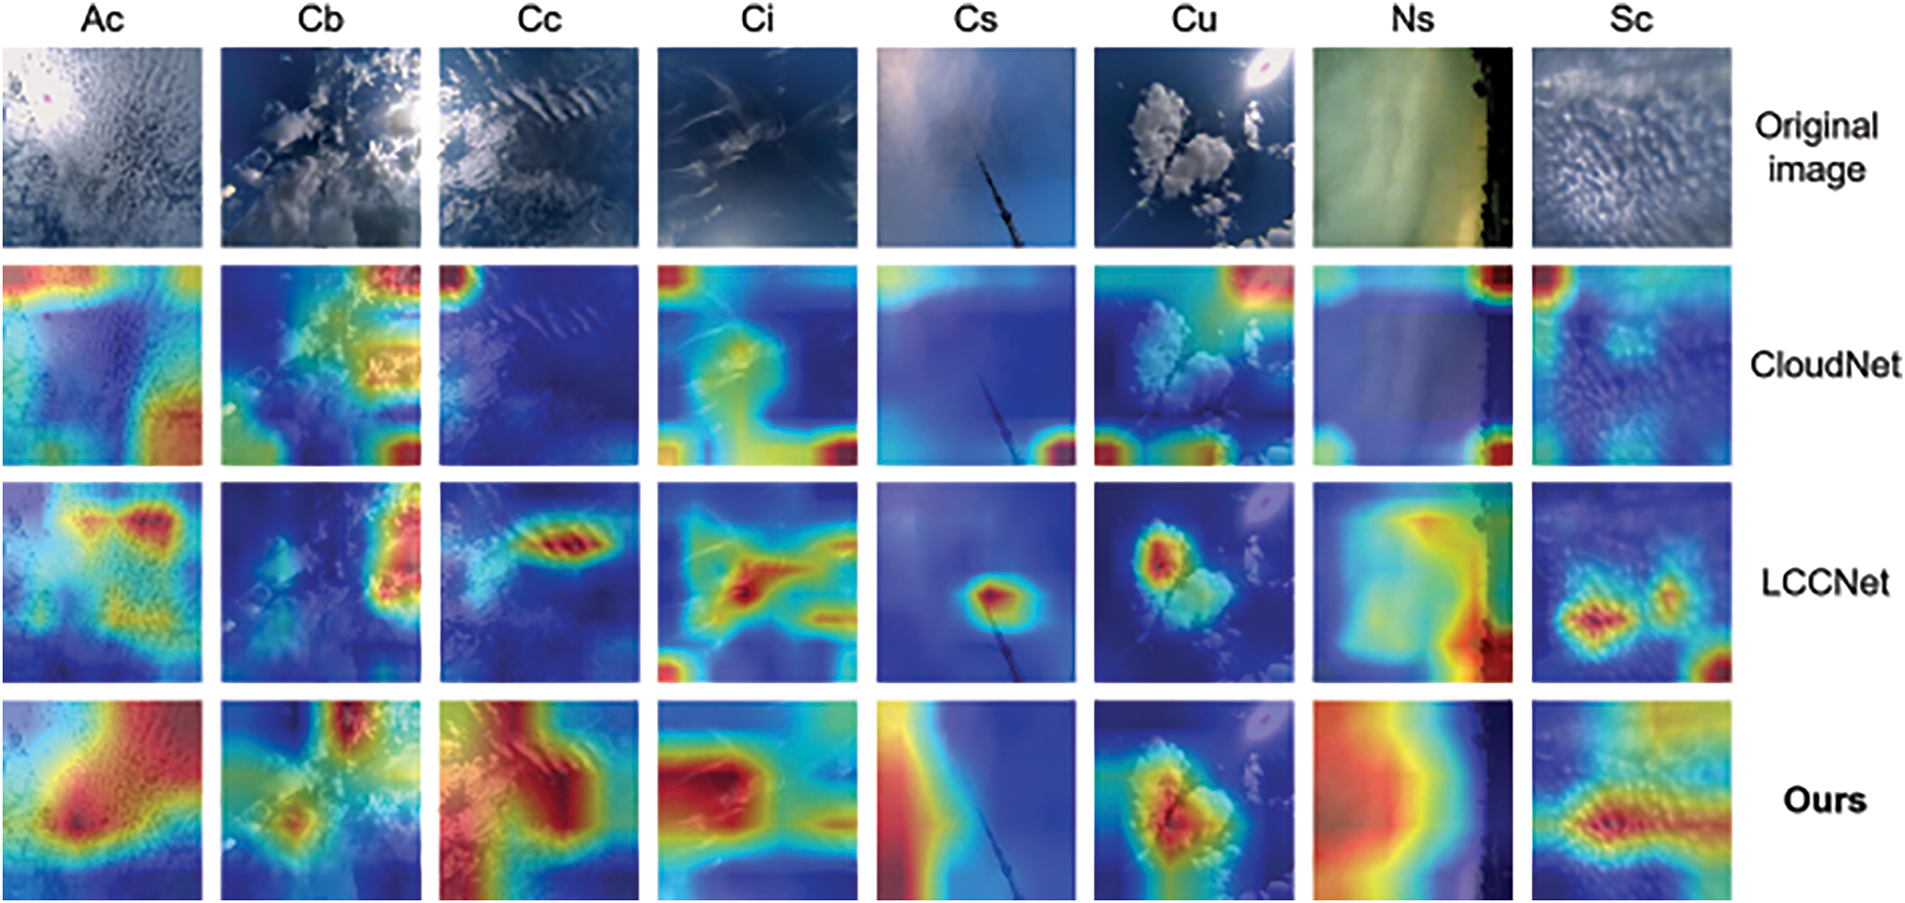
Figure 12: Feature visualization based on different models on the HBMCD dataset
In the image analysis process, we found that pure CNN-based ground-based cloud image classification models like CloudNet and LCCNet exhibit fewer learned cloud image features than the CloudViT model, which combines CNN and Transformer. Furthermore, the pure CNN models fail to capture global feature information effectively. For example, in Fig. 12, the CloudNet and LCCNet models cannot efficiently learn the relevant features for cloud Cs and Ns even after extensive training. Their discriminative capabilities mainly depend on other reference objects within the cloud image. By contrast, the CloudViT model accurately extracts features for these two cloud types and precisely classifies them based on the importance scores assigned to individual pixels in the image. ShuffleNet, being one of the state-of-the-art models, shows improved attention to certain features but still struggles with global contextual understanding compared to CloudViT.
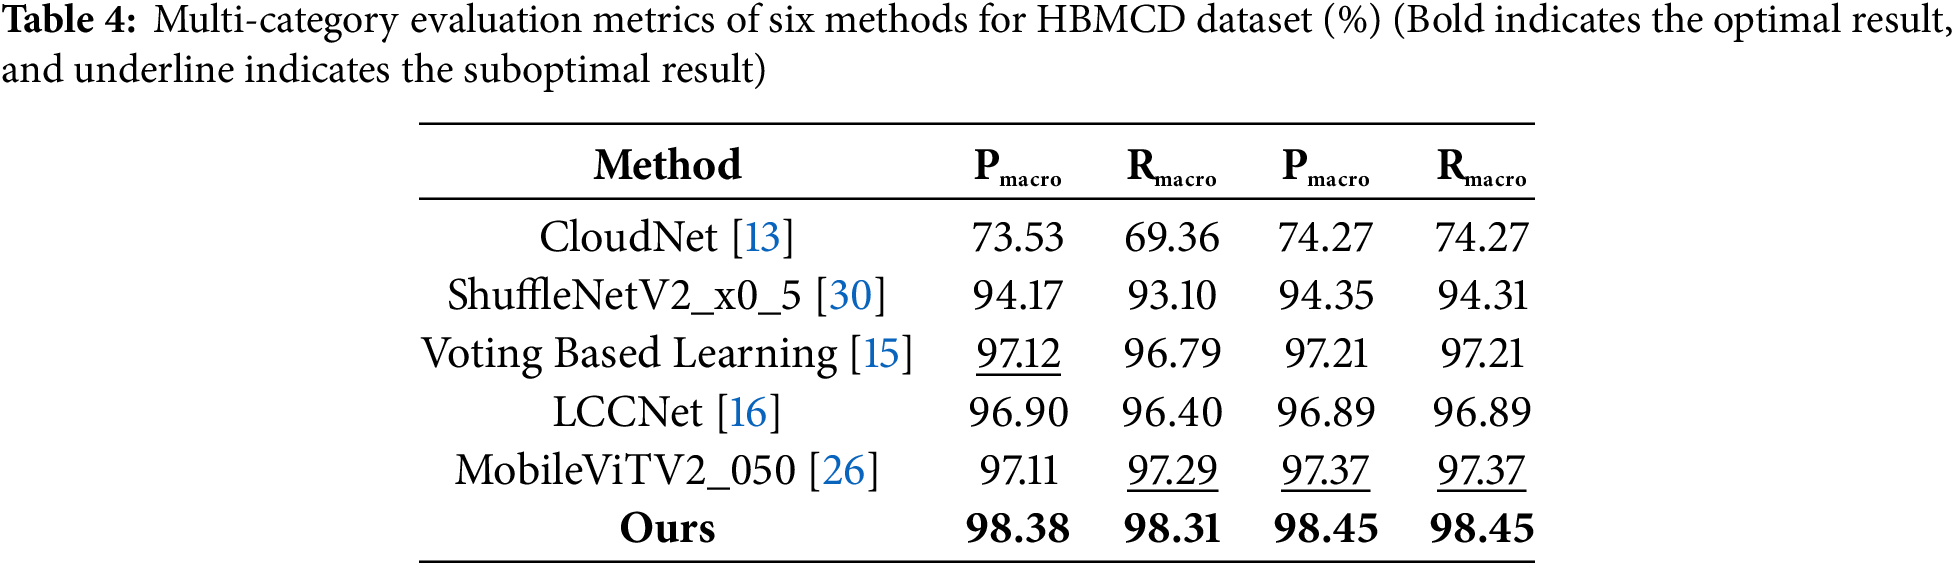
Table 4 presents the multi-class evaluation indicators of six classification methods applied to the HBMCD dataset, including the classic lightweight classification models, the latest ground-based cloud map research methods, and the research method proposed in this paper. After a comprehensive analysis of multiple evaluation indicators in Table 4, we found that the proposed CloudViT model performed excellently on the HBMCD dataset. Specifically, regardless of macro precision, macro recall, micro precision, micro recall, or F1 weighted average, our model demonstrated significant advantages over classical lightweight classification models such as ShuffleNet and recent ground-based cloud image classification methods. The overall classification performance of our method is superior for the HBMCD dataset, as it can more accurately and efficiently identify various cloud shapes.
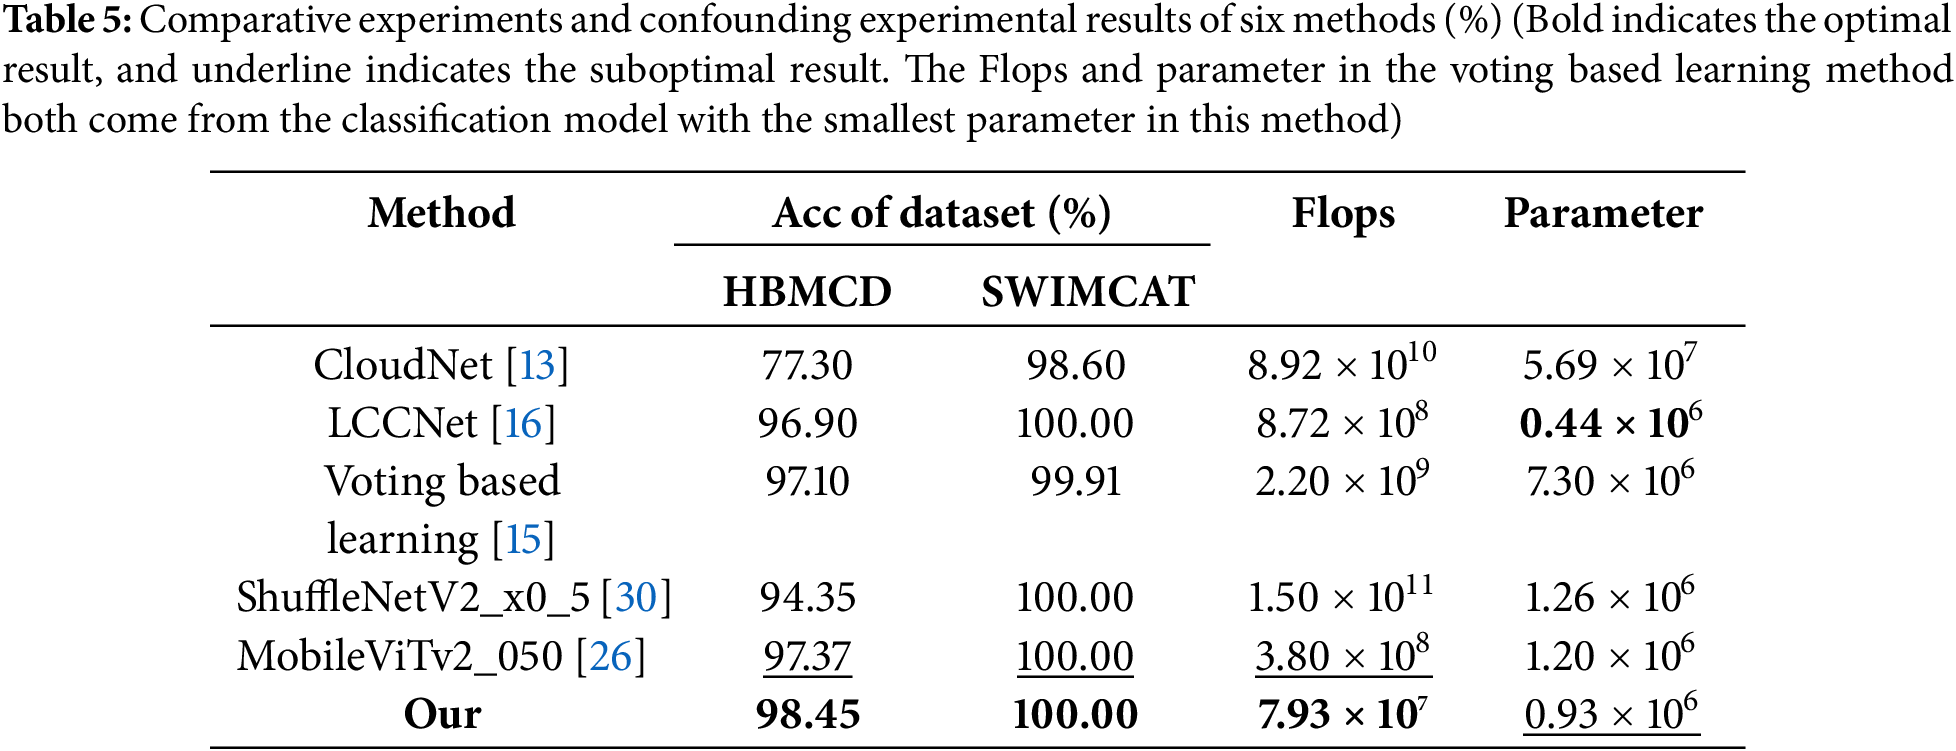
As shown in Table 5, to explore the application effects in practical scenarios, we compared the performance of different classification methods using critical indicators, including overall classification accuracy, Flops, and parameter quantity. Based on the data presented in Table 5, we can see that compared to other classic lightweight classification models and the latest ground-based cloud image classification methods, the CloudViT model exhibits significant advantages in overall performance. Firstly, the CloudViT achieved the optimal classification performance among numerous models, including ShuffleNet, which is considered state-of-the-art. Secondly, it also achieved the lowest number of floating-point operations, ensuring the best computational efficiency among the methods. Finally, compared to the CloudNet model, the proposed CloudViT model reduces the number of parameters by approximately 61 times, making it more suitable for resource-constrained environments.
The comparison of heatmaps in Fig. 12, along with the quantitative results in Tables 4 and 5, underscores the effectiveness and efficiency of CloudViT in capturing both local and global features, achieving state-of-the-art performance in ground-based cloud image classification tasks.
In this paper, we introduced CloudViT, a lightweight neural network tailored specifically for ground-based cloud image classification. CloudViT integrates the strengths of CNN and Transformers, effectively addressing the limitations in capturing global features while maintaining computational efficiency. The model’s innovative D_Module and E_Module, which incorporate lightweight channel attention mechanisms and depthwise separable convolutions, significantly reduce both the number of parameters and the computational resources. This makes CloudViT highly suitable for deployment on resource-constrained devices, such as ground-based cloud observation instruments. Experimental results demonstrate that CloudViT achieves state-of-the-art performance on the HBMCD and SWIMCAT datasets, with classification accuracies of 98.45% and 100%, respectively. These results underscore the model’s ability to handle complex cloud images characterized by small inter-class differences and large intra-class variations. Furthermore, the lightweight design of CloudViT ensures reduced computational demands, with a parameter count approximately 61 times smaller than that of the CloudNet model.
Despite its promising performance, the model encounters challenges in distinguishing between certain cloud types, such as Cc and Ac, Cs and Ci, and Cs and As, due to the high similarity of samples within these classes. To address these limitations, future work will explore leveraging multi-modal data fusion, integrating additional information such as cloud height, temperature, density, and water vapor content collected during image acquisition. Incorporating such complementary data is anticipated to enhance the model’s ability to differentiate between closely related cloud types. Additionally, the limitations and challenges associated with CloudViT warrant further investigation. While the model exhibits excellent performance on the tested datasets, its generalizability to other regions and cloud types has yet to be validated. Future research will focus on evaluating the model across a broader range of datasets to assess its robustness and adaptability under diverse cloud conditions worldwide.
Acknowledgement: We’re grateful to the state-of-the-art research facilities provided by the National Key Laboratory of Intelligent Spatial Information. Thanks also go to the research group at Sichuan Science and Technology Program and Key Laboratory of Smart Earth. Their insights and extra computational resources helped refine our methods and verify results. We appreciate the developers of open-source libraries like TensorFlow and PyTorch. Their work has speed up our research, allowing us to efficiently implement complex deep-learning models.
Funding Statement: This research was jointly funded by Innovation and Development Special Project of China Meteorological Administration (CXFZ2022J038, CXFZ2024J035), Sichuan Science and Technology Program (No. 2023YFQ0072), Key Laboratory of Smart Earth (No. KF2023YB03-07) and Automatic Software Generation and Intelligent Service Key Laboratory of Sichuan Province (CUIT-SAG202210).
Author Contributions: Daoming Wei: Conceptualization, Methodology, Investigation, Formal Analysis, Writing—Original Draft; Fangyan Ge: Coding, Experiments, Data Curation, Writing—Original Draft; Bopeng Zhang: Visualization, Writing Introduction Section; Zhiqiang Zhao: Resources, Supervision; Dequan Li: Validation, Proofreading; Lizong Xi: Visualization, Writing—Review & Editing; Jinrong Hu: Writing Conclusion; Xin Wang: Writing Abstract and Proofreading. All authors reviewed the results and approved the final version of the manuscript.
Availability of Data and Materials: The data and materials, including the source code for the deep-learning models developed in this research, are available upon request. Interested researchers can contact the corresponding author at to obtain the code. The code has been developed using Python and relevant deep-learning frameworks, and detailed instructions for running the code will be provided along with its distribution.
Ethics Approval: Not applicable.
Conflicts of Interest: The authors declare no conflicts of interest to report regarding the present study.
References
1. Ge J, Zheng C, Xie H, Xin Y, Huang J, Fu Q. Midlatitude Cirrus clouds at the SACOL site: macrophysical properties and large-scale atmospheric states. J Geophys Res Atmos. 2018;123(4):2256–71. doi:10.1002/2017JD027724. [Google Scholar] [CrossRef]
2. Chen T, Rossow WB, Zhang Y. Radiative effects of cloud-type variations. J Climate. 2000;13(1):264–86. doi:10.1175/1520-0442(2000)013%3C0264:reoctv%3E2.0.co;2. [Google Scholar] [CrossRef]
3. Sun X, Yu Y, Cheng Q. Robust and discriminative feature learning via mutual information maximization for object detection in aerial images. Comput Mater Contin. 2024;80(3):4149–71. doi:10.32604/cmc.2024.052725. [Google Scholar] [CrossRef]
4. Gyasi EK, Swarnalatha P. Cloud-MobiNet: an abridged mobile-net convolutional neural network model for ground-based cloud classification. Atmosphere. 2023;14(2):280. doi:10.3390/atmos14020280. [Google Scholar] [CrossRef]
5. Barry RG. International cloud atlas, volume I: manual on the observation of clouds and other meteors. Arctic Alpine Res. 1977;9(3):323. doi:10.2307/1550553. [Google Scholar] [CrossRef]
6. Tapakis R, Charalambides AG. Equipment and methodologies for cloud detection and classification: a review. Sol Energy. 2013;95:392–430. doi:10.1016/j.solener.2012.11.015. [Google Scholar] [CrossRef]
7. Heinle A, Macke A, Srivastav A. Automatic cloud classification of whole sky images. Atmos Meas Tech. 2010;3(3):557–67. doi:10.5194/amt-3-557-2010. [Google Scholar] [CrossRef]
8. Liu S, Wang C, Xiao B, Zhang Z, Shao Y. Illumination-invariant completed LTP descriptor for cloud classification. In: 2012 5th International Congress on Image and Signal Processing. 2012 Oct 16–18; Chongqing, China: IEEE; 2012. p. 449–53. doi:10.1109/CISP.2012.6469765. [Google Scholar] [CrossRef]
9. Dev S, Lee YH, Winkler S. Categorization of cloud image patches using an improved texton-based approach. In: IEEE International Conference on Image Processing (ICIP). 2015 Sep 27–30; Quebec City, QC, Canada: IEEE; 2015. 422–6. doi:10.1109/ICIP.2015.7350833. [Google Scholar] [CrossRef]
10. Wang Y, Shi C, Wang C, Xiao B. Ground-based cloud classification by learning stable local binary patterns. Atmos Res. 2018;207(1):74–89. doi:10.1016/j.atmosres.2018.02.023. [Google Scholar] [CrossRef]
11. Krizhevsky A, Sutskever I, Hinton GE. ImageNet classification with deep convolutional neural networks. Commun ACM. 2017;60(6):84–90. doi:10.1145/3065386. [Google Scholar] [CrossRef]
12. Lv Q, Li Q, Chen K, Lu Y, Wang L. Classification of ground-based cloud images by contrastive self-supervised learning. Remote Sens. 2022;14(22):5821. doi:10.3390/rs14225821. [Google Scholar] [CrossRef]
13. Zhang J, Liu P, Zhang F, Song Q. CloudNet: ground-based cloud classification with deep convolutional neural network. Geophys Res Lett. 2018;45(16):8665–72. doi:10.1029/2018GL077787. [Google Scholar] [CrossRef]
14. Phung VH, Rhee EJ. A high-accuracy model average ensemble of convolutional neural networks for classification of cloud image patches on small datasets. Appl Sci. 2019;9(21):4500. doi:10.3390/app9214500. [Google Scholar] [CrossRef]
15. Manzo M, Pellino S. Voting in transfer learning system for ground-based cloud classification. Mach Learn Knowl Extrac. 2021;3(3):542–53. doi:10.3390/make3030028. [Google Scholar] [CrossRef]
16. Zhang L, Jia K, Liu P, Fang C. Cloud recognition based on lightweight neural network. In: 2020 Asia-Pacific Signal and Information Processing Association Annual Summit and Conference (APSIPA ASC); 2020; Auckland, New Zealand. p. 1033–42. [Google Scholar]
17. Toğaçar M, Ergen B. Classification of cloud images by using super resolution, semantic segmentation approaches and binary sailfish optimization method with deep learning model. Comput Electron Agric. 2022;193(20):106724. doi:10.1016/j.compag.2022.106724. [Google Scholar] [CrossRef]
18. Li X, Qiu B, Cao G, Wu C, Zhang L. A novel method for ground-based cloud image classification using transformer. Remote Sens. 2022;14(16):3978. doi:10.3390/rs14163978. [Google Scholar] [CrossRef]
19. Zhang X, Zheng W, Zhang J, Chen W, Chen L. Research on ground-based cloud image classification combining local and global features. J Electron Imag. 2024;33(4) doi:10.1117/1.JEI.33.4.043030. [Google Scholar] [CrossRef]
20. Yu F, Koltun V. Multi-scale context aggregation by dilated convolutions. arXiv:1511.07122. 2015. [Google Scholar]
21. Peng C, Zhang X, Yu G, Luo G, Sun J. Large kernel matters—improve semantic segmentation by global convolutional network. In: 2017 IEEE Conference on Computer Vision and Pattern Recognition (CVPR). 2017 Jul 21–26; Honolulu, HI, USA: IEEE; 2017. p. 1743–51. doi:10.1109/CVPR.2017.189. [Google Scholar] [CrossRef]
22. Zhao H, Shi J, Qi X, Wang X, Jia J. Pyramid scene parsing network. In: 2017 IEEE Conference on Computer Vision and Pattern Recognition (CVPR). 2017 Jul 21–26; Honolulu, HI, USA: IEEE; 2017. p. 6230–9. doi:10.1109/CVPR.2017.660. [Google Scholar] [CrossRef]
23. Wang X, Girshick R, Gupta A, He K. Non-local neural networks. In: 2018 IEEE/CVF Conference on Computer Vision and Pattern Recognition. 2018 Jun 18–23; Salt Lake City, UT, USA: IEEE; 2018. p. 7794–803. doi:10.1109/CVPR.2018.00813. [Google Scholar] [CrossRef]
24. Vaswani A, Shazeer N, Parmar N, Uszkoreit J, Jones L, Gomez AN, et al. Attention is all you need. In: Proceedings of the 31st International Conference on Neural Information Processing Systems (NIPS’17). Red Hook, NY, USA: Curran Associates Inc.; 2017. p. 6000–10. [Google Scholar]
25. Mehta S, Rastegari M. MobileViT: light-weight, general-purpose, and mobile-friendly vision transformer. arXiv:2110.02178. 2021. [Google Scholar]
26. Mehta S, Rastegari M. Separable self-attention for mobile vision transformers. arXiv:2206.02680. 2022. [Google Scholar]
27. Elfwing S, Uchibe E, Doya K. Sigmoid-weighted linear units for neural network function approximation in reinforcement learning. Neural Netw. 2018;107(3):3–11. doi:10.1016/j.neunet.2017.12.012. [Google Scholar] [PubMed] [CrossRef]
28. Springenberg JT, Dosovitskiy A, Brox T, Riedmiller M. Striving for simplicity: the all convolutional net. arXiv: 1412.6806. 2014. [Google Scholar]
29. Selvaraju RR, Cogswell M, Das A, Vedantam R, Parikh D, Batra D. Grad-CAM: visual explanations from deep networks via gradient-based localization. In: 2017 IEEE International Conference on Computer Vision (ICCV). 2017 Oct 22–29; Venice, Italy: IEEE; 2017. p. 618–26. doi:10.1109/ICCV.2017.74. [Google Scholar] [CrossRef]
30. Ma N, Zhang X, Zheng HT, Sun J. ShuffleNet V2: practical guidelines for efficient CNN architecture design. In: Computer Vision–ECCV 2018; 2018; Cham: Springer International Publishing. p. 122–38. doi:10.1007/978-3-030-01264-9_8. [Google Scholar] [CrossRef]
Cite This Article
 Copyright © 2025 The Author(s). Published by Tech Science Press.
This work is licensed under a Creative Commons Attribution 4.0 International License , which permits unrestricted use, distribution, and reproduction in any medium, provided the original work is properly cited.
 Downloads
 Citation Tools