
 Submit a Paper
 Propose a Special lssue
 Open Access
ARTICLE

Dual-Classifier Label Correction Network for Carotid Plaque Classification on Multi-Center Ultrasound Images
1 School of Computer Engineering and Science, Shanghai University, Shanghai, 200444, China
2 Gerontology Department, Shanghai Jiaotong University School of Medicine Affiliated Ninth Hospital, Shanghai, 200025, China
3 Scientific Research Management Department, Shanghai University, Shanghai, 200444, China
* Corresponding Author: Wei Shao. Email:
# Equal contribution
(This article belongs to the Special Issue: Emerging Trends and Applications of Deep Learning for Biomedical Signal and Image Processing)
Computers, Materials & Continua 2025, 83(3), 5445-5460. https://doi.org/10.32604/cmc.2025.061759
Received 02 December 2024; Accepted 01 April 2025; Issue published 19 May 2025
 View Full Text
 Download PDF
Abstract
Carotid artery plaques represent a major contributor to the morbidity and mortality associated with cerebrovascular disease, and their clinical significance is largely determined by the risk linked to plaque vulnerability. Therefore, classifying plaque risk constitutes one of the most critical tasks in the clinical management of this condition. While classification models derived from individual medical centers have been extensively investigated, these single-center models often fail to generalize well to multi-center data due to variations in ultrasound images caused by differences in physician expertise and equipment. To address this limitation, a Dual-Classifier Label Correction Network model (DCLCN) is proposed for the classification of carotid plaque ultrasound images across multiple medical centers. The DCLCN designs a multi-center domain adaptation module that leverages a dual-classifier strategy to extract knowledge from both source and target centers, thereby reducing feature discrepancies through a domain adaptation layer. Additionally, to mitigate the impact of image noise, a label modeling and correction module is introduced to generate pseudo-labels for the target centers and iteratively refine them using an end-to-end correction mechanism. Experiments on the carotid plaque dataset collected from three medical centers demonstrate that the DCLCN achieves commendable performance and robustness.Keywords
Cardiovascular disease (CVD), a leading cause of morbidity and mortality globally, is primarily caused by the continuous development of carotid atherosclerosis [1]. One of the main causes of CVD is the continuous development of carotid atherosclerosis [2]. Thus, the concept of vulnerable plaques was introduced, and researchers have focused on CVD prevention by identifying atherosclerotic plaques with increased risk [3]. Clinically, due to the shallow position of the carotid artery, B-mode ultrasound, a noninvasive detection method, is one of the main methods for the preoperative diagnosis of carotid plaque in clinical practice [4]. However, its imaging efficacy is strongly affected by the operator’s technique and instrument. The use of different operators and different instruments can impact the final imaging effect. Therefore, it is necessary to develop a computer-aided diagnosis (CAD) system based on multicenter B-mode ultrasound plaque data.
Deep learning, as an efficient auxiliary diagnostic method, has been gradually applied in carotid atherosclerosis-related fields and has achieved good results, especially for plaque data from a single center [5]. However, deep learning methods need a large amount of labeled data. Unfortunately, the collection of medical data itself is different from that of natural images, requiring much time and consultation with hospitals and adhering to pertinent ethical review procedures. Furthermore, the need for data annotation by domain-specialized medical professionals with extensive experience is highly important. These problems limit the development of multicenter plaque risk CAD to some extent. Therefore, using unsupervised learning has been proposed to solve this kind of problem. The aim of unsupervised learning is to train a domain-invariant classifier by narrowing the data features of two different domains, which also means that unsupervised learning does not require target center data labels for classification [6]. Recent advances in domain adaptation have demonstrated substantial progress in natural image classification tasks [7,8]. However, due to the inherent challenges of medical images, domain adaptation has garnered significant attention in the field of medical imaging. Common issues include unsupervised learning constraints, difficulties in adapting to diverse patient populations, and challenges in handling complex medical datasets [9]. To achieve this goal in multicenter CAD for carotid plaque risk prediction, there are some difficult problems that still need to be solved.
Establishing an appropriate deep learning classification model for multicenter carotid artery plaque ultrasound images still encounters two major challenges: 1) Differences in operators and equipment contribute to variations in ultrasound imaging features, implying substantial disparities in plaque ultrasound data acquired from different centers, resulting in divergent diagnostic outcomes. Consequently, these differences present challenges in unifying unique features within datasets from various centers. 2) Inherent deficiencies in ultrasound imaging, such as low resolution and artifacts, pose significant challenges [10]. Additionally, during examinations, factors like patient swallowing and the operator’s proficiency impact the final image quality of ultrasound [11]. The resulting noise makes it difficult to identify and classify certain data features, leading to the misallocation of erroneous labels by the classifier. Such labels hinder the effective transfer of features across multiple centers. These two difficulties are shown in more detail in Fig. 1. Therefore, it is imperative to address the aforementioned challenges to facilitate seamless integration and accurate analysis within such systems.
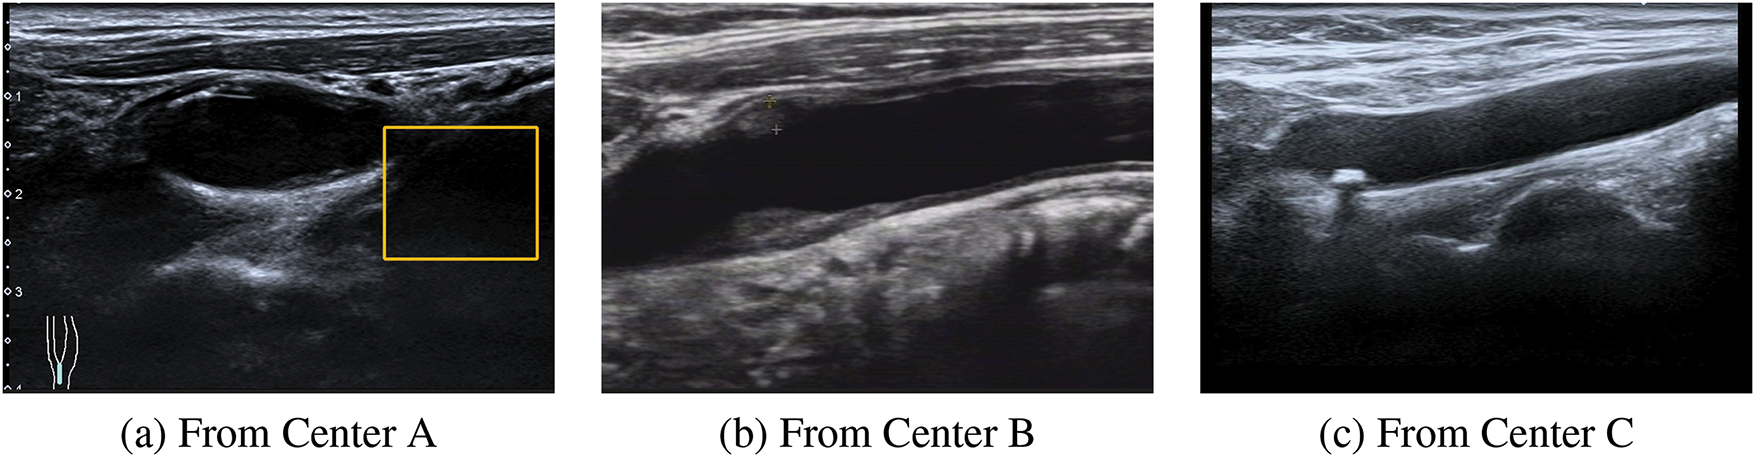
Figure 1: An example of the differences in the ultrasound images of plaques from multiple centers. These three images are from three different centers. (1) Plaque ultrasound image noise. (a) The yellow box indicates an ultrasound artifact, which covers part of the useful information and produces noise interference. (b) It is evident that the resolution of this ultrasound image is very low. (2) Feature inconsistency. It can be observed that in (a), (b) and (c) there are obvious differences among the three images, causing certain difficulties for follow-up research
To address the above difficulties, we propose a multicenter plaque risk prediction algorithm based on dual classifier noise label correction. The overarching concept is visually represented in Fig. 2. This method introduces the ideas of adversarial and label correction. On the basis of narrowing the characteristics of multicenter data, the collective knowledge of two classifiers is used to continuously correct labels to transfer information between different centers. In more detail, we construct a feature-sharing multilayer domain adaptation layer to narrow the feature differences in different central datasets and use two independent classifiers, which can cooperate to obtain pseudo labels for the data from the target center. Based on the pseudolabels, iterative label updates are achieved by means of adversarial generation, leveraging feature learning and loss function computations. Our main contributions can be summarized as follows:
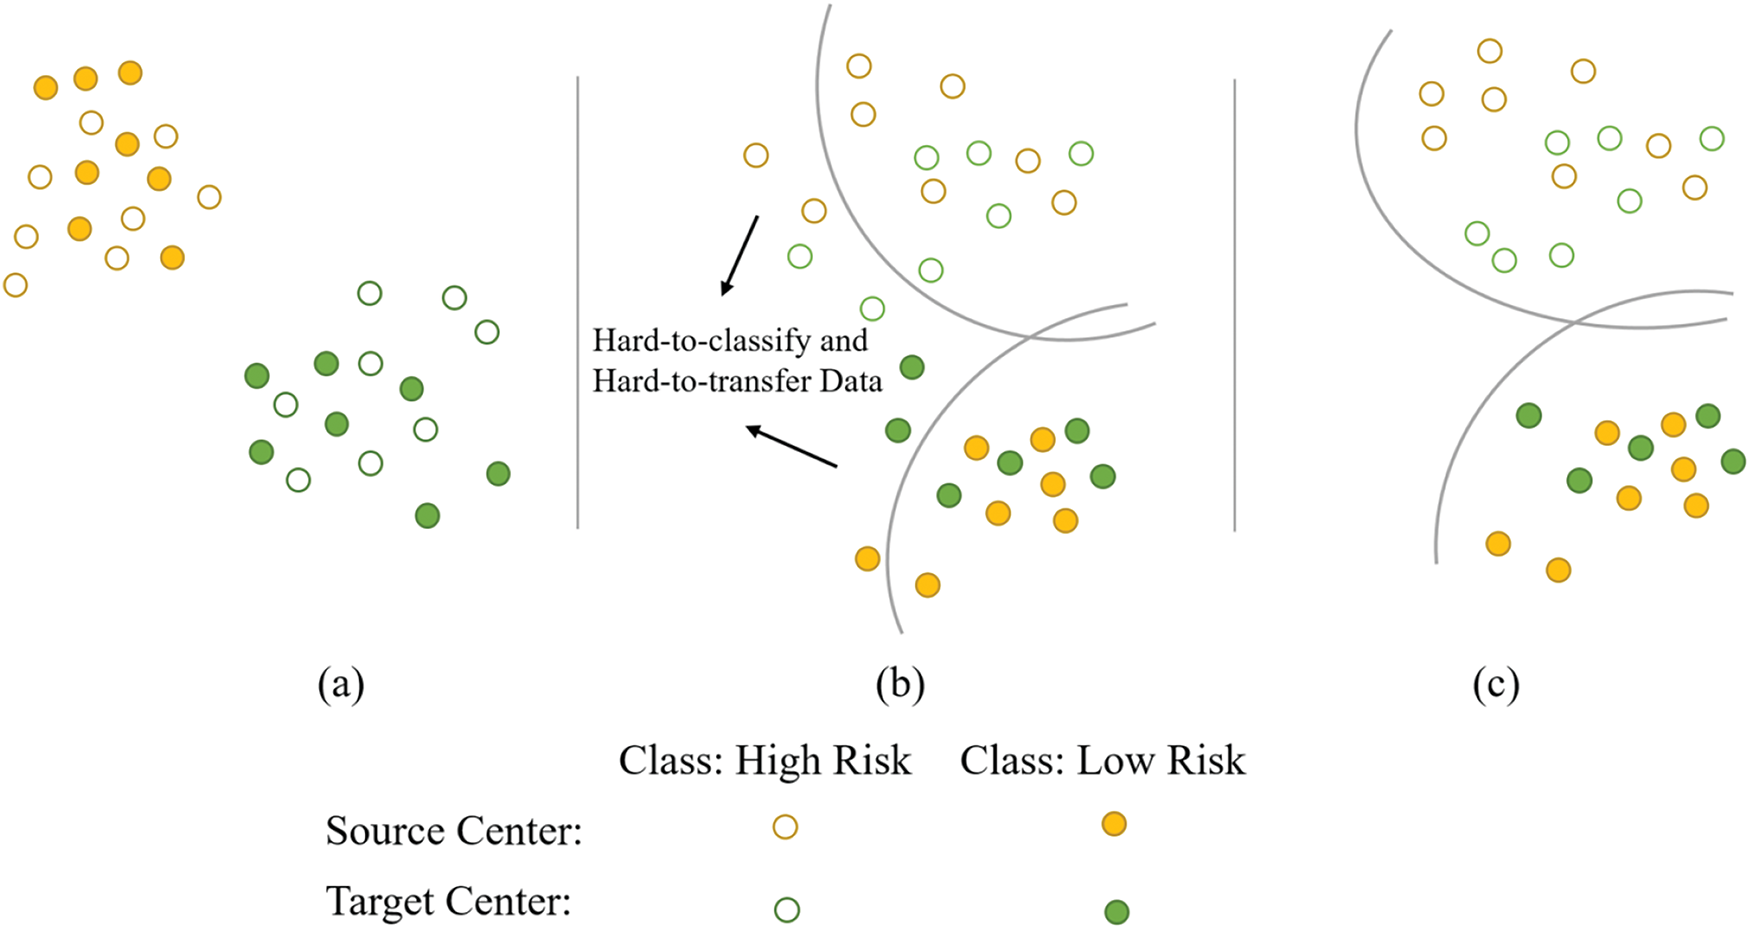
Figure 2: Schematic of feature distribution and our main ideas. (a) The initial distribution of plaque ultrasound data features, which is highly disordered and cannot be classified by the classifier. (b) After narrowing the feature distance, the majority of the data can now be classified by the classifier. The classifier has difficulty in the classification and identification of some data due to noise in certain ultrasound images, hindering feature transfer across multiple centers. (c) By further modeling and correcting noise labels, this image represents the final goal that the DCLCN aims to achieve
1 We propose a domain adaptation framework specifically designed for multicenter ultrasound plaque image classification, namely, the double classifier label correction network (DCLCN), which aims to address noise and feature transfer issues more effectively.
2 The DCLCN algorithm includes the multicenter feature adaptation (MFA) module, which identifies latent shared features between the source and target centers, facilitating the discovery of transferable knowledge conducive to classification.
3 Building upon the MFA module, the DCLCN implements the modeling and correction of noise labels (MCNL) module. This module performs deep correction by modeling the labels of the target center based on the MFA module, addressing the predictions influenced by noise in the model, and maintaining and updating the end-to-end label distributions from two center datasets.
The role of deep learning in medical image analysis is becoming increasingly evident, particularly in single-center plaque analysis. Single-center plaque classification research has made significant strides, offering valuable diagnostic tools [12,13]. A deep learning-based framework for mammogram classification is proposed to enhance the accuracy of breast cancer detection [14]. An explainable deep learning architecture, DeepOCT, analyses macular edema in OCT images, enhancing both diagnostic accuracy and interpretability [15]. However, real-world applications span multiple hospitals, necessitating multicenter carotid plaque classification. While multicenter plaque studies are limited, progress in other fields is noteworthy.
2.1 Unsupervised Domain Adaptation
Unsupervised domain adaptation (UDA) addresses domain differences between source and target domains for enhanced image processing task performance. Collaborative unsupervised domain adaptation (CoUDA) [16] combats dataset noise but overlooks center-specific feature differences. Consequently, existing methods for multicenter ultrasound plaque risk prediction are insufficient. Relevant research integrates multi-modal information fusion and domain adaptation techniques to enhance the generalization ability across multi-center data [17]. However, they are often limited to specific modalities like CT, require high-quality data, and are computationally demanding [18]. Some studies optimize cross-domain feature alignment and semantic transfer through multi-scale adversarial learning, a mix-up discriminator, and a self-attention mechanism, demonstrating superior performance in ultrasound image tasks [19]. These studies highlight the need for further improvements in data quality, modality-specific strategies, and computational efficiency.
Pseudolabels enhance model performance in the target domains by aiding in feature and pattern recognition. Several studies have explored the applications in UDA. The moving semantic transfer network (MSTN) [20] investigates semantic representation learning with pseudolabels in UDA. Box-Adapt [21] which uses bounding boxes for partial labeling, was also proposed. Despite the success of these approaches, challenges remain in improving pseudolabel precision and addressing noisy labels. To address these issues, Shi et al. [22] proposed a UDA framework based on label distribution learning, which corrects noisy pseudolabels iteratively to retrain the model.
We evaluate the proposed method with three ultrasound datasets collected from three collaborating centers, A, B, and C. All three datasets were annotated by radiologists with years of clinical experience. In this study, stable plaques are considered low risk, while unstable plaques are deemed high risk due to their risk of detachment [23]. All the datasets are summarized in Table 1.

In this study, the domain adaptation challenge within the context of B-mode ultrasound multicenter plaques is addressed. From the source center, we obtain the image
As shown in Fig. 3, the first stage involves an MFA module to address the issue of multicenter feature inconsistency. This module includes a domain feature adaptation layer and two independent classifiers (
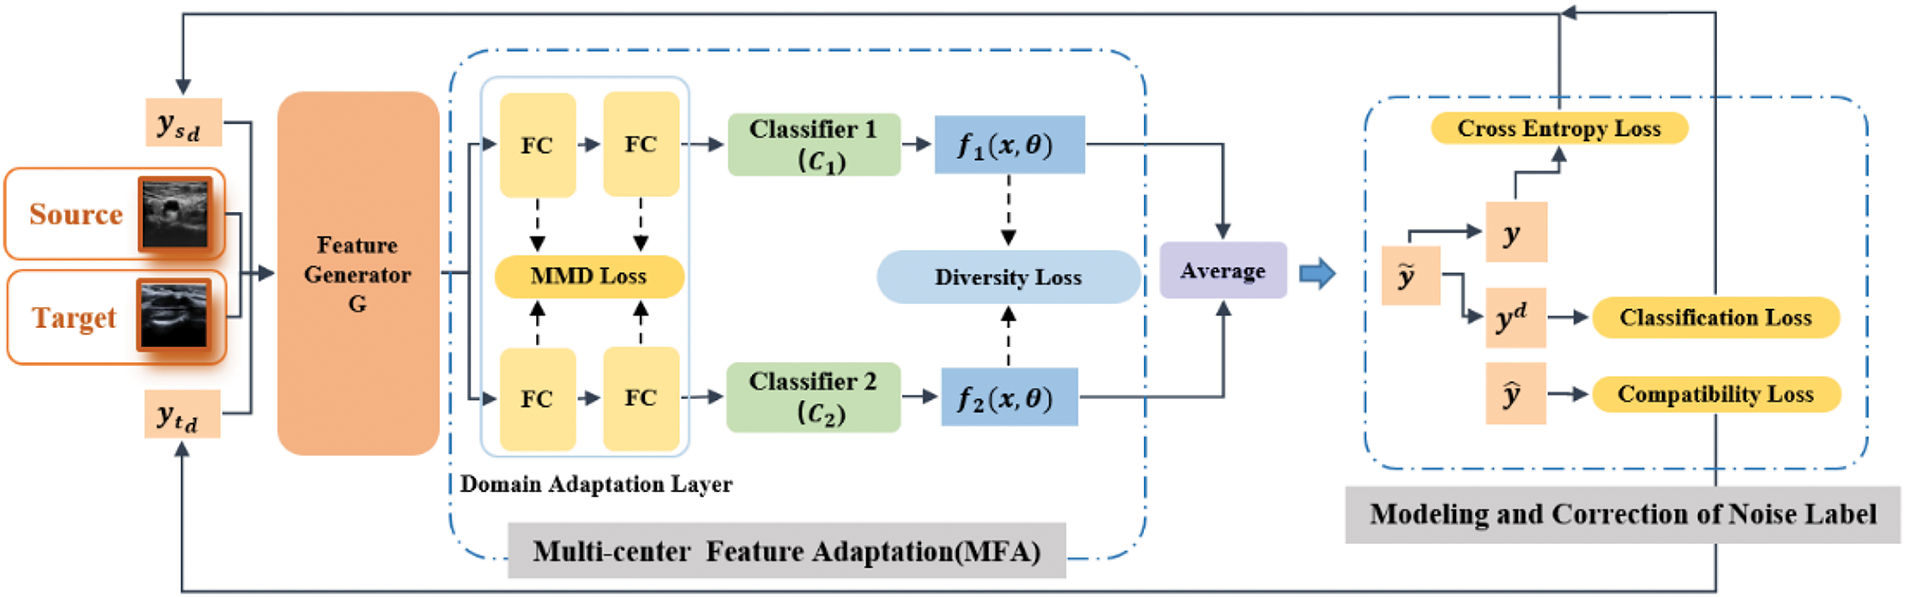
Figure 3: The overall framework of the DCLCN, which consists of two main parts: the multicenter feature adaptation (MFA) and modeling and correction of noise label (MCNL) modules. Images from different centers are input to the model as sources and targets. Following the two parts, the label distribution of the images is continuously updated and refined in the subsequent training iterations and utilized as the input in the next iteration
In the second stage, the MCNL module is introduced. Here, the model simultaneously provides label distribution sets
3.2.1 Multicenter Feature Adaptation
To solve the multicenter data alignment problem in the first stage, the DCLCN introduces the MFA module based on the dual classifier. We designed a domain adaptation layer after the feature generator G. For model implementation, this component comprises two fully connected layers. The primary objective of the MTA module is to enhance feature alignment. To effectively quantify feature disparities, the DCLCN uses the Maximum Mean Difference (MMD) [24] as the chosen metric. The MMD projects features into a high-dimensional space using the kernel function and computes the expected difference between the random variables of the two feature distributions after mapping. The maximum value of this calculation serves as the standard for measuring the distance. By minimizing the MMD loss, the DCLCN can identify invariant features among multiple centers.
To further measure the difference between the two classifiers, the DCLCN introduces diversity loss, which uses the difference in absolute values of the output of the classifier for the target center data to perform quantitative measurements. The specific definition is shown in Eq. (2).
where
By maximizing
Through multicenter domain adaptation, the model can obtain prediction results
3.2.2 Modeling and Correction of the Noise Label
For plaque images, simply reducing the distance does not significantly enhance the accuracy because the inherent noise can make data transfer between centers challenging. Hence, the DCLCN initially models the labels and subsequently refines them to reduce the impact of noise; thus, the MCNL is proposed. The MCNL contains two parts. In the following sections, we will elucidate these two components separately.
Label modeling: To model the labels, the DCLCN uses two sets of label distributions
For label initialization, the source center uses its ground truth label
Correction of noise labels:
where M is a large constant. The softmax function’s rule inherently diminishes the distinction between results approaching values of 0 and 1. Therefore, M is used to make the hard label
Thus, the softmax function is applied to
Cross-entropy loss: The data from the source center have ground truth labels. The DCLCN utilizes the cross-entropy loss to enhance the classification capability of the source center.
Classification loss: To reduce the impact of noise, the model needs to continuously update the label
Compatibility loss: Although the pseudolabels predicted by the model include hard-to-classify and hard-to-transfer plaque predictions, in each subsequent iteration of training, the model’s outcomes should largely align with the initial pseudolabels. This viewpoint has also been confirmed in prior research [26]. Therefore, a compatibility loss function is added to the model. This loss is shown in Eq. (10).
Finally, the overall loss in the second stage is shown in Eq. (11).
where
The goal of this stage is shown in Eq. (12).
DCLCN training is divided into three steps.
Step A To obtain a preliminary model that is more suitable for multicenter plaque classification, the DCLCN uses plaque data from the source center to train the model. The training goal of this step is to minimize the cross-entropy loss, and the goal is shown in Eq. (13).
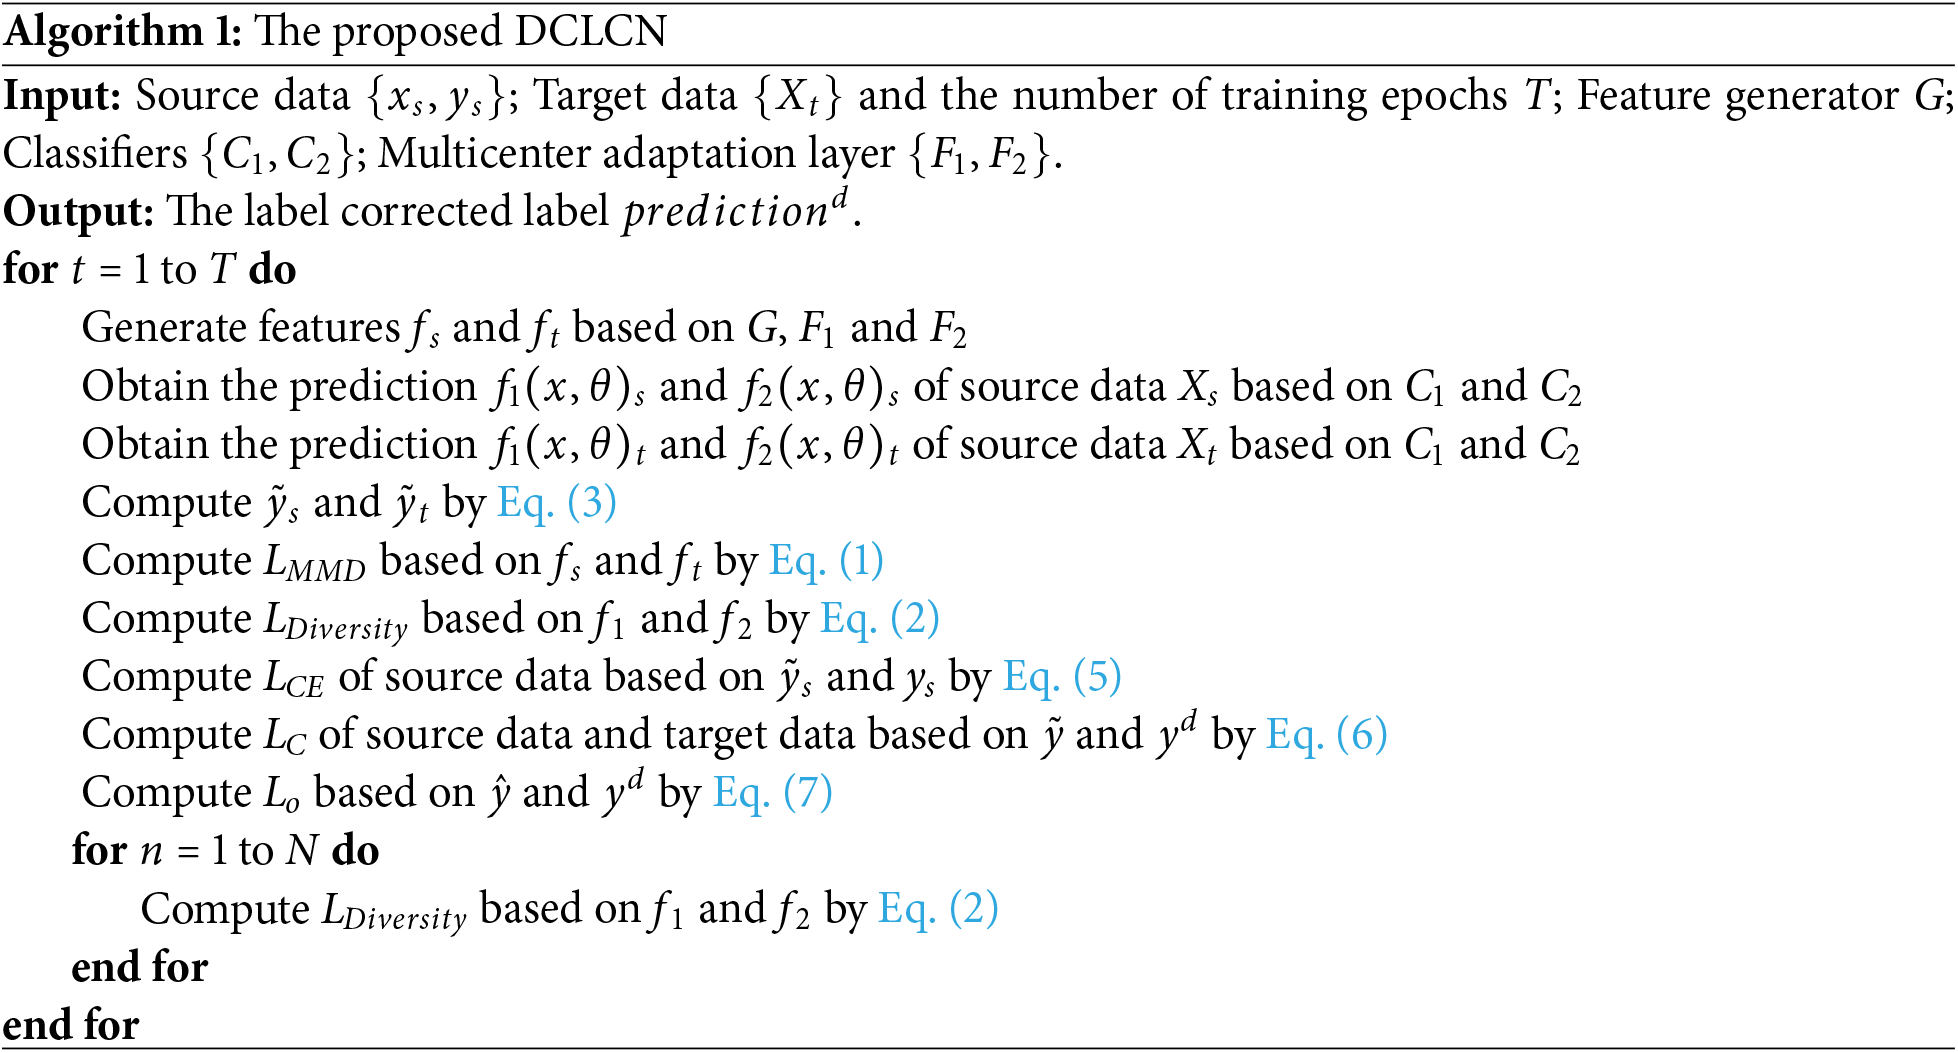
Step B The DCLCN adds data from the target center for training. For a clearer algorithm flow, please refer to Algorithm 1. First, the multicenter field adaptation layer is used to shorten the discrepancy between the target center and source center, and the
Finally, the previous feature extraction part and the multicenter domain adaptation layer are trained to minimize
Step C Through Step B, the model obtains a set of pseudolabels from the target center. The model subsequently used this set of final fixed pseudolabels to perform the final fine-tuning of the target center.
4.1 Performance Evaluation Measures
This study uses accuracy, regression precision and AUC to evaluate the performance of the DCLCN. These four metrics are shown in Eqs. (16)–(20).
where TP, TN, FP, and FN represent the true positive, true negative, false-positive, and false-negative classifications, respectively.
Classification performance metrics with a 95% confidence interval provide robust performance measures while quantifying uncertainty, which is critical for high-stakes applications such as medical imaging. They also enable meaningful comparisons between models, ensuring that statistically significant improvements are accurately identified.
4.2.1 Effect Validation on Six Classification Tasks
To prove the feasibility and advancement of the proposed DCLCN, we conduct experiments for all possible combinations of the three centers (six potential source-to-target center mappings). The results of these efforts are presented in Table 2.
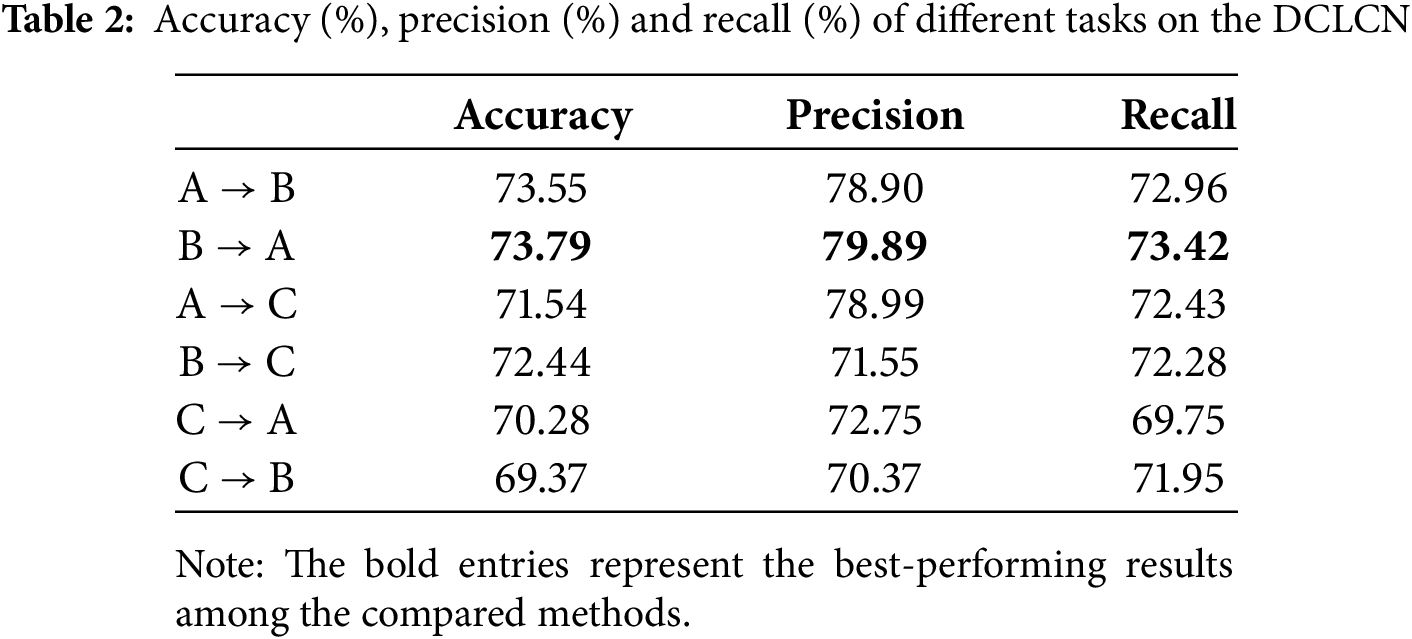
The experimental results show that the accuracy, precision and recall metrics are consistently approximately 70% or greater across the six specified tasks.
In addition, we select one of the 6 tasks (
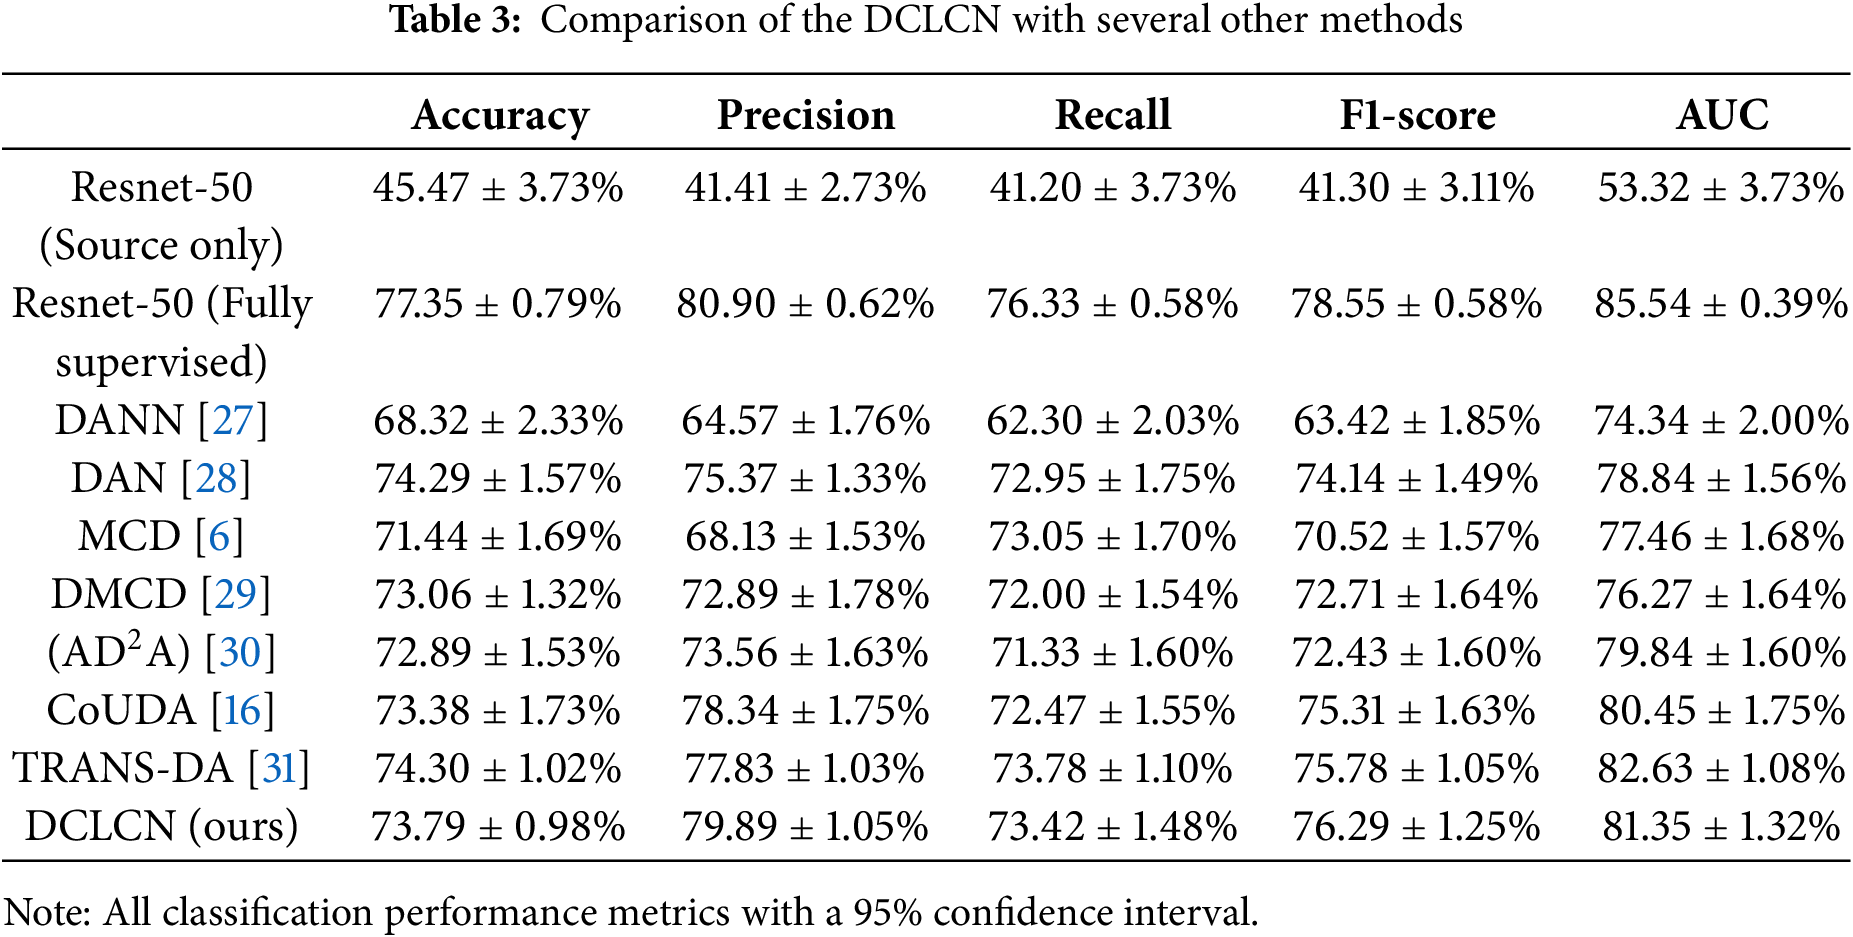
These methods aim to improve cross-domain transfer learning performance. DANN reduces feature distribution discrepancies with adversarial networks; DAN [28] aligns feature distributions for better model generalization; MCD minimizes classifier output differences for improved cross-domain performance; DMCD [29] combines maximum classifier discrepancy and denoising techniques without requiring source domain data;
The DCLCN has demonstrated good performance across the metrics compared to the other semi-supervised approaches for addressing multicenter problems. Although the accuracy of the DCLCN is slightly lower than that of the DAN, the difference in accuracy is minimal (0.5%). However, the DCLCN achieves substantial increases in precision and recall, with a notable 4.52% (79.89% vs. 75.37%) improvement in precision. Additionally, the p-values of the model are all less than 0.05. It can be observed that DCLCN performs lower than TRANS-DA in terms of Accuracy (Acc) and AUC. DCLCN outperforms the second-best model by 2.06 in precision and 0.51 in F1-score. For other metrics, DCLCN ranks second and is very close to the best-performing model. DCLCN is in an optimal or near-optimal position, demonstrating the best performance across all the metrics.
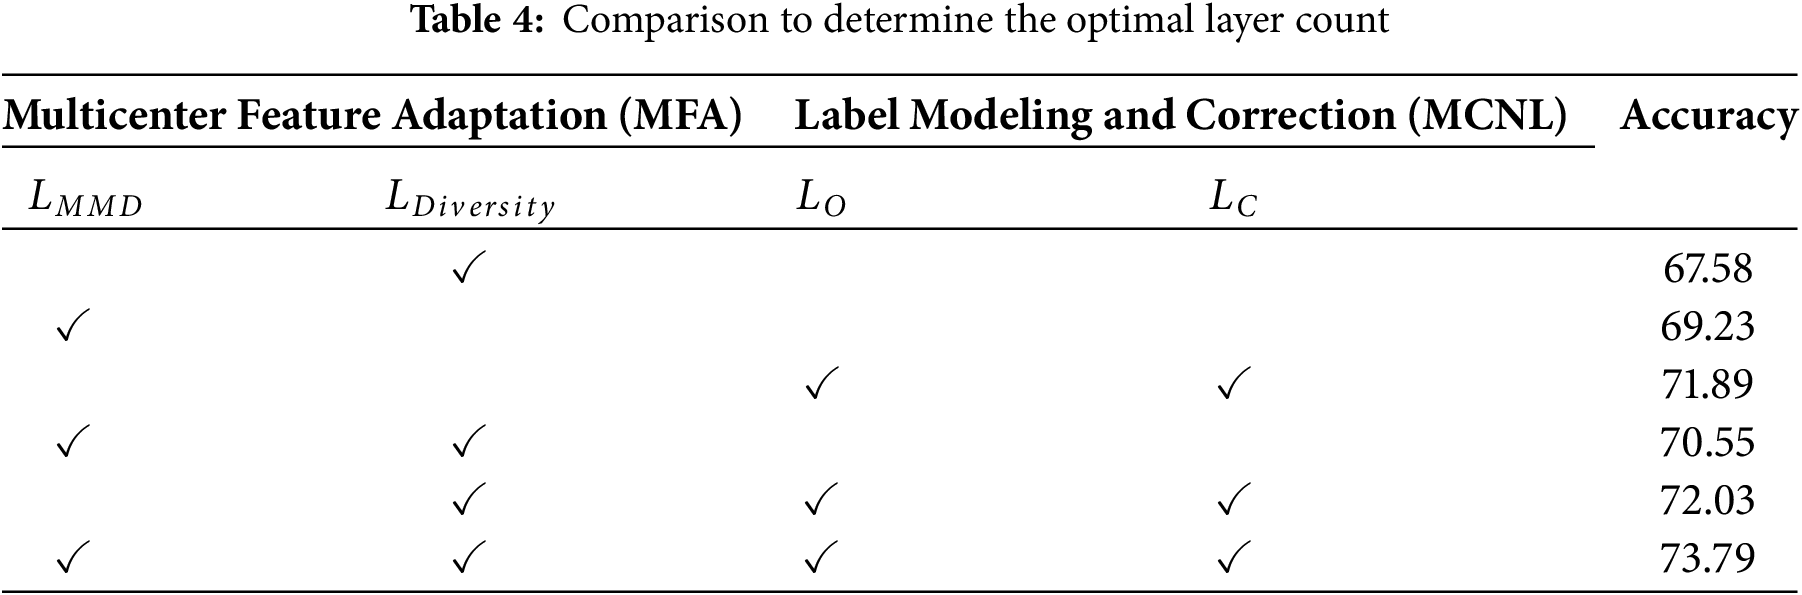
Since the DCLCN involves five loss functions, to prove the rationality of the loss function selected by the method, we conduct ablation experiments. The combined utilization of domain adaptation and two label correction losses significantly contributes to the ultimate classification accuracy. Hence, integrating these two stages proves to be effective in addressing multicenter plaque risk prediction. The findings of these experiments are displayed in Table 4.
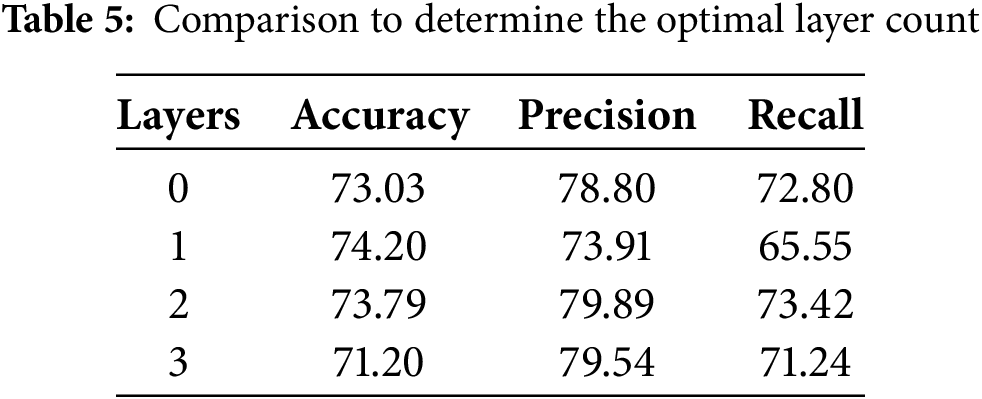
4.2.4 Domain Adaptation Layer Determination
Due to the varying effects of multicenter domain adaptation layers with different numbers on model performance, a series of systematic experiments were conducted to determine the optimal number of layers. The results of these experiments are shown in Table 5. The data from these tests indicate that the inclusion of multicenter domain adaptation layers improves domain adaptation performance.
4.2.5 Pseudo-Label Prediction Accuracy Trend Analyze
In this section, we collected the ratio of correct predictions for pseudo-labels to the total number of pseudo-labels generated during the training process on the B–A dataset and plotted the trend (as shown in Fig. 4). Whether for stable or unstable plaques, the overall trend of pseudo-label accuracy is upward with fluctuations, particularly showing a stable upward trend in the later epochs. This suggests that the pseudo-label generation has strong adaptability and stability. The model’s accuracy curve does align with the quality of pseudo-labels in Fig. 4, further demonstrating that changes in pseudo-labels influence the results. This result validates the effectiveness of the unsupervised domain adaptation method in handling multi–center data, ensuring the model’s predictive stability.
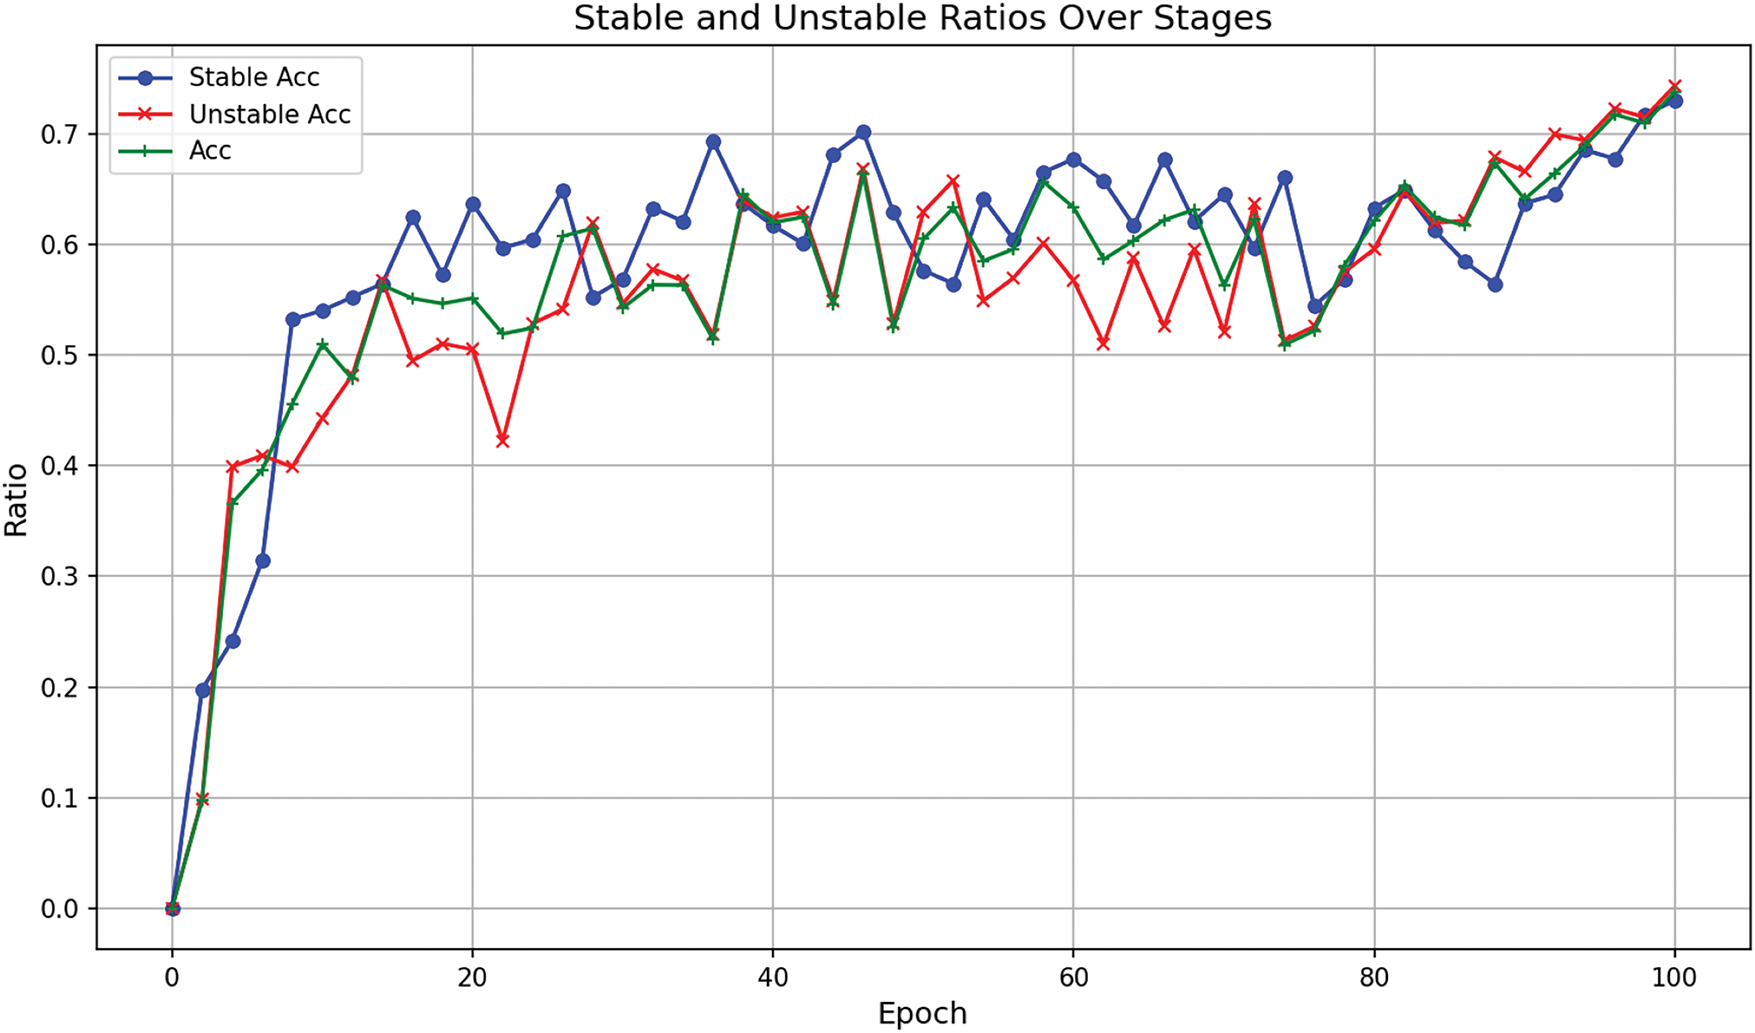
Figure 4: Trend of correct predictions for pseudo-labels in the B-A dataset during training
To validate the classification performance of DCLCN and enhance model interpretability, this section selects the B-A center pairing and employs Grad-CAM [32] to visualize the feature representations of the target center A. Additionally, a comparative visualization analysis is conducted on two baseline models, DANN [27] and MCD [6], as shown in Fig. 5. It can be observed that, compared to the ground truth annotations by medical experts, the DANN model primarily focuses on information outside the blood vessel, failing to adequately attend to the core vascular region. In contrast, while the MCD model demonstrates some degree of focus on the vascular area, its attention remains partially misaligned.
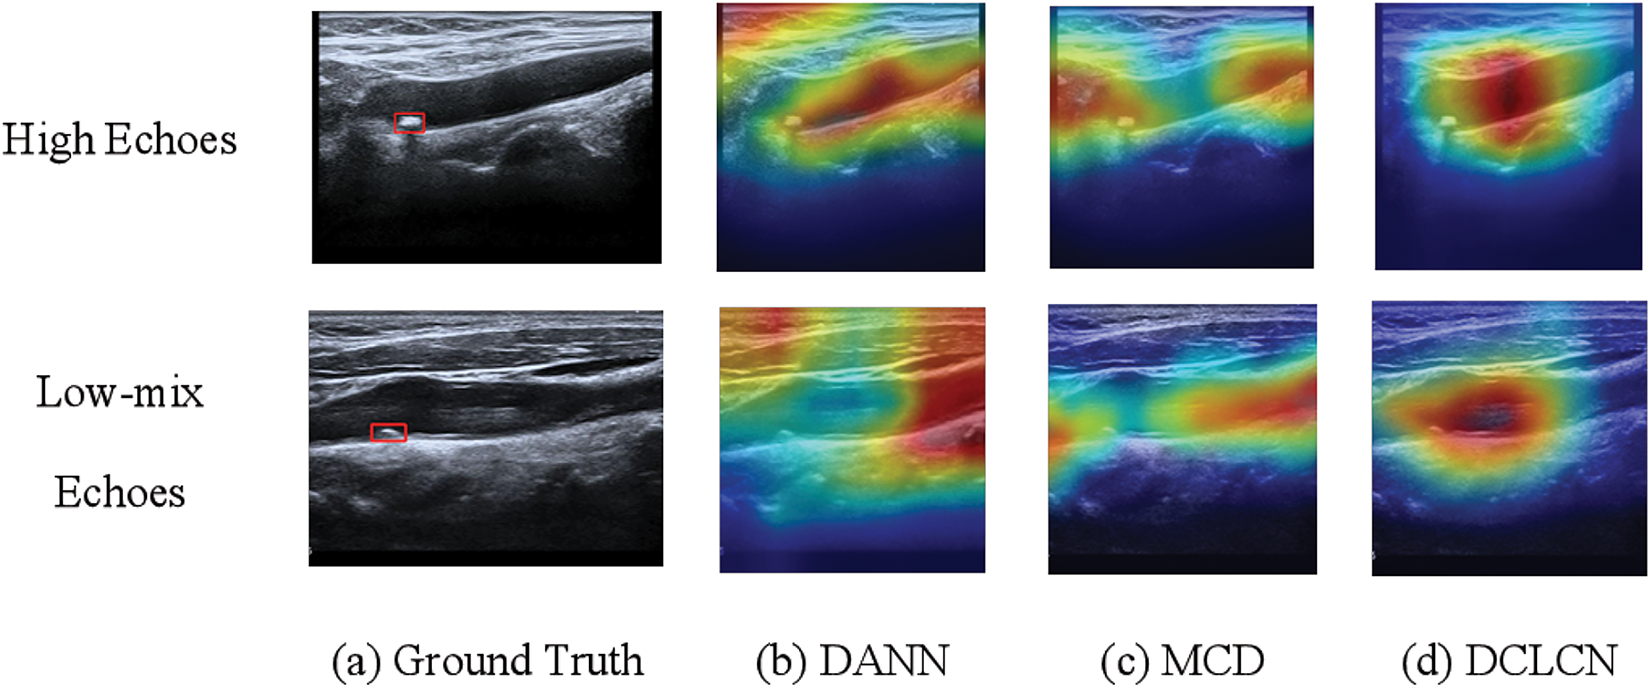
Figure 5: Feature visualization and comparative analysis of DCLCN, DANN, and MCD on target center A
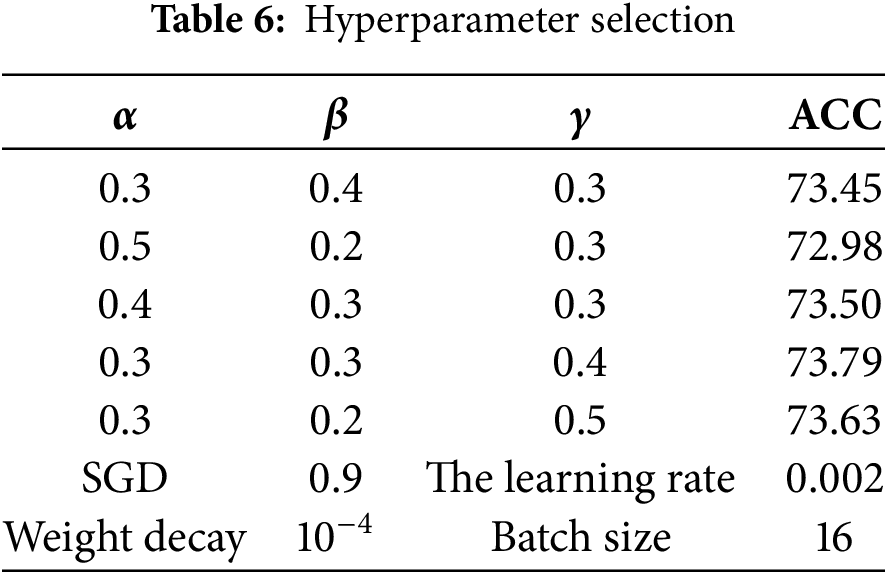
The experiments in this study are based on ResNet-50 and pretraining parameters from ImageNet [33]. The number of epochs is set to 150, of which the first 20 epochs are related to source center pretraining, the next 100 epochs are the dual classifier pseudolabel domain adaptation stage, and the remaining epochs are used to fine-tune the model. To determine the optimal values for the parameters of the loss function, we evaluated various combinations of
In terms of pre-processing, random vertical flipping, random rotation and random horizontal flipping were performed, enhancing the model’s generalization ability and increase data utilization. Specifically, the horizontal flipping and vertical flipping operate on the image randomly with a probability of 0.5, and the random rotation of the image is between 30 and 60.
In Table 3, in contrast to ResNet-50 (source only), which has undergone no multicenter adaptation, all methods have made remarkable advancements, indicating the significance of multicenter research. Nonetheless, when juxtaposed against a fully supervised method, there exists a discernible gap that warrants further investigation. The DMCD and CoUDA are two models that account for noise. Compared with these two methods, the DCLCN yields improvements in all three metrics. CoUDA considers the impact of noisy labels on knowledge transfer, while DMCD addresses noise by incorporating high-confidence samples into the training set. However, neither of these methods considers the influence of ultrasound noise itself on multicenter knowledge transfer.
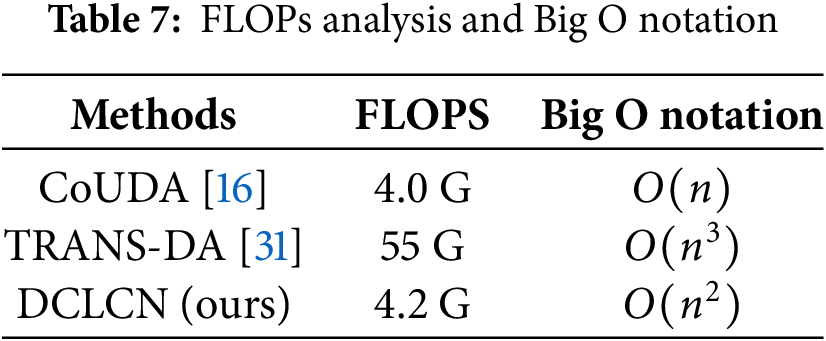
In terms of time complexity, Big O notation and FLOPs analysis are shown in Table 7. CoUDA [16] and TRANS-DA [31] were chosen because CoUDA is based on the CNN framework, and TRANS-DA is based on the Transformer framework, making them representative in terms of complexity. The FLOPs of DCLCN is very close to CoUDA, and an order of magnitude smaller than the Transformer framework. The big O notation of DCLCN exhibits lower complexity than TRANS-DA, while higher than CoUDA. However, DCLCN outperforms CoUDA on all metrics of classification performance (as shown in Table 3).
In this study, datasets from three different centers were used. Although these datasets provided valuable cross-center learning opportunities, the limited number of data sources may somewhat affect the model’s generalizability and performance. The collection of medical images is subject to objective constraints. Currently, the number of centers is typically limited to 2–3 in multi-center studies of ultrasound images, with an average of about 300 samples per center [18]. The data collected in our study is similar to this scale, and will be expanded to include data from more centers to further validate the model’s robustness in future work.
Existing deep learning models for carotid artery ultrasound images typically rely on data from a single center, and extending them to multiple centers often leads to a significant drop in accuracy due to center-specific differences and ultrasound image noise. To address this, we propose an unsupervised domain adaptation method, DCLCN, for predicting the risk of multicenter plaques. DCLCN incorporates the MFA and label modeling and correction modules to mitigate discrepancies and noise between centers. While it shows promising results on three ultrasound datasets, its performance still lags behind fully supervised models. Future work will focus on improving DCLCN by integrating multimodal and multicenter data, along with expert collaboration, to enhance clinical diagnosis.
Acknowledgement: This work is supported by Shanghai Technical Service Computing Center of Science and Engineering, Shanghai University.
Funding Statement: This research was partly funded by Science and Technology Commission of Shanghai Municipality, grant numbers 22dz1202000, 23002460100.
Author Contributions: Louyi Jiang: Study conception and design; Analysis and interpretation of results; Methodology; Verification; Draft manuscript preparation. Sulei Wang: Data collection; Analysis and interpretation of results; Draft manuscript preparation; Writing review & editing. Wei Shao: Study conception and design; Project administration; Supervision. Jiang Xie: Study conception and design; Writing review & editing; Project administration; Supervision. Haiya Wang: Data collection; Project administration; Supervision; Visualization. All authors reviewed the results and approved the final version of the manuscript.
Availability of Data and Materials: Due to ethical and privacy concerns, it is not convenient to share this data and material.
Ethics Approval: This research was conducted with human volunteers, and all participating human volunteers provided informed consent.
Conflicts of Interest: The authors declare no conflicts of interest to report regarding the present study.
References
1. Tsao CW, Aday AW, Almarzooq ZI, Alonso A, Beaton AZ, Bittencourt MS, et al. Heart disease and stroke statistics-2022 update: a report from the American Heart Association. Circulation. 2022;145(8):e153–639. [Google Scholar] [PubMed]
2. Libby P. Inflammation and cardiovascular disease mechanisms. Am J Clin Nutr. 2006;83(2):456S–60S. [Google Scholar] [PubMed]
3. Alsheikh-Ali AA, Kitsios GD, Balk EM, Lau J, Ip S. The vulnerable atherosclerotic plaque: scope of the literature. Ann Internal Med. 2010;153(6):387–95. [Google Scholar]
4. Salem M, Bown M, Sayers R, West K, Moore D, Nicolaides A, et al. Identification of patients with a histologically unstable carotid plaque using ultrasonic plaque image analysis. Eur J Vasc Endovasc Surg. 2014;48(2):118–25. [Google Scholar] [PubMed]
5. Saba L, Sanagala SS, Gupta SK, Koppula VK, Johri AM, Sharma AM, et al. Ultrasound-based internal carotid artery plaque characterization using deep learning paradigm on a supercomputer: a cardiovascular disease/stroke risk assessment system. Int J Cardiovasc Imaging. 2021;37:1511–28. [Google Scholar] [PubMed]
6. Saito K, Watanabe K, Ushiku Y, Harada T. Maximum classifier discrepancy for unsupervised domain adaptation. In: Proceedings of the IEEE Conference on Computer Vision and Pattern Recognition; 2018; Computer Vision Foundation. p. 3723–32. [Google Scholar]
7. Giglioni V, Poole J, Venanzi I, Ubertini F, Worden K. A domain adaptation approach to damage classification with an application to bridge monitoring. Mech Syst Signal Process. 2024;209(2):111135. doi:10.1016/j.ymssp.2024.111135. [Google Scholar] [CrossRef]
8. Abdalla A, Wheeler TA, Dever J, Lin Z, Arce J, Guo W. Assessing fusarium oxysporum disease severity in cotton using unmanned aerial system images and a hybrid domain adaptation deep learning time series model. Biosyst Eng. 2024;237(6):220–31. doi:10.1016/j.biosystemseng.2023.12.014. [Google Scholar] [CrossRef]
9. Chamarthi S, Fogelberg K, Brinker TJ, Niebling J. Mitigating the influence of domain shift in skin lesion classification: a benchmark study of unsupervised domain adaptation methods. Inform Med Unlocked. 2024;44(11):101430. doi:10.1016/j.imu.2023.101430. [Google Scholar] [CrossRef]
10. Yousuf M, Nobi M. A new method to remove noise in magnetic resonance and ultrasound images. J Sci Res. 2011;3(1):81–1. doi:10.3329/jsr.v3i1.5544. [Google Scholar] [CrossRef]
11. Müller HFG, Viaccoz A, Kuzmanovic I, Bonvin C, Burkhardt K, Bochaton-Piallat ML, et al. Contrast-enhanced ultrasound imaging of carotid plaque neo-vascularization: accuracy of visual analysis. Ultrasound Med Biol. 2014;40(1):18–24. doi:10.1016/j.ultrasmedbio.2013.08.012. [Google Scholar] [PubMed] [CrossRef]
12. Skandha SS, Gupta SK, Saba L, Koppula VK, Johri AM, Khanna NN, et al. 3-D optimized classification and characterization artificial intelligence paradigm for cardiovascular/stroke risk stratification using carotid ultrasound-based delineated plaque: atheromaticTM 2.0. Comput Biol Med. 2020;125(10):103958. doi:10.1016/j.compbiomed.2020.103958. [Google Scholar] [PubMed] [CrossRef]
13. Xie J, Li Y, Xu X, Wei J, Li H, Wu S, et al. CPTV: classification by tracking of carotid plaque in ultrasound videos. Comput Med Imaging Graph. 2023;104:102175. doi:10.1016/j.compmedimag.2022.102175. [Google Scholar] [PubMed] [CrossRef]
14. Altan G. Deep learning-based mammogram classification for breast cancer. Int J Intell Syst Appl Eng, 2020;8:171–6. doi:10.18201/ijisae.2020466308. [Google Scholar] [CrossRef]
15. Altan G. DeepOCT: an explainable deep learning architecture to analyze macular edema on OCT images. Eng Sci Technol, Int J. 2022;34(23):101091. doi:10.1016/j.jestch.2021.101091. [Google Scholar] [CrossRef]
16. Zhang Y, Wei Y, Wu Q, Zhao P, Niu S, Huang J, et al. Collaborative unsupervised domain adaptation for medical image diagnosis. IEEE Trans Image Process. 2020;29:7834–44. doi:10.1109/TIP.2020.3006377. [Google Scholar] [CrossRef]
17. Yu Z, Liu Y, Dai X, Cui E, Cui J, Ma C. Enhancing preoperative diagnosis of microvascular invasion in hepatocellular carcinoma: domain-adaptation fusion of multi-phase CT images. Front Oncol. 2024;14:1332188. doi:10.3389/fonc.2024.1332188. [Google Scholar] [PubMed] [CrossRef]
18. Seoni S, Shahini A, Meiburger KM, Marzola F, Rotunno G, Acharya UR, et al. All you need is data preparation: a systematic review of image harmonization techniques in Multi-center/device studies for medical support systems. Comput Methods Programs Biomed. 2024;250(9):108200. doi:10.1016/j.cmpb.2024.108200. [Google Scholar] [PubMed] [CrossRef]
19. Ying X, Zhang Y, Wei X, Yu M, Zhu J, Gao J, et al. MSDAN: multi-scale self-attention unsupervised domain adaptation network for thyroid ultrasound images. In: 2020 IEEE International Conference on Bioinformatics and Biomedicine (BIBM); 2020; IEEE. p. 871–6. [Google Scholar]
20. Xie S, Zheng Z, Chen L, Chen C. Learning semantic representations for unsupervised domain adaptation. In: International Conference on Machine Learning. Proceedings of Machine Learning Research; 2018; PMLR Microtome Publishing. p. 5423–32. [Google Scholar]
21. Xu Y, Gong M, Xie S, Batmanghelich K. Box-adapt: domain-adaptive medical image segmentation using bounding boxsupervision. arXiv:2108.08432. 2021. [Google Scholar]
22. Shi P, Xin J, Zheng N. Correcting pseudo labels with label distribution for unsupervised domain adaptive vulnerable plaque detection. In: 2021 43rd Annual International Conference of the IEEE Engineering in Medicine & Biology Society (EMBC); 2021;IEEE. p. 3225–8. [Google Scholar]
23. Fuster V, Moreno PR, Fayad ZA, Corti R, Badimon JJ. Atherothrombosis and high-risk plaque: Part I: evolving concepts. J Am Coll Cardiol. 2005;46(6):937–54. doi:10.1016/j.jacc.2005.03.074. [Google Scholar] [PubMed] [CrossRef]
24. Borgwardt KM, Gretton A, Rasch MJ, Kriegel HP, Schölkopf B, Smola AJ. Integrating structured biological data by kernel maximum mean discrepancy. Bioinformatics. 2006;22(14):e49–57. doi:10.1093/bioinformatics/btl242. [Google Scholar] [PubMed] [CrossRef]
25. Li S, Lv F, Xie B, Liu CH, Liang J, Qin C. Bi-classifier determinacy maximization for unsupervised domain adaptation. Proc AAAI Conf Artif Intell. 2021;35(10):8455–64. doi:10.1609/aaai.v35i10.17027. [Google Scholar] [CrossRef]
26. Yi K, Wu J. Probabilistic end-to-end noise correction for learning with noisy labels. In: Proceedings of the IEEE/CVF Conference on Computer Vision and Pattern Recognition; 2019; Computer Vision Foundation. p. 7017–25. [Google Scholar]
27. Ganin Y, Lempitsky V. Unsupervised domain adaptation by backpropagation. In: Proceedings of the 32nd International Conference on Machine Learning. Proceedings of Machine Learning Research; 2015; PMLR, Microtome Publishing. p. 1180–9. [Google Scholar]
28. Long M, Cao Y, Wang J, Jordan M. Learning transferable features with deep adaptation networks. In: Proceedings of the 32nd International Conference on Machine Learning. Proceedings of Machine Learning Research; 2015; PMLR, Microtome Publishing. p. 97–105. [Google Scholar]
29. Chu T, Liu Y, Deng J, Li W, Duan L. Denoised maximum classifier discrepancy for source-free unsupervised domain adaptation. Proc AAAI Conf Artif Intell. 2022;36(1):472–80. doi:10.1609/aaai.v36i1.19925. [Google Scholar] [CrossRef]
30. Guan H, Liu Y, Yang E, Yap PT, Shen D, Liu M. Multi-site MRI harmonization via attention-guided deep domain adaptation for brain disorder identification. Med Image Anal. 2021;71(3):102076. doi:10.1016/j.media.2021.102076. [Google Scholar] [PubMed] [CrossRef]
31. Ye Y, Fu S, Chen J. Learning cross-domain representations by vision transformer for unsupervised domain adaptation. Neur Comput Appl. 2023;35(15):10847–60. doi:10.1007/s00521-023-08269-7. [Google Scholar] [CrossRef]
32. Selvaraju RR, Das A, Vedantam R, Cogswell M, Parikh D, Batra D. Grad-CAM: why did you say that? arXiv:161107450. 2016. [Google Scholar]
33. Deng J, Dong W, Socher R, Li LJ, Li K, Fei-Fei L. ImageNet: a large-scale hierarchical image database. In: 2009 IEEE Conference on Computer Vision and Pattern Recognition; 2009;IEEE . p. 248–55. [Google Scholar]
Cite This Article
 Copyright © 2025 The Author(s). Published by Tech Science Press.
This work is licensed under a Creative Commons Attribution 4.0 International License , which permits unrestricted use, distribution, and reproduction in any medium, provided the original work is properly cited.
 Downloads
 Citation Tools