
 Submit a Paper
 Propose a Special lssue
 Open Access
ARTICLE

Enhancing Medical Image Classification with BSDA-Mamba: Integrating Bayesian Random Semantic Data Augmentation and Residual Connections
1 School of Artificial Intelligence, Nanjing University of Information Science and Technology, Nanjing, 210044, China
2 School of Computer Science, Nanjing University of Information Science and Technology, Nanjing, 210044, China
3 Electrical & Computer Engineering, University of Illinois at Urbana Champaign, Urbana, IL 61801, USA
* Corresponding Author: Yaohua Xu. Email:
(This article belongs to the Special Issue: Novel Methods for Image Classification, Object Detection, and Segmentation)
Computers, Materials & Continua 2025, 83(3), 4999-5018. https://doi.org/10.32604/cmc.2025.061848
Received 04 December 2024; Accepted 07 March 2025; Issue published 19 May 2025
 View Full Text
 Download PDF
Abstract
Medical image classification is crucial in disease diagnosis, treatment planning, and clinical decision-making. We introduced a novel medical image classification approach that integrates Bayesian Random Semantic Data Augmentation (BSDA) with a Vision Mamba-based model for medical image classification (MedMamba), enhanced by residual connection blocks, we named the model BSDA-Mamba. BSDA augments medical image data semantically, enhancing the model’s generalization ability and classification performance. MedMamba, a deep learning-based state space model, excels in capturing long-range dependencies in medical images. By incorporating residual connections, BSDA-Mamba further improves feature extraction capabilities. Through comprehensive experiments on eight medical image datasets, we demonstrate that BSDA-Mamba outperforms existing models in accuracy, area under the curve, and F1-score. Our results highlight BSDA-Mamba’s potential as a reliable tool for medical image analysis, particularly in handling diverse imaging modalities from X-rays to MRI. The open-sourcing of our model’s code and datasets, will facilitate the reproduction and extension of our work.Keywords
Medical imaging, a cornerstone of modern healthcare, plays a critical role in early disease detection, accurate diagnosis, treatment planning, therapeutic assessment, and medical research by providing detailed images of the internal structures and functions of the human body [1]. It significantly enhances clinical decision-making, improves patient care quality, and fosters the advancement of personalized and remote medical services, thereby contributing substantially to the overall improvement of global healthcare standards.
The rapid progress of deep learning in the field of medical imaging has notably enhanced the accuracy and efficiency of disease detection and diagnosis [2,3]. Deep learning models have driven significant advancements in medical image analysis, including tasks such as classification, segmentation, detection, and image registration [4]. Furthermore, deep learning has enabled the development of computer-aided diagnostic (CAD) systems, which support clinicians by improving the interpretation of medical images and facilitating more accurate, objective diagnostic decisions [5,6].
Recent studies have indicated that VMamba, as an innovative Visual State Space Model (VSSM) [7], combines the linear complexity of Convolutional Neural Networks (CNNs) [8–10] with the global receptive field and dynamic weight advantages of Vision Transformers (ViTs) [11–13]. By introducing a Cross-Scan Module (CSM), VSSM addresses visual data’s non-causality and direction sensitivity issues, enabling the model to integrate information from different directions without increasing computational complexity and forming a global receptive field. In experiments, VMamba has shown superior results in visual tasks, including image categorization, object localization, and semantic segmentation. Particularly in handling high-resolution images, its performance exceeds existing benchmark models. The MedMamba model is an extension of the Mamba model, specifically designed for medical image classification tasks. It incorporates an SS-Conv-SSM module that combines the local feature extraction capabilities of convolutional layers with the ability of state space models (SSM) to detect long-range dependencies, efficiently modeling various types of medical images and having broad prospects in medical image classification [14]. Data augmentation has gradually become a commonly employed method in medical imaging [15]. As an advanced data augmentation technology, Bayesian Random Semantic Data Augmentation (BSDA) [16] has caught our attention. It augments medical image data using Bayesian theory, thereby enhancing the model’s generalization ability and classification performance. BSDA improves the model’s ability to recognize different image features by simulating random variations in medical images, such as noise, blurring, and deformation, which is especially crucial in medical image classification. With BSDA, the performance of medical image classification models can be effectively enhanced, making them more accurate and reliable in practical applications.
Building upon these studies, we conceived the idea of integrating MedMamba with BSDA for application in medical image classification to explore if it could yield better outcomes. Based on this concept, we successfully achieved the combination of MedMamba and BSDA, proposing the BSDA-Mamba, and adding residual connection blocks to MedMamba. Through comprehensive experiments on eight medical image datasets, we validated the potential of the BSDA-Mamba model in medical image classification. Specifically, we carried out extensive classification experiments on eight medical image datasets containing 2D and 3D images, and the results suggest that the overall performance of BSDA-Mamba surpasses that of its predecessor MedMamba, and some other classification models, showcasing significant competitiveness.
The primary contributions of this paper can be outlined as follows:
(1) To improve the classification performance of medical images and the generalization ability of the model, we combined MedMamba with Bayesian Random Semantic Data Augmentation and integrated residual connection blocks in the model, successfully developing the BSDA-Mamba model for medical image classification.
(2) Classification testing on eight datasets revealed that BSDA-Mamba performs well in medical image classification.
(3) Employing the Grad-CAM (Gradient-weighted Class Activation Mapping) technique in processing the Brain Tumor Magnetic Resonance Imaging (MRI) image dataset, the attention of BSDA-Mamba and other models to the images was presented as heat maps.
(4) Combining MedMamba with Bayesian Random Semantic Data Augmentation,implies strengthening the model’s robustness and accuracy based on the model’s efficient architecture through data augmentation technology. This combination not only improves the accuracy of medical image classification but also facilitates the model’s deployment in real-world medical applications, particularly in resource-constrained settings.
Using BSDA-Mamba to classify medical images, healthcare professionals can diagnose diseases accurately and efficiently, enabling better treatment for patients. The remainder of this paper is organized as follows. Section 2 provides an overview of the pertinent literature. Section 3 outlines the approach taken in this study. The empirical results are analyzed and discussed in Section 4. The conclusions of this research and future work are presented in Section 5.
Image classification is a critical task in deep learning, particularly in fields such as medical and agricultural imaging [17,18], where the availability of large annotated datasets is often limited. Achieving satisfactory performance under such constraints presents a significant challenge. To overcome this issue, data augmentation has emerged as a highly effective solution [19]. In this section, we will explore several deep learning models and data augmentation techniques employed in the context of medical image classification.
2.1 Related Studies on Image Classification
Previously, numerous studies have showcased various deep learning models applicable to image classification, exerting a profound impact on image classification. He et al. [9] proposed a novel network structure, the Residual Network (ResNet). This approach reconfigures the network layers to focus on learning the residual functions of the input, rather than directly learning non-referenced functions, facilitating easier network optimization and enhancing accuracy with increased depth. Huang et al. [10] introduced a novel convolutional neural network architecture, the Dense Convolutional Network (DenseNet), which significantly improves information and gradient flow, reduces the number of parameters, and enhances feature reuse by implementing dense connection patterns within the network, where each layer is linked to all preceding layers. DenseNet achieves superior performance through this design compared to existing techniques on multiple benchmark datasets while demonstrating higher computational efficiency, validating its effectiveness and superiority in deep learning and image recognition tasks. Howard [20] presented a streamlined convolutional neural network framework, MobileNets, designed specifically for mobile and embedded vision applications. This framework is based on a reduced-complexity design, leveraging depthwise separable convolutions to create nimble deep neural networks. The paper suggests a pair of simple global hyperparameters, namely the width and resolution multipliers, to manage the trade-off between latency and accuracy adeptly, enabling developers to choose the appropriate model scale based on the resource constraints of their application, such as response time and model size. Liu et al. [12] introduced an innovative vision transformer framework, the Swin Transformer, which enables linear scalability with input image dimensions through a hierarchical feature representation approach and a dynamic window-based self-attention mechanism. Swin Transformer has achieved significant performance enhancements in various visual tasks, including image classification, object detection, and semantic segmentation, outperforming previous state-of-the-art methods and demonstrating its potential as a general visual model backbone. Zu et al. [21] presented a novel deep learning model named RESwinT, specifically designed for pollen image classification. This model enhanced the model’s receptive field and feature recognition ability by integrating parallel window transformer blocks, context information aggregation, and coordinate attention modules. Experimental results on a dataset of eight types of allergic pollen in Beijing, China demonstrated that RESwinT achieved state-of-the-art performance in the pollen image classification task. Liu et al. [7] proposed a visual state space model, VMamba, which is an efficient visual network architecture that achieves linear time complexity processing capability by applying the state space model to visual data, using 2D-Selective-Scan (SS2D) modules and a series of architectural and implementation optimizations. This model has exhibited excellent performance in multiple visual tasks and is the foundation for implementing this study. Subsequently, Yue et al. [14] developed MedMamba, a medical image classification model based on the Mamba framework of the state space model (SSM). By integrating the local feature extraction capabilities of convolutional layers with the long-range dependency-capturing ability of SSM, MedMamba effectively models various modalities of medical images.
2.2 Related Studies on Data Augmentation
Over the past decade, numerous data augmentation methods have been applied in computer vision. DeVries [22] proposed a simple regularization approach called “Cutout”, which enhances the robustness and effectiveness of convolutional neural networks. It achieves this by randomly masking square patches of the input images during training. This technique is easy to implement and can be integrated with existing data augmentation practices and other regularization strategies to improve model performance further. Cubuk et al. [23] presented an automated data augmentation strategy search method named “Auto Augment”, which designs a search space containing multiple sub-strategies, each consisting of two image processing operations such as translation, rotation, color adjustment, etc., along with the probability and magnitude of applying these operations. The paper proposes a search algorithm based on reinforcement learning to find the optimal augmentation strategy, enabling neural networks to achieve the highest validation accuracy on the specified dataset. Park et al. [24] introduced a simple data augmentation technique called Spec Augment for tasks in automatic speech recognition. This method is directly applied to the neural networks’ feature inputs (i.e., filter bank coefficients), including distortion of the time axis, block masking of frequency channels, and block masking of time steps. By applying Spec Augment to the Listen, Attention, and Spell (LAS) network, the authors achieved state-of-the-art performance on the LibriSpeech 960 h and Switchboard 300 h tasks, outperforming all previous works and achieving significant results without language models. Chen et al. [25] proposed an improved contrastive learning method, “Momentum Contrast” (MoCo) version 2 (MoCo v2), which enhances the effectiveness of unsupervised learning by implementing two design improvements in SimCLR within the MoCo framework—using a multi-layer perceptron (MLP) projection head and more substantial data augmentation. These simple modifications allow MoCo v2 to surpass SimCLR’s performance without needing large-scale training and can run on standard 8-GPU machines, making state-of-the-art unsupervised learning research more accessible. Bochkovskiy et al. [26] introduced YOLOv4, a model that outperforms current object detection systems in terms of speed and accuracy. YOLOv4 achieves real-time speed and high accuracy on the MS COCO dataset. These results are attributed to the integration of innovative techniques such as weight residual links, cross-stage partial networks, batch normalization across small groups, adversarial training with adaptability, the Mish activation function, data augmentation using Mosaic, regularization via DropBlock, and the utilization of the CIoU loss function. Zhu et al. [16] proposed the Bayesian Random Semantic Data Augmentation (BSDA) method for medical image classification. BSDA improves the performance of deep learning models by semantically enhancing the original feature vectors in the feature space, generating new sample features. This method uses variational Bayesian estimation to improve the amplitude distribution. It augments the original features through randomly selected semantic directions without requiring manual design or computationally intensive search, making the data augmentation process efficient and easy to implement. It is also due to the efficient performance of BSDA that BSDA-Mamba can perform efficiently in medical image classification.
To enable readers to have a better understanding of our model, we will provide a detailed overview of the architecture and computational methods that make up each component of BSDA-Mamba here.
Before presenting the BSDA-Mamba model, we need to initially introduce modern State Space Models (SSM), specifically the Structured State Space Sequence Model (S4) and Mamba. In the S4 model, sequence data is regarded as continuous signals in the state space, and the state evolution is modeled via a set of linear transformations. The exact mathematical formulation is provided below:
The first formula represents the state update equation, which is used to calculate the state
Fig. 1 illustrates the BSDA-Mamba framework, an integrated approach for medical image classification that unifies BSDA with the MedMamba model. The framework operates as follows: Initially, the input image is processed by the MedMamba neural network, where it is divided into smaller patches by the PatchEmbed2D layer and projected into a high-dimensional feature space. These features then proceed to the Visual State Space Layer (VSSLayer) for further refinement. The VSSLayer incorporates multiple SS-Conv-SSM modules, which integrate self-attention mechanisms, convolutional operations, and residual connections to process image data and extract representative features efficiently.
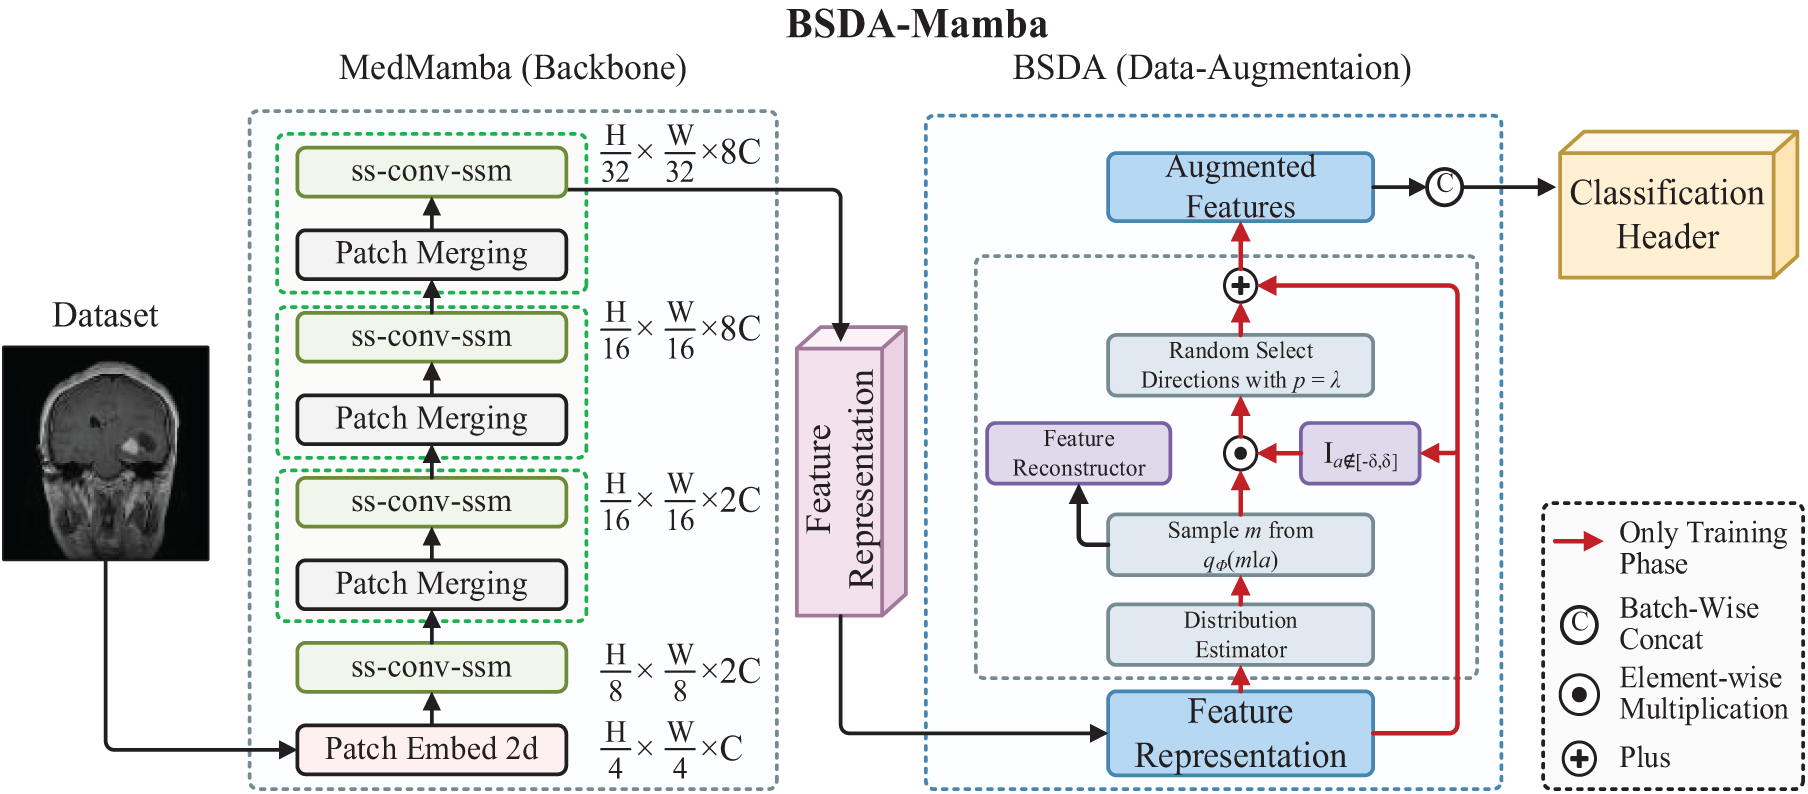
Figure 1: The overall architecture of the BSDA-Mamba
Subsequently, the feature representations are subjected to BSDA for augmentation. During this phase, BSDA introduces semantic amplitudes in the feature space, generating new sample features that retain the original category but exhibit varied semantic content. This augmentation diversifies the training dataset, enabling the model to generalize from specific training features to novel, unseen data, thereby bolstering the model’s generalization capabilities. Ultimately, the augmented features are fed into a classifier to make the final classification decision and predict the category. The framework seamlessly integrates feature extraction, enhancement through data augmentation, and classification prediction, aiming to enhance the model’s performance and accuracy.
In the BSDA-Mamba framework, as depicted in Fig. 1, the MedMamba component comprises a patch embedding layer, VSSLayer blocks, and a patch merging layer. The pipeline begins with the patch embedding layer, which segments the input image into non-overlapping 4 × 4 patches and maps them into an embedding space. This transformation changes the image’s original format (height H, width W, with 3 color channels) into a new dimension, with C representing the embedding dimension, defaulting to 96. Before entering the main network, layer normalization is applied to the embedded images to expedite the training process and mitigate the influence of weight initialization on the model.
The main network is organized into four stages, each followed by a patch merging layer after the initial three. These layers combine adjacent patches, reducing the spatial dimensions of the feature map while increasing the channel count. This strategy enhances feature depth and condenses the image’s spatial information. The four stages of the main network utilize [2, 2, 4, 2] SS-Conv-SSM blocks, with each stage possessing varying channel capacities [C, 2C, 4C, 8C], allowing the model to comprehend information at multiple scales.
As shown in Figs. 2 and 3, each VSSLayer houses multiple SS-Conv-SSM blocks and incorporates residual connection blocks. The input image
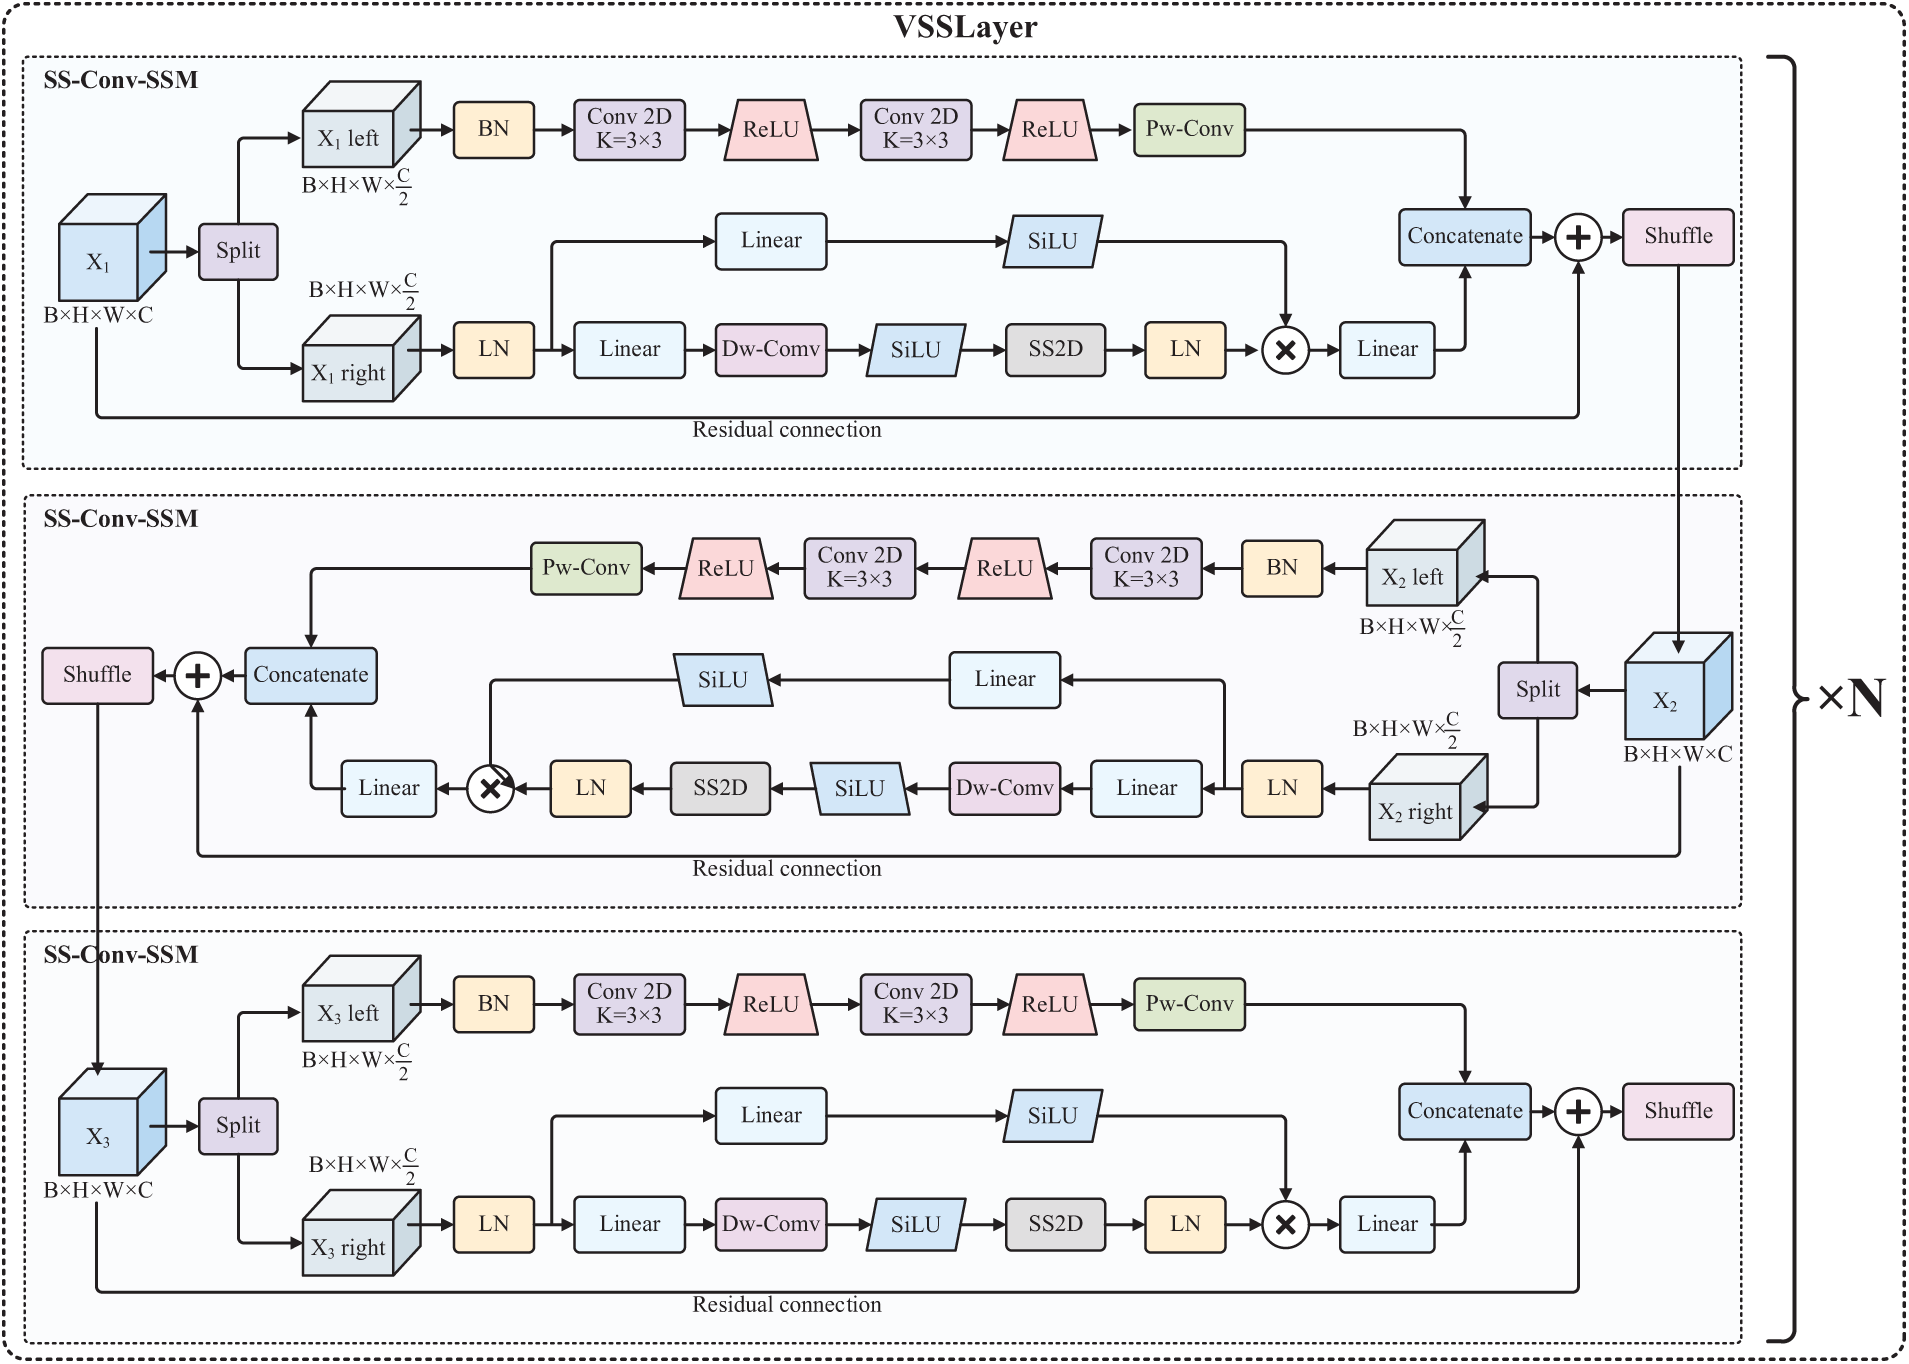
Figure 2: The architecture of VSSLayer
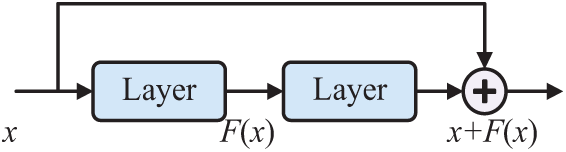
Figure 3: The architecture of residual connection block
In the final stage of the SS-Conv-SSM module, the output feature maps from both branches are combined along the channel axis, and an efficient operation without parameters—channel shuffling—is used to facilitate information exchange between the two sub-input channels. It should be pointed out that the SSM branch and Conv branch typically use SiLU and ReLU activation functions, respectively [27,28].
The essence of SS2D is the extension of efficient one-dimensional selective scanning techniques to two-dimensional imagery, facilitating the creation of a global receptive field and the integration of contextual information. As illustrated in Fig. 4 and Algorithm 1, this process is articulated in three principal stages: Initially, the input image is partitioned into smaller blocks and linearized along four distinct traversals during the Cross-Scan phase; subsequently, each sequence undergoes parallel processing through discrete S6 blocks (selective SSM), a phase referred to as Selective Scanning; ultimately, in the Cross Merge phase, the sequences are restructured and consolidated to produce the output two-dimensional feature map. This methodology enables profound image comprehension and feature extraction, all while maintaining a linear computational complexity.
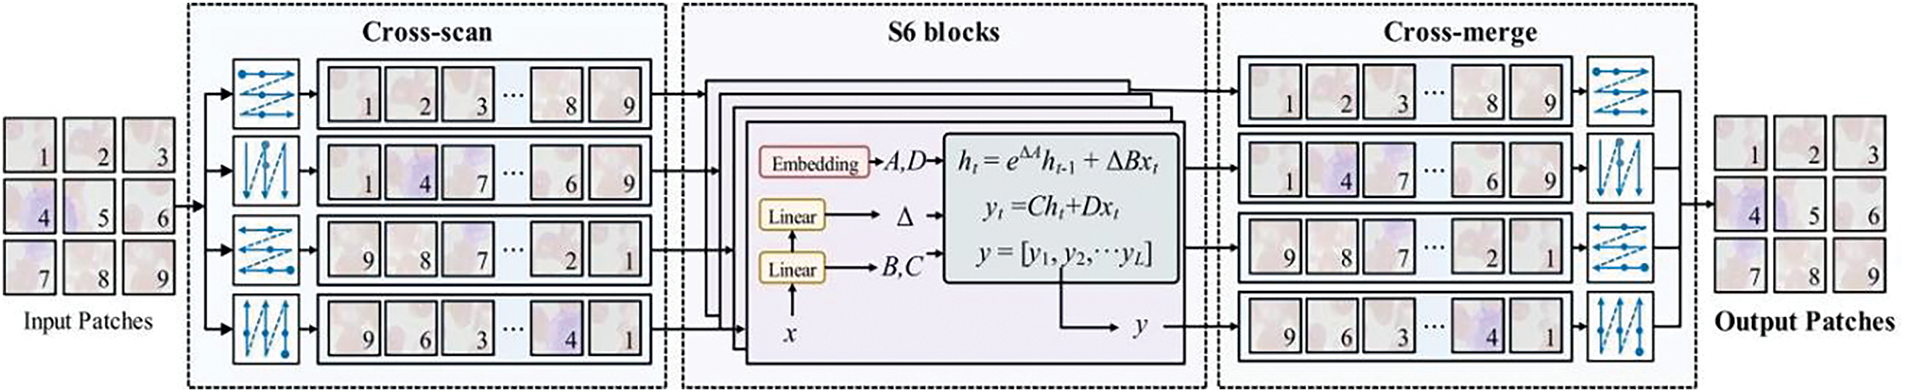
Figure 4: The application of SS2D in feature maps, in which the image is first processed through scan extension techniques, and then the four features obtained are independently processed through S6 blocks. Finally, these processed features are integrated into the final 2D feature map through a scan merging step for efficient image analysis

3.3 Bayesian Random Semantic Data Augmentation
Traditional data augmentation methods, such as random rotation, scaling, cropping, or color transformation, typically operate at the pixel level. Although these methods can increase the diversity of data, they do not directly enhance the semantic content of images and may not have a significant impact on the classification performance of the model. However, Bayesian Random Semantic Data Augmentation is an augmentation technique based on the Bayesian approach, which aims to generate diverse and valid training samples by randomly transforming the semantic layer of the data. Its core concept is to employ Bayesian reasoning to capture the latent semantic information within the data and create new samples by randomizing this information. In this process, a Bayesian model is initially utilized to estimate the semantic structure or latent representation of the data, and then, while maintaining semantic consistency, new training instances are generated through random perturbations of these representations. The strength of this method lies in that it not only increases the diversity of the data but also effectively retains the semantic consistency of the data, thereby avoiding biases resulting from excessive augmentation and enhancing the generalization ability of the model. The introduction of the Bayesian model enables this augmentation approach to adjust flexibly in accordance with the uncertainty of the data, further enhancing the quality and diversity of the generated samples.
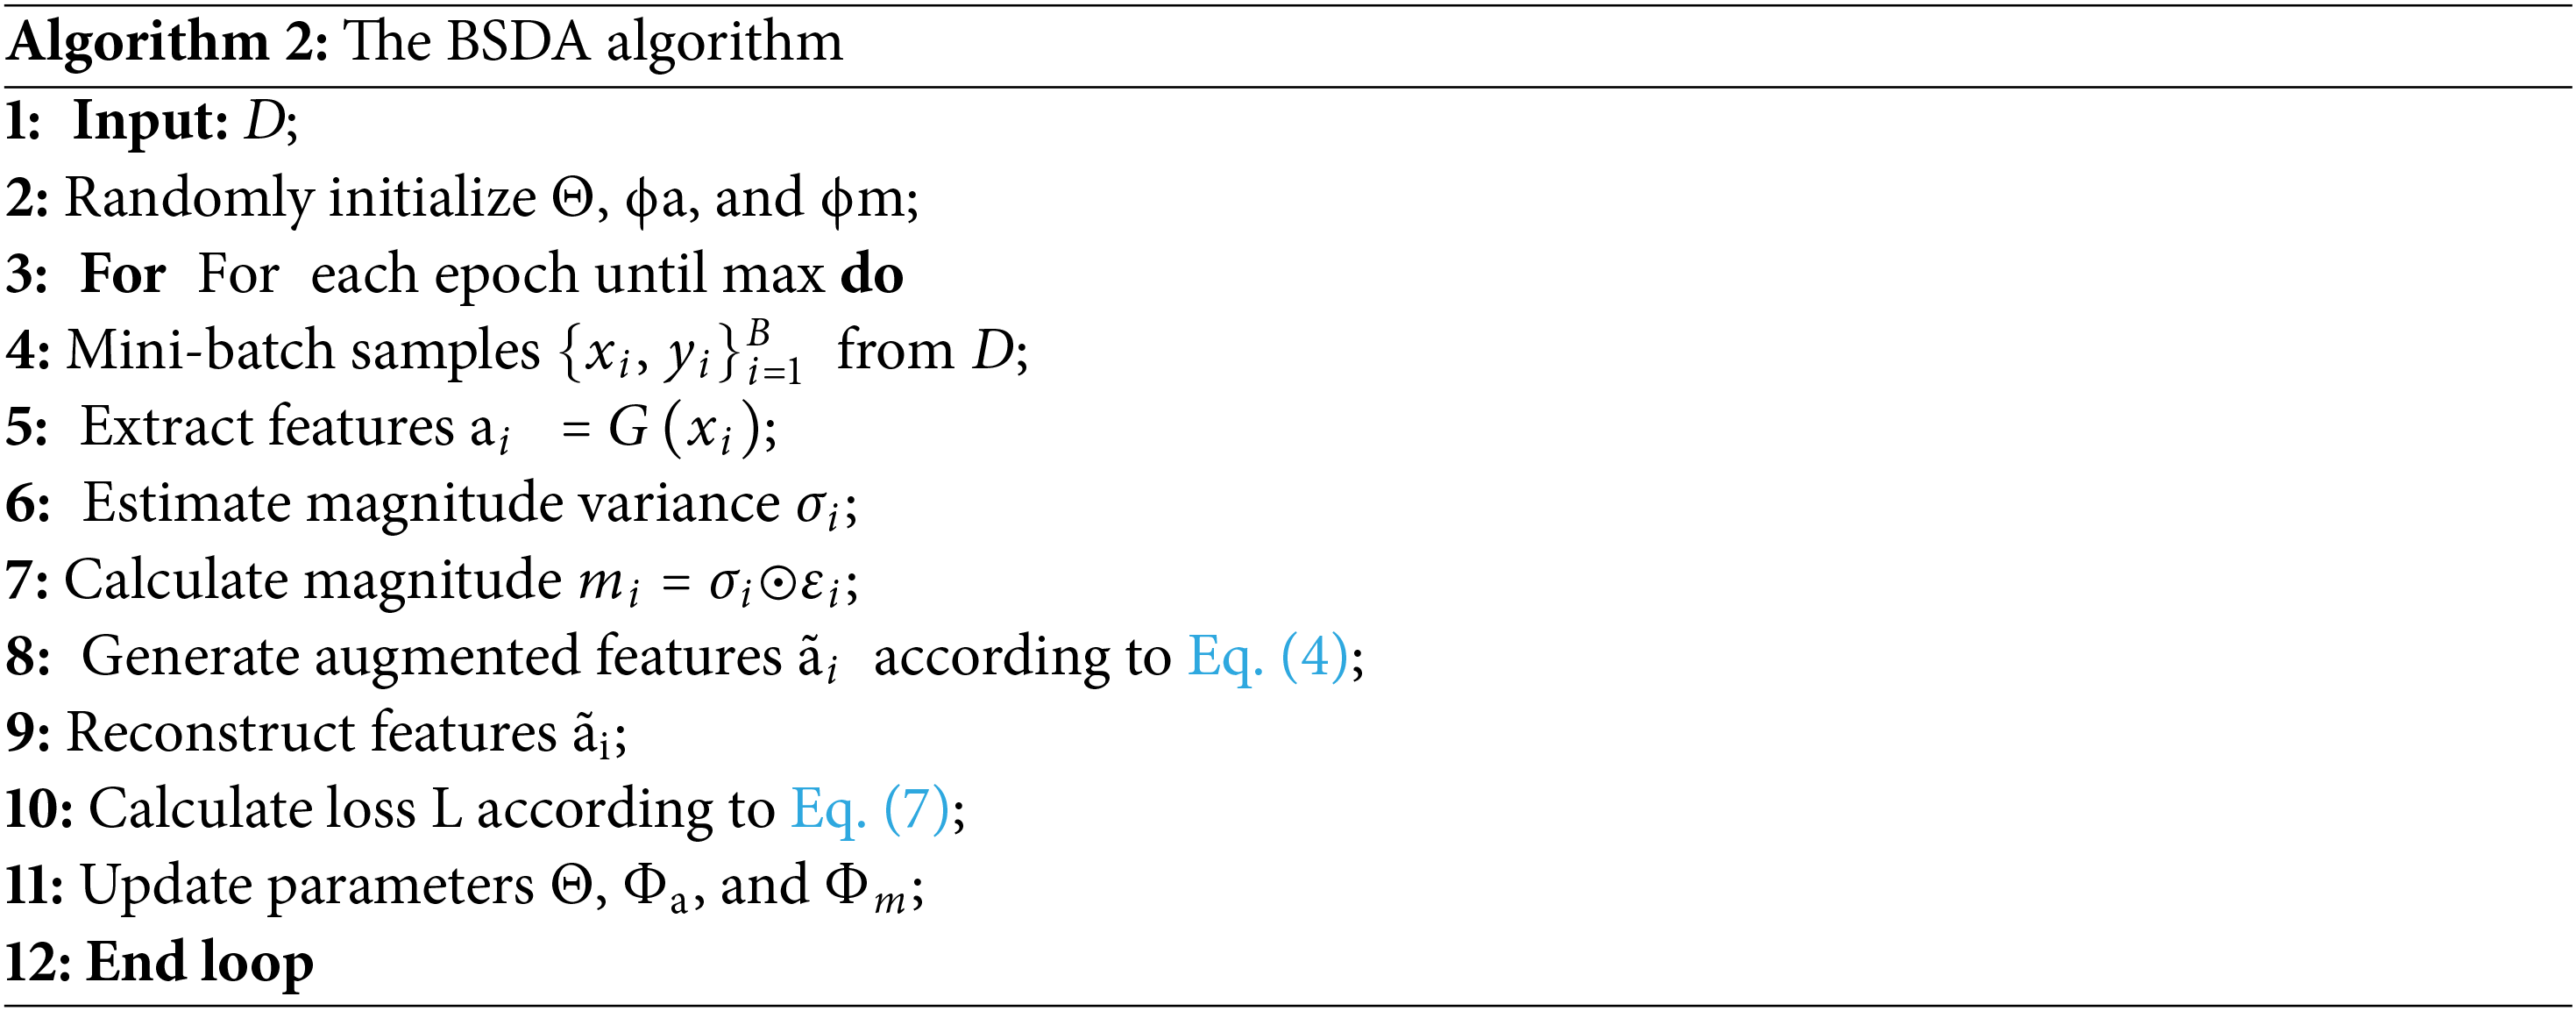
As shown in Fig. 5 and Algorithm 2, BSDA first extracts features from the data. Then, these features are passed through a distribution estimator that samples from specific distributions to generate diverse feature representations. Next, these diverse features are processed by a feature reconstructor and the feature set is enhanced by randomly selecting directions. The enhanced features are concatenated with the original features to form an enhanced feature set, which is then fed into the classification head for final image classification. BSDA achieves semantic data augmentation by translating features along the semantic direction in the feature space while ensuring that the image label remains unchanged. Variational Bayesian is used to estimate the distribution of the amplitude that can be enhanced, and then a sample is taken from this distribution and added to the original feature to perform semantic data augmentation.
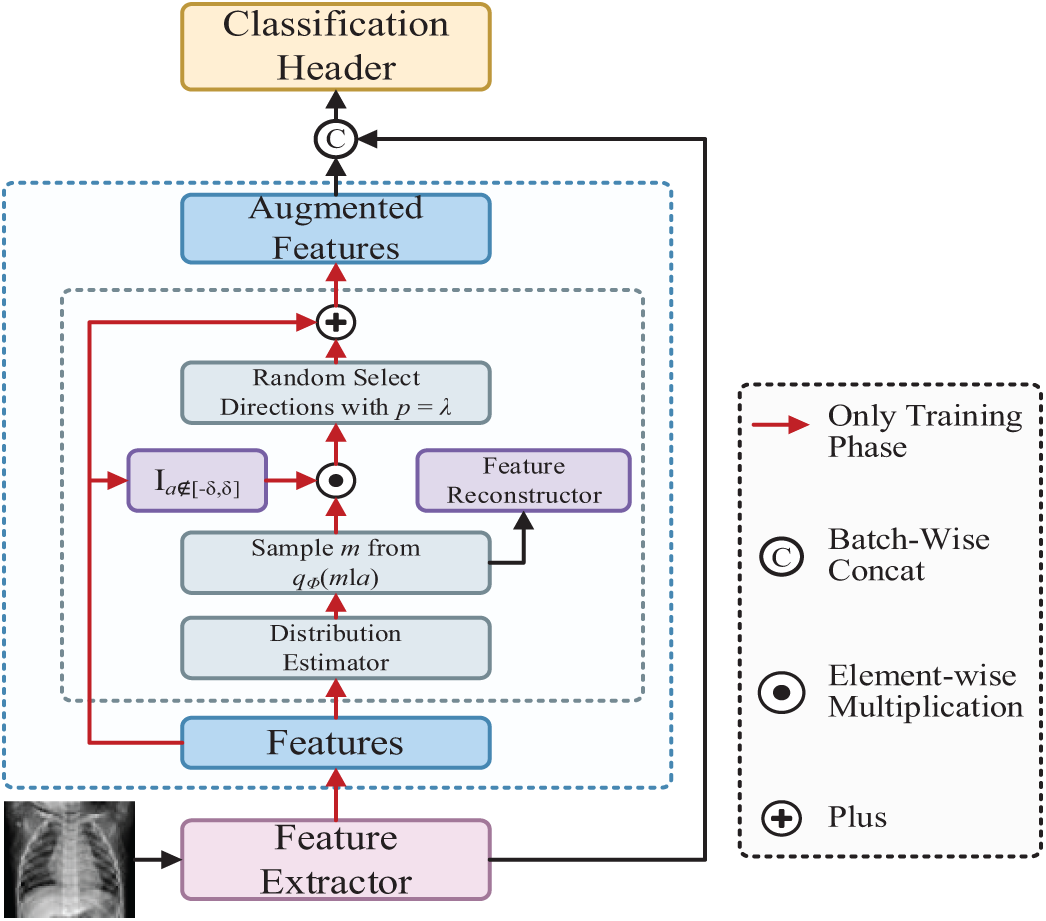
Figure 5: The architecture of Bayesian Random Semantic Data Augmentation
The formula for enhancement is detailed below:
where
The calculation formula and definition for mask semantic direction are as follows:
where
The formula and definition for optimizing the objective of Bayesian distribution estimation are as follows:
where
The formula and definition of the BSDA loss function are as follows:
This formula consists of two parts, the initial segment represents the divergence of the two distributions, and the second part is the expected value of the conditional probability of feature
The formula and definition of the total loss function are as follows:
where
The key to the BSDA method is that it treats data augmentation as additive perturbations in the feature space, estimates the distribution of enhancement amplitudes through Bayesian methods, and samples from this distribution to perform semantic data augmentation. This approach not only enhances the precision of medical image categorization, but also benefits from its high computational speed, can be easily integrated as a plug and play module into different neural network architectures such as CNN or Transformer.
In this section, we conducted various medical image classification tasks for the BSDA-Mamba. Specifically, we evaluated the classification performance of BSDA-Mamba on six MedMNIST [31] datasets and two datasets provided by Kaggle as shown in Fig. 6 and Table 1.

Figure 6: Sample images of medical images with fdifferent modality

Blood Cell Images: Presents 12,500 JPEG images of blood cells, along with corresponding labels in CSV format. It consists of approximately 3000 images of four different cell types—Eosinophil, Lymphocyte, Monocyte, and Neutrophil—organized into separate folders. Brain Tumor MRI Dataset: Showcases 7023 brain MRI images across four groups: glioma, meningioma, no tumor, and pituitary. The non-tumorous images are sourced from the Br35H dataset. The dataset has varying image dimensions, indicating the need for size normalization during preprocessing to improve model accuracy, and is available on Kaggle. DermaMNIST: Contains 10,015 skin lesion images divided into 7 categories for multi-class classification tasks. These images are derived from the HAM10000 dataset, which is a common collection of pigmented skin lesions. PneumoniaMNIST: This dataset is based on 5856 pediatric chest X-ray images and is designed for binary classification between pneumonia and normal conditions. It is based on a previous dataset, with images processed by center cropping and resizing. BreastMNIST: Presents 780 breast ultrasound images, originally segmented into three categories: normal, benign, and malignant. Due to the low image resolution, the task has been simplified to binary classification, with normal and benign combined as the positive class vs. malignancy, and resized to 28 × 28 pixels. PathMNIST: This dataset is based on colon pathological images and contains 107,180 28 × 28 pixel images divided into 9 categories for multi-class classification tasks. It is based on the previously provided dataset of 100,000 non-overlapping image patch datasets from hematoxylin-eosin-stained histological images. OctMNIST: This dataset is based on 109,309 retinal Optical Coherence Tomography (OCT) images and is intended for multi-class classification among four diagnostic categories of retinal diseases. It is derived from a previous dataset, with images processed by center cropping and resizing to a uniform size. TissueMNIST: This dataset consists of 236,386 tissue images and contains images segmented from 3 reference tissue samples and organized into 8 categories. The original size of each grayscale image is 32 × 32 × 7 pixels.
In this study, BSDA-Mamba was utilized to train the network. Subsequently, the training and testing phases occurred within the same environment, employing the PyTorch 2.1.0 deep learning framework and the Python 3.10.0 environment as the programming language. Network training involved the utilization of the hyperparameters outlined in Table 2.

During data preprocessing, the designated datasets are first loaded and partitioned into training and validation sets according to a specified ratio, which can be found on the official websites of each dataset. Next, data augmentation is applied to the training set, including techniques such as random cropping and horizontal flipping, to increase data diversity. This augmentation is achieved by passing the train_transform parameter during data loading, utilizing the transforms module in PyTorch. Data normalization is performed using the Normalize operation to ensure that the pixel values of the images adhere to a standard distribution. Additionally, the “Infomation” (INFO) global variable is employed to store metadata for each dataset, such as task type, number of image channels, label information, sample quantity, and image size. Finally, the DataLoader is used to construct batch iterators for both the training and validation sets, with support for multi-threaded parallel loading, thereby optimizing data loading efficiency.
4.3 Classification Performance Evaluation
In this research, we utilized three main metrics to evaluate the performance of the BSDA-Mamba model in medical image classification: Accuracy (ACC) [34], Area Under the Curve (AUC) [35], and F1 Score [36]. In addition, 95% confidence interval (95%CI) [37], Floating Point Operations (FLOPs) [38] and Big O notation [39] were additionally employed in the Brain Tumor MRI dataset. The levels of these indicators can reflect the potential of the model. The definitions of these metrics are as follows:
Accuracy (ACC): Accuracy is a basic metric that quantifies the percentage of total correct predictions. It is computed as the sum of true positives and true negatives divided by the total number of predictions. Accuracy provides a simple measure of how often the model makes correct classifications. Area Under the Curve (AUC): The AUC refers to the area under the Receiver Operating Characteristic (ROC) curve, which plots the true positive rate against the false positive rate at different threshold settings. AUC provides a single scalar value that summarizes the model’s ability to discriminate between classes, with higher values indicating better performance. An AUC of 1 represents perfect classification, while a value of 0.5 indicates no discriminatory power, equivalent to random guessing. F1 Score: The F1 Score is the harmonic mean of precision and recall, offering a balance between the two. Precision measures the proportion of true positives among all positive predictions made by the model, while recall (or sensitivity) is the proportion of actual positives that are correctly identified. The F1 Score is especially useful when dealing with imbalanced datasets, as it penalizes both high false positive and false negative rates, thereby providing a more comprehensive view of the model’s performance. To better comprehend the stability of the model, we employed 95% confidence interval and Floating Point Operations to evaluate the performance metrics of all models in the Brain Tumor MRI dataset. The merit of using 95% confidence interval lies in its ability to offer uncertainty quantification for the estimation of model performance, rendering the results more transparent and dependable [40]. By calculating the FLOPs required by the model during forward propagation, encompassing multiplication and addition operations in convolutional layers, fully connected layers, and other layers, a metric is provided to measure the computational resources needed by the model during inference, which aids in evaluating and optimizing the efficiency and performance of the model. Big O notation is used to quantify the time and space complexities of a model’s algorithm. It provides a theoretical framework for evaluating the efficiency and scalability of the model when processing data. This notation helps researchers and developers understand how the model’s performance may change as the size of the input data increases and how much computational resources the model requires in the worst-case scenario. Such insights are crucial for optimizing model design, predicting operational costs, and planning hardware resource allocation. Furthermore, calculating the Big O notation for different models allows for a clearer comparison of their performance characteristics.
Researchers conducted a series of experiments to validate the performance of BSDA-Mamba on different modalities of medical images. The comparative models selected for these experiments include MedMamba, ResNet50 [9], EfficientNet [41], and Vit [42]. As illustrated in Fig. 7 and detailed in Table 3, BSDA-Mamba outperforms its counterparts in crucial performance indicators such as accuracy (ACC), area under the curve (AUC), and F1 Score. Notably, on the PathMNIST dataset, BSDA-Mamba achieves an accuracy of 98.3%, an AUC of 0.999, and an F1 Score of 99.8%. This result indicates that BSDA-Mamba can identify pathological images with extremely high accuracy. The AUC value is close to perfect classification, suggesting that the model has an extremely high ability to distinguish different pathological categories. The high value of the F1 Score reflects that the model has achieved an excellent balance between precision and recall, which is particularly important for pathological image classification as it reduces the possibility of misdiagnosis and missed diagnosis. On the TissueMNIST dataset, BSDA-Mamba also exhibits outstanding performance, attaining an accuracy of 69.6%, an AUC of 0.934, and an F1 Score of 69.7%, outperforming the compared models. It indicates that although this dataset might be more challenging, the BSDA-Mamba model can still provide reliable classification results, which is conducive to clinical decision-making.
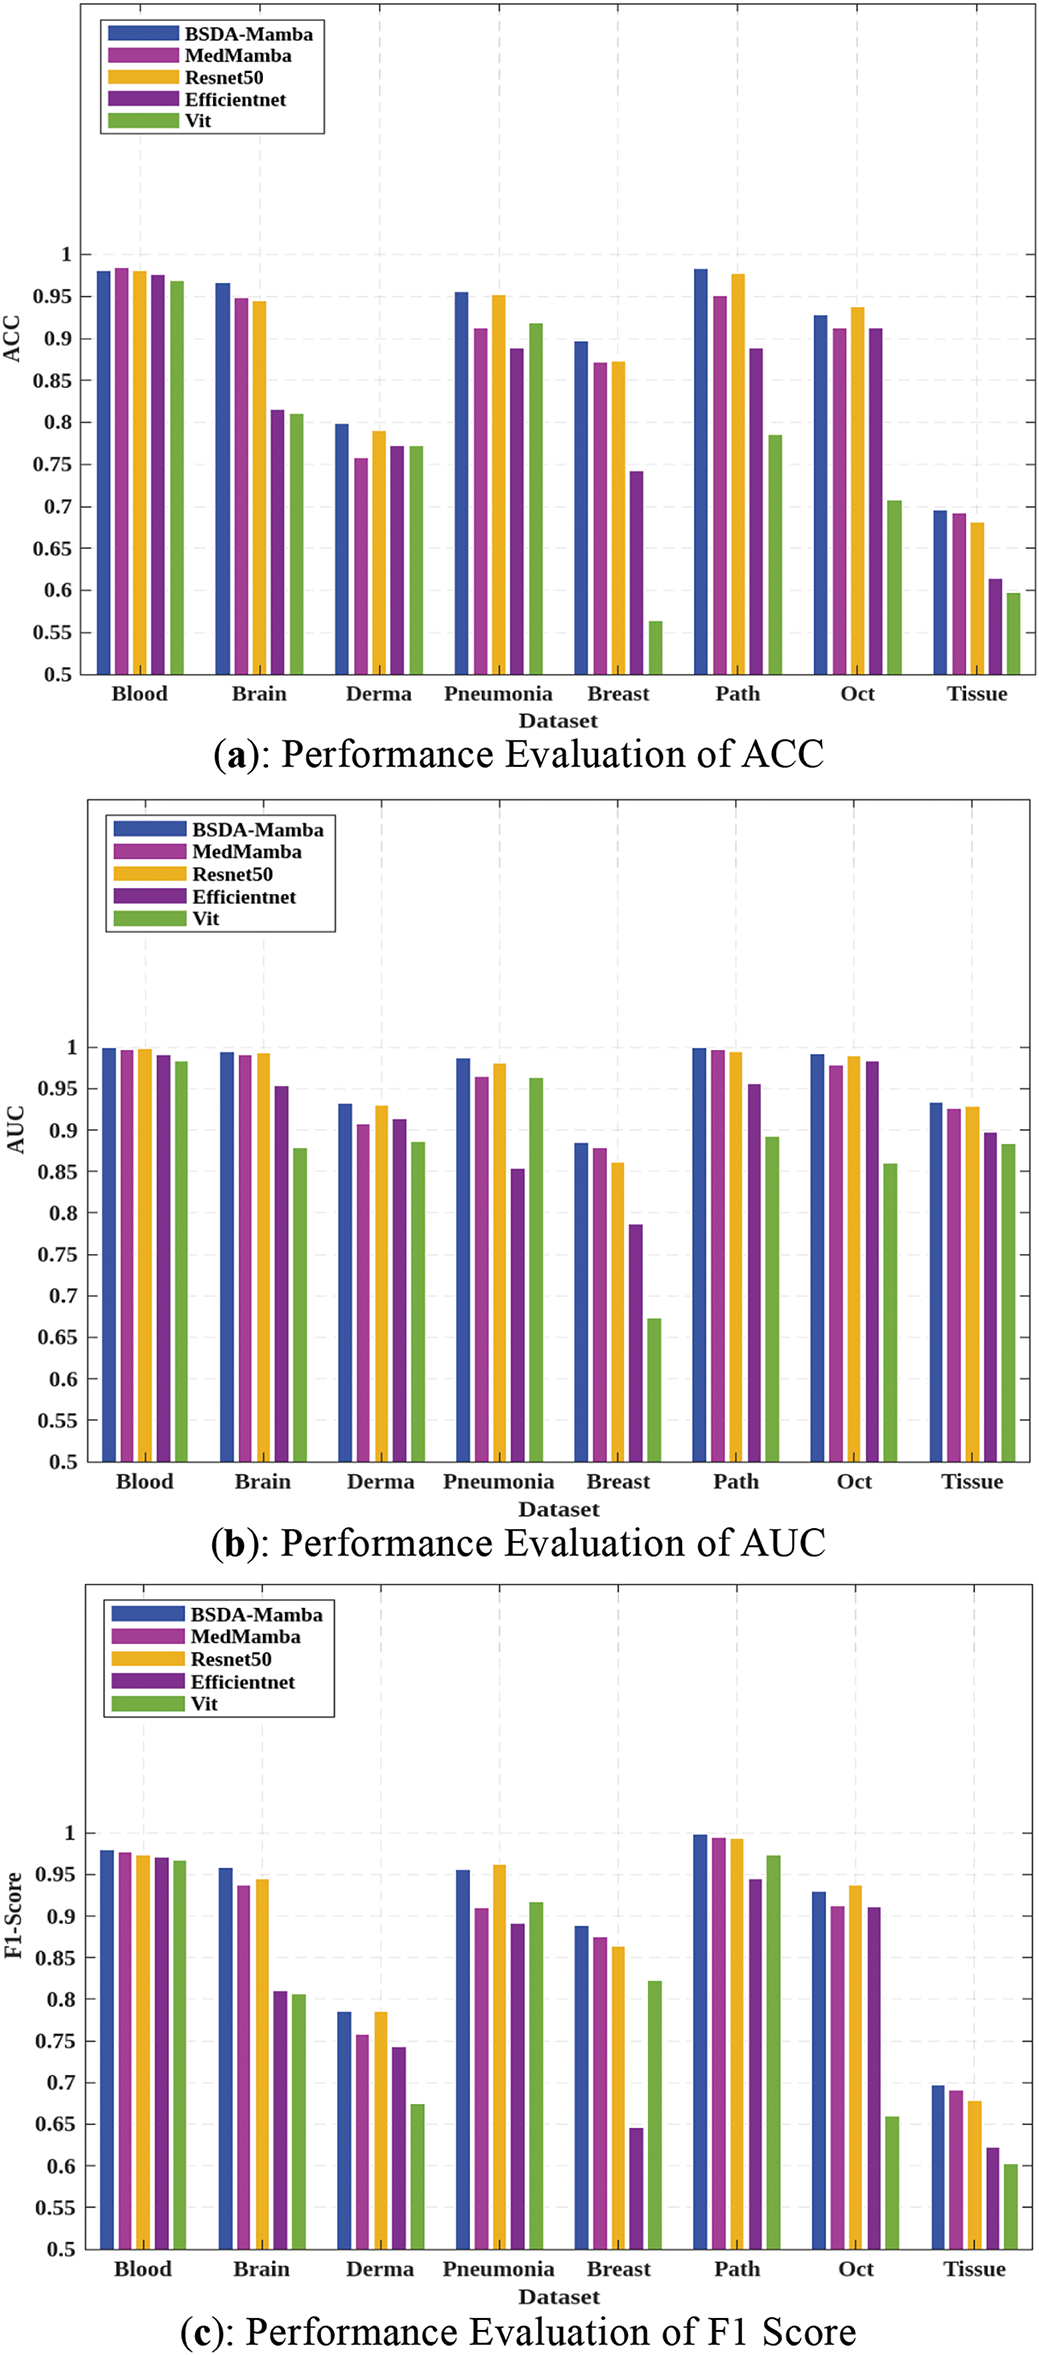
Figure 7: Comparison of experimental results of BSDA-Mamba and other models

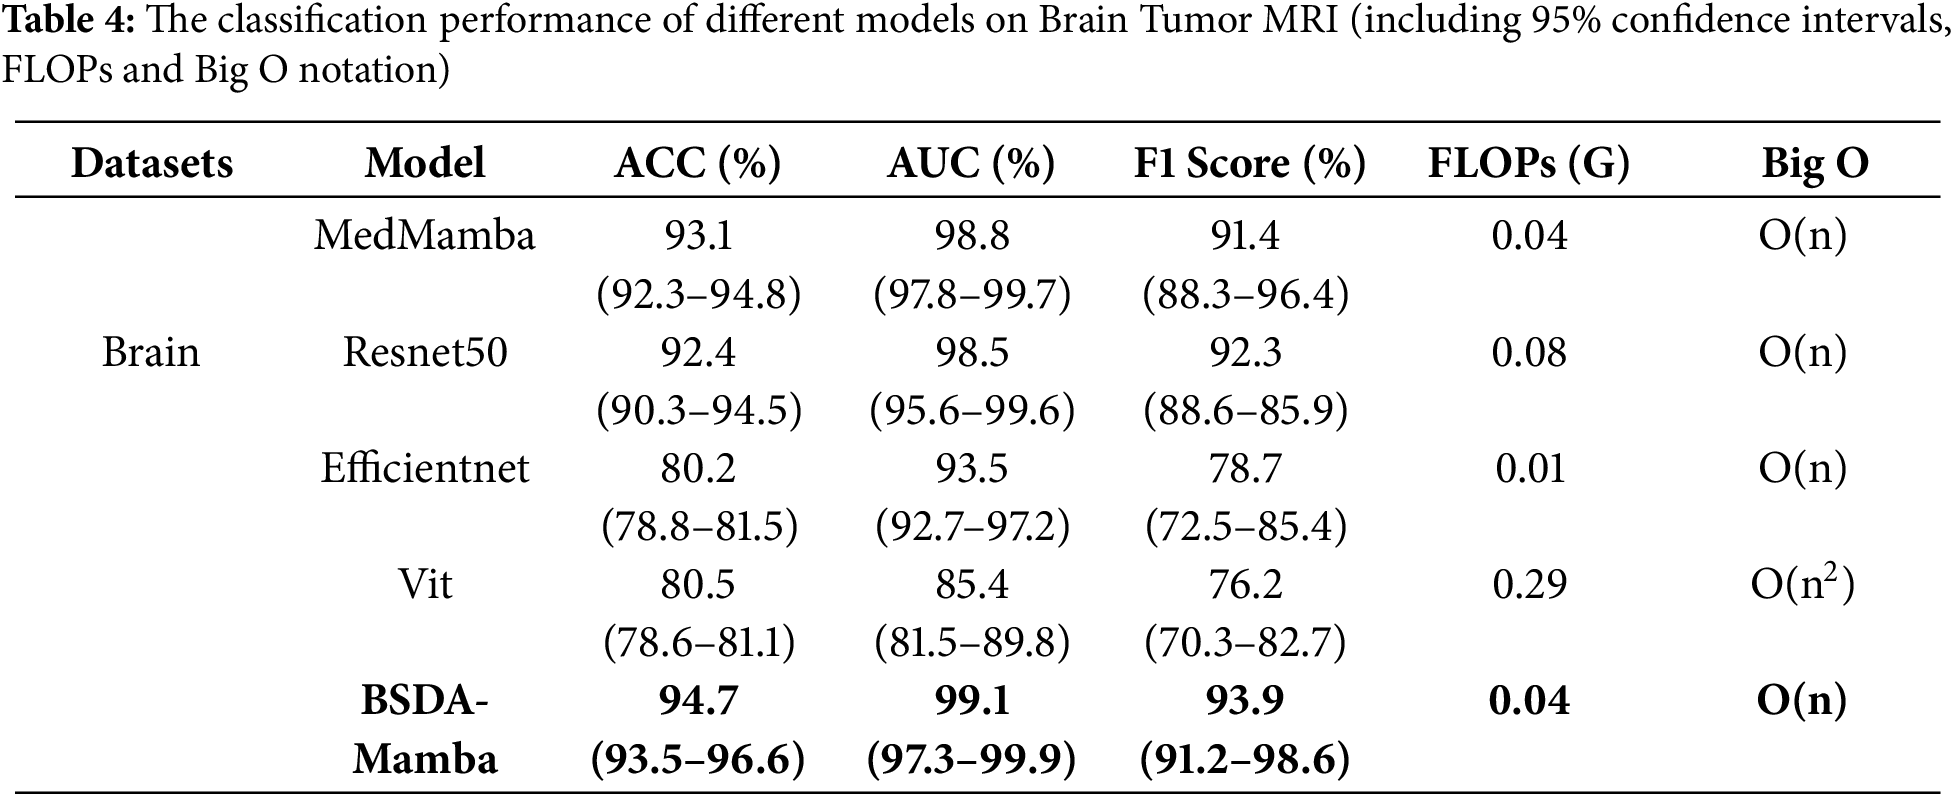
The diagnosis and classification of brain tumors constitute an essential research subject in the domain of medical image analysis. The Brain Tumor MRI dataset encompasses images of various types of brain tumors along with precise classification labels. Simultaneously, significant variations in morphology and size exist among the images of different patients, which augment the complexity of model classification and can better showcase the classification efficacy of different models. Therefore, we carried out further experiments on the 95%CI, FLOPs and Big O notation indicators using the Brain Tumor MRI dataset. From Table 4, it can be seen that BSDA-Mamba has the best classification performance on the Brain Tumor MRI dataset, with ACC of 94.7% (confidence interval 93.5%–96.6%), AUC of 99.1% (confidence interval 97.3%–99.9%), and F1 Score of 93.9% (confidence interval 91.2%–98.6%), all significantly better than other models. Meanwhile, the FLOPs of BSDA-Mamba stands at 0.04 G, identical to that of MedMamba, yet lower than 0.08 G of Resnet50 and 0.29 G of Vit. This demonstrates that BSDA-Mamba attains superior performance while maintaining the equivalent computational efficiency as MedMamba. Furthermore, the time complexity of BSDA Mamba is O(n), which is the same as MedMamba, ResNet50, and EfficientNet, but better than the O(n2) of Vit. This indicates that BSDA-Mamba has linear time complexity and high computational efficiency when processing data.
In the context of using deep learning for medical image classification, improving the interpretability and understanding of the results is crucial. Grad-CAM (Gradient-weighted Class Activation Mapping) is a powerful visualization technique that offers valuable insights by highlighting the important regions in an image that contribute to a model’s decision, thus enhancing the interpretability of deep learning models.
This study visualized the attention of different models in processing Brain Tumor MRI image data using Grad-CAM. As shown in Fig. 8, while MedMamba effectively focuses on key features in the image, its broad attention span causes it to capture irrelevant edge areas, which reduces the model’s accuracy in identifying specific tumor characteristics. In contrast, ResNet50, EfficientNet, and Vit maintain a certain level of attention to the images, but they fail to focus sufficiently on the critical features. BSDA-Mamba, however, strikes a balance by incorporating both global information and focused attention on key features. This well-distributed attention enables the model to accurately and comprehensively identify brain tumors.

Figure 8: Visualization of MRI test images under different model influences using Grad-CAM technology
The significant achievements of the BSDA-Mamba model in medical image classification tasks can largely be attributed to its innovative approach in feature extraction and data augmentation. By integrating residual connections, the model mitigates the gradient vanishing problem in deep networks, improving information flow and feature combination in deeper layers. This enhancement contributes to better accuracy and robustness in feature extraction. Additionally, the BSDA-Mamba model employs BSDA technology, which simulates random variations in medical images to generate new sample features, thereby enhancing the model’s ability to extract semantic information. This capability not only strengthens the model’s recognition of diverse image features but also significantly boosts its generalization ability. Given these advantages, the BSDA-Mamba model has demonstrated exceptional performance across multiple medical image datasets, particularly excelling in key performance metrics such as accuracy (ACC), area under the curve (AUC), and F1 Score.
This study introduces the BSDA-Mamba model, a novel approach for medical image classification that integrates Bayesian Random Semantic Data Augmentation (BSDA) technology with the MedMamba model, which features residual connection blocks. Our extensive experimental evaluation demonstrates that the BSDA-Mamba model achieves outstanding performance in medical image classification. The model consistently excels across multiple evaluation metrics, including accuracy, area under the curve (AUC), and F1 Score, on a variety of benchmark datasets. This high level of performance highlights the robustness of the model, positioning it as a reliable tool for medical image analysis.
Furthermore, the BSDA-Mamba model is adept at handling diverse imaging modalities, ranging from X-rays to MRI scans, underscoring its versatility and adaptability in various clinical settings. This capability enables the model to be seamlessly integrated into different diagnostic workflows without requiring substantial modifications. The development of BSDA-Mamba also emphasizes the significance of combining data augmentation techniques with deep learning architectures, illustrating how such strategic integration can lead to synergistic improvements in model performance.
Despite the promising results achieved by the BSDA-Mamba model, certain limitations remain. Notably, its reliance on high-quality annotated data, which can be difficult to acquire in some medical fields, poses a challenge. Additionally, the interpretability of the model is a significant concern. Although deep learning models, including BSDA-Mamba, demonstrate remarkable accuracy, their “black-box” nature complicates the understanding of their decision-making processes. This is particularly critical in application domains, such as medical image analysis, where interpretability is essential. Furthermore, computational efficiency and scalability remain key challenges. As datasets continue to expand and models grow in complexity, ensuring that the model maintains high precision while minimizing computational costs and ensuring scalability is a crucial avenue for future research. Future efforts will focus on improving the model’s ability to handle noisy or incomplete data and exploring transfer learning techniques to adapt the model for specific medical imaging tasks.
Acknowledgement: We sincerely express our gratitude to the editorial board and reviewers of the CMC Journal for their valuable feedback and perceptive suggestions, which have notably improved the quality of this manuscript.
Funding Statement: The authors received no specific funding for this study.
Author Contributions: The authors confirm their contribution to the paper as follows: Yaohua Xu proposed the conception of the study, and conducted an investigation, methodology. In addition, he was also responsible for writing original drafts and revising papers. Honglin Wang provided equipment resources, supervised and guided the research, and validated the experimental design for this study. In addition, he was also responsible for reviewing papers. Cheng Zhu analyzed experimental data and organized and managed it. In addition, he was responsible for visualizing the experimental results. All authors reviewed the results and approved the final version of the manuscript.
Availability of Data and Materials: The code of BSDA-Mamba is available at https://github.com/yaohuaxuuu/BSDAMamba. The datasets analyzed during the current study are publicly available at https://www.kaggle.com/datasets/paultimothymooney/blood-cells (accessed on 25 June 2024). https://www.kaggle.com/datasets/masoudnickparvar/brain-tumor-mri-dataset (accessed on 25 June 2024), and https://github.com/MedMNIST/MedMNIST (accessed on 10 July 2024).
Ethics Approval: Not applicable.
Conflicts of Interest: The authors declare no conflicts of interest to report regarding the present study.
References
1. Ritter F, Boskamp T, Homeyer A, Laue H, Schwier M, Link F, et al. Medical image analysis. IEEE Pulse. 2011;2(6):60–70. doi:10.1109/MPUL.2011.942929. [Google Scholar] [PubMed] [CrossRef]
2. Wang W, Liang D, Chen Q, Iwamoto Y, Han X-H, Zhang Q. Medical image classification using deep learning. Intell Syst Ref Libr. 2020;171:33–51. doi:10.1007/978-3-030-32606-7_3. [Google Scholar] [CrossRef]
3. Liu R, Wang T, Li H, Zhang P, Li J, Yang X, et al. TMM-Nets: transferred multi- to mono-modal generation for lupus retinopathy diagnosis. IEEE Trans Med Imaging. 2023;42(4):1083–94. doi:10.1109/TMI.2022.3223683. [Google Scholar] [PubMed] [CrossRef]
4. Shen D, Wu G, Suk HI. Deep learning in medical image analysis. Annu Rev Biomed Eng. 2017;19(1):221–48. doi:10.1146/annurev-bioeng-071516-044442. [Google Scholar] [PubMed] [CrossRef]
5. Suzuki K. Overview of deep learning in medical imaging. Radiol Phys Technol. 2017;10(3):257–73. doi:10.1007/s12194-017-0406-5. [Google Scholar] [PubMed] [CrossRef]
6. Mousavi M, Hosseini S. A deep convolutional neural network approach using medical image classification. BMC Med Inform Decis Mak. 2024;24(1):239. doi:10.1186/s12911-024-02646-5. [Google Scholar] [PubMed] [CrossRef]
7. Liu Y, Tian Y, Zhao Y, Yu H, Xie L, Wang Y, et al. Vmamba: visual state space model. arXiv:2401.10166. 2024. [Google Scholar]
8. Indolia S, Goswami AK, Mishra SP, Asopa P. Conceptual understanding of convolutional neural network—a deep learning approach. Procedia Comput Sci. 2018;132(4):679–88. doi:10.1016/j.procs.2018.05.069. [Google Scholar] [CrossRef]
9. He K, Zhang X, Ren S, Sun J. Deep residual learning for image recognition. In: Proceedings of the IEEE Conference on Computer Vision and Pattern Recognition; 2016 Jun 27–30; Las Vegas, NV, USA. p. 770–8. [Google Scholar]
10. Huang G, Liu Z, van der Maaten L, Weinberger KQ. Densely connected convolutional networks. In: Proceedings of the IEEE Conference on Computer Vision and Pattern Recognition; 2017 Jul 21–26; Honolulu, HI, USA. p. 4700–8. [Google Scholar]
11. Han K, Wang Y, Chen H, Chen X, Guo J, Liu Z, et al. A survey on vision transformer. IEEE Trans Pattern Anal Mach Intell. 2022;45(1):87–110. doi:10.1109/TPAMI.2022.3152247. [Google Scholar] [PubMed] [CrossRef]
12. Liu Z, Lin Y, Cao Y, Hu H, Wei Y, Zhang Z, et al. Swin Transformer: hierarchical vision transformer using shifted windows. In: Proceedings of the IEEE/CVF International Conference on Computer Vision; 2021 Oct 11–17; Montreal, BC, Canada. p. 10012–22. [Google Scholar]
13. Touvron H, Cord M, Douze M, Massa F, Sablayrolles A, Jégou H. Training data-efficient image transformers & distillation through attention. arXiv:2012.12877. 2020. [Google Scholar]
14. Yue Y, Li Z. Medmamba: vision mamba for medical image classification. arXiv:2403.03849. 2024. [Google Scholar]
15. Boafo YG. An overview of computer-aided medical image classification. Multimed Tools Appl. 2024;1(11):1–39. doi:10.1007/s11042-024-19558-1. [Google Scholar] [CrossRef]
16. Zhu Y, Cai X, Wang X, Yao Y. Bayesian random semantic data augmentation for medical image classification. arXiv:2403.06138. 2024. [Google Scholar]
17. Panda SK, Ramesh JVN, Ghosh H, Rahat IS, Sobur A, Bijoy MH, et al. Deep learning in medical imaging: a case study on lung tissue classification. EAI Endorsed Trans Pervasive Health Technol. 2024;10:1–12. doi:10.4108/eetpht.10.5549. [Google Scholar] [CrossRef]
18. Shuai L, Li Z, Chen Z, Luo D, Mu J. A research review on deep learning combined with hyperspectral imaging in multiscale agricultural sensing. Comput Electron Agric. 2024;217(313):108577. doi:10.1016/j.compag.2023.108577. [Google Scholar] [CrossRef]
19. Yang S, Xiao W, Zhang M, Guo S, Zhao J, Shen F. Image data augmentation for deep learning: a survey. arXiv:2204.08610. 2022. [Google Scholar]
20. Howard AG. MobileNets: efficient convolutional neural networks for mobile vision applications. arXiv:1704.04861. 2017. [Google Scholar]
21. Zu B, Cao T, Li Y, Li J, Wang H, Wang Q. RESwinT: enhanced pollen image classification with parallel window transformer and coordinate attention. Vis Comput. 2024;6(1):11. doi:10.1007/s00371-024-03701-y. [Google Scholar] [CrossRef]
22. DeVries T. Improved regularization of convolutional neural networks with cutout. arXiv:1708.04552. 2017. [Google Scholar]
23. Cubuk ED, Zoph B, Mane D, Vasudevan V, Le QV. AutoAugment: learning augmentation strategies from data. In: Proceedings of the IEEE/CVF Conference on Computer Vision and Pattern Recognition; 2019 Jun 15–20; Long Beach, CA, USA. p. 113–23. [Google Scholar]
24. Park DS, Chan W, Zhang Y, Chiu CC, Zoph B, Cubuk ED, et al. SpecAugment: a simple data augmentation method for automatic speech recognition. arXiv:1904.08779. 2019. [Google Scholar]
25. Chen X, Fan H, Girshick R, He K. Improved baselines with momentum contrastive learning. arXiv:2003.04297. 2020. [Google Scholar]
26. Bochkovskiy A, Wang CY, Liao HYM. YOLOv4: optimal speed and accuracy of object detection. arXiv:2004.10934. 2020. [Google Scholar]
27. Elfwing S, Uchibe E, Doya K. Sigmoid-weighted linear units for neural network function approximation in reinforcement learning. Neural Netw. 2018;107(3):3–11. doi:10.1016/j.neunet.2017.12.012. [Google Scholar] [PubMed] [CrossRef]
28. Agarap AF. Deep learning using rectified linear units (ReLU). arXiv:1803.08375. 2018. [Google Scholar]
29. Ruan J, Xiang S. VM-UNet: vision mamba UNet for medical image segmentation. arXiv:2402.02491. 2024. [Google Scholar]
30. Gu A, Dao T. Mamba: linear-time sequence modeling with selective state spaces. arXiv:2312.00752. 2023. [Google Scholar]
31. Yang J, Shi R, Wei D, Liu Z, Zhao L, Ke B, et al. MedMNIST v2: a large-scale lightweight benchmark for 2D and 3D biomedical image classification. Sci Data. 2023;10(1):41. doi:10.1038/s41597-022-01721-8. [Google Scholar] [PubMed] [CrossRef]
32. Loshchilov I, Hutter F. Decoupled weight decay regularization. arXiv:1711.05101. 2017. [Google Scholar]
33. Mao A, Mohri M, Zhong Y. Cross-entropy loss functions: theoretical analysis and applications. In: Proceedings of the International Conference on Learning Representations; 2017 Apr 24–26; Toulon, France. [Google Scholar]
34. Liu B, Udell M. Impact of accuracy on model interpretations. arXiv:2011.09903. 2020. [Google Scholar]
35. Bradley AP. The use of the area under the ROC curve in the evaluation of machine learning algorithms. Pattern Recognit. 1997;30(7):1145–59. doi:10.1016/S0031-3203(96)00142-2. [Google Scholar] [CrossRef]
36. Srivastava S, Singh G. F1 score analysis of search engines. SKIT Res J. 2016;6:1–6. [Google Scholar]
37. Simundic AM. Confidence interval. Biochem Med. 2008;18:154–61. doi:10.11613/BM.2008.015. [Google Scholar] [CrossRef]
38. Tang R, Adhikari A, Lin JJ. FLOPs as a direct optimization objective for learning sparse neural networks. arXiv:1811. 03060. 2018. [Google Scholar]
39. Chivers I, Sleightholme J. An introduction to algorithms and the big O notation. In: Intro program fortran. Berlin/Heidelberg, Germany: Springer; 2015. p. 453–72. doi:10.1007/978-3-319-17701-4_23. [Google Scholar] [CrossRef]
40. Altan G. DeepOCT: an explainable deep learning architecture to analyze macular edema on OCT images. Eng Sci Technol Int J. 2022;34(23):101091. doi:10.1016/j.jestch.2021.101091. [Google Scholar] [CrossRef]
41. Tan M, Le Q. Efficientnet: rethinking model scaling for convolutional neural networks. In: International Conference on Machine Learning; 2019 Jun 10–15; Long Beach, CA, USA. p. 6105–14. [Google Scholar]
42. Dosovitskiy A, Beyer L, Kolesnikov A, Weissenborn D, Zhai X, Unterthiner T, et al. An image is worth 16 × 16 words: transformers for image recognition at scale. arXiv:2010.11929. 2020. [Google Scholar]
Cite This Article
 Copyright © 2025 The Author(s). Published by Tech Science Press.
This work is licensed under a Creative Commons Attribution 4.0 International License , which permits unrestricted use, distribution, and reproduction in any medium, provided the original work is properly cited.
 Downloads
 Citation Tools