
 Submit a Paper
 Propose a Special lssue
 Open Access
ARTICLE
CFGANLDA: A Collaborative Filtering and Graph Attention Network-Based Method for Predicting Associations between lncRNAs and Diseases
School of Information and Communications Technology, Hanoi University of Industry, No. 298 Cau Dien Street, Bac Tu Liem District, Hanoi, 100000, Vietnam
* Corresponding Author: Van Tinh Nguyen. Email:
(This article belongs to the Special Issue: Advances in Deep Learning and Neural Networks: Architectures, Applications, and Challenges)
Computers, Materials & Continua 2025, 83(3), 4679-4698. https://doi.org/10.32604/cmc.2025.063228
Received 09 January 2025; Accepted 02 April 2025; Issue published 19 May 2025
 View Full Text
 Download PDF
Abstract
It is known that long non-coding RNAs (lncRNAs) play vital roles in biological processes and contribute to the progression, development, and treatment of various diseases. Obviously, understanding associations between diseases and lncRNAs significantly enhances our ability to interpret disease mechanisms. Nevertheless, the process of determining lncRNA-disease associations is costly, labor-intensive, and time-consuming. Hence, it is expected to foster computational strategies to uncover lncRNA-disease relationships for further verification to save time and resources. In this study, a collaborative filtering and graph attention network-based LncRNA-Disease Association (CFGANLDA) method was nominated to expose potential lncRNA-disease associations. First, it takes into account the advantages of using biological information from multiple sources. Next, it uses a collaborative filtering technique in order to address the sparse data problem. It also employs a graph attention network to reinforce both linear and non-linear features of the associations to advance prediction performance. The computational results indicate that CFGANLDA gains better prediction performance compared to other state-of-the-art approaches. The CFGANLDA’s area under the receiver operating characteristic curve (AUC) metric is 0.9835, whereas its area under the precision-recall curve (AUPR) metric is 0.9822. Statistical analysis using 10-fold cross-validation experiments proves that these metrics are significant. Furthermore, three case studies on prostate, liver, and stomach cancers attest to the validity of CFGANLDA performance. As a result, CFGANLDA method proves to be a valued tool for lncRNA-disease association prediction.Keywords
It is commonly known that protein-coding genes include biological genetic information found in human genomes [1,2]. Nevertheless, most human genomes, nearly 98%, have little or no protein-coding abilities. We refer to them as non-coding RNAs (ncRNAs). Among them, there is a particular class that encompasses non-coding RNAs with more than 200 nucleotides in length, recognized as long non-coding RNAs (lncRNAs) [2,3]. It has been established that lncRNAs are essential for a variety of biological processes in the human body, such as translation, transcription, splicing, differentiation, epigenetic regulation, and immune response [4–7]. Particularly, an increase of evidence suggests that the dysregulations and mutations of lncRNAs contribute to the development of various complicated human diseases. For example, lncRNA PVT1 promotes the growth of hepatitis B virus-positive liver cancer by interfering with histone methylation on the c-Myc promoter [8]. LncRNA H19 encourages the migration and invasion of colon cancer cells via the mitogen-activated protein kinase (MAPK) signaling pathway [5]. Obviously, understanding of associations between lncRNAs and diseases can aid in human diseases’ diagnosis, treatment and prevention by identifying their mechanisms [4,6,9–11]. However, the discovery of lncRNA-disease associations through biological experiments is expensive, tedious, and laborious. As a consequence, to avoid wasting time and resources, it is necessary to exploit efficient computational approaches for unveiling lncRNA-disease relationships [4,6]. Numerous computational approaches have recently been established to deduce latent lncRNA-disease interactions, providing the basis for further biological experimental proof. They can be broadly grouped into four categories: network-based, matrix factorization-based, machine learning-based, and multi-model integration approaches [12,13].
First, the network-based approaches for uncovering lncRNA-disease interactions typically construct a global heterogeneous network based on known associations as well as different similarities. A common assumption was often used in network-based methods that lncRNAs related to diseases sharing comparable symptoms also have comparable functions, and vice versa [14,15]. For example, by integrating the confirmed lncRNA-disease associations, lncRNA cosine, lncRNA expression, disease cosine and disease semantic similarities and network consistent projection, Xie et al. employed a method called network consistency projection for human lncRNA-disease associations (NCPHLDA) to identify latent lncRNA-disease associations [15]. Wang et al. [16] constructed an internal inclined random walk with restart (IIRWR) method to anticipate lncRNA-disease relationships by incorporating validated lncRNA-disease associations, disease weights, lncRNAs’ Gaussian interaction profile (GIP) kernel similarity, and disease semantic similarity. After that, they deduced potential lncRNA-disease interactions by an algorithm of an internally inclined random walk with restart. The lncRNA-disease association prediction problem was addressed by Xie et al. through the use of a bidirectional linear neighborhood label propagation algorithm and selective similarity matrix fusion [17]. Bonomo et al. [18] considered the lncRNA-disease association prediction issue as a neighborhood analysis performed on tripartite graphs using known lncRNA-miRNA interactions and miRNA-disease associations. Chen et al. [19] submitted an LPARP method that addressed the lncRNA-disease association prediction problem using a label-propagation algorithm and random projection. These methods could achieve competitive prediction performance but many of them could not be utilized to uncover isolated lncRNAs or diseases [16].
Second, over the past few years, many matrix factorization-based methods have been used to forecast lncRNA-disease associations. For example, Fu et al. [20] presented a technique known as Matrix Factorization based LncRNA-Disease Association (MFLDA), which fused data from heterogeneous sources and used matrix tri-factorization to decompose data into low-rank matrices. Lu et al. [21] inferred latent lncRNA-disease relationships utilizing inductive matrix completion. First, they calculated lncRNAs’ GIP kernel and diseases’ functional similarity. Next, they extracted the initial feature vectors of diseases and lncRNAs using Principal Component Analysis (PCA). Finally, they calculated the predicted association matrix utilizing the inductive matrix completion. A PMFILDA approach was proposed to unveil lncRNA-disease pairs using probability matrix decomposition [22]. An improved collaborative matrix factorization method was utilized to reveal lncRNA-disease relationships by incorporating lncRNAs and diseases’ the GIP kernels [23]. Methods in this group often achieve a competitive performance, but they may be biased towards sparse matrices. To capture non-linear features of lncRNAs and diseases to address the sparse data challenge, some scientists have integrated matrix factorization and deep learning techniques for enhancing lncRNA-disease association prediction performance [24,25].
Third, as a result of the development of machine learning in biology, various machine learning-based prediction algorithms have been adopted to unveil latent lncRNA-disease relationships. For instance, Yu et al. inferred possible lncRNA-disease interactions using a Naïve Bayesian Classifier in a CFNBC method [26]. Yao et al. implemented a lncRNA-disease interaction prediction method utilizing random forest and feature selection [27]. A new algorithm IPCARF, which integrates incremental PCA (IPCA) with random forest (RF) algorithm, was proposed for predicting associated pairs of lncRNA and disease [28]. An LDNFSGB method was established for revealing associated couples of lncRNA and disease using network feature similarity along with gradient boosting [29]. Sheng et al. presented a model VADLP, which extracts, encrypts, and adaptively fuses multi-level representations containing attributes of nodes, pairwise topology, and feature distributions for revealing lncRNA-disease relationships [30]. One of the biggest drawbacks of the machine learning-based approaches is that the data is not sufficiently rich, which restricts prediction performance [28]. Additionally, though machine learning methods can identify associations between variables but, they do not commonly handle knowledge from different domains [31]. Therefore, it is important to integrate domain knowledge into machine learning for biomedical applications, especially for lncRNA-disease association prediction. Recently, deep learning techniques, which are an essential part of machine learning, have widely been employed to enrich lncRNA-disease relationships’ non-linear features. They made the assumption that the linear and non-linear features would work in concert to provide good lncRNA-disease association features so that they can enhance the prediction performance [24,32]. For example, Zeng et al. extracted linear and non-linear features of lncRNA-diseases associations using Singular Value Decomposition (SVD) and deep learning and used their combination to train SDLDA model to figure out disease-associated lncRNAs [24]. A gGATLDA model used a graph-level graph attention network to detect latent lncRNA-disease associations [13]. A novel GCNFORMER model was developed on transformer and graph convolutional network (GCN) to anticipate disease-associated lncRNAs [33]. Li et al. [34] presented a novel NAGTLDA model for inferring lncRNA-disease associations, combining node-adaptive graph transformer and structural encoding.
Lastly, in recent years, various computational methods combined the different methods into a unified model to overcome their limitations and enhance overall prediction performance [35]. For example, a hybrid method combining graph autoencoders with variational inference was proposed to uncover lncRNA-disease relationships [36]. Li et al. [37] first used SVD along with node2vec to extract linear and non-linear features of lncRNAs and diseases. Next, they constructed the integrated features using previously obtained ones to enhance semantic representation. Finally, they used an XGBoost classifier for determining lncRNA-disease relationships. Liang et al. [38] used a GCN to extract features from similarity graphs. After that, they leveraged the attention mechanisms to assign weights to different feature matrices of lncRNAs and diseases. Next, they extracted additional features from multiple feature matrices using a convolutional neural network (CNN). Lastly, they made the final prediction using a stacking ensemble classifier, which consists of various classical machine-learning classifiers. Yao et al. [39] predicted associations between lncRNAs and diseases utilizing multiple metapaths in hierarchical graph attention networks. Peng et al. [40] incorporated lncRNA-disease association feature extraction relying on SVD and variational graph autoencoder and utilizing a heterogeneous Newton boosting machine for lncRNA-disease association prediction.
Although existing computational methods for inferring disease-associated lncRNAs have yielded immense benefits, there is still room for improvement to achieve more robust performance. One major issue that has attracted researchers’ attention is that sparse and incomplete biological data can affect prediction accuracy. In the past few years, a weighted K-nearest known neighbors (WKNKN) technique was widely employed as a preprocessing step to mitigate the effects of sparse data challenge in associations among biological objects, including miRNA-disease associations and drug-target interactions [41–44]. Besides, a recommender system based on collaborative filtering (CF) algorithm was employed in various studies to address the limitation of restricted known associations among biological objects, including the published works of [23,26,45,46]. These works relied on the fact that the number of validated associations among biological objects was significantly lower than the number of unverified associations among them, whereas the unknown relationships could conceivably be accurate relationships [26].
In this work, we proposed a new deep learning method to address the challenges of sparse data using a CF algorithm to promote the advantages of using biological information from multi-sources as well as to reinforce linear and non-linear features of associations between lncRNAs and diseases. First, we calculated the integrated similarity for lncRNAs based on the lncRNA functional similarity and lncRNA GIP kernel. Similarly, we computed integrated similarity for diseases using disease semantic similarity and disease GIP kernel. Second, the integrated similarities are used as input features in a PCA method to reduce the dimension of input features. Third, we employed a CF algorithm on lncRNA-disease along with lncRNA-miRNA interaction sets. It is based on the premise that the number of known associations among three object types of lncRNAs, diseases and miRNAs is very limited. After applying the CF algorithm, we obtained the updated lncRNA-disease association set which is used as input for a graph attention network (GAN) later. Fourth, the new features and the updated lncRNA-disease association set are used in a GAN to obtain the latent vectors of lncRNAs and diseases. Lastly, a multi-layer perceptron (MLP) is used to generate lncRNA-disease association prediction scores. The experiments on the datasets used in recent studies [2,13,15,36,46,47] demonstrated the strong performance of CFGANLDA. It achieved an average AUC of 0.9835 and an average AUPR of 0.9822. Statistical analysis using 10-fold cross-validation experiments shows that these metrics are significant. They are better than the values of other state-of-the-art methods, including GANLDA [2], IPCARF [28], VGAELDA [36], an improved tripartite graph for lncRNA-disease association prediction (ITPGLDA) [46] and HGNNLDA [47]. Thus, CFGANLDA is a valuable tool for revealing lncRNA-disease relationships.
In this work, a new CFGANLDA method is proposed for inferring potential lncRNA-disease relationships. Generally, CFGANLDA includes the following stages. First, lncRNA-integrated similarity and disease-integrated similarity are computed. Second, the integrated similarities of lncRNAs and diseases are used in a PCA to reduce noise. Third, a CF algorithm is applied to the sets of lncRNA-disease and lncRNA-miRNA associations to obtain updated lncRNA-disease associations. Fourth, we use a GAN where inputs are the updated lncRNA-disease associations and new features obtained from PCA. Finally, the latent vectors of lncRNAs and diseases obtained from GAN are used in an MLP to compute scores of lncRNA-disease associations. The CFGANLDA’s workflow is shown in Fig. 1.
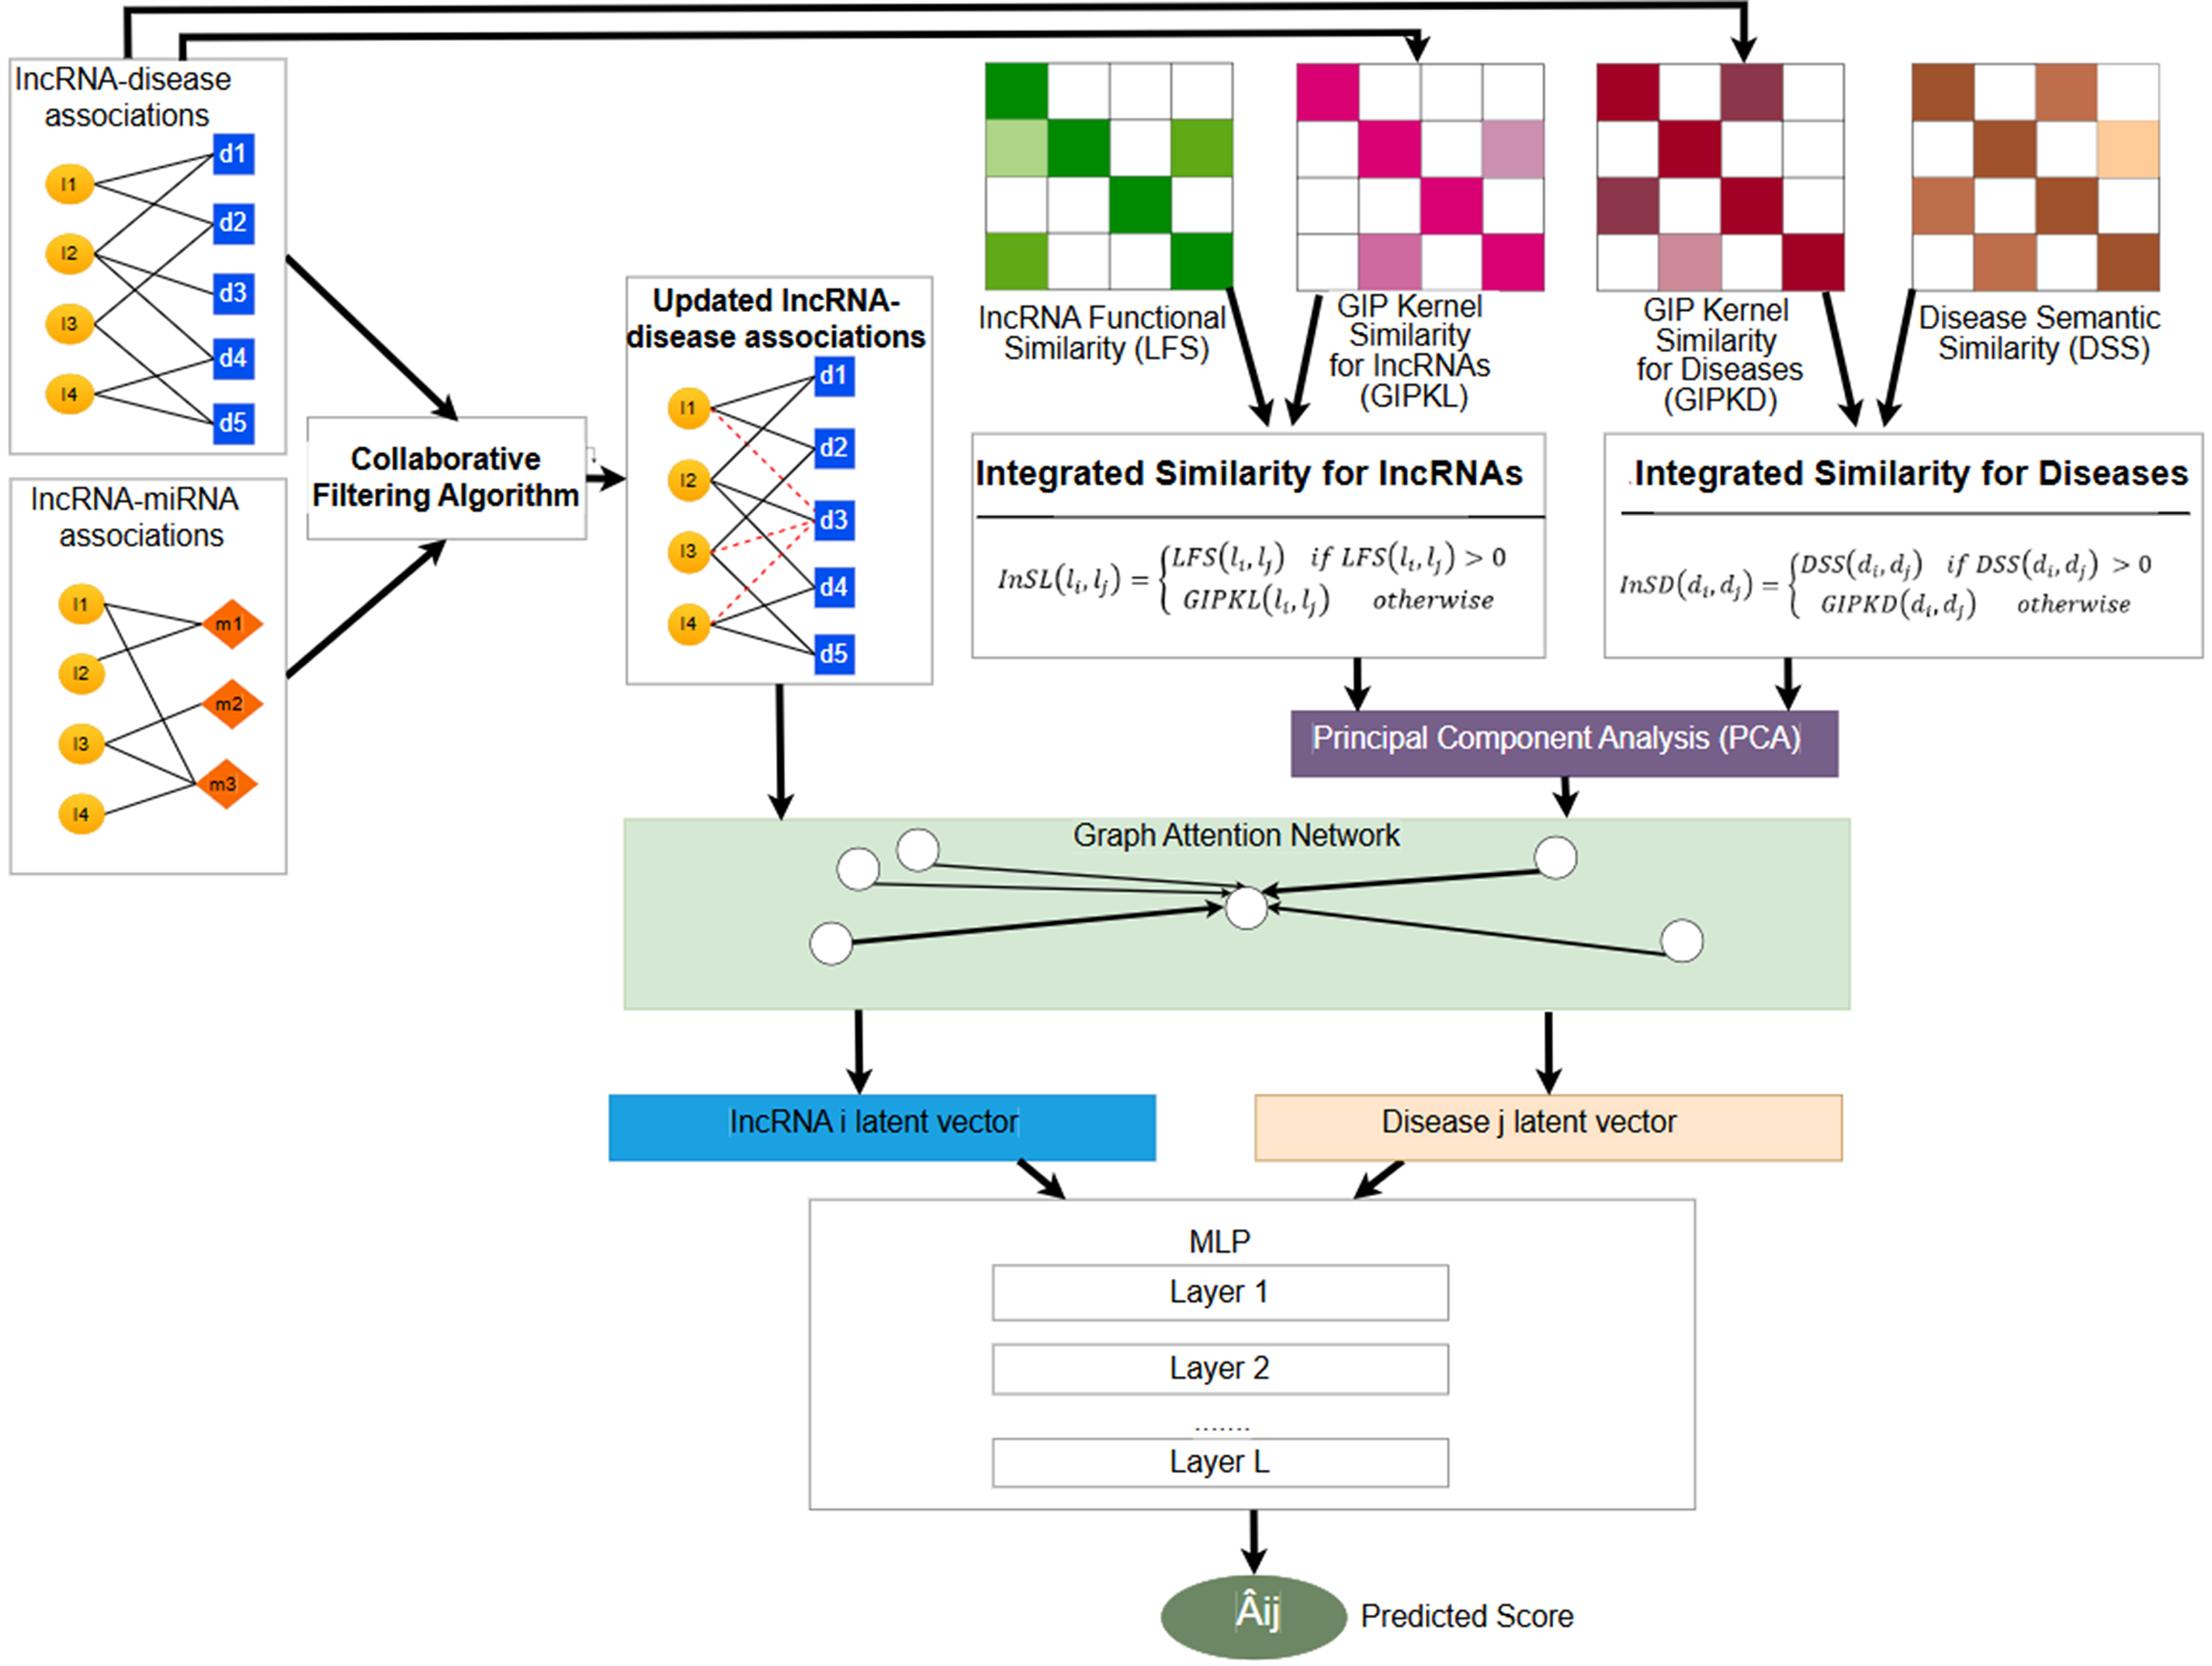
Figure 1: CFGANLDA method’s workflow. It contains the following stages: 1. Calculating the integrated similarity for diseases and lncRNAs according to Eqs. (6) and (7); 2. Reducing noise of integrated similarities using PCA; 3. Applying a CF algorithm to obtain an updated lncRNA-disease association set; 4. Employing a GAN to obtain embedded features; 5. Predicting lncRNA-disease associations using an MLP
In this paper, we utilized the datasets that were previously used in [47] for our experiments. These datasets were also widely used in various works, including [13,15,36,46]. In these datasets, the number of lncRNA, disease and miRNA are 240, 412 and 495, respectively. Among them, 2697 experimentally confirmed associations exist between 240 lncRNAs and 412 diseases. There are 1002 validated associations between 495 miRNAs and 240 lncRNAs. They also contain lncRNA functional similarity, and disease semantic similarity information. From these datasets, we used known lncRNA-disease associations, known lncRNA-miRNA interactions, disease semantic similarity and lncRNA functional similarity in the experiments, as described below.
2.2.1 Validated lncRNA-Disease Associations
The validated lncRNA-disease association set was collected from the Lnc2Cancer [48], GeneRIF [49], and LncRNADisease [50] databases. This association set comprises 2697 validated associations among 412 diseases and 240 lncRNAs. The sparsity of this dataset is 2.73%. We used an
2.2.2 Verified lncRNA-miRNA Associations
The set of verified lncRNA-miRNA associations was collected from starBase database [51]. There are 1002 verified associations between 240 lncRNAs and 495 miRNAs.
This association set is represented as an adjacency matrix ALM where
2.2.3 Disease Semantic Similarity
In this work, we used the diseases semantic similarity (
2.2.4 LncRNA Functional Similarity
As previous studies [14,47,52], in this work, lncRNA functional similarity
where
2.3.1 GIP kernel Similarity for lncRNAs and Diseases
Based on the assumption that functionally similar lncRNAs typically have comparable associations with similar diseases, and vice versa [53], this paper determines lncRNA GIP kernel similarity and disease GIP kernel similarity using the ALD matrix.
Assume that the vector related to lncRNA
where
here
In the similar way, we computed the disease
where
here
2.3.2 Integrated Similarity for lncRNAs and Diseases
In fact, determining semantic similarity for all diseases is challenging. Consequently, to leverage disease similarity information from multiple sources, we integrated disease semantic similarity with the GIP kernel for diseases (GIPKD) to obtain the integrated similarity for diseases (InSD), following previous work [53] as follows:
similarly, integrated similarity for lncRNAs (InSL) was calculated according to previous work [53] as follows:
2.3.3 Reducing the Noises of Integrated Similarities using PCA
The integration of similarities from multiple sources inevitably introduces noise. To address the issue, a PCA is used to decrease the noise. PCA is a simple, efficient and unsupervised approach for feature selection [2], and it is one of the most widely used techniques for dimension reduction [54]. In this study, PCA is used as it may reduce model training time. Additionally, it extracts the most important information from data by identifying relevant features. Let
2.3.4 Applying a CF Algorithm to Obtain an Updated lncRNA-Disease Association Set
Undoubtedly, compared to the total number of associations in each category, the number of validated lncRNA-disease associations and validated lncRNA-miRNA associations, accounting for 2.727% and 0.84%, respectively, is extremely small. O mitigate the impact of sparse known associations, we employed an item-based CF algorithm to recommend relevant lncRNA nodes to disease nodes and miRNA nodes. In general, CF is recognized as a domain-independent prediction technique for content that cannot be easily and adequately described by attributes, such as content in biological networks. This means that CF can recommend items without analyzing the attributes of biological objects, thereby enriching heterogeneous information [55]. The CF algorithm was successfully employed to solve sparse data problems in previous studies [26,46]. In more detail, we concatenated two matrices of validated lncRNA-disease associations together with validated lncRNA-miRNA interactions to form a new matrix. The number of rows in the new matrix matches the number of lncRNAs, whereas the number of columns corresponds to the total number of diseases and miRNAs. Diseases and miRNAs were treated as users, whereas lncRNAs were treated as items in the CF algorithm. The CF algorithm contains the subsequent steps:
Step 1. Building a new ALDM adjacency matrix
The
Step 2. Constructing a new
Based on the ALDM matrix, we computed the
where
Step 3. Updating ALDM matrix based on
For a specific disease
Step 4. Separating the
By decomposing the
2.3.5 Graph Attention Network Embedding Features
Deep learning techniques have been widely employed in various studies to predict lncRNA-disease associations [2,13,36,56,57]. Among deep learning techniques, GAN is a neural network-based model that operates on graph-structured data [2]. GAN utilizes a graph containing structural information and node feature information as inputs. In this study, the graph is a lncRNA-disease bipartite graph, where the edges connecting lncRNAs to diseases represent the lncRNA-disease associations contained in the
where
To enhance the representation of input features, we defined a linear transformation applied to the input features as follows:
where
The core concept of GAN is to update node features by aggregating information from neighboring nodes and a self-attention mechanism is utilized to capture the varying significance of different nodes. The un-normalized attention coefficient
where
We used a softmax function to calculated the normalized attention coefficient as follows:
where
Then, we updated the features of nodes in
Typically, a multi-head attention mechanism is used to balance the learning process and enhance method’s capability [2]. During the learning progress, all nodes were replicated in H clones, each with separate weight matrix
2.3.6 Predicting lncRNA-Disease Associations Using MLP
At final stage, we used a multilayer perceptron (MLP) to infer lncRNA-disease associations. First, we concatenate the lncRNA embedding vector
In the training model process, the matrix
where N indicates the adjacency matrix size,
To assess CFGANLDA’s performance in inferring lncRNA-disease relationships, 10-fold cross-validation experiments were conducted in this study. The known lncRNA-disease association set is randomly divided into 10 parts. Nine out of ten parts served as training sets, while the remaining part was alternatively utilized as a testing set. We plotted the receiver operating characteristics curve (ROC) and measured the Area under roc curve (AUC) [58] to evaluate CFGANLDA’ performance. Additionally, we plotted the Precision-Recall curve and measured the Area under precision-recall curve (AUPR) to assess prediction performance. As acknowledged by Takaya Saito and Marc Rehmsmeier, Precision-Recall curve and AUPR are more informative than ROC and AUC when evaluating binary classifiers on imbalanced datasets [59].
To plot ROC and evaluate AUC metrics, we obtained the false positive rate (FPR) and true positive rate (TPR) metrics. FPR is used to denote the ROC curve’s abscissa, while TPR represents its ordinate. The FPR and TPR are computed using the following formulas:
where TP (true positive) and TN (true negative) represent the number of positive and negative samples that have been accurately predicted, respectively; FP (false positive), FN (false negative) denote the number of positive and negative samples that have been inaccurately predicted, respectively.
To plot Precision-Recall curve and measure the AUPR values, we calculated Precision and Recall values. Precision denotes the Precision-Recall curve’s ordinate whereas Recall corresponds t the Precision-Recall curve’s abscissa. Precision and Recall were computed using the following formulas:
3.2 AUC and AUPR Evaluating by 10-Fold-Cross-Validation Experiments
As previously mentioned, in 10-fold cross-validation experiments, we first took the validated lncRNA-disease associations to be positive samples while the unknown associations were considered negative samples. Second, we arbitrarily divided all positive and negative samples into 10 equivalent parts. Third, 9 out of 10 parts of positive and negative samples were treated as training set and the remaining one is used as testing set in a particular experimental running time in which the values of elements in testing set are changed from 1 to 0. Finally, we recalculated
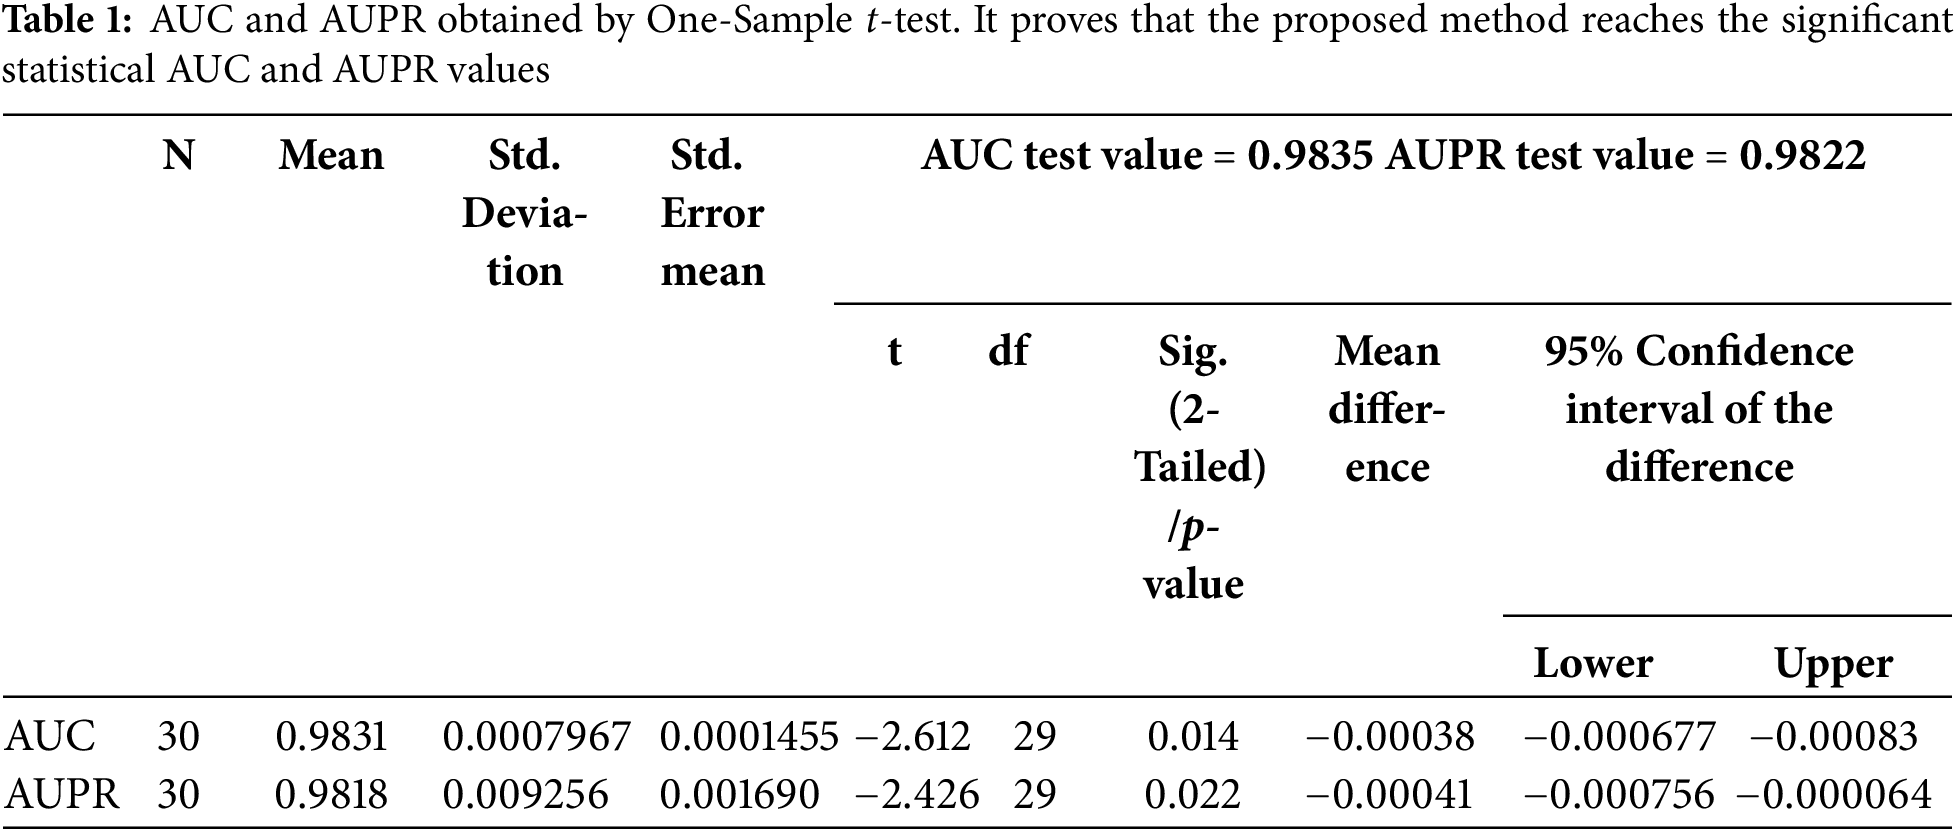
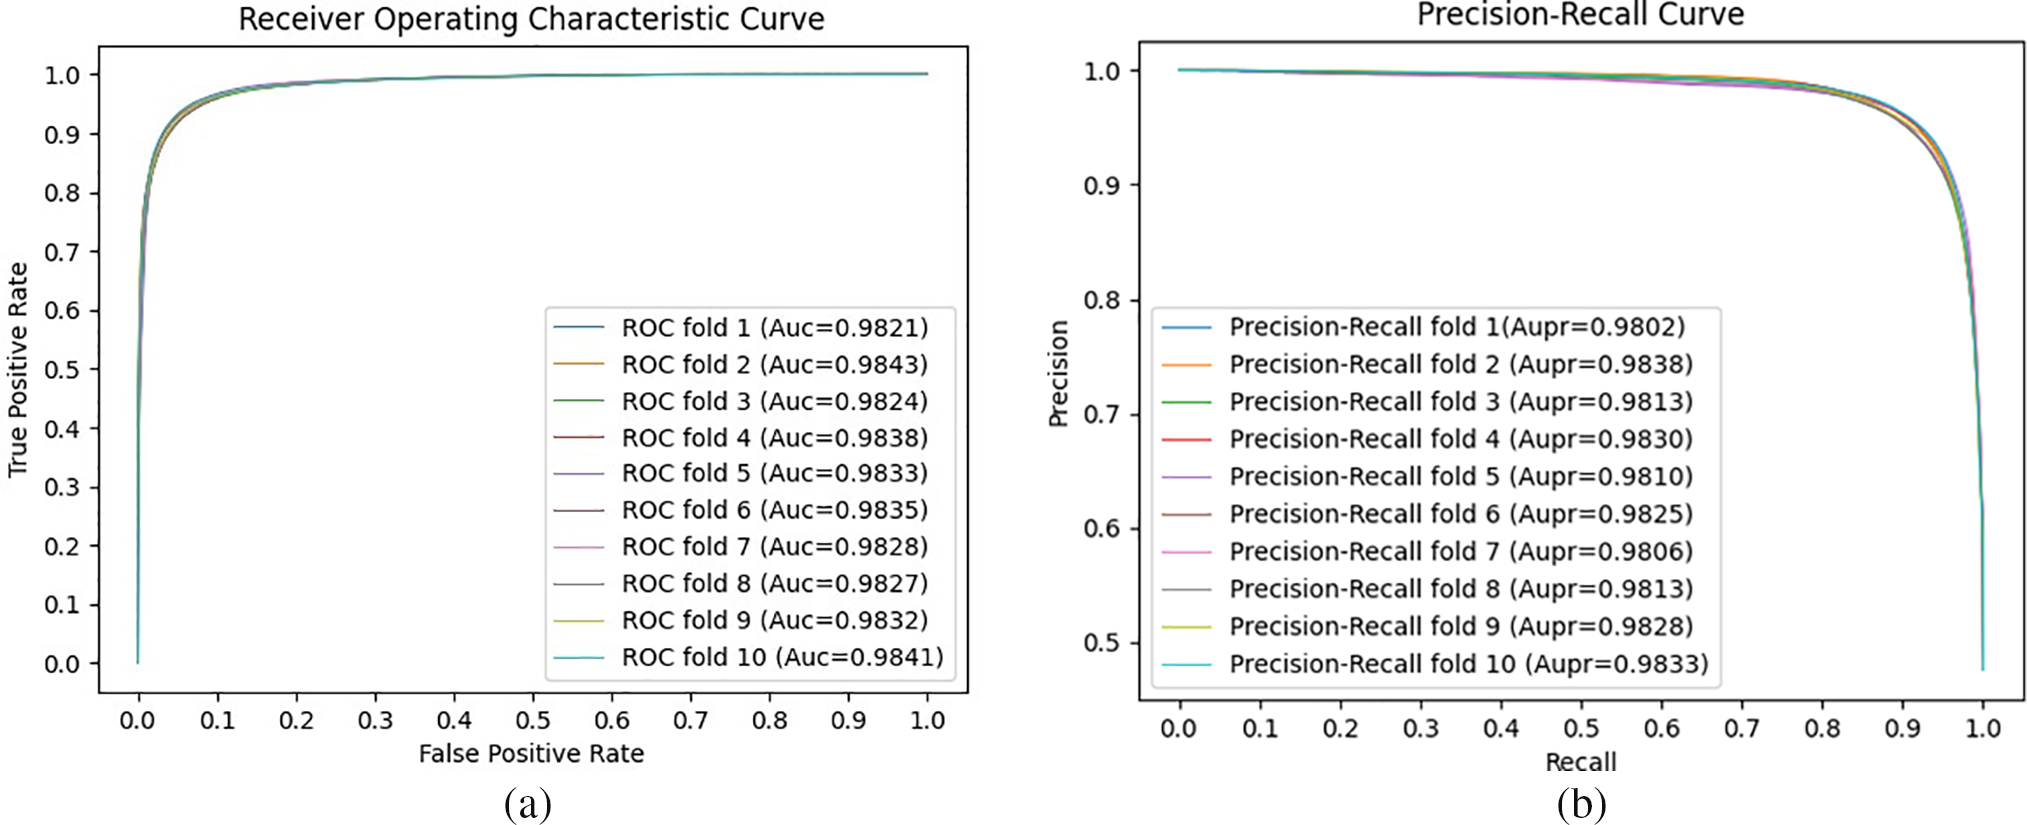
Figure 2: ROC curves along with AUC values (a) and Precision-Recall curves along with AUPR values (b) in 10-fold cross-validation experiments’ 10 running times
In this study, to evaluate the impact of the CF algorithm and the integration of multiple similarities in our CFGANLDA method, we conducted some ablation studies. Fig. 3 shows the performance of our proposed method and two ablation cases: (1) applying CF and no integrating multiple similarities; (2) no applying CF algorithm and no integrating multiple similarities.
Figure 3: ROC curves along with AUC values (a) and Precision-Recall curves along with AUPR values (b) in ablation case studies. The results illustrate that both the integration of multiple similarities and collaborative filtering make contributions to improvement in prediction performance
As shown in Fig. 3, CFGANLDA achieved the highest performance, and it indicates that applying both the CF algorithm and integrated multiple similarities play a role in enhancing prediction performance.
3.4 Performance in Comparison with Other Related Methods
To demonstrate CFGANLDA’s superior performance in comparison to other state-of-the-art methods for inferring lncRNA-disease associations, we compared its performance with several state-of-the-art models, including GANLDA [2], IPCARF [28], VGAELDA [36], ITPGLDA [46], and HGNNLDA [47] under 10-fold cross-validation experiments.
As shown in Fig. 4, CFGANLDA exhibited competitive performance or outperformed other related methods in both AUC and AUPR measurements.

Figure 4: ROC curves along with AUC values (a) and Precision-Recall curves along with AUPR values (b) in comparison with other state-of-the-art methods. It proves that the proposed method is competitive or superior to the other methods in both AUC and AUPR values
Specifically, CFGANLDA’s AUC and AUPR values are slightly higher than those of the ITPGLDA method. Moreover, it is significantly superior to the GANLDA, IPCARF, VGAELDA and HGNNLDA methods in both AUC and AUPR measurements. This suggests that CFGANLDA can be considered as an effective tool for lncRNA-disease association prediction.
Inspired by the GANLDA [2] method, in this paper, the graph attention network parameters are set as follows: the number of iterative training is set to 1000 by using a stochastic optimization Adam [60]. The number of GAN layers is set to 1. Both the number of heading and embedding are set to 8. The dropout rate is set to 0.4, and the last hidden layer is set to 64. The PCA embedding size is set to 128. The learning rate and weight decay are set to 0.005 and 0.00005, respectively.
In addition to the 10-fold cross-validation experiments, three case studies on prostate cancer, liver cancer, and stomach cancer were conducted to enhance the trustworthiness of prediction performance. We performed experiments using all known and unknown lncRNA-disease association samples. For each selected disease (Prostate cancer, Liver cancer, and Stomach cancer), we computed disease-associated lncRNA scores, ranked them in descending order, and selected the top 15 disease-associated lncRNAs. Finally, we validated the predicted results using alternative databases or verified biological literature.
3.6.1 Prostate Cancer Case Study
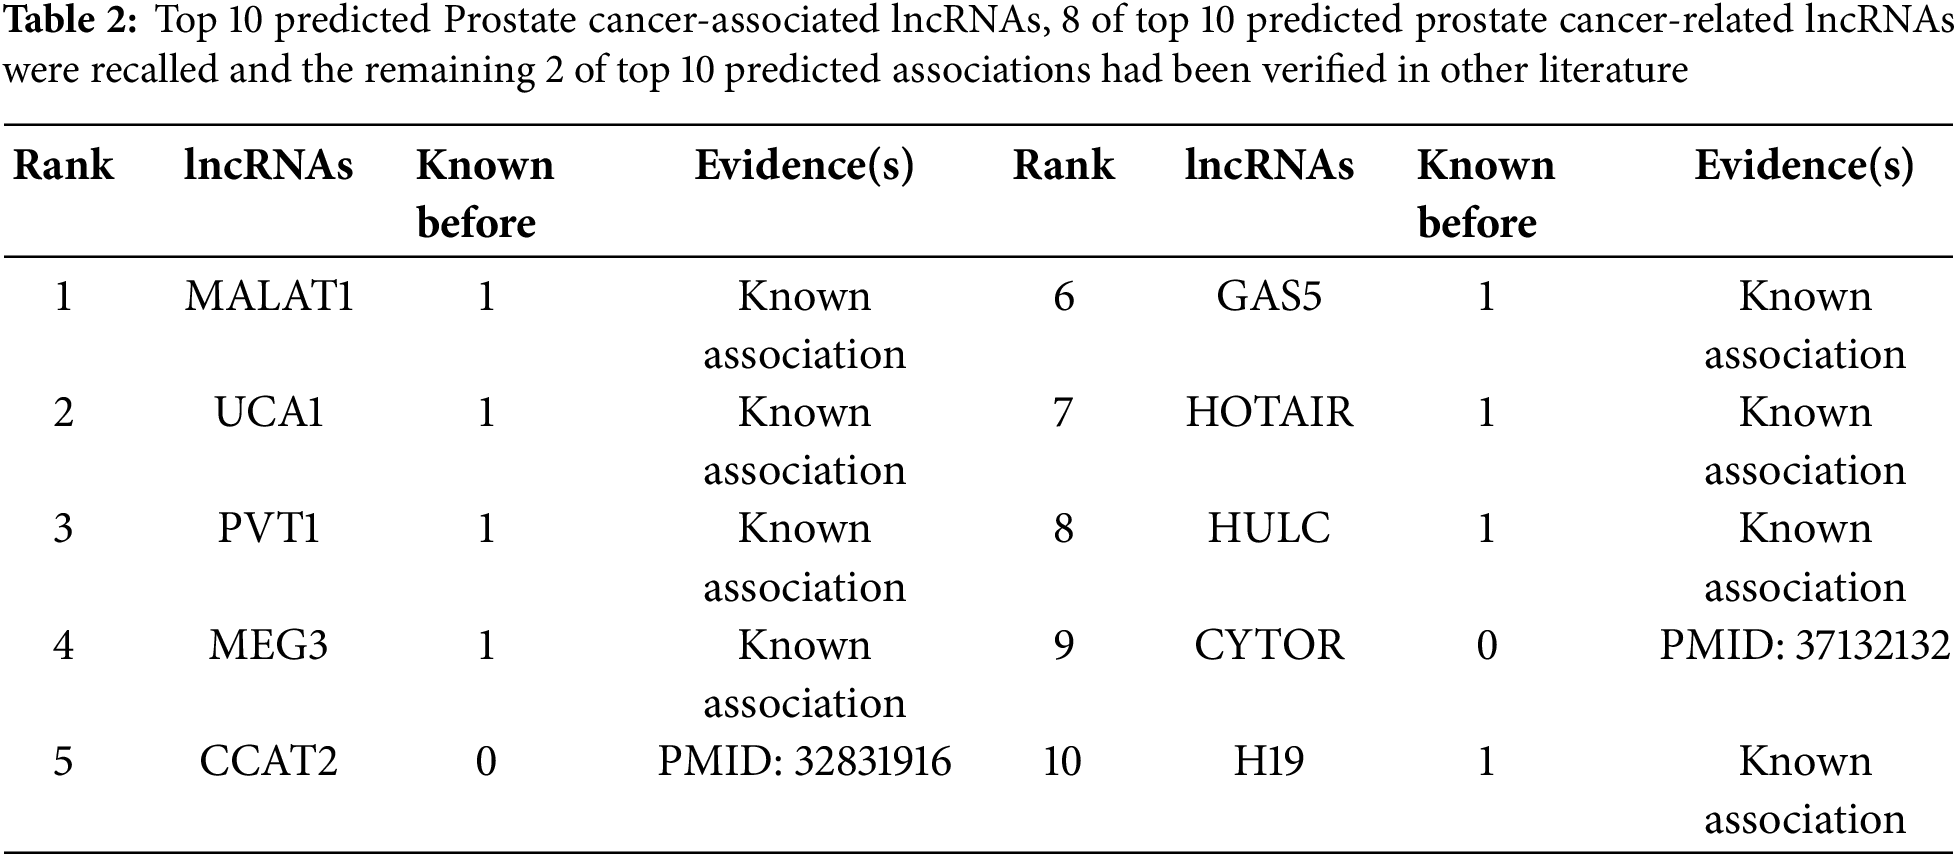
Prostate cancer is one of the most prevalent cancer types and a leading cause of cancer-related deaths in men [61]. Numerous lncRNAs have been shown to play crucial roles in various diseases in different manners. For example, lncRNA H19 regulates tumor plasticity in neuroendocrine prostate cancer [62]. lncRNA UCA1 acts as a ceRNA to speed up prostate cancer progression by sponging miR143 [63]. The knockdown of MATLAT1 lncRNA inhibits prostate cancer progression by regulating miR-140/BIRC6 axis [64]. It is the reason of selecting prostate cancer as a case study for further validation. As shown in Table 2, 8 out of top 10 predicted prostate cancer-related lncRNAs were retrieved from known associations while 2 of top 10 predicted associations are previously unknown. Both of the two new predicted associations were recently verified in other literature. Specifically, lncRNA CCAT2 has recently been proven to promote cell proliferation and invasion of prostate cancer by regulating the Wnt/β-catenin signaling pathway [65]. The prostate cancer progression was driven by lncRNA CYTOR via supporting AR-V7 generation and its oncogenic signaling [66].
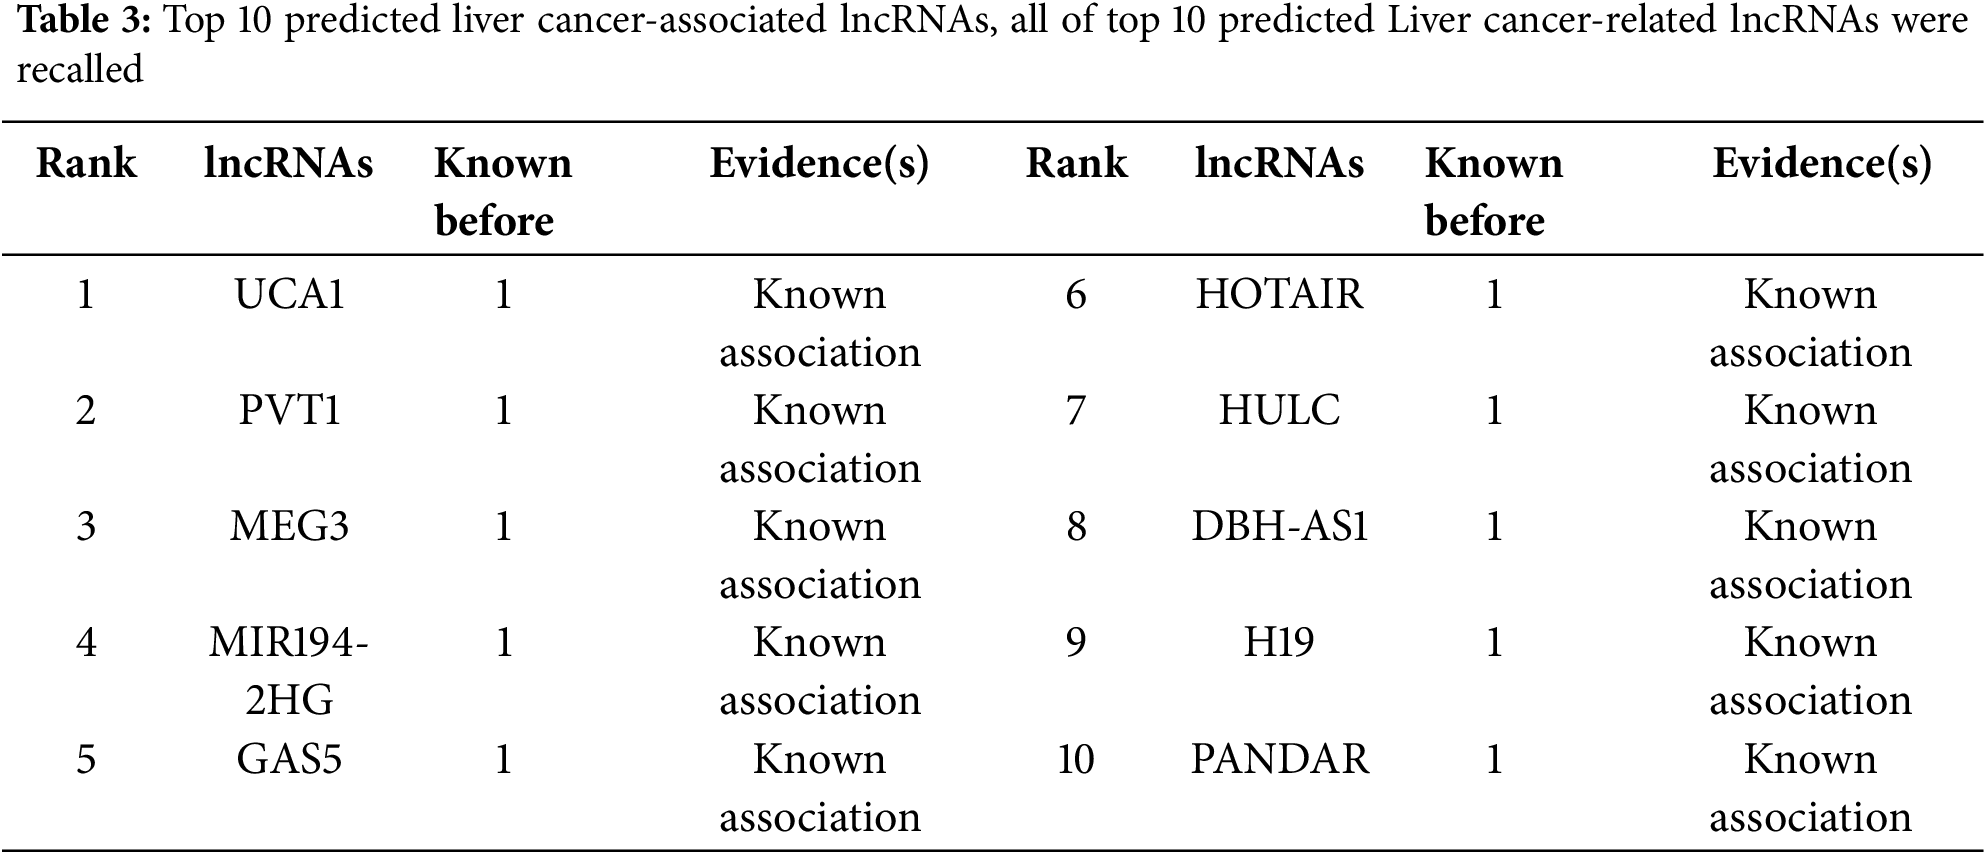
Liver cancer is recognized as the second leading cause of cancer-related deaths globally and the fifth in the United States, with a low survival rate as 18% per year and with limited treatment options [67,68]. It is crucial to develop new therapeutic methods for liver cancer treatment and curing. Primary liver cancer mainly includes two pathophysiological subtypes comprising Hepatocellular Carcinoma (HCC) and Cholangiocarcinoma (CCA) [67]. HCC is the ninth leading cause of cancer-related deaths in the United States [69,70]. Long non-coding RNAs have already been demonstrated to play crucial roles in different biological processes, including the apoptosis, invasion, metastasis and cell proliferation of liver cancer. For example, by regulating miR-544/RUNX3, lncRNA GAS5 bolsters the malignant growth of human liver cancer stem cells [71]. In this paper, we selected liver cancer as a case study for increasing the reliability of our method prediction performance. As demonstrated in Table 3, CFGANLDA recalled 10 out of top 10 predicted associations.
3.6.3 Stomach Cancer Case Study
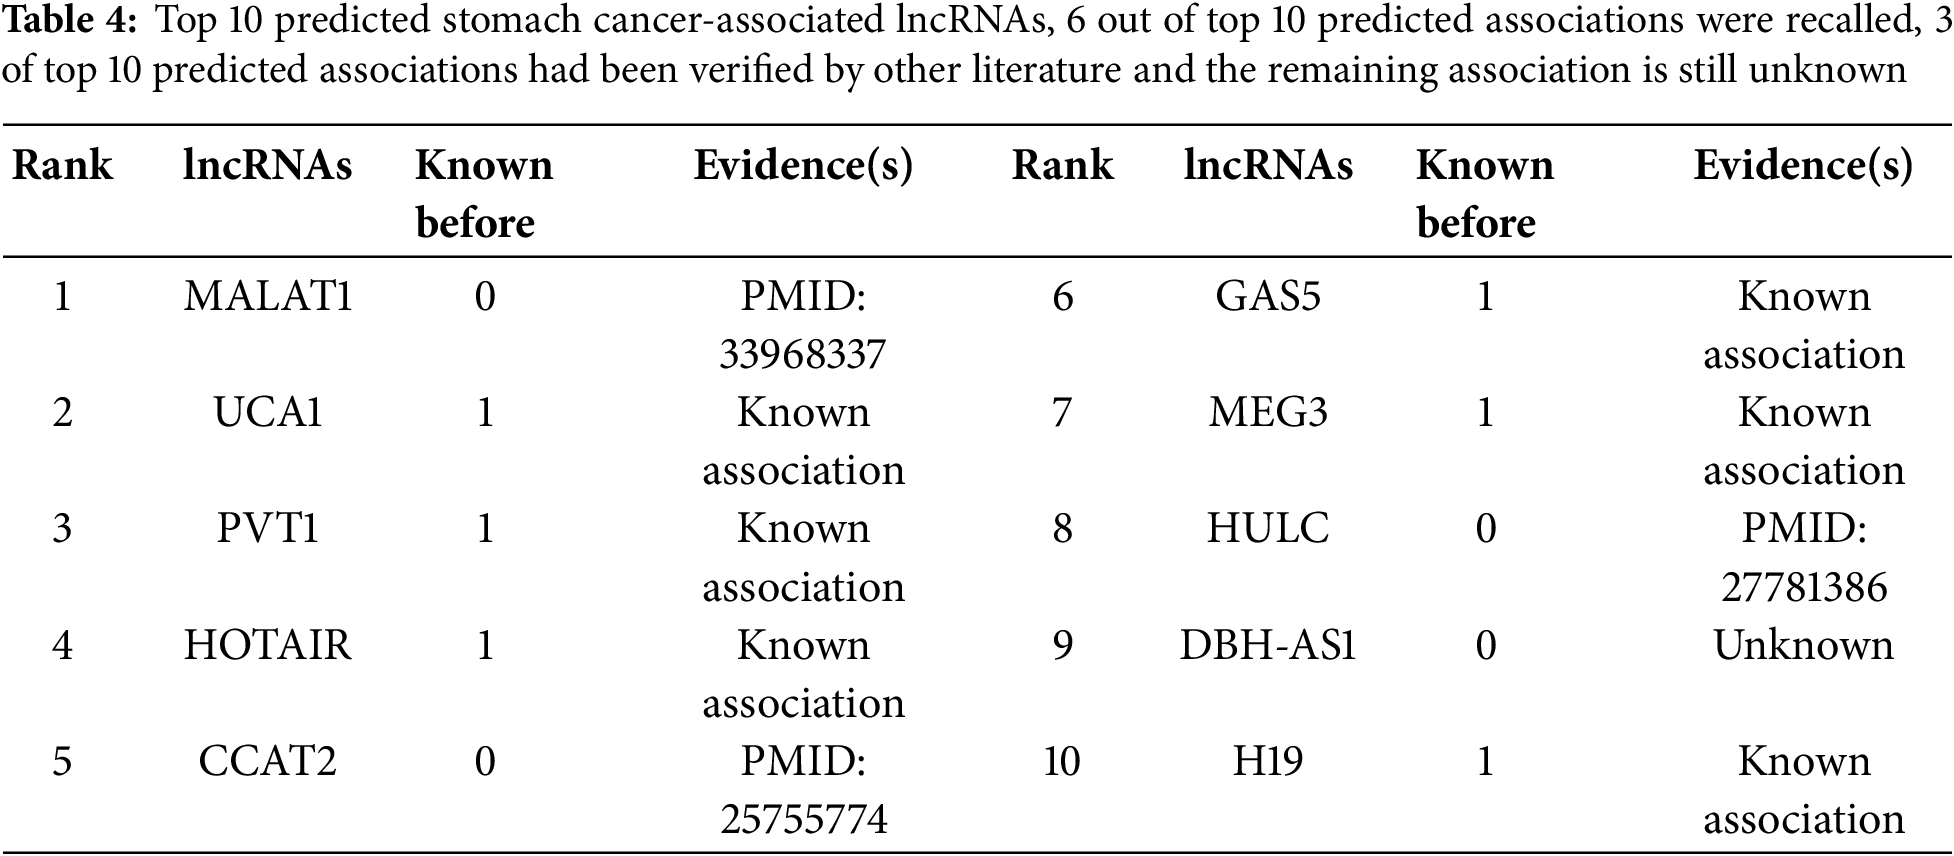
Stomach cancer, also known as Stomach Neoplasms or Gastric cancer, is one of the most popular malignant neoplasms worldwide, with a high incidence and mortality [72]. Various studies have indicated that lncRNAs are involved in the progression and development of Stomach/Gastric cancer. For example, lncRNA MEG3 regulates the growth of gastric cancer by acting as a competing endogenous RNA [73]. The high expression of lncRNA PVT1 infers metastasis in Han and Uygur Patients with Gastric Cancer [74]. Through the regulation of EMT, lncRNA MEG3 inhibits the growth, invasion and migration of gastric cancer cells [75]. In this study, stomach cancer was selected as a case study to further validate our method’s performance in predicting lncRNA-disease associations. Among the top 10 predicted stomach cancer-associated lncRNAs, six were already known associations, while four were newly predicted. Three out of the four newly predicted associations have been verified in other literature, as shown in Table 4, while the remaining association remains unknown. Particularly, lncRNA MALAT1 expression was demonstrated to have a correlation with gastric cancer tissues compared with adjacent healthy tissues [76]. lncRNA CCAT2 is up-regulated in stomach cancer and associated with poor prognosis [77]. The up-regulation of lncRNA is associated with poor pathological and clinical outcomes in gastric cancer [78].
Numerous studies have shown that lncRNAs are involved in various biological processes, including early cell development, proliferation, differentiation, apoptosis, and more. Investigating the associations between lncRNAs and diseases is crucial. However, it is costly, laborious and time-consuming to infer potential lncRNA-disease associations via traditional biological experiments.
Consequently, developing computational tools for predicting lncRNA-disease associations has become urgently need, attracting attention of many researchers in recent years. Up to now, a large number of computational approaches, grouped into different categories, have been developed to infer latent lncRNA-disease associations. Notably, the deep learning-based computational methods for predicting lncRNA-disease associations have gained dominant interest. In this paper, we proposed a computational method based on collaborative filtering and graph attention networks to predict lncRNA-disease associations. Graph attention network is a deep learning technique based on neural network architecture. It uses graph structure information and graph node features to process both linear and non-linear information, enabling the extraction of high-quality features of lncRNA-disease associations and improving prediction performance. Our proposed method achieved high performance in predicting lncRNA-disease associations, as demonstrated by the values of AUC (Area Under Roc Curve) and AUPR (Area Under Precision-Recall Curve) of 0.9835 and 0.9822, respectively, under 10-fold-cross-validation experiments. The AUC and AUPR values are statistically significant, as supported by One sample t-test verification. Its prediction performance outperforms several state-of-the-art approaches, including GANLDA [2], IPCARF [28], VGAELDA [36], ITPGLDA [46] and HGNNLDA [47] methods. The reliability of prediction performance is supported by three case studies of Prostate cancer, Liver cancer and Stomach cancer with 2, 0, and 4 newly predicted associations for each case, respectively. Most of the new predicted associations have been verified in other biological literature. Therefore, our proposed CFGANLDA method can be recognized as a valuable tool for inferring potential lncRNA-disease associations.
The CFGANLDA achieved desirable prediction performance thanks to several contributing factors: Firstly, our method leverages the advantages of incorporating multiple types of biological information to enhance prediction performance, as indicated in the ablation case study. Secondly, the issue of sparse data is addressed by employing a collaborative filtering algorithm. Finally, GAN is a deep learning technique based on neural network architecture. It reinforces the linear and non-linear features of lncRNA-disease associations.
Although CFGANLDA achieved strong performance and its reliability is supported by some case studies. However, the number of known lncRNA-disease associations is still very limited, and the datasets used in experiments were already employed in other methods without updates. Therefore, it is essential to collect and update the known associations between biological objects to further improve the reliability of prediction performance in future research.
Acknowledgement: Not applicable.
Funding Statement: This research was supported by the Vietnam Ministry of Education and Training under project code B2023-SPH-14. The funders had no role in the design of the study, data collection, analysis, interpretation, or manuscript writing.
Author Contributions: Dang Hung Tran and Van Tinh Nguyen conceived and designed the study; Dang Hung Tran and Van Tinh Nguyen performed computational analyses, while Van Tinh Nguyen collected data and performed experiments. Dang Hung Tran wrote the first draft of the manuscript. All authors reviewed the results and approved the final version of the manuscript.
Availability of Data and Materials: The processed data are available upon request. Contact to corresponding: Van Tinh Nguyen. Email: nguyenvantinh_cntt@haui.edu.vn.
Ethics Approval: Not applicable.
Conflicts of Interest: The authors declare no conflicts of interest to report regarding the present study.
Abbreviations
| AUC | Area Under Receiver Operating Characteristic Curve |
| AUPR | Area Under Precision-Recall Curve |
| FN | False Negative |
| FP | False Positive |
| SVD | Singular Value Decomposition |
| FPR | False Positive Rate |
| TP | True Positive |
| TPR | True Positive Rate |
| lncRNA | long non-coding RNA |
| miRNA | micro RNA |
| HCC | Hepatocellular carcinoma |
| GAN | Graph attention network |
| GIP | Gaussian interaction profile |
| CF | Collaborative filtering |
| MLP | Multi layer perceptron |
References
1. Core LJ, Waterfall JJ, Lis JT. Nascent RNA sequencing reveals widespread pausing and divergent initiation at human promoters. Science. 2008;322(5909):1845–8. [Google Scholar] [PubMed]
2. Lan W, Wu X, Chen Q, Peng W, Wang J, Chen YP. GANLDA: graph attention network for lncRNA-disease associations prediction. Neurocomputing. 2022;469:384–93. [Google Scholar]
3. Wei Y, Zhang Q, Liu L. The improved de Bruijn graph for multitask learning: predicting functions, subcellular localization, and interactions of noncoding RNAs. Brief Bioinform. 2024;26(1):bbae627. [Google Scholar] [PubMed]
4. Li X, Xu J, Xiao Y, Ning S. Non-coding RNAs in complex diseases. Singapore: Springer; 2018. [Google Scholar]
5. Yang W, Redpath RE, Zhang C, Ning N. Long non-coding RNA h19 promotes the migration and invasion of colon cancer cells via MAPK signaling pathway. Oncol Lett. 2018;16(3):3365–72. [Google Scholar] [PubMed]
6. Chen X, Yan CC, Zhang X, You ZH. Long non-coding RNAs and complex diseases: from experimental results to computational models. Brief Bioinform. 2017;18(4):558–76. [Google Scholar] [PubMed]
7. Mohanty V, Gökmen-Polar Y, Badve S, Janga SC. Role of lncRNAs in health and disease-size and shape matter. Brief Funct Genom. 2015;14(2):115–29. doi:10.1093/bfgp/elu034. [Google Scholar] [PubMed] [CrossRef]
8. Jiang B, Yang B, Wang Q, Zheng X, Guo Y, Lu W. LncRNA PVT1 promotes hepatitis B virus positive liver cancer progression by disturbing histone methylation on the c Myc promoter. Oncol Rep. 2020;43(2):718–26. [Google Scholar] [PubMed]
9. Guttman M, Rinn JL. Modular regulatory principles of large non-coding RNAs. Nature. 2012;482(7385):339–46. doi:10.1038/nature10887. [Google Scholar] [PubMed] [CrossRef]
10. Wang KC, Chang HY. Molecular mechanisms of long noncoding RNAs. Mol Cell. 2011;43(6):904–14. doi:10.1016/j.molcel.2011.08.018. [Google Scholar] [PubMed] [CrossRef]
11. Yuan L, Xu ZY, Ruan SM, Mo S, Qin JJ, Cheng XD. Long non-coding RNAs towards precision medicine in gastric cancer: early diagnosis, treatment, and drug resistance. Mol Cancer. 2020;19(1):1–22. doi:10.1186/s12943-020-01219-0. [Google Scholar] [PubMed] [CrossRef]
12. Lei X, Mudiyanselage TB, Zhang Y, Bian C, Lan W, Yu N, et al. A comprehensive survey on computational methods of non-coding RNA and disease association prediction. Brief Bioinform. 2021;22(4):bbaa350. doi:10.1093/bib/bbaa350. [Google Scholar] [PubMed] [CrossRef]
13. Wang L, Zhong C. gGATLDA: lncRNA-disease association prediction based on graph-level graph attention network. BMC Bioinform. 2022;23(1):1–24. doi:10.1186/s12859-021-04548-z. [Google Scholar] [PubMed] [CrossRef]
14. Chen X, Clarence Y, Luo C, Ji W, Zhang Y, Dai Q. Constructing lncRNA functional similarity network based on lncRNA-disease associations and disease semantic similarity. Sci Rep. 2015;5(1):11338. doi:10.1038/srep11338. [Google Scholar] [PubMed] [CrossRef]
15. Xie G, Huang Z, Liu Z, Lin Z, Ma L. NCPHLDA: a novel method for human lncRNA-disease association prediction based on network consistency projection. Mol Omics. 2019;15(6):442–50. doi:10.1039/C9MO00092E. [Google Scholar] [PubMed] [CrossRef]
16. Wang L, Xiao Y, Li J, Feng X, Li Q, Yang J. IIRWR: internal inclined random walk with restart for lncRNA-disease association prediction. IEEE Access. 2019;7:54034–41. doi:10.1109/ACCESS.2019.2912945. [Google Scholar] [CrossRef]
17. Xie GB, Chen RB, Lin ZY, Gu GS, Yu JR, Liu ZG, et al. Predicting lncRNA-disease associations based on combining selective similarity matrix fusion and bidirectional linear neighborhood label propagation. Brief Bioinform. 2023;24(1):bbac595. [Google Scholar] [PubMed]
18. Bonomo M, Rombo SE. Neighborhood based computational approaches for the prediction of lncRNA-disease associations. BMC Bioinform. 2024;25(1):187. [Google Scholar]
19. Chen M, Deng Y, Li A, Tan Y. Inferring latent disease-lncRNA associations by label-propagation algorithm and random projection on a heterogeneous network. Front Genet. 2022;13:798632. [Google Scholar] [PubMed]
20. Fu G, Wang J, Domeniconi C, Yu G. Matrix factorization-based data fusion for the prediction of lncRNA-disease associations. Bioinformatics. 2018;34(9):1529–37. [Google Scholar]
21. Lu C, Yang M, Luo F, Wu FX, Li M, Pan Y, et al. Prediction of lncRNA-disease associations based on inductive matrix completion. Bioinformatics. 2018;34(19):3357–64. [Google Scholar] [PubMed]
22. Xuan Z, Li J, Yu J, Feng X, Zhao B, Wang L. A probabilistic matrix factorization method for identifying lncRNA-disease associations. Genes. 2019;10(2):126. [Google Scholar] [PubMed]
23. Liu JX, Gao MM, Cui Z, Gao YL, Li F. DSCMF: prediction of LncRNA-disease associations based on dual sparse collaborative matrix factorization. BMC Bioinform. 2021;22:1–18. [Google Scholar]
24. Zeng M, Lu C, Zhang F, Li Y, Wu FX, Li Y, et al. SDLDA: lncRNA-disease association prediction based on singular value decomposition and deep learning. Methods. 2020;179:73–80. [Google Scholar] [PubMed]
25. Fan Y, Chen M, Pan X. GCRFLDA: scoring lncRNA-disease associations using graph convolution matrix completion with conditional random field. Brief Bioinform. 2022;23(1):1–12. [Google Scholar]
26. Yu J, Xuan Z, Feng X, Zou Q, Wang L. A novel collaborative filtering model for LncRNA-disease association prediction based on the Naïve Bayesian classifier. BMC Bioinform. 2019;20(1):1–13. [Google Scholar]
27. Yao D, Zhan X, Zhan X, Kwoh CK, Li P, Wang J. A random forest based computational model for predicting novel lncRNA-disease associations. BMC Bioinform. 2020;21(1):1–18. doi:10.1186/s12859-020-3458-1. [Google Scholar] [PubMed] [CrossRef]
28. Zhu R, Wang Y, Liu JX, Dai LY. IPCARF: improving lncRNA-disease association prediction using incremental principal component analysis feature selection and a random forest classifier. BMC Bioinform. 2021;22(1):1–17. doi:10.1186/s12859-021-04104-9. [Google Scholar] [PubMed] [CrossRef]
29. Zhang Y, Ye F, Xiong D, Gao X, Gao X. LDNFSGB: prediction of long non-coding rna and disease association using network feature similarity and gradient boosting. BMC Bioinform. 2020;21(1):1–27. doi:10.1186/s12859-020-03721-0. [Google Scholar] [PubMed] [CrossRef]
30. Sheng N, Cui H, Zhang T, Xuan P. Attentional multi-level representation encoding based on convolutional and variance autoencoders for lncRNA-disease association prediction. Brief Bioinform. 2021;22(3):1–14. doi:10.1093/bib/bbaa067. [Google Scholar] [PubMed] [CrossRef]
31. Pfeifer B, Baniecki H, Saranti A, Biecek P, Holzinger A. Multi-omics disease module detection with an explainable greedy decision forest. Sci Rep. 2022;12(1):1–15. doi:10.1038/s41598-022-21417-8. [Google Scholar] [PubMed] [CrossRef]
32. Nguyen VT, Tran DH. Predicting long non-coding RNA-disease associations using multiple features and deep learning. Res Dev Inf Commun Technol. 2022;2022(2):82–91. doi:10.32913/mic-ict-research.v2022.n2.1069. [Google Scholar] [CrossRef]
33. Yao D, Li B, Zhan X, Zhan X, Yu L. GCNFORMER: graph convolutional network and transformer for predicting lncRNA-disease associations. BMC Bioinform. 2024;25(1):1–20. doi:10.1186/s12859-023-05625-1. [Google Scholar] [PubMed] [CrossRef]
34. Li G, Bai P, Liang C, Luo J. Node-adaptive graph Transformer with structural encoding for accurate and robust lncRNA-disease association prediction. BMC Genom. 2024;25(1):1–26. doi:10.1186/s12864-024-09998-2. [Google Scholar] [PubMed] [CrossRef]
35. Yan C, Zhang Z, Bao S, Hou P, Zhou M, Xu C, et al. Computational methods and applications for identifying disease-associated lncRNAs as potential biomarkers and therapeutic targets. Mol Ther—Nucleic Acids. 2020;21(D1):156–71. doi:10.1016/j.omtn.2020.05.018. [Google Scholar] [PubMed] [CrossRef]
36. Shi Z, Zhang H, Jin C, Quan X, Yin Y. A representation learning model based on variational inference and graph autoencoder for predicting lncRNA-disease associations. BMC Bioinform. 2021;22(1):1–20. doi:10.1186/s12859-021-04073-z. [Google Scholar] [PubMed] [CrossRef]
37. Li J, Li J, Kong M, Wang D, Fu K, Shi J. SVDNVLDA: predicting lncRNA-disease associations by singular value decomposition and node2vec. BMC Bioinform. 2021;22(1):1–18. doi:10.1186/s12859-021-04457-1. [Google Scholar] [PubMed] [CrossRef]
38. Liang Y, Zhang ZQ, Liu NN, Wu YN, Gu CL, Wang YL. MAGCNSE: predicting lncRNA-disease associations using multi-view attention graph convolutional network and stacking ensemble model. BMC Bioinform. 2022;23(1):1–23. doi:10.1186/s12859-022-04715-w. [Google Scholar] [PubMed] [CrossRef]
39. Yao D, Deng Y, Zhan X, Zhan X. Predicting lncRNA-disease associations using multiple metapaths in hierar-chical graph attention networks. BMC Bioinform. 2024;25(1):1–23. [Google Scholar]
40. Peng L, Huang L, Su Q, Tian G, Chen M, Han G. LDA-VGHB: identifying potential lncRNA-disease associa-tions with singular value decomposition, variational graph auto-encoder and heterogeneous Newton boosting machine. Brief Bioinform. 2024;25(1):1–17. [Google Scholar]
41. Nguyen VT, Le TTK, Than K, Tran DH. Predicting miRNA-disease associations using improved random walk with restart and integrating multiple similarities. Sci Rep. 2021;11(1):1–16. doi:10.1038/s41598-021-00677-w. [Google Scholar] [PubMed] [CrossRef]
42. Ezzat A, Zhao P, Wu M, Li XL, Kwoh CK. Drug-target interaction prediction with graph regularized matrix factorization. IEEE/ACM Trans Comput Biol Bioinform. 2017;14(3):646–56. doi:10.1109/TCBB.2016.2530062. [Google Scholar] [PubMed] [CrossRef]
43. Gao YL, Cui Z, Liu JX, Wang J, Zheng CH. NPCMF: nearest profile-based collaborative matrix factorization method for predicting miRNA-disease associations. BMC Bioinform. 2019;20(1):353. doi:10.1186/s12859-019-2956-5. [Google Scholar] [PubMed] [CrossRef]
44. Li G, Luo J, Xiao Q, Liang C, Ding P. Predicting microRNA-disease associations using label propagation based on linear neighborhood similarity. J Biomed Inform. 2018;82(2014):169–77. doi:10.1016/j.jbi.2018.05.005. [Google Scholar] [PubMed] [CrossRef]
45. Nguyen VT, Le TTK, Nguyen TQV, Tran DH. Inferring miRNA-disease associations using collaborative filtering and resource allocation on a tripartite graph. BMC Med Genom. 2021;14(S3):1–12. doi:10.1186/s12920-021-01078-8. [Google Scholar] [PubMed] [CrossRef]
46. Nguyen VT, Tran DH. An improved computational method for prediction of lncRNA-disease associations based on collaborative filtering and resource allocation. In: 2021 13th International Conference on Knowledge and Systems Engineering (KSE); 2021 Nov 10–12; Bangkok, Thailand. [Google Scholar]
47. Shi H, Zhang X, Tang L, Liu L. Heterogeneous graph neural network for lncRNA-disease association prediction. Sci Rep. 2022;12(1):1–12. doi:10.1038/s41598-022-22447-y. [Google Scholar] [PubMed] [CrossRef]
48. Ning S, Zhang J, Wang P, Zhi H, Wang J, Liu Y, et al. Lnc2Cancer: a manually curated database of experimentally supported lncRNAs associated with various human cancers. Nucleic Acids Res. 2016;44(D1):D980–5. [Google Scholar] [PubMed]
49. Lu Z, Cohen KB, Hunter L. GeneRIF quality assurance as summary revision. In: Altman RB, Dunker AK, Hunter L, Murray T, Klein T, editors. Biocomputing. Singapore: World Scientific Publishing Company; 2007. p. 269–80. [Google Scholar]
50. Chen G, Wang Z, Wang D, Qiu C, Liu M, Chen X, et al. LncRNADisease: a database for long-non-coding RNA-associated diseases. Nucleic Acids Res. 2013;41(D1):D983–6. [Google Scholar] [PubMed]
51. Li JH, Liu S, Zhou H, Qu LH, Yang JH. starBase v2.0: decoding miRNA-ceRNA, miRNA-ncRNA and protein—RNA interaction networks from large-scale CLIP-Seq data. Nucleic Acids Res. 2014;42(D1):D92–7. [Google Scholar] [PubMed]
52. Wang JZ, Du Z, Payattakool R, Yu PS, Chen CF. A new method to measure the semantic similarity of GO terms. Bioinformatics. 2007;23(10):1274–81. [Google Scholar] [PubMed]
53. Li G, Luo J, Liang C, Xiao QIU, Ding P, Member S, et al. Prediction of LncRNA-disease associations based on network consistency projection. IEEE Access. 2019;7:58849–56. [Google Scholar]
54. Zhang C, Gai K, Zhang S. Matrix normal PCA for interpretable dimension reduction and graphical noise modeling. Pattern Recognit. 2024;154:110591. [Google Scholar]
55. Kuo RJ, Chen CK, Keng SH. Application of hybrid metaheuristic with perturbation-based K-nearest neighbors algorithm and densest imputation to collaborative filtering in recommender systems. Inf Sci. 2021;575(1):90–115. doi:10.1016/j.ins.2021.06.026. [Google Scholar] [CrossRef]
56. Lu Z, Zhong H, Tang L, Luo J, Zhou W, Liu L. Predicting lncRNA-disease associations based on heterogene-ous graph convolutional generative adversarial network. PLoS Comput Biol. 2023;19(11):1–28. [Google Scholar]
57. Wang S, Qiao J, Feng S. Prediction of lncRNA and disease associations based on residual graph convolutional networks with attention mechanism. Sci Rep. 2024;14(1):1–15. [Google Scholar]
58. Hajian-Tilaki K. Receiver operating characteristic (ROC) curve analysis for medical diagnostic test evaluation. Casp J Intern Med. 2013;4(2):627–35. [Google Scholar]
59. Saito T, Rehmsmeier M. The precision-recall plot is more informative than the ROC plot when evaluating binary classifiers on imbalanced datasets. PLoS One. 2015;10(3):e0118432. [Google Scholar] [PubMed]
60. Kingma DP, Ba JL. Adam: a method for stochastic optimization. In: 3rd International Conference on Learning Representations, ICLR 2015—Conference Track Proceedings; 2015 May 7–9; San Diego, CA, USA. p. 1–15. [Google Scholar]
61. McGuire S. World cancer report 2014. Geneva, Switzerland: World Health Organization, International Agency for Research on Cancer, WHO Press; 2015. p. 418–9. Adv Nutr. 2016;7(2):418–9 [Google Scholar]
62. Singh N, Ramnarine VR, Song JH, Pandey R, Padi SKR, Nouri M, et al. The long noncoding RNA H19 regulates tumor plasticity in neuroendocrine prostate cancer. Nat Commun. 2021;12(1):7349. [Google Scholar] [PubMed]
63. Yu Y, Gao F, He Q, Li G, Ding G. lncRNA UCA1 Functions as a ceRNA to promote prostate cancer progression via sponging miR143. Mol Ther—Nucleic Acids. 2020;19:751–8. [Google Scholar] [PubMed]
64. Hao T, Wang Z, Yang J, Zhang Y, Shang Y, Sun J. MALAT1 knockdown inhibits prostate cancer progression by regulating miR-140/BIRC6 axis. Biomed Pharmacother. 2020;123:109666. [Google Scholar] [PubMed]
65. He P, Xiong G, Guo W, Jiang G, Li Y, Li H. Long non-coding RNA CCAT2 promotes prostate cancer cell pro-liferation and invasion by regulating the Wnt/β-catenin signaling pathway. Oncol Lett. 2020;20(4):97. [Google Scholar] [PubMed]
66. Yu J, Shen T, Li Y, Hao T, Yang L, Li H, et al. CYTOR drives prostate cancer progression via facilitating AR-V7 generation and its oncogenic signalling. Clin Transl Med. 2023;13(5):1–7. [Google Scholar]
67. Wang Y, Zeng J, Chen W, Fan J, Hylemon PB, Zhou H. Long noncoding RNA H19: a novel oncogene in liver cancer. Noncoding RNA. 2023;9(2):19. [Google Scholar] [PubMed]
68. Fang P, Xiang L, Chen W, Li S, Huang S, Li J, et al. LncRNA GAS5 enhanced the killing effect of NK cell on liver cancer through regulating miR-544/RUNX3. Innate Immun. 2019;25(2):99–109. [Google Scholar] [PubMed]
69. O’Connor S, Ward JW, Watson M, Momin B, Richardson L. Hepatocellular Carcinoma—United States, 2001–2006. Morb Mortal Wkly Rep. 2010;59(17):517–20. [Google Scholar]
70. Balogh J, Iii DV, Gordon S, Li X, Ghobrial Jr, H.P.M. RM. Hepatocellular carcinoma: a review. J Hepatocell Carcinoma. 2016;3:41–53. [Google Scholar] [PubMed]
71. Li H, An J, Wu M, Zheng Q, Gui X, Li T, et al. LncRNA HOTAIR promotes human liver cancer stem cell ma-lignant growth through downregulation of SETD2. Oncotarget. 2015;6(29):27847–64. [Google Scholar] [PubMed]
72. Zhang C, Liang Y, Ma MH, Wu KZ, Zhang CD, Dai DQ. Downregulation of microRNA-376a in gastric cancer and association with poor prognosis. Cell Physiol Biochem. 2018;51(5):2010–8. [Google Scholar] [PubMed]
73. Peng W, Si S, Zhang Q, Li C, Zhao F, Wang F, et al. Long non-coding RNA MEG3 functions as a competing endogenous RNA to regulate gastric cancer progression. J Exp Clin Cancer Res. 2015;34(1):1–10. [Google Scholar]
74. Ren X, Cao D, Yang L, Li X, Zhang W, Xiao Y, et al. High Expression of long non-coding RNA PVT1 predicts metastasis in Han and Uygur Patients with Gastric Cancer in Xinjiang. China Sci Rep. 2019;9(1):1–11. [Google Scholar]
75. Jiao J, Zhang S. Long non-coding RNA MEG-3 suppresses gastric carcinoma cell growth, invasion and migration via EMT regulation. Mol Med Rep. 2019;20(3):2685–93. [Google Scholar] [PubMed]
76. Chaleshi V, Aghdaei HA, Nourian M, Iravani S, Jalaeikhoo H, Rajaeinejad M, et al. Association of MALAT1 expression in gastric carcinoma and the significance of its clinicopathologic features in an Iranian patient. Gastroenterol Hepatol Bed Bench. 2021;14(2):108–14. [Google Scholar] [PubMed]
77. Wang CY, Hua L, Yao KH, Chen JT, Zhang JJ, Hu JH. Long non-coding RNA CCAT2 is up-regulated in gastric cancer and associated with poor prognosis. Int J Clin Exp Pathol. 2015;8(1):779–85. [Google Scholar] [PubMed]
78. Yu X, Zheng H, Chan MTV, Wu WKK. HULC: an oncogenic long non-coding RNA in human cancer. J Cell Mol Med. 2017;21(2):410–7. [Google Scholar] [PubMed]
Cite This Article
 Copyright © 2025 The Author(s). Published by Tech Science Press.
This work is licensed under a Creative Commons Attribution 4.0 International License , which permits unrestricted use, distribution, and reproduction in any medium, provided the original work is properly cited.
 Downloads
 Citation Tools