
 Submit a Paper
 Propose a Special lssue
 Open Access
ARTICLE
Neighbor Displacement-Based Enhanced Synthetic Oversampling for Multiclass Imbalanced Data
1 Department of Electronics Technology, Faculty of Electrical Engineering and Informatics, Budapest University of Technology and Economics, Budapest, 1111, Hungary
2 Department of Informatics, Faculty of Engineering and Vocational, Universitas Pendidikan Ganesha, Singaraja, 81116, Indonesia
* Corresponding Author: I Made Putrama. Email:
Computers, Materials & Continua 2025, 83(3), 5699-5727. https://doi.org/10.32604/cmc.2025.063465
Received 15 January 2025; Accepted 09 April 2025; Issue published 19 May 2025
 View Full Text
 Download PDF
Abstract
Imbalanced multiclass datasets pose challenges for machine learning algorithms. They often contain minority classes that are important for accurate predictions. However, when the data is sparsely distributed and overlaps with data points from other classes, it introduces noise. As a result, existing resampling methods may fail to preserve the original data patterns, further disrupting data quality and reducing model performance. This paper introduces Neighbor Displacement-based Enhanced Synthetic Oversampling (NDESO), a hybrid method that integrates a data displacement strategy with a resampling technique to achieve data balance. It begins by computing the average distance of noisy data points to their neighbors and adjusting their positions toward the center before applying random oversampling. Extensive evaluations compare 14 alternatives on nine classifiers across synthetic and 20 real-world datasets with varying imbalance ratios. This evaluation was structured into two distinct test groups. First, the effects of k-neighbor variations and distance metrics are evaluated, followed by a comparison of resampled data distributions against alternatives, and finally, determining the most suitable oversampling technique for data balancing. Second, the overall performance of the NDESO algorithm was assessed, focusing on G-mean and statistical significance. The results demonstrate that our method is robust to a wide range of variations in these parameters and the overall performance achieves an average G-mean score of 0.90, which is among the highest. Additionally, it attains the lowest mean rank of 2.88, indicating statistically significant improvements over existing approaches. This advantage underscores its potential for effectively handling data imbalance in practical scenarios.Keywords
Imbalanced data remains a persistent challenge in various domains within the enterprise, especially in the context of classification tasks [1–3]. Imbalanced datasets have a much larger number of majority classes than one or more heavily underrepresented minority classes. This imbalance problem creates substantial challenges for standard machine learning algorithms to accurately identify the minority classes, where correctly classifying these instances is often critical in many applications [4]. In the financial sector, imbalanced data classification poses significant obstacles, especially in fraud detection applications. Fraudulent transactions occur less frequently than legitimate transactions, resulting in a highly skewed dataset. Failure to accurately detect fraudulent activity can cause significant financial losses to organizations [5]. Similarly, in manufacturing, as automation advances and production complexity increases, monitoring equipment performance becomes essential to prevent failures and ensure safety. This makes collecting equipment data and detecting process patterns and anomalies to support maintenance strategies crucial [6]. However, in practice, equipment failures occur less frequently than in normal operations, resulting in imbalanced datasets [7,8]. Using imbalanced datasets for classification, relying solely on accuracy can be misleading. For example, a dataset with a 99% majority class and 1% minority class might show a high accuracy of 99% if the model correctly classifies all majority class instances despite failing to detect the critical minority class instances accurately [9].
To deal with imbalanced data, various strategies have been developed for classification tasks involving methods categorized into data level, algorithm level, or a combination of both [10–12]. These approaches aim to present intelligence diagnostic results in enterprise applications accurately. However, in industrial scenarios, the complexity of data acquisition under the aforementioned conditions often leads to data collection that may exhibit small-sample problems, making it challenging to establish highly accurate models when insufficient data is available [13]. Additionally, the data may contain errors or anomalies, where noise in imbalanced data significantly affects the performance of the diagnostic algorithm [14,15]. Moreover, while the use of existing oversampling, undersampling, or hybrid methods has been found effective in dealing with imbalanced data, this approach does not always produce synthetic samples that are entirely free of noise or avoid overlapping between data. This is especially prominent for data that naturally has many overlapping data points. In such conditions, existing methods that generate new samples based on the unclean original data distribution tend to produce increasingly noisy samples, causing the generated data to deviate significantly from the original pattern, which ultimately affects the overall accuracy and effectiveness of the model.
In this paper, we introduce a hybrid resampling method called Neighbor Displacement-based Enhanced Synthetic Oversampling (NDESO), which aims to correct the noisy data points within each class by moving them closer to their centroids before oversampling is performed to balance the data distribution. This method identifies data points that are located around k-neighbors with different classes. The displacement is done by analyzing the distance of the relative position of the data point to its neighbors and then moving it closer to the corresponding class centroid based on the distance. This displacement process adjusts the data points towards their corresponding centroid, aligning them more closely with the characteristics of their class while preserving the original class label. With the adjusted position of noisy data, class balancing is performed through oversampling minority classes, ensuring improved outcomes while maintaining the patterns of the original data.
This study adopts a methodology similar to that proposed by [16], with a workflow illustrated in Fig. 1. The process started with data exploration, followed by data preprocessing. Since the datasets originate from a widely used public repository, they are already cleaned and pre-processed, requiring minimal additional preprocessing. The main adjustment involves encoding categorical columns and rescaling the data. A resampling method is then applied to address the imbalance in the target variable, followed by the application of a classifier. Several metrics are measured, with the G-mean score reported in this study. The evaluation of the proposed method is done through a comparative analysis of 14 different resampling methods in an experiment using nine different classifiers on 20 real-world datasets. Statistical tests indicate that our proposed method yields significantly lower critical differences, demonstrating a notable improvement in performance compared to other methods.
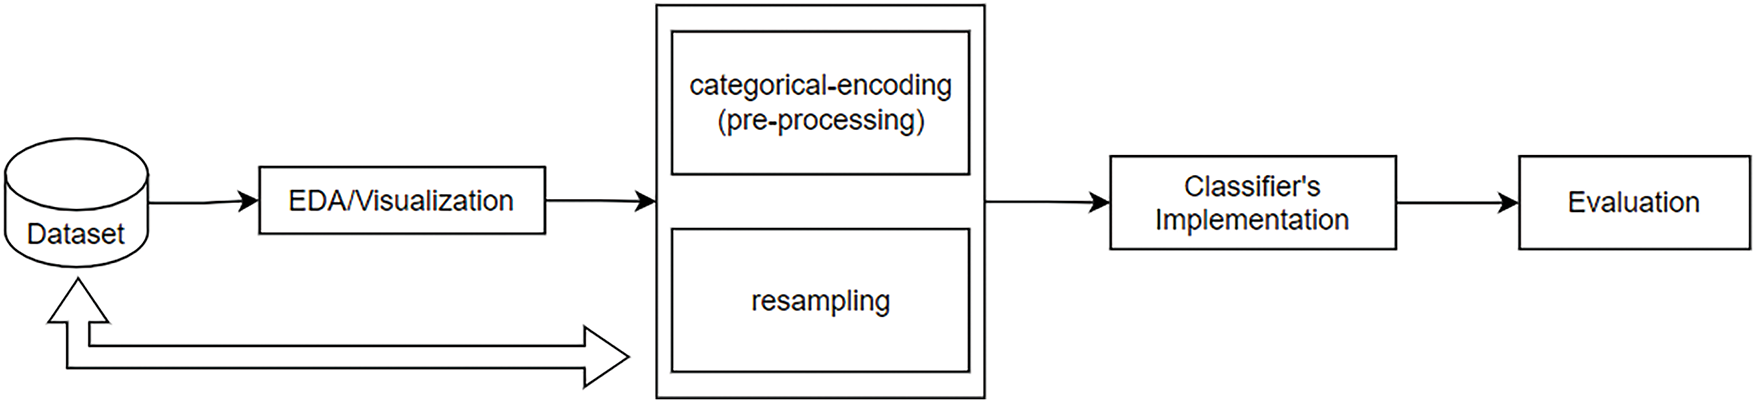
Figure 1: Research methodology
The remainder of this manuscript is structured as follows: Section 2 explores existing research related to the field. Section 3 outlines the objectives of our study. Section 4 describes the method used for our proposed framework. Experiments covering data collection, system specifications, testing procedures, and results are described in Section 5, which thoroughly demonstrates the efficacy of our approach. Section 6 provides a summary of our findings and offers suggestions for future research directions. Finally, Section 7 provides the conclusion of our work.
Real-world classification datasets often have imbalanced class distributions, with many samples in one class and few in others. Many datasets feature multiclass or multilabel distributions, involving more than two classes or allowing instances to belong to multiple classes. Existing approaches can be grouped into data-level, algorithmic, or mixed methods that combine both approaches to address this imbalanced data problem. However, in this study, our approach is oriented towards data-level methods.
The data-level method uses a re-sampling strategy: under-sampling, over-sampling, or hybrid-sampling. Random undersampling (RUS) and random oversampling (ROS) are two techniques used to remove or add samples to make the classes balanced [17,18]. RUS is the most straightforward undersampling technique, where the existing majority of samples are removed until the class distribution is balanced. Another widely used undersampling technique is NearMiss, introduced by [19], which seeks to address class imbalance by selectively removing samples from the majority class. NearMiss eliminates majority class instances to enhance their separation when it detects proximity between instances of different classes. However, undersampling may inadvertently lead to reduced information, given the potential for eliminating valuable class instances [8]. Consequently, various methods have been proposed to improve data cleaning by identifying and removing redundant patterns and noise in the dataset, thereby enhancing classifier performance. Edited Nearest Neighbors (ENN), Condensed Nearest Neighbors (CNN), and Tomeklinks are several methods based on this technique [20]. These methods remove instances near the decision boundary between classes, enhancing class separation and improving classifier performance.
Unlike RUS, which removes example data, ROS replicates minority samples randomly until the class distribution is balanced. As a result, this method has been criticized for adding more data without contributing new information, which can lead to overfitting. To handle this problem, a well-known approach called Synthetic Minority Over-sampling TEchnique (SMOTE) was proposed [21]. SMOTE creates syntactic samples rather than directly copying from minority classes. It generates additional instances through interpolation within the k-nearest neighbors of a minority class [22]. Initially, a sample (x) is selected from the minority class, followed by another sample (y) from its k-nearest neighbors set within the same class. Subsequently, the new sample x’ is created through linear interpolation using the following formula:
The iterative process of creating new synthetic samples is carried out until the desired amount of oversampling is achieved. Despite its straightforward and innovative approach, SMOTE has a key shortcoming called overgeneralization, as it ignores within-class imbalance, which tends to increase class overlap. Furthermore, the generation of new synthetic points to address the sparsity of the minority class may inadvertently introduce uninformative and noisy instances that do not accurately represent the actual underlying data patterns [23]. These extraneous patterns can contribute to overfitting, potentially reducing the model’s generalizability. Since then, there have been other variations to the SMOTE approach, including Borderline-SMOTE, KMeans-SMOTE, and SMOTE with Support Vector Machine (SVM-SMOTE) [24]. Other variants exist that combine noise removal techniques aiming to clean data, such as SMOTE-Tomek and SMOTE with Edited Nearest Neighbors (SMOTE-ENN), which are methods designed to oversample minority classes in a dataset while also cleaning noisy instances [8]. These versions of the SMOTE technique focus on samples within the boundary area between classes, creating synthetic samples exclusively on the dividing line of two classes to avoid overfitting. Another recent hybrid variant was proposed by [23], which uses SMOTE for oversampling and Edited Centroid Displacement-based k-Nearest Neighbors (ECDNN) for undersampling, known as SMOTE-CDNN. The solution aims to minimize the within-cluster distance problem by using centroid displacement for class probability estimation. Other techniques similar to SMOTE, including Adaptive Synthetic Sampling (ADASYN) and Stacking algorithms, have been proposed to address multiclass imbalance problems, beating previous techniques regarding accuracy and sensitivity. ADASYN was introduced by [25] and focused on generating new samples by prioritizing instances based on the density distribution of the minority class. It creates more samples in areas where the minority class density is low and fewer samples where the minority class density is higher.
Despite the efficacy demonstrated by the earlier methods, our observations indicate that these techniques remain vulnerable to sparse, overlapping data points of multiclass imbalanced datasets. This leads to issues such as ‘within class imbalance’ and ‘small disjunct problem’, which have also been emphasized by [10,22,26]. When the minority classes have few samples, and oversampling is performed within clusters, the majority class overwhelmingly dominates the dataset, leaving the remaining classes with only sparse instances. Furthermore, employing an approach like SMOTE, which generates synthetic instances by interpolating between current samples of the minority class, may not be effective in sparse datasets, as shown in Fig. 2. This is because the minority class samples are scattered and limited but contain overlapping instances that belong to different classes, potentially leading to synthetic samples that do not accurately represent realistic or potential minority class samples. Consequently, this can result in a poorly performing model on new, unseen data. Moreover, it has been observed that resampling techniques like ADASYN and KMeans-SMOTE do not always consistently succeed in identifying enough samples that form clusters. They also often struggle to determine the minimum number of neighbors required for some datasets, which could affect the efficiency of these methods. These challenges motivated our study to explore innovative and better strategies for dealing with sparse datasets.
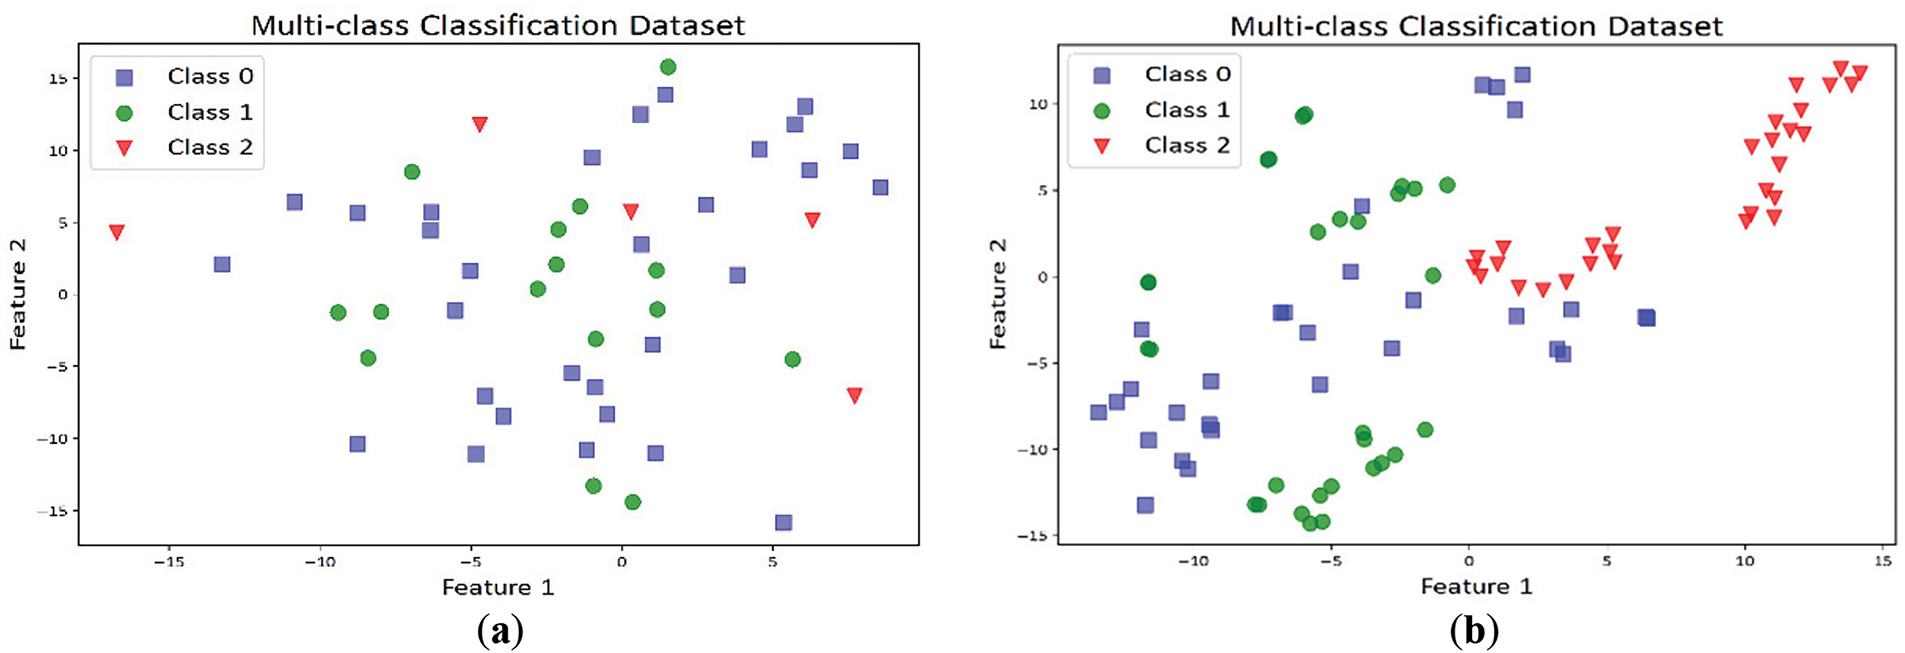
Figure 2: Visualization of resampling on a sparse multiclass dataset: (a) Original dataset; (b) Noisy resampled dataset using SMOTE
Our method differs from the ECDNN approach proposed by [27], which determines a test data point’s label based on the minimum displacement of the nearest class centroid of its k-neighbors after incorporating the test instance into the set. As illustrated in Fig. 3, a test example (yellow diamond) can be assigned to class B since it produces the lowest displacement of the class centroid compared to other classes. The approach is employed for undersampling to eliminate noisy data points when their labels are predicted differently. It is integrated with SMOTE to balance the dataset, forming a technique known as SMOTE-CDNN [23]. Although this approach successfully balances the dataset, in cases involving sparse multiclass imbalanced data where minority samples hold helpful information, altering their labels or removing them when their predicted class differs from their original class could unintentionally eliminate valuable instances, potentially affecting classification performance in real-world scenarios. Therefore, instead of discarding these noisy data points, our method employs a unique strategy that adjusts their positions by analyzing the distances between a data point and its k-neighbors. It displaces the position only if the data point belongs to the minority class within its neighborhood (i.e., if the majority of its neighbors belong to a different class). We hypothesize that this adjustment will preserve their class labels and characteristics while mitigating their influence as noise. This refinement is expected to enhance class separation and promote a more balanced representation, distinguishing our approach from existing methodologies.
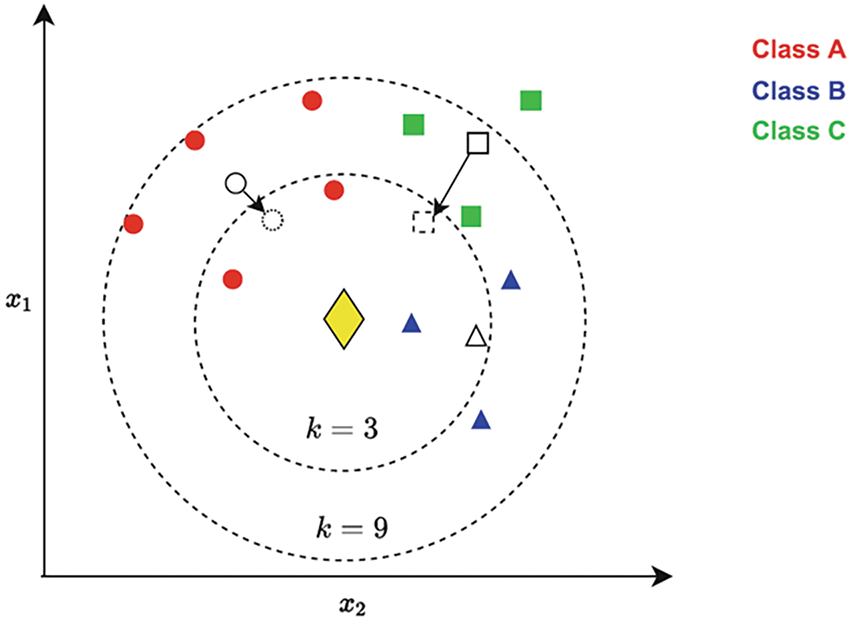
Figure 3: Visual illustration of the CDNN algorithm [27]
The primary objective of this study is to evaluate the effectiveness of displacing noisy data points towards the center of their respective classes, as depicted in Fig. 4 on the left, resulting in a more precise separation illustrated on the right before additional samples are generated to balance the dataset. This approach aims to yield a more accurate representation of the underlying patterns within the data. While our approach utilizes random oversampling as a straightforward technique to achieve optimal performance, using cleaner, centroid-aligned data points as a base will mitigate the common issue of overfitting associated with random oversampling.
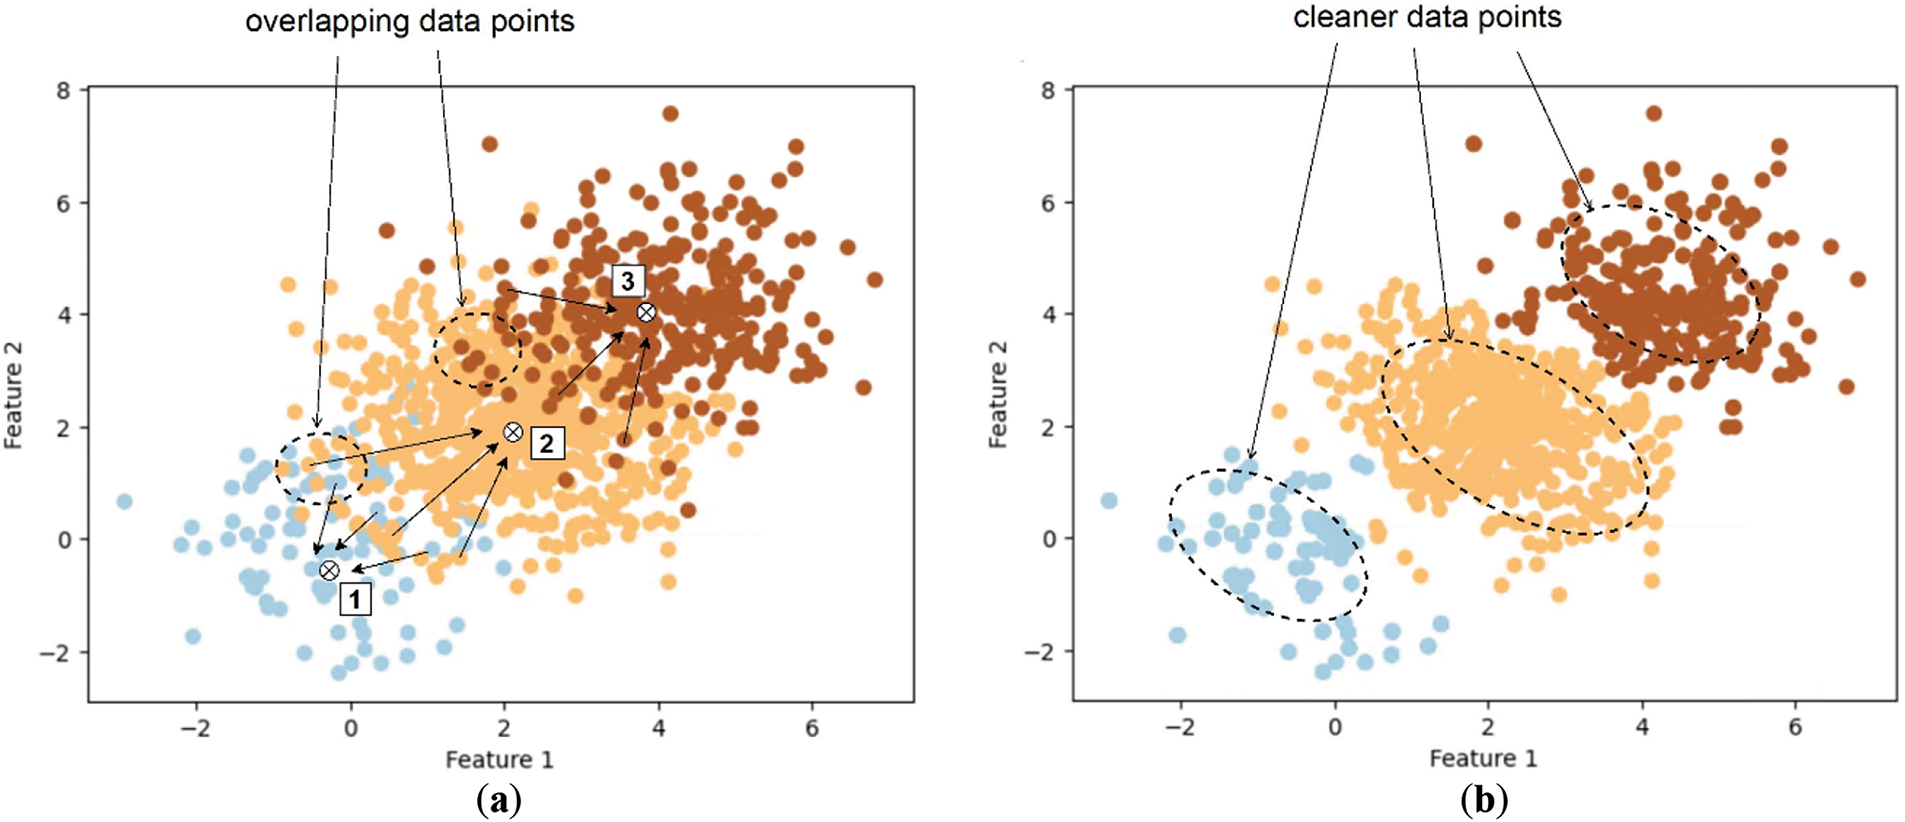
Figure 4: Visualization of class separation: (a) The original dataset with classes 1, 2, and 3, showing significant overlap among data points; (b) Improved class separation achieved through a displacement operation
Specifically, we seek to achieve the following objectives:
1. Create a resampling method that refines imbalanced datasets by shifting noisy data points towards their corresponding centroids, thus improving the dataset’s quality.
2. Integrate random oversampling to achieve class balance using the cleaned data points, thereby reducing computational overhead while enhancing model performance and preventing underfitting.
3. Conduct a comprehensive comparison of the proposed method with baseline resampling methods using multiple classifiers to evaluate the effectiveness and robustness of the approach.
4. Assess the performance of the resampling methods using the various metrics to ensure balanced classification performance across imbalanced datasets and apply the Friedman-Nemenyi non-parametric statistical tests to validate the results.
This section outlines the principle of our approach to perform the displacement of the noisy data points (NDE in Section 4.1) before performing random oversampling (NDESO in Section 4.2).
4.1 Neighbor-Based Displacement Enhancement (NDE)
The foundational version of our algorithm, known as Neighbor-based Displacement Enhancement (NDE), is designed to address noisy class data points by strategically repositioning them closer to their respective centroids to enhance class separation, which operates as follows.
Given a set of data points
1. A pairwise distance matrix
2. Based on the distance matrix
3. Iterate over the dataset
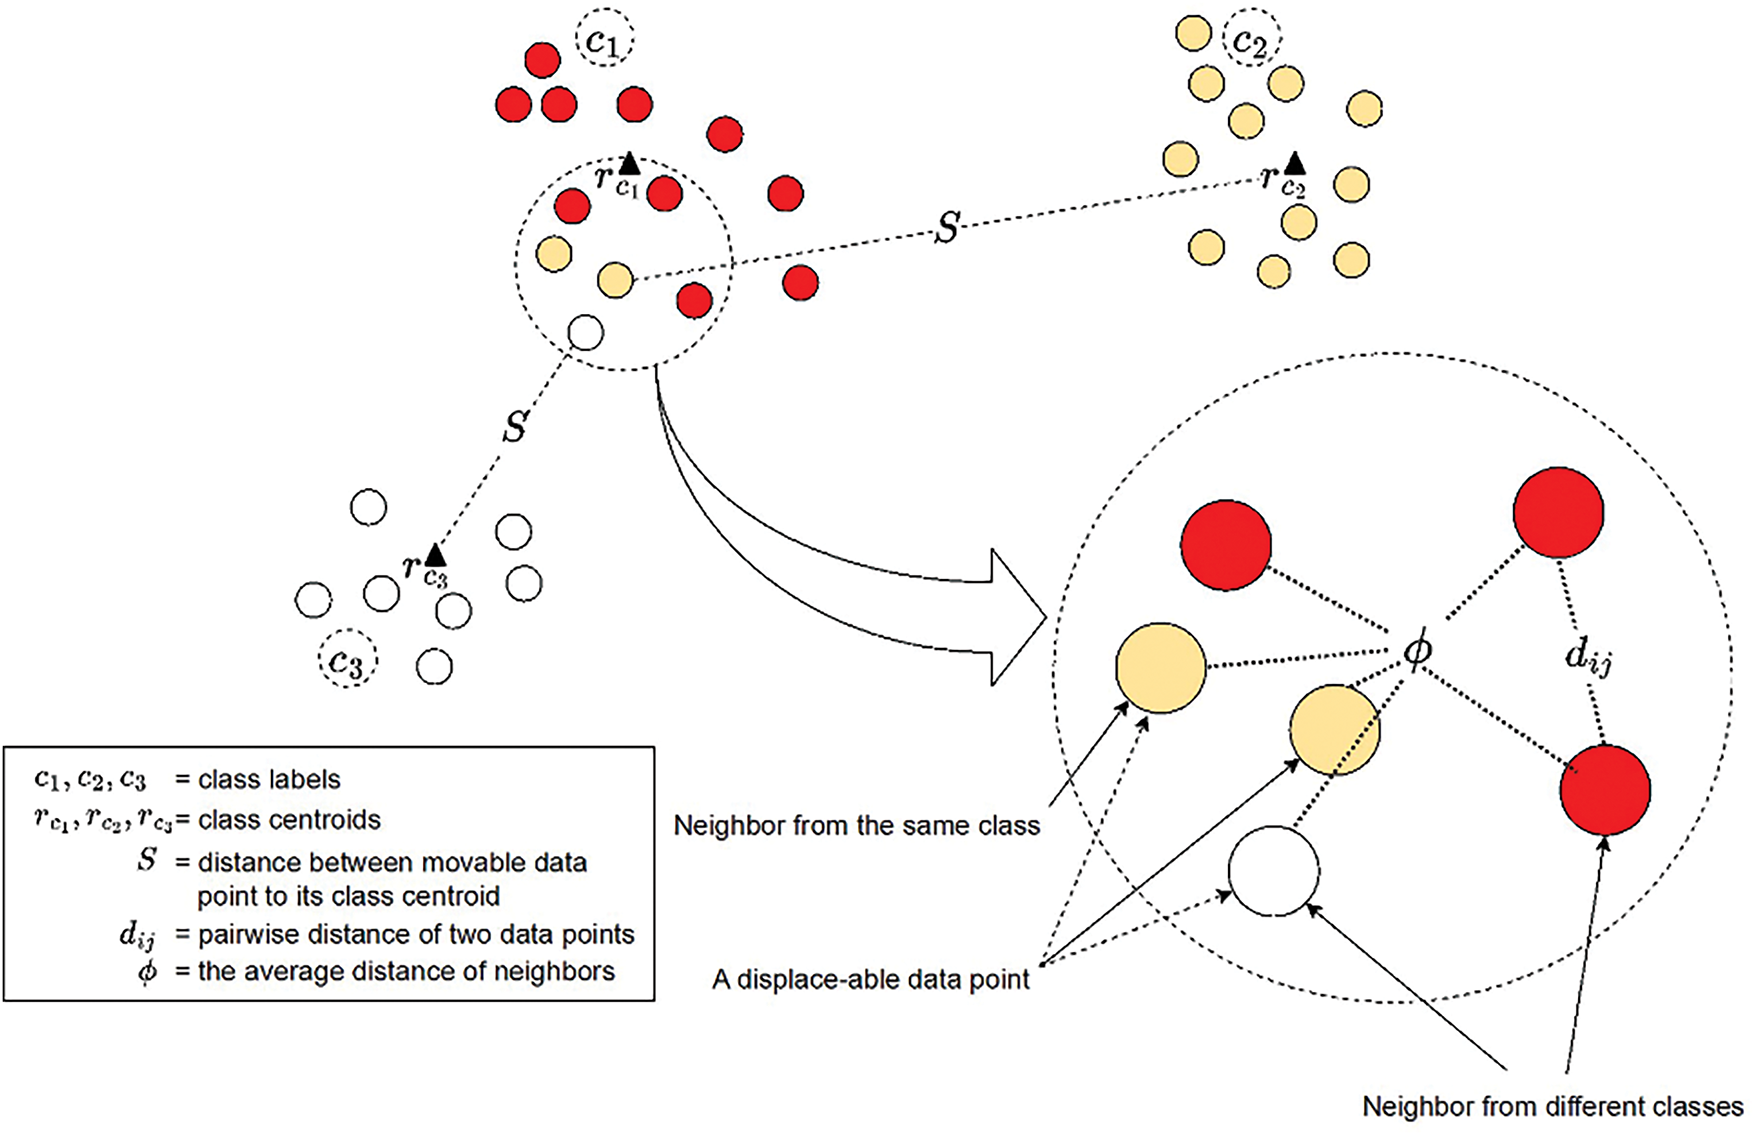
Figure 5: Visual illustration of displace-able data point identification
The set of displaceable data points
4. Compute the set of centroids
where
5. Iterate through the set of displace-able data points
Get the centroid
(b) Compute the normalized direction vector from
(c) Compute the displacement distance
(d) Displace
This NDE algorithm uses a default of k = 5 neighbors and the Euclidean distance metric.
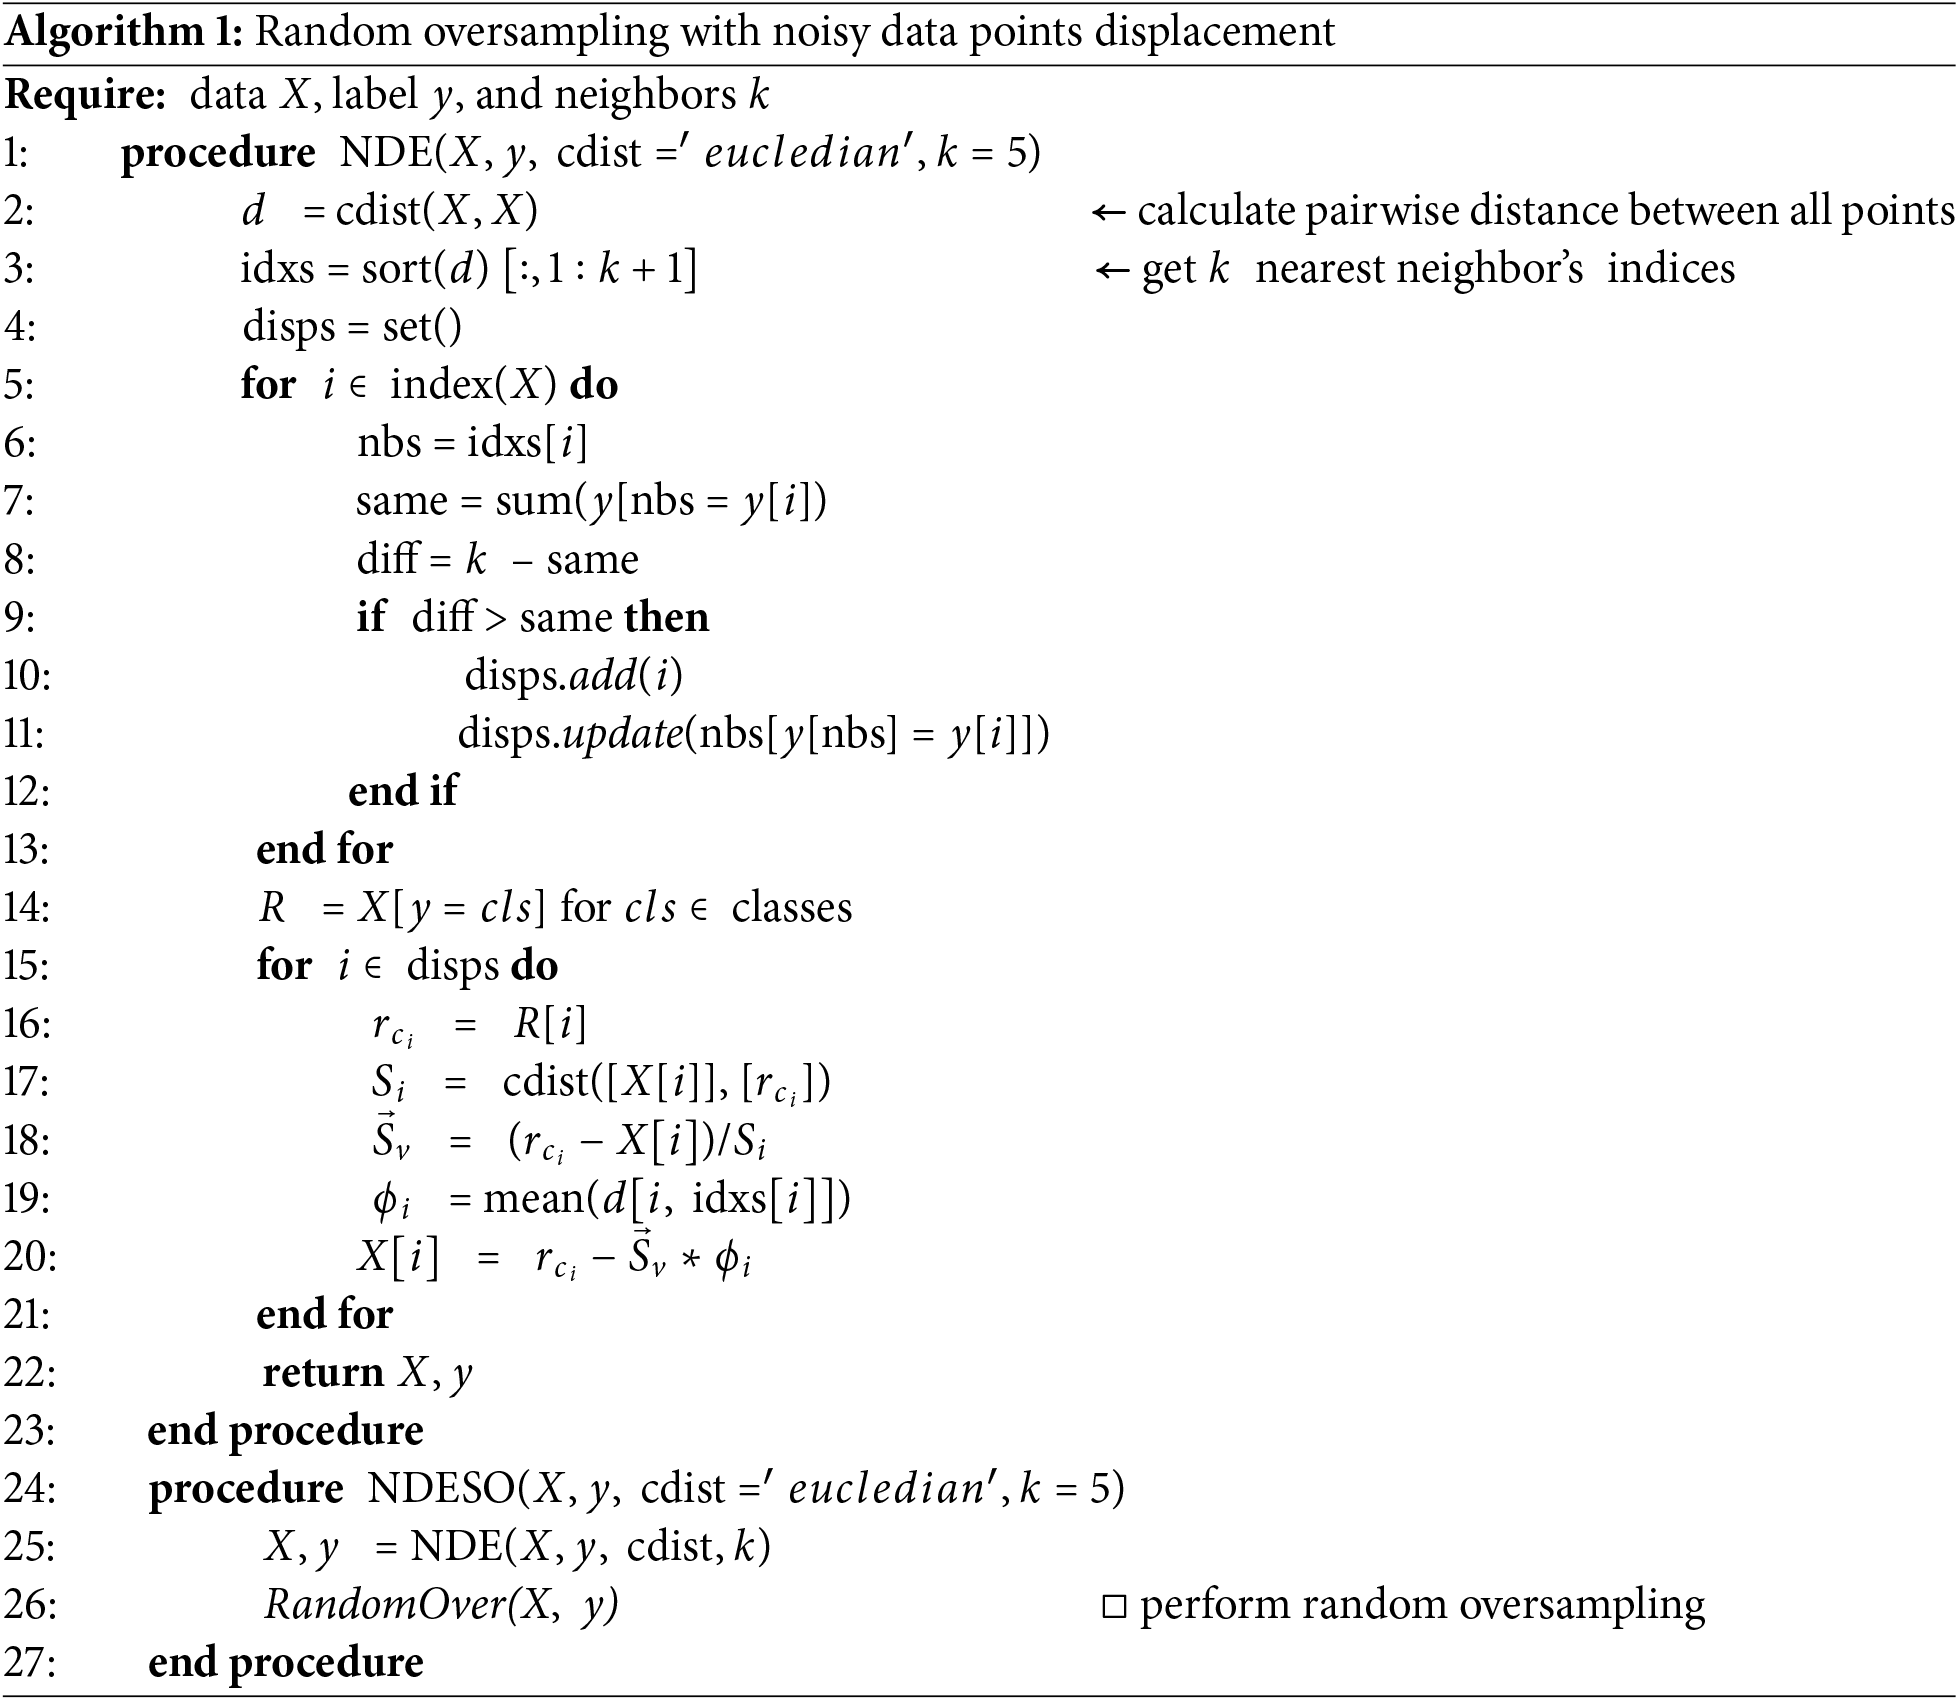
4.2 Neighbor-Based Displacement Enhanced Synthetic Oversampling (NDESO)
To address the class imbalance, random oversampling is applied to the dataset after removing noisy data points. This improved version of the NDE algorithm is called Neighbor-based Displacement Enhanced Synthetic Oversampling (NDESO). This oversampling process utilizes the RandomOverSampler method from the library imblearn1. In this technique, new data points are generated by randomly duplicating samples from the minority class. Suppose
By cleaning the dataset in advance, this approach seeks to significantly improve the quality of the resampled data points, refining the oversampling process while minimizing additional overhead for a more effective class balance. The complete algorithm for the procedures of our proposed approach is given in Algorithm 1.
We calculate precision, recall, F1-score, and G-mean as evaluation metrics during the experiment. However, we have chosen to report G-mean in this paper due to space constraints. For complete proof of the testing output, please refer to the GitHub repository link provided at the end of this manuscript.
Geometric mean (G-mean) is a widely recognized performance metric for imbalanced classification tasks, aiming to achieve a balanced assessment across various classes by focusing on both positive and negative classes. Mathematically, G-mean is defined as follows [28]:
where:
•
•
The G-mean score typically ranges from 0 to 1. A score of 1 indicates a perfect balance between
4.3.2 Friedman and Post-Hoc Nemenyi Tests
In this study, we compared our resampling method with several baseline techniques. To evaluate performance, we used statistical tests, in particular the Friedman and Nemenyi tests, which are recommended and widely used for distinguishing statistically significant differences between approaches, to ensure stable results against randomness in the experimental analysis.
The Friedman and Nemenyi tests are nonparametric statistical methods used to assess the performance differences among multiple resampling methods in classification experiments. These tests do not assume any specific data distribution. The null hypothesis implies that all methods perform similarly across the tested datasets. However, rejecting this hypothesis (with a significance level alpha of 0.05) indicates significant performance differences among the resampling techniques [29].
For each dataset
where
Suppose the Friedman test rejects the null hypothesis. In that case, we proceed with the post hoc Nemenyi test for a pairwise comparison among the resampling method based on a critical difference (CD), which is defined as:
where
We utilize a synthetic dataset to provide a clear visualization of the data before and after resampling, using our algorithm and comparing it with others. This dataset consists of three distinct classes (class 0, class 1, class 2), generated based on a normal distribution with a ratio of 50:500:100. To introduce some overlap between the classes, random noise was added to the data points, with the noise generated from a normal distribution and scaled by a factor of 0.75.
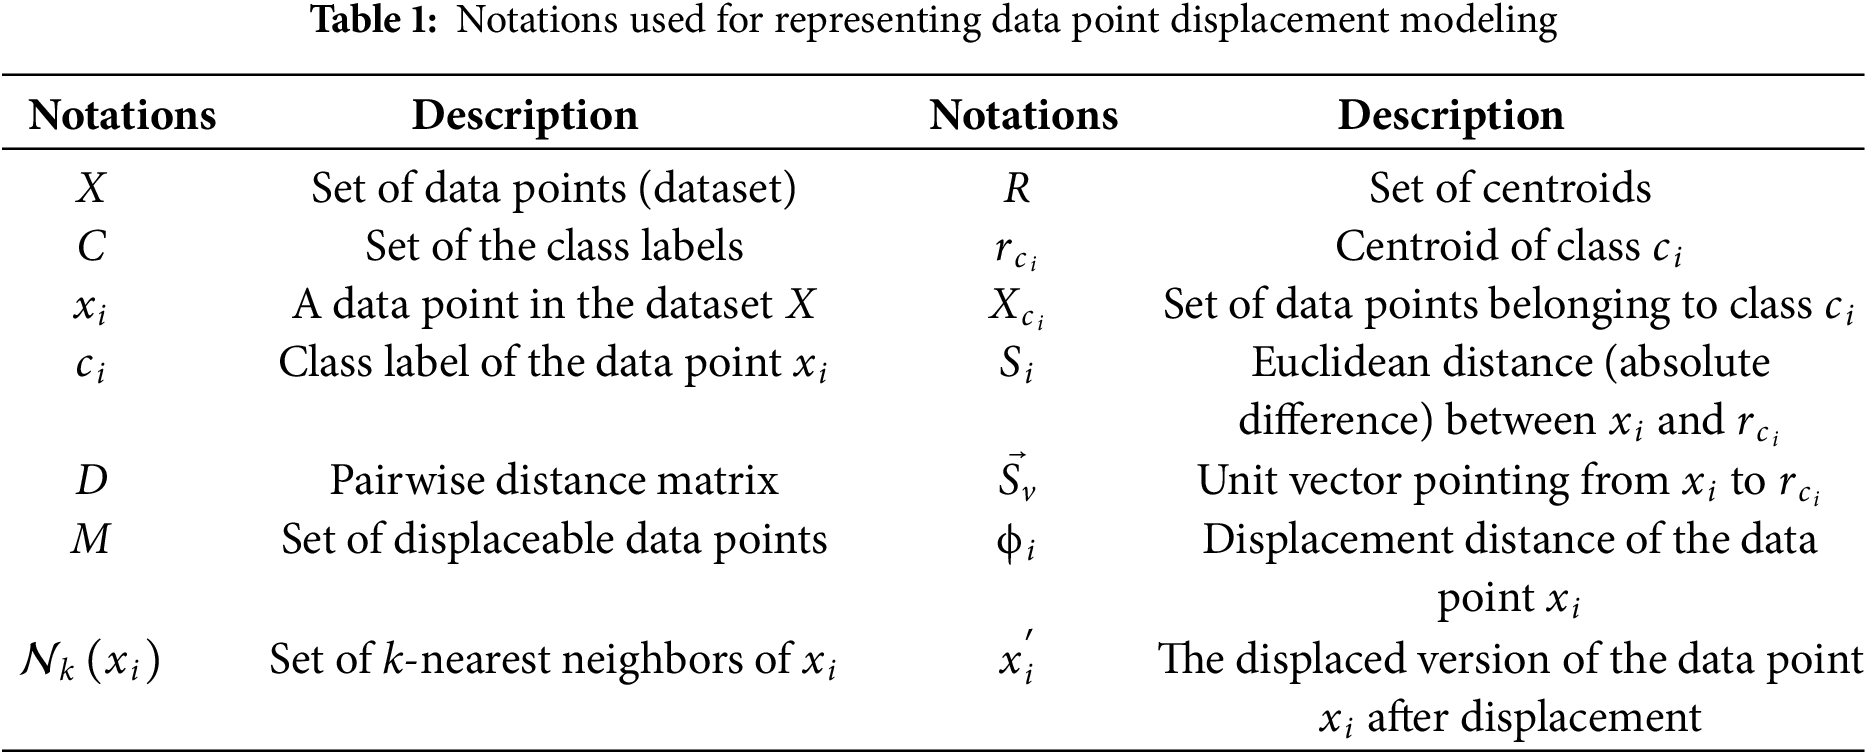
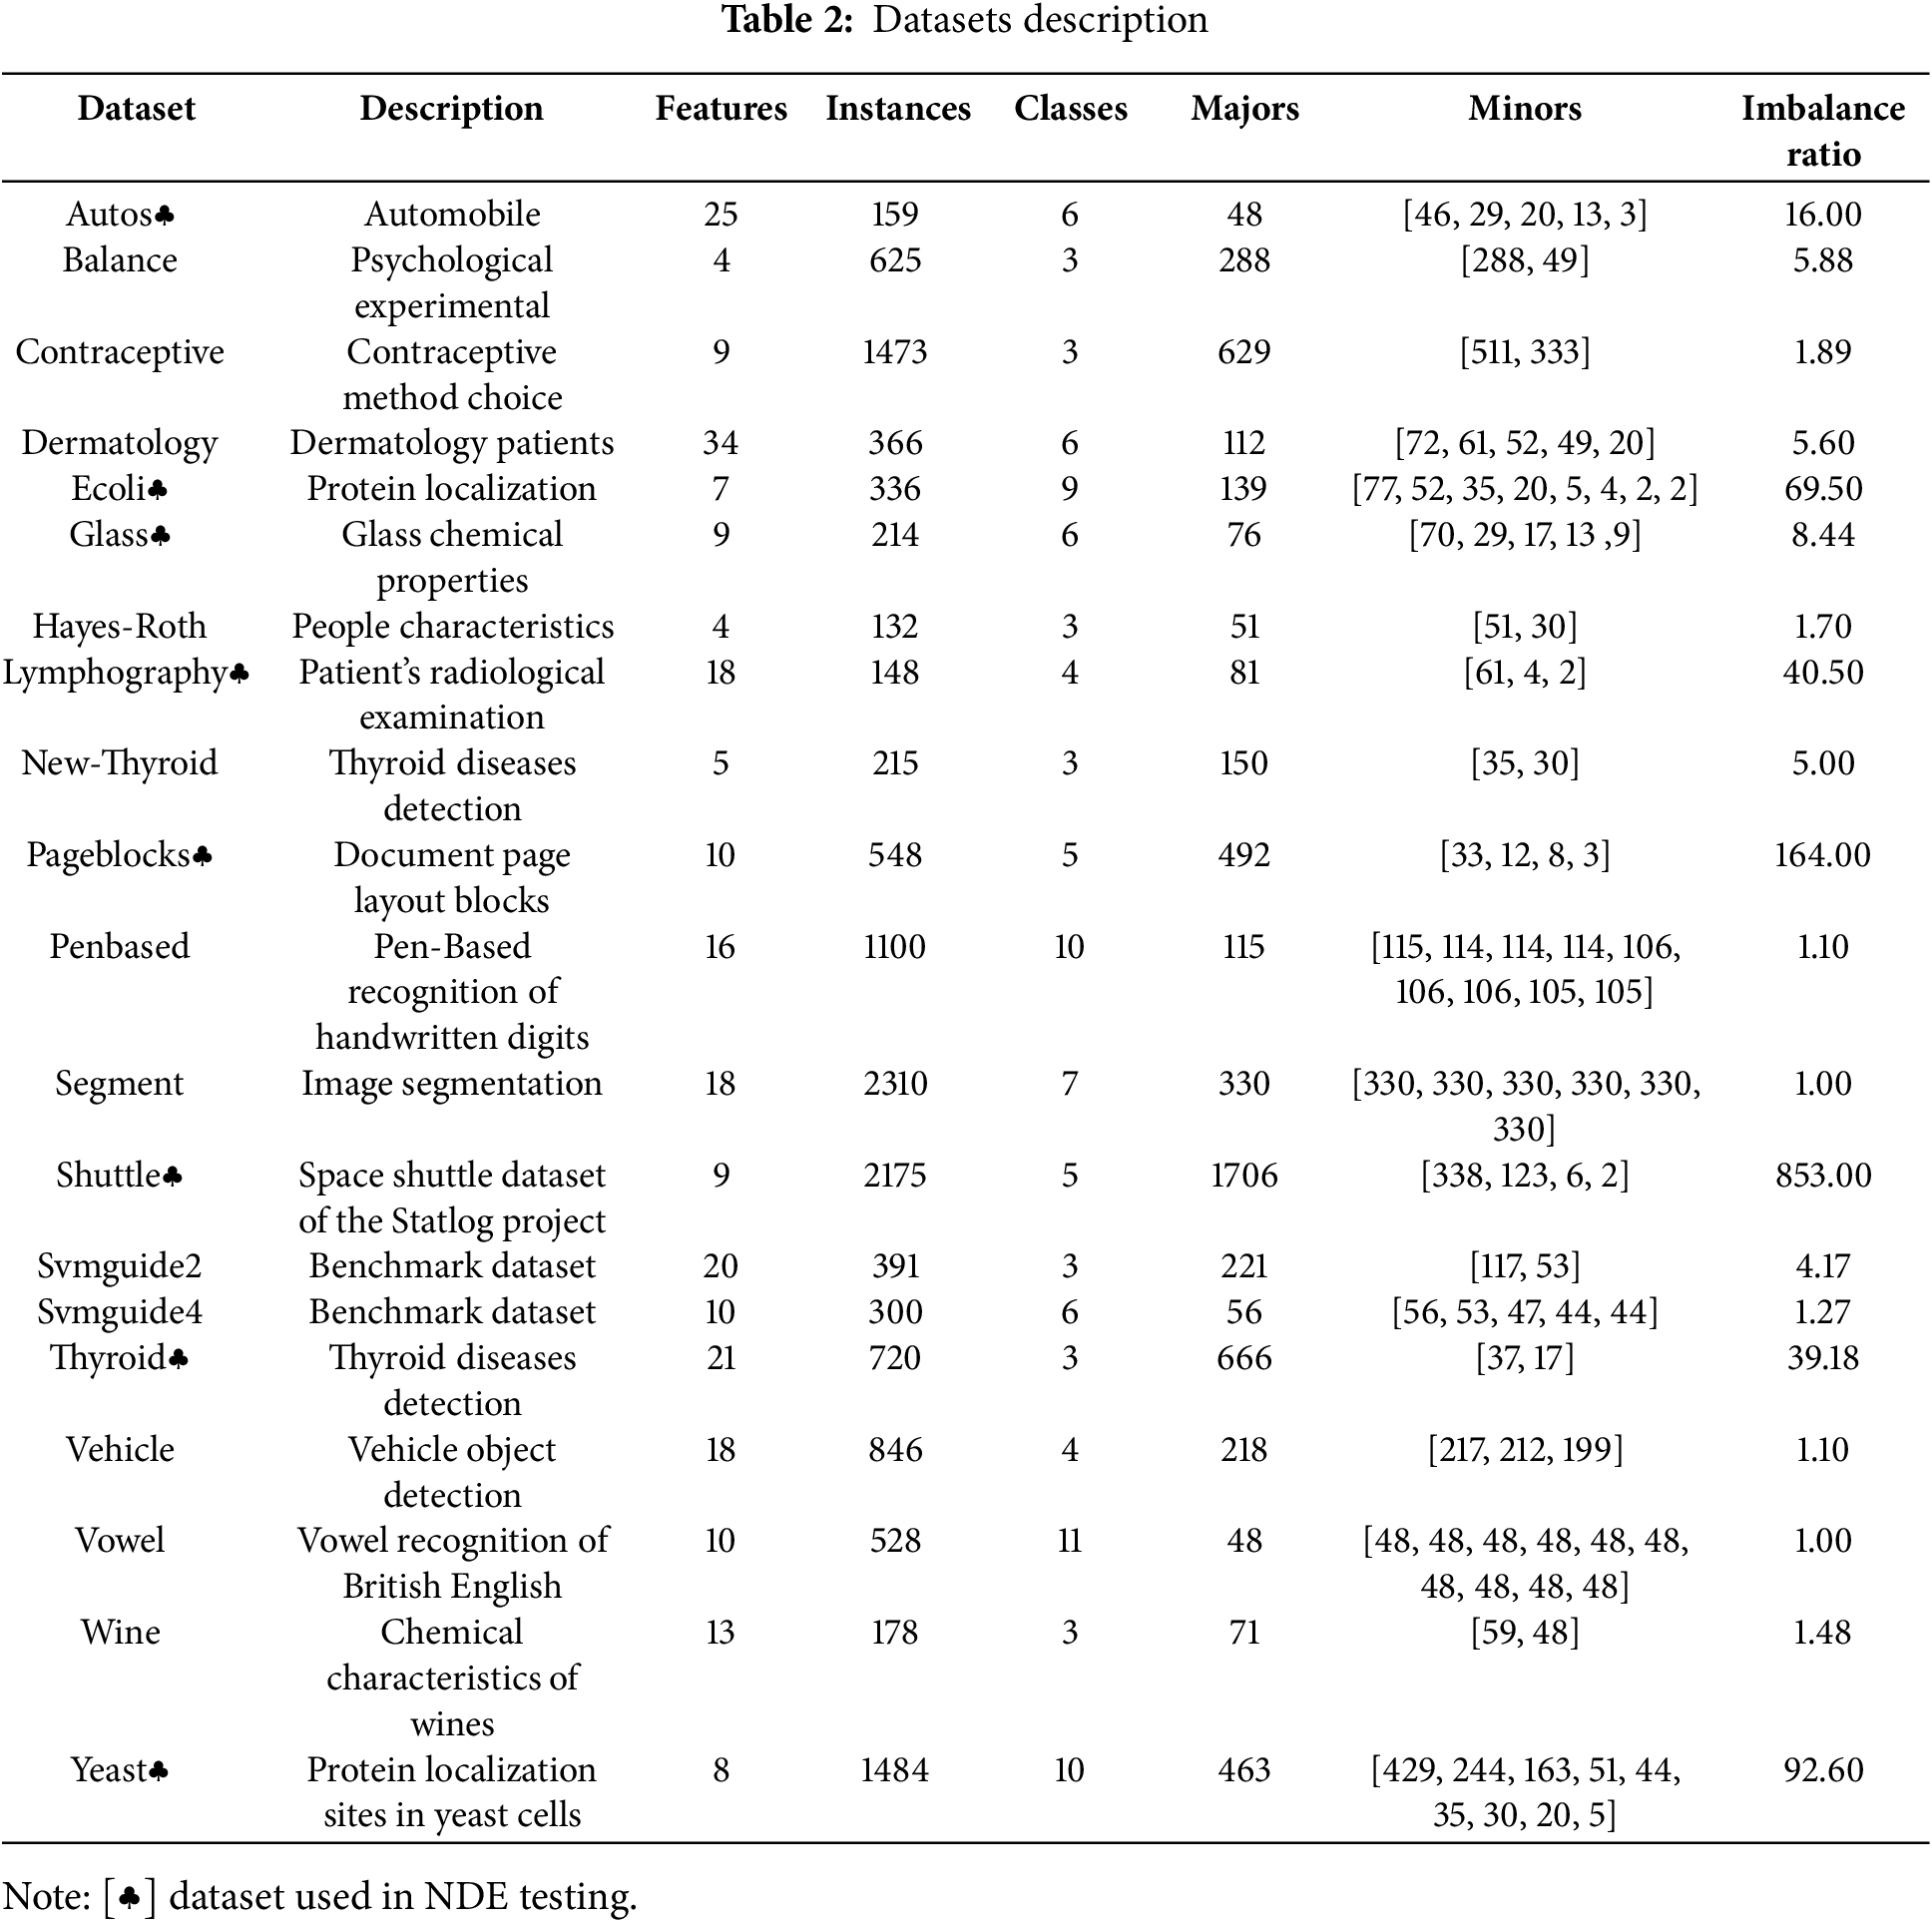
The real-world datasets are sourced primarily from Knowledge Extraction2 and OpenML3. Details of the real-world multiclass dataset used in the experiments are presented in Table 2, with the number of classes ranging from 3–11 and the imbalance ratio ranging from 1.0 to 853.0.
5.1.3 System Environment and Libraries
Throughout the experiment, Python running on a Virtual OS with Linux Server was primarily used, hosted on hardware featuring 32 GB of RAM, an Intel i9 processor with 16 cores, and a 25 GB SSD hard drive. We evaluated our proposed method against several baseline resampling techniques across various classifiers. The samplers and classifiers were implemented using the sci-kit-learn library4, with some utilizing the imbalanced-learn library5. Those resamplers are detailed in Section 2, while classifiers include Support Vector Machine (SVC), k-Nearest Neighbors (k-NN), Decision Tree, Random Forest, Multi-layer Perceptron (MLP), Easy Ensemble Classifier, RUS Boost Classifier, Balanced Bagging Classifier, and Balanced Random Forest Classifier, each offering unique learning paradigms and handling imbalanced datasets differently. SVC and k-NN are instance-based methods sensitive to data distribution, making them suitable for assessing changes in class separation. DecisionTree and RandomForest are tree-based models that excel at capturing non-linear relationships, with RandomForest offering sophisticated ensemble learning capabilities. MLP, a neural network model, tests the performance of algorithms requiring balanced data for gradient-based optimization. EasyEnsemble, RUSBoost classifiers, BalancedBagging, and BalancedRandomForest, as ensemble techniques designed for imbalanced data, help evaluate the ability of our resampling technique to mitigate class imbalance across varying classifier characteristics.
The dataset is initially processed using a resampling method to balance class distributions, which is crucial due to its sparsity and overlap. This step is performed before training the classifiers to address class imbalance, with the goal of improving model performance. After resampling, the dataset is then partitioned into 80% training and 20% testing subsets using Stratified k-fold cross-validation. The number of cross-validation folds,
The
We conducted a series of tests to assess the effectiveness of the proposed methods. These tests were divided into two main groups as follows.
The first group focused on evaluating the performance of our base algorithm (NDE) using either a single synthetic dataset or eight real-world datasets (indicated by
1. Varying k-neighbors
In this experiment, we evaluated our algorithm on the top 8 datasets with the highest imbalance ratios among the 20 datasets. We utilized three classifiers—DecisionTree, k-NN, and Balanced Bagging—while varying the k parameter from 2 to 25. The results presented in Fig. 6 demonstrate that our algorithm consistently achieves excellent performance in most cases. Notably, it maintains a G-mean value exceeding 0.90 for k ≥ 5. These findings underscore the robustness and effectiveness of our approach across varying k values, highlighting its suitability for diverse scenarios.
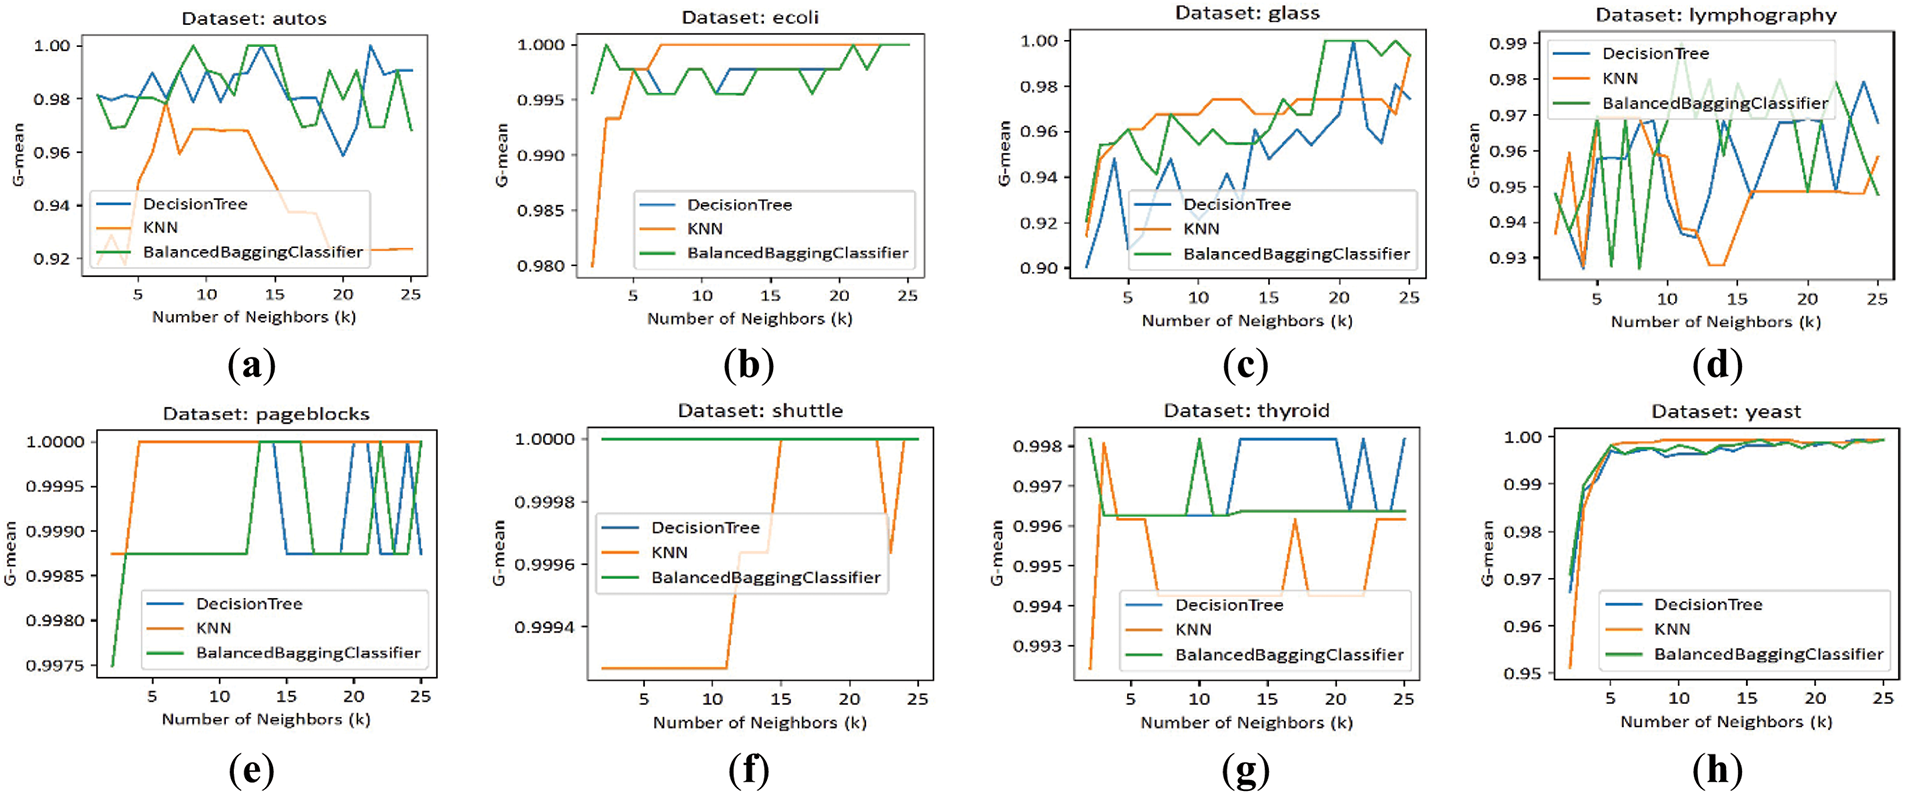
Figure 6: G-mean scores of our NDE algorithm evaluated across three classifiers for various k-nearest neighbors (2–25) and datasets: (a) Autos; (b) Ecoli; (c) Glass; (d) Lymphography; (e) Pageblocks; (f) Shuttle; (g) Thyroid; (h) Yeast
2. Varying distance metric selection
To assess the robustness of our algorithm, we evaluated its performance across commonly used distance metrics, including Euclidean, Cityblock, Minkowski, Cosine, and Hamming. While numerous other metrics could be tested, these were selected due to their prevalence in data processing tasks. For this test, the same 8 datasets and 3 classifiers were utilized with the default parameters of our algorithm. As shown in Fig. 7, the findings indicate that our algorithm consistently achieves high G-mean values across various datasets and distance metrics. While a slight performance fluctuation is observed with the Hamming distance on the Autos dataset, the overall stability across metrics underscores the robustness and versatility of our approach in adapting to different metric selections.
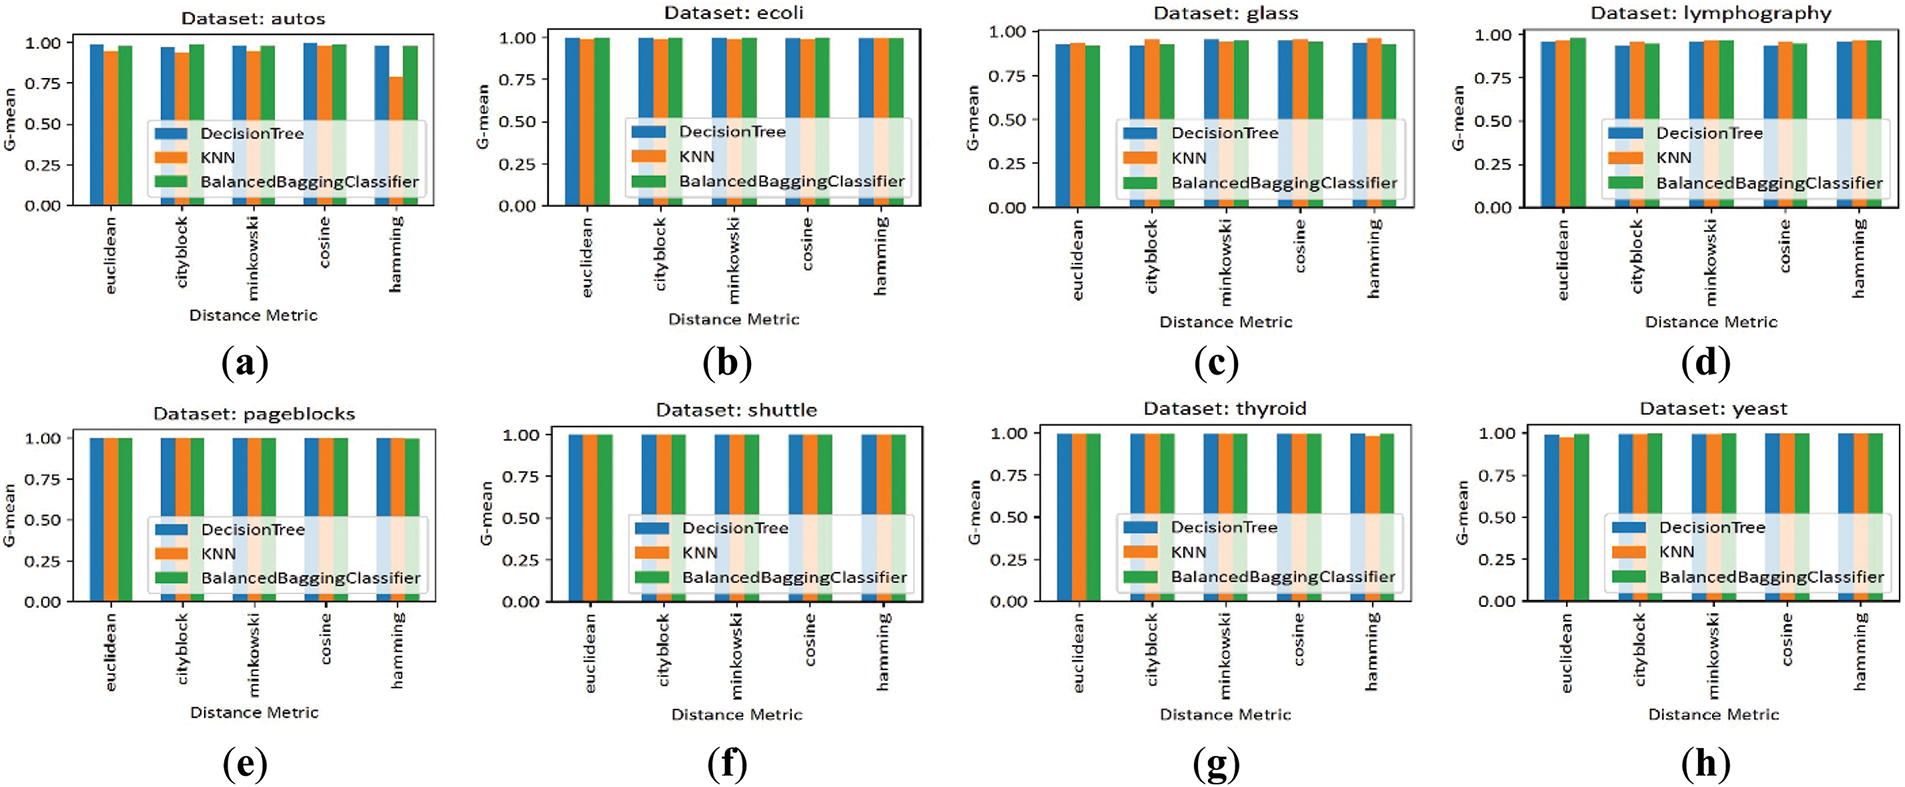
Figure 7: G-mean scores of our NDE algorithm evaluated across three classifiers for various distance metrics and datasets: (a) Autos; (b) Ecoli; (c) Glass; (d) Lymphography; (e) Pageblocks; (f) Shuttle; (g) Thyroid; (h) Yeast
3. Resampled data distribution
In this test, we compared the original dataset distribution with the results after applying our algorithm and baseline samplers, including ROS, RUS, SMOTE, ENN, NearMiss, TomekLinks, and ECDNN. Advanced variants such as SVM-SMOTE and SMOTE-Tomek were excluded to focus on the foundational methods. For this test, the synthetic dataset was used with the default parameters of our algorithm. As shown in Fig. 8, our algorithm best separates data points into isolated clusters, showing its strong performance. While ENN and ECDNN also produce relatively good distributions, they leave more overlapping points than our method. The other samplers result in significant overlap, producing more noises that can negatively affect classification performance. These results confirm our method’s superiority in producing well-separated and cleaner resampled datasets.
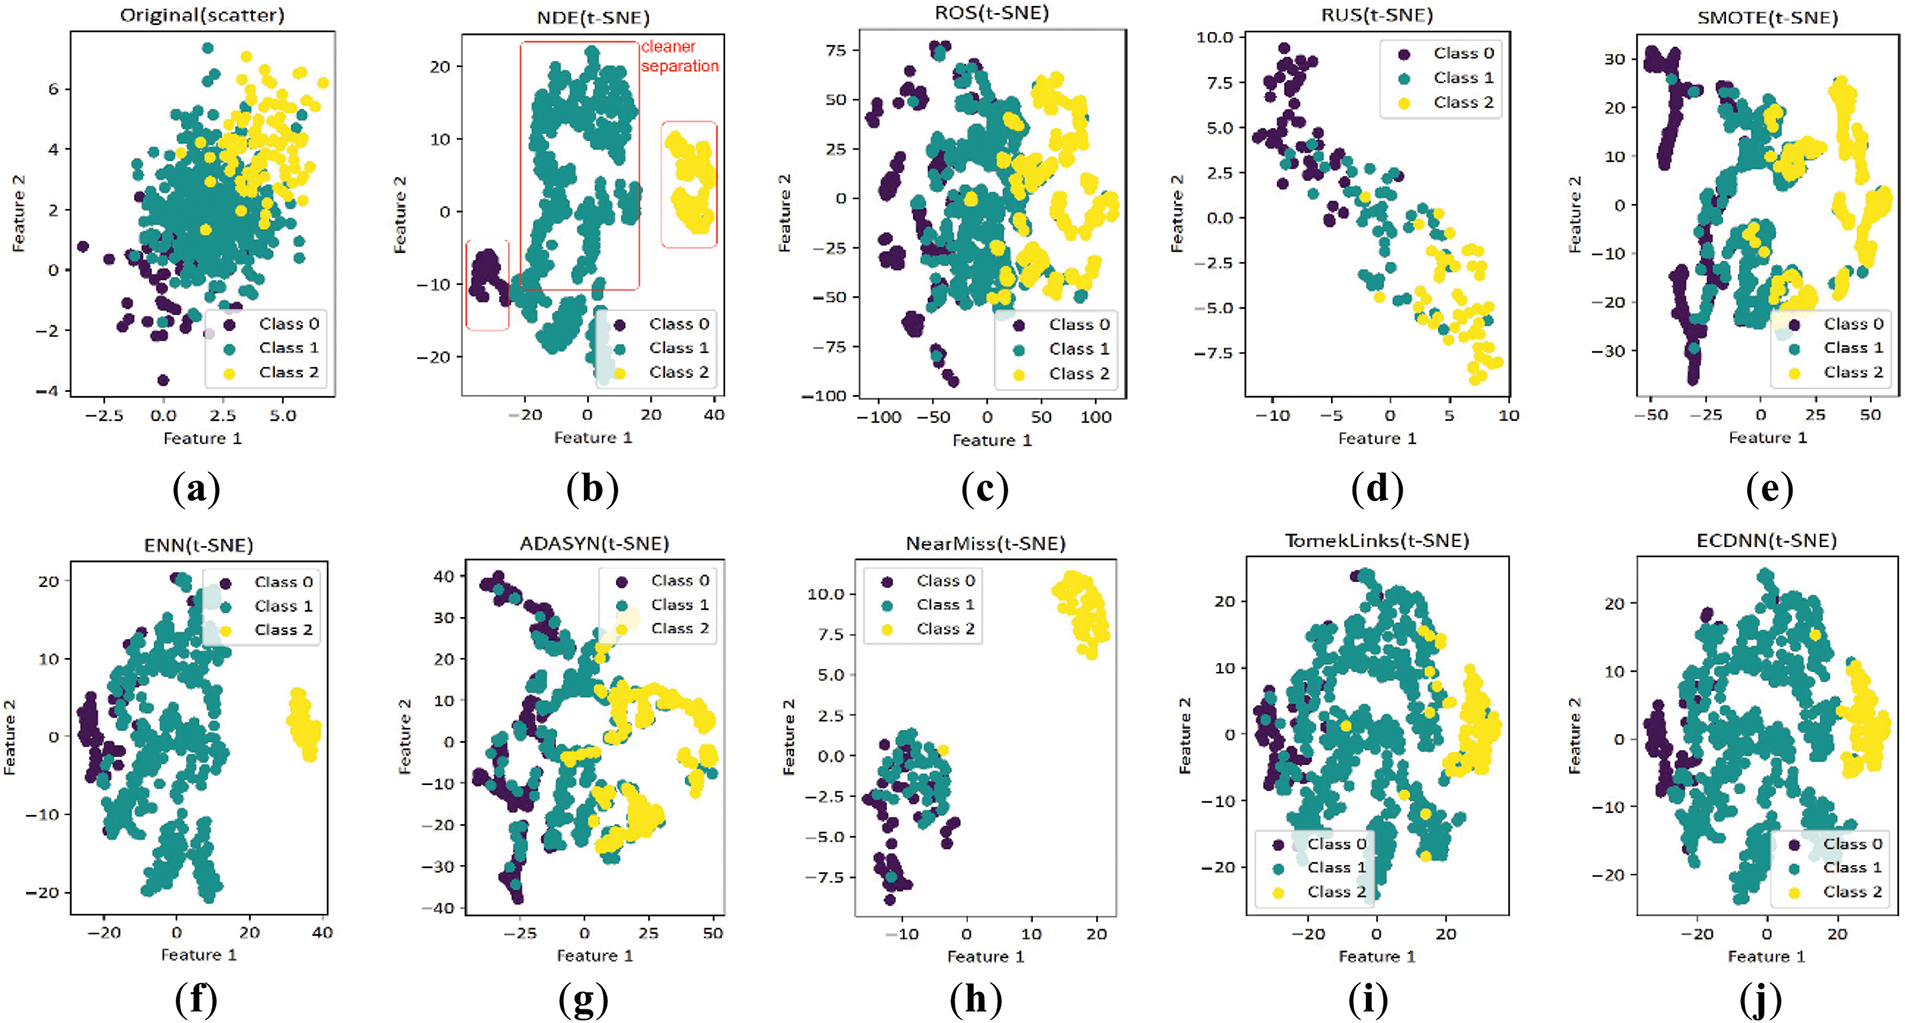
Figure 8: Scatter plots comparing our NDE algorithm with other methods, highlighting its clear class separation with minimal overlap, unlike others that exhibit significant overlap. The distributions are presented for (a) The original dataset and those resampled using: (b) NDE; (c) ROS; (d) RUS; (e) SMOTE; (f) ENN; (g) ADASYN; (h) NearMiss; (i) TomekLinks; (j) ECDNN
4. Algorithm in combination with another sampler
To determine the optimal combination of our algorithm with other samplers, we evaluated the performance of pairing our method with ROS, RUS, SMOTE, ENN, NearMiss, and TomekLinks, excluding ECDNN due to its similar displacement-based approach to ours. The goal was to identify the best sampler for oversampling the data after displacement or removing noisy points. As depicted in Fig. 9, our NDE algorithm pairs effectively with all methods except RUS and NearMiss. As further illustrated in Fig. 8, these two methods tend to discard a significant number of data points, which does not align with our objective of applying oversampling after displacing the noisy data points. In this study, we propose combining NDE with ROS, as it is the most straightforward approach and delivers excellent results, which we report in the second group of tests.
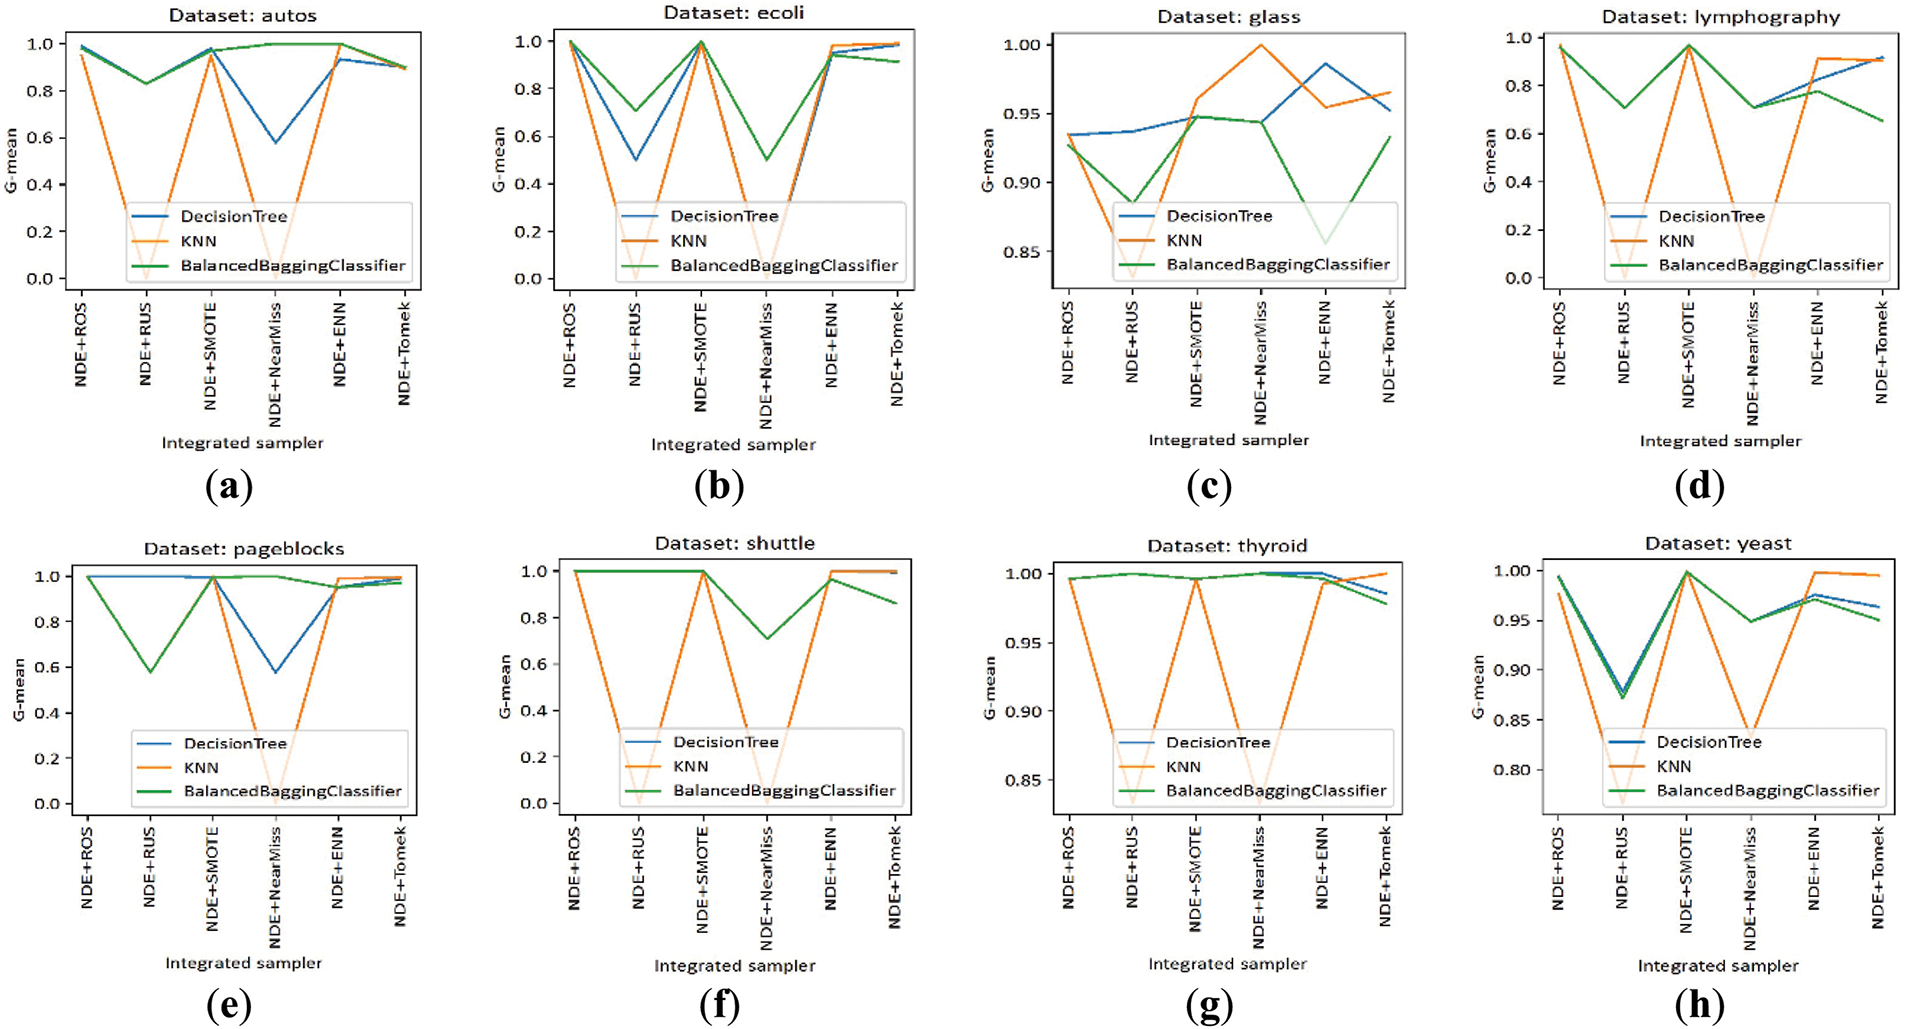
Figure 9: G-mean scores of our NDE algorithm evaluated across three classifiers for various samplers and datasets: (a) Autos; (b) Ecoli; (c) Glass; (d) Lymphography; (e) Pageblocks; (f) Shuttle; (g) Thyroid; (h) Yeast
The second group assesses the performance of our NDESO (NDE + ROS) resampling algorithm by comparing it to 14 baseline resampling methods across 20 real-world datasets and nine classifiers, with a focus on G-mean performance and statistical significance. The baseline methods include advanced versions of SMOTE, ADASYN, and SMOTE-CDNN, a hybrid approach combining CDNN with SMOTE oversampling.
Initially, we compared our method with all other resampling techniques, using their default parameters for a fair evaluation. However, while our method is flawless for any k-neighbor selection, some existing algorithms fail due to the sparse distribution of minority class data points in many datasets. These failures were primarily caused by the inability of the algorithms to handle situations where the number of neighbors is lower than the required minimum. A summary of such results is shown in Table 3. As observed, KMeans-SMOTE is the most unstable when using default parameters, failing to execute on nine datasets. It is followed by NearMiss, ADASYN, Borderline-SMOTE, SMOTE, SMOTE-ENN, SMOTE-Tomek, SMOTE-CDNN, and SVM-SMOTE, all of which expect the minority class to have at least five neighbors. SMOTE-ENN, ENN, and ECDNN failed on several datasets where a class had only a single member. Similarly, RandomUnder and ENN also encountered failures during internal cross-validation when applied to small subsets of datasets. The only datasets where these methods were successfully executed with default parameters are Dermatology, Hayes-Roth, New-Thyroid, Segment, Svmguide2, and Wine.
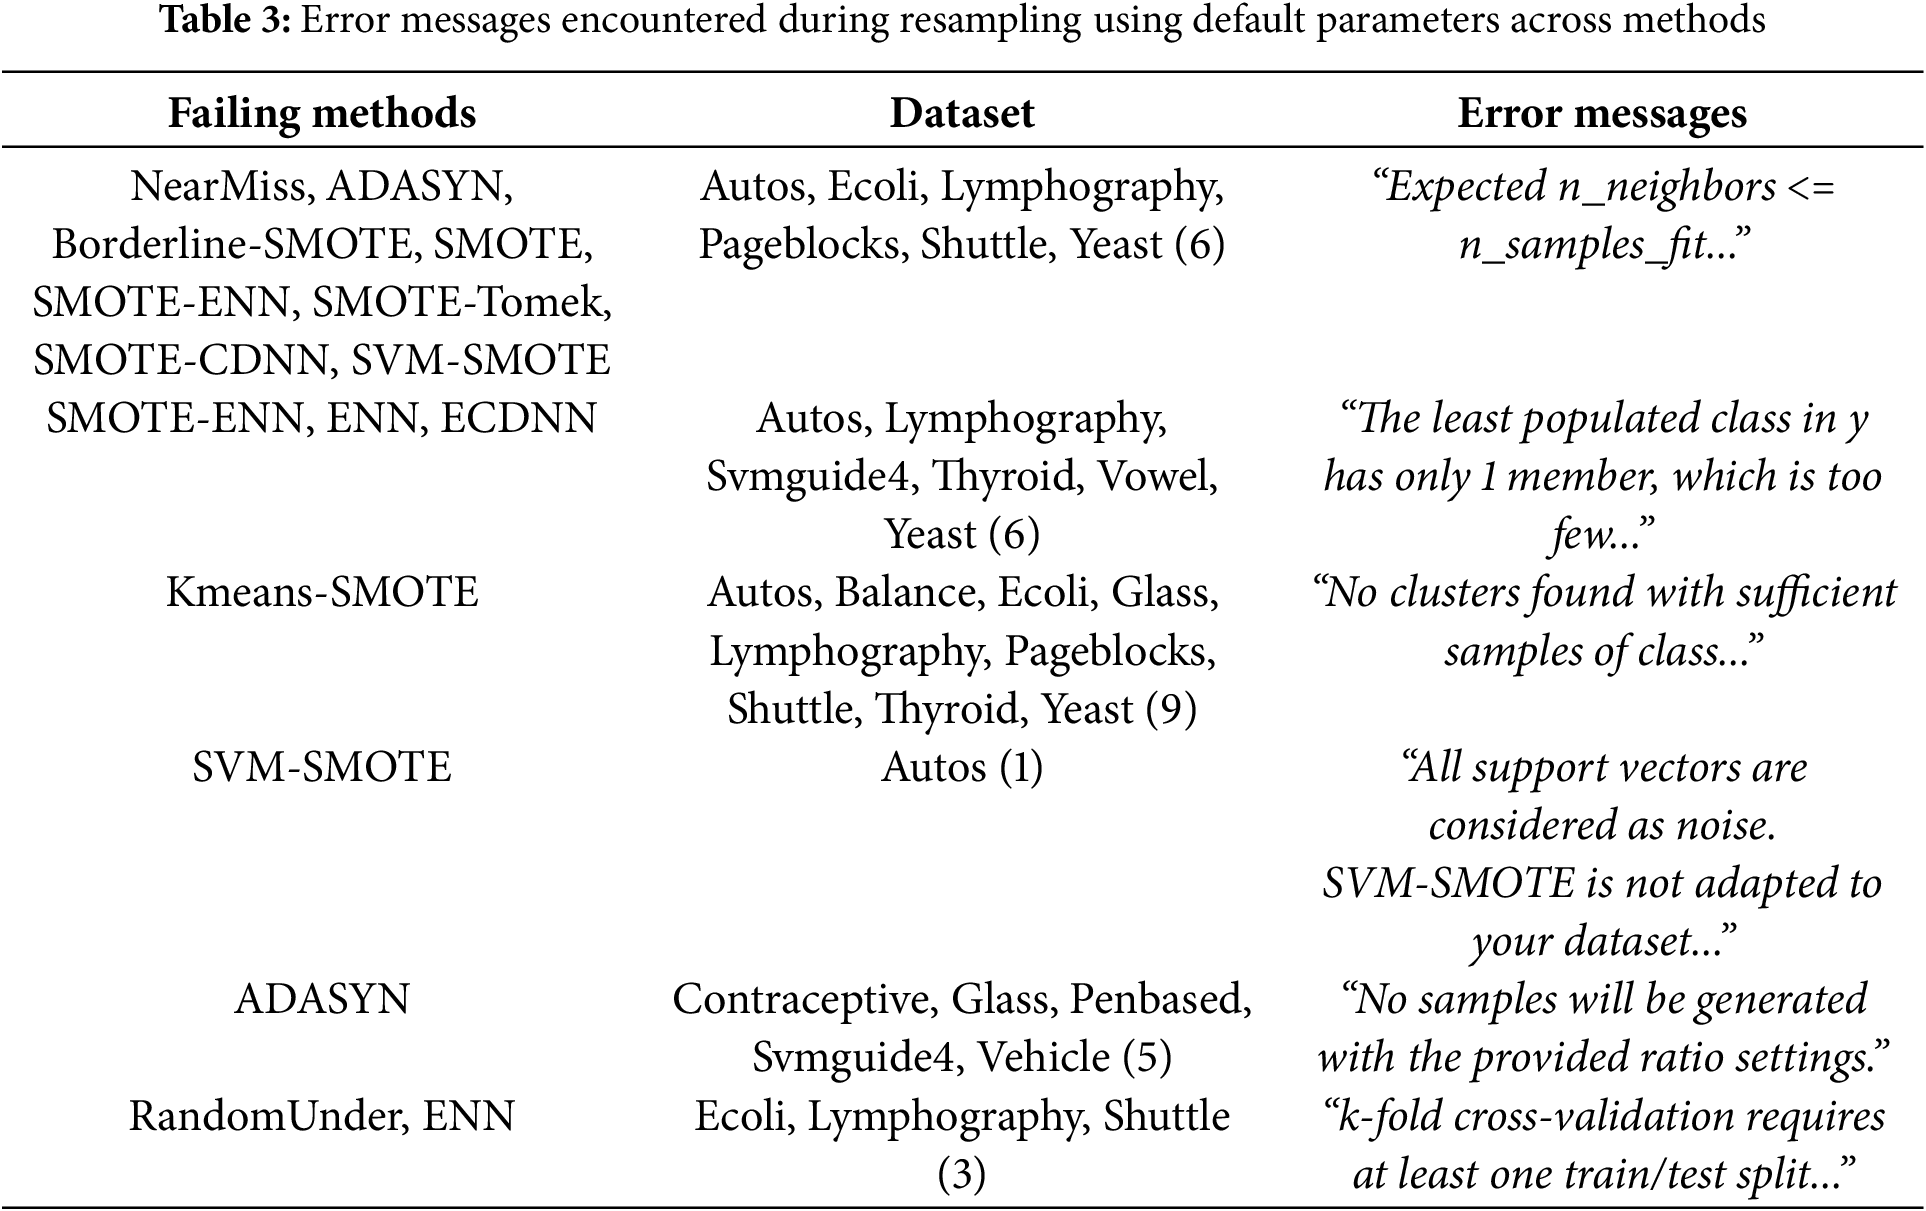
To continue testing, we adjusted the k-neighbors parameter for methods like ADASYN, Borderline-SMOTE, SMOTE, SMOTE-ENN, SMOTE-Tomek, ENN, ECDNN, SVM-SMOTE, and Kmeans-SMOTE. If resampling failed on the initial attempt, the number of neighbors was progressively reduced until the sampler succeeded or reached the lowest possible value of k. However, some samplers, such as ADASYN, SVM-SMOTE, and Kmeans-SMOTE, were still unable to process some datasets even after reducing k to its lowest value.
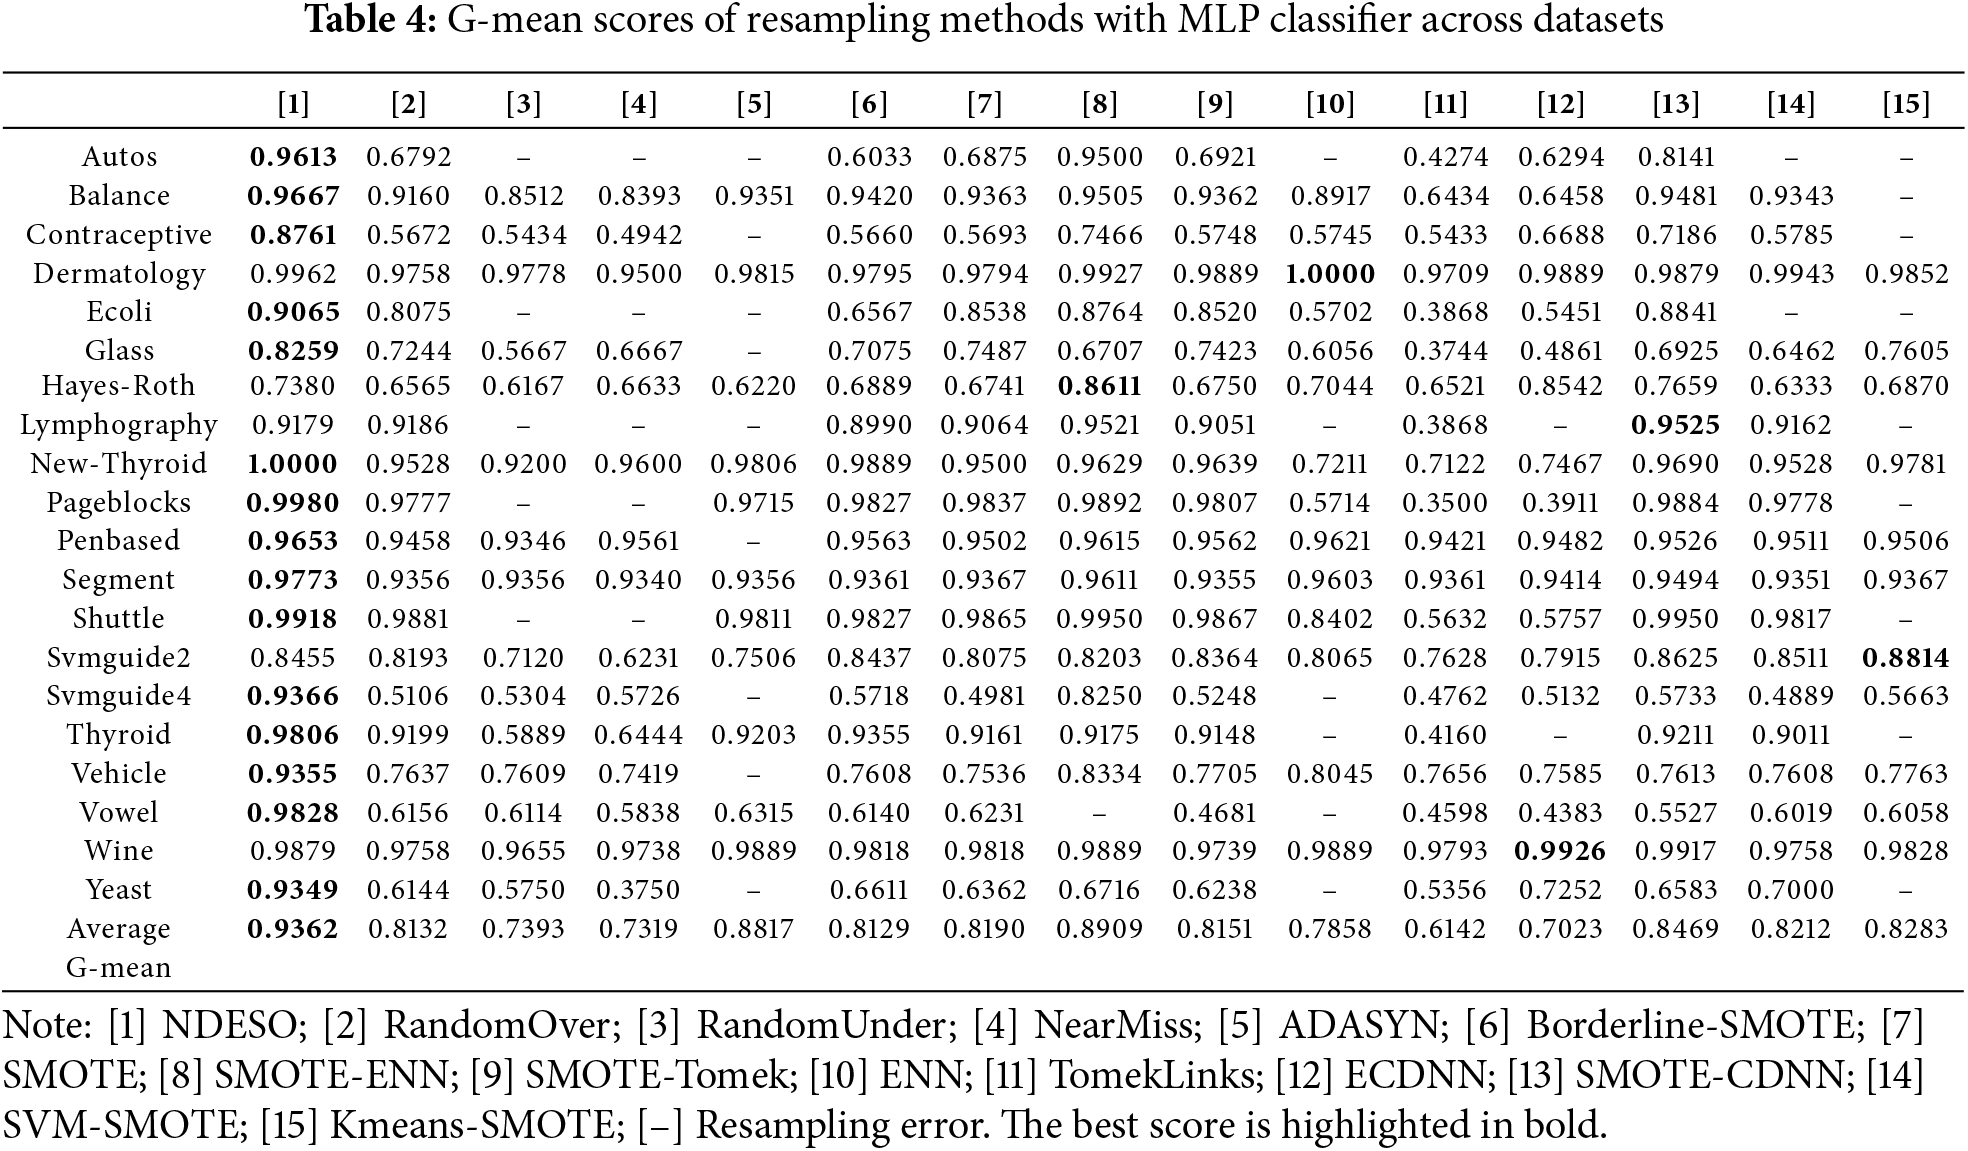
The final evaluation results, summarized in Table 4, highlight the performance of our approach. While the resampling was tested across various classifiers, yielding consistent overall superiority (as further detailed in subsequent analyses), this table explicitly showcases the best performance observed when using the MLP Classifier. As indicated in the table, our NDESO algorithm achieved the highest average G-mean of 0.9362, surpassing other algorithms in most cases. It exhibited only slightly lower performance on 5 out of 20 datasets, namely Dermatology, Hayes-Roth, Lymphography, Svmguide2, and Wine. Furthermore, our proposed method demonstrates significant improvements, mainly when applied to the Autos, Contraceptive, Svmguide4, Vowel, and Yeast datasets. On these datasets, other methods yield average results between 0.40 and 0.70, whereas our approach consistently achieves averages of 0.90 or higher. This indicates that our algorithm is more effective in reducing data overlap and performs better resampling to generate a more balanced and representative dataset for each class.
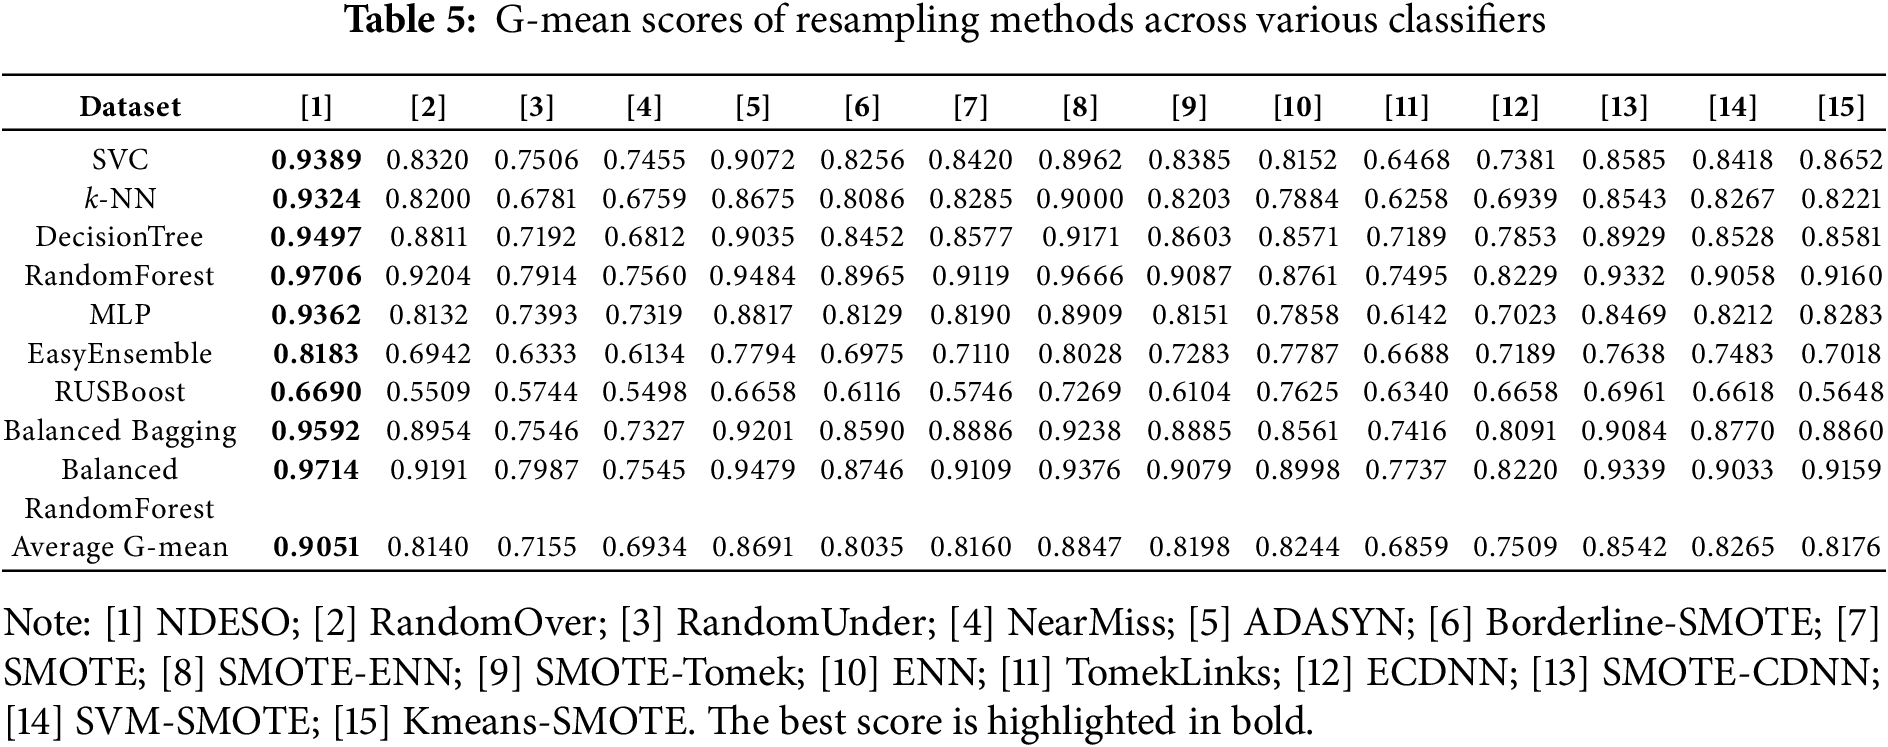
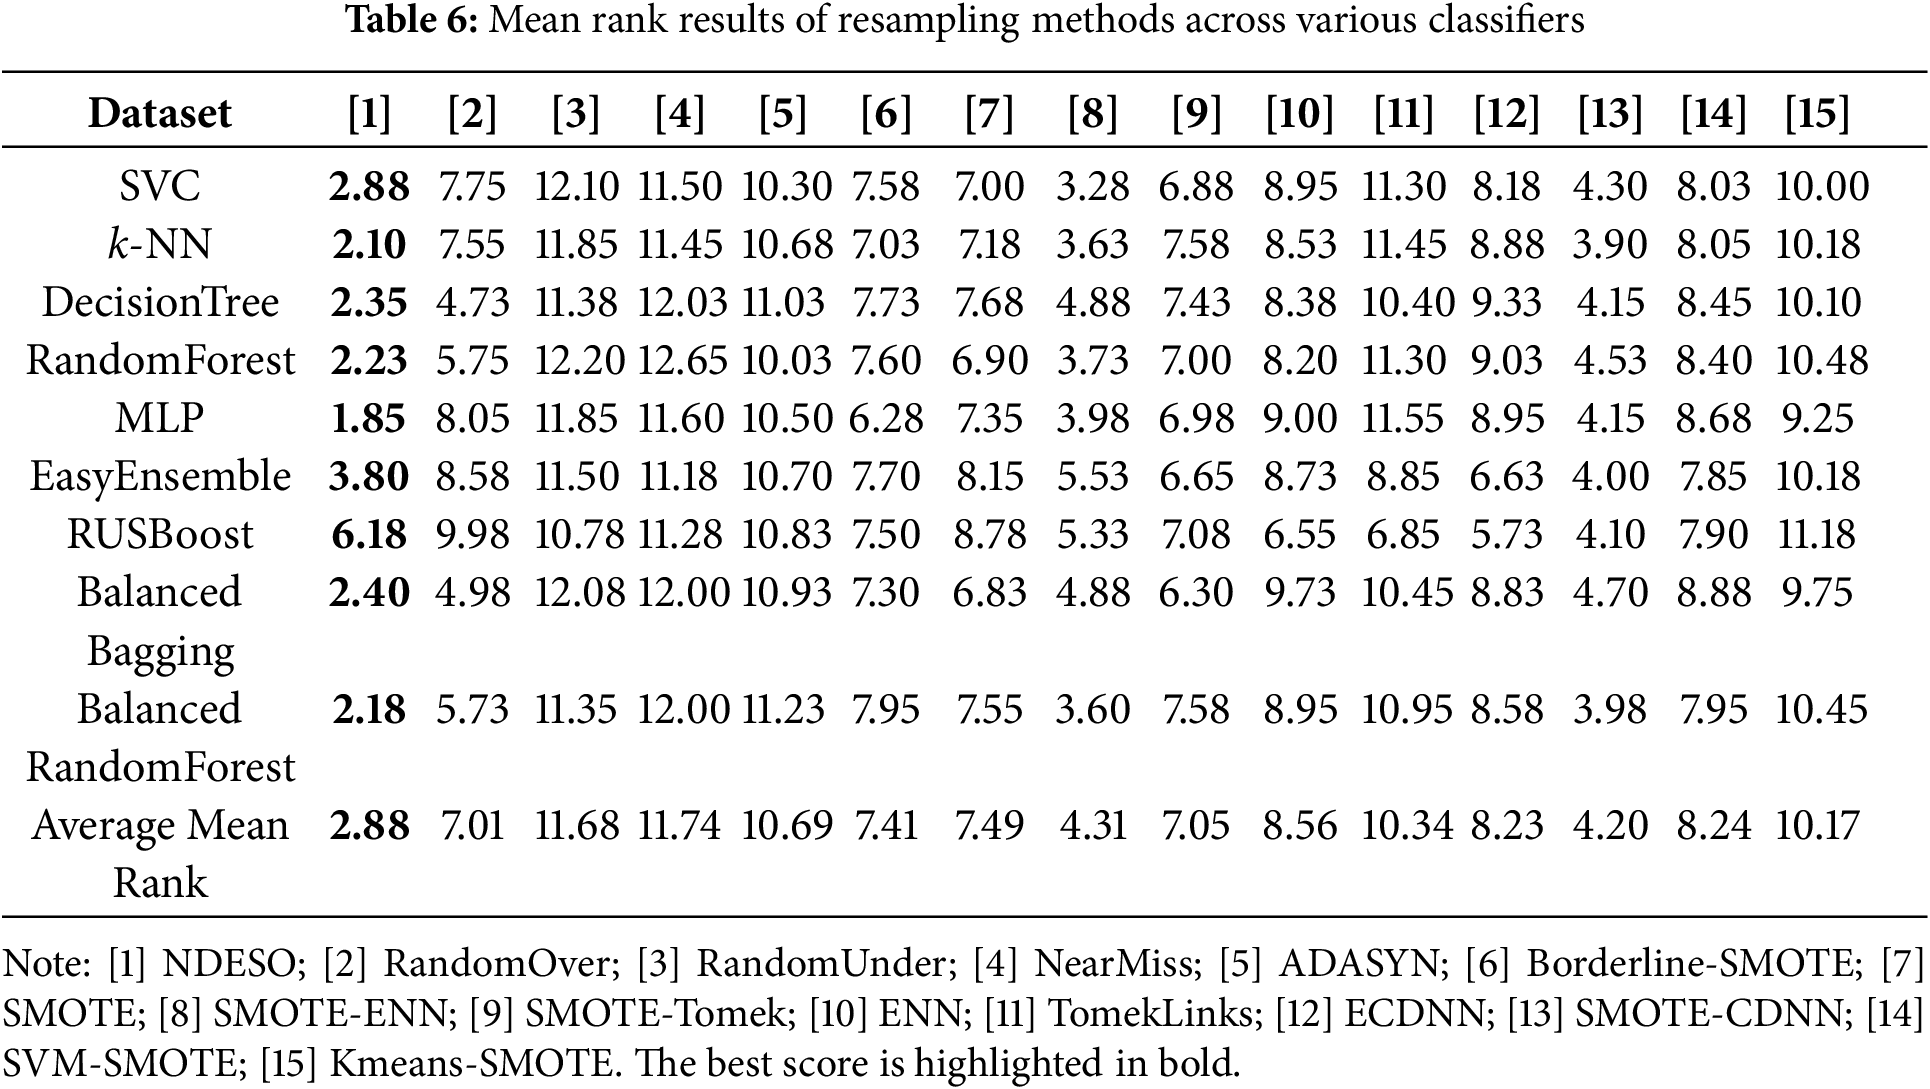
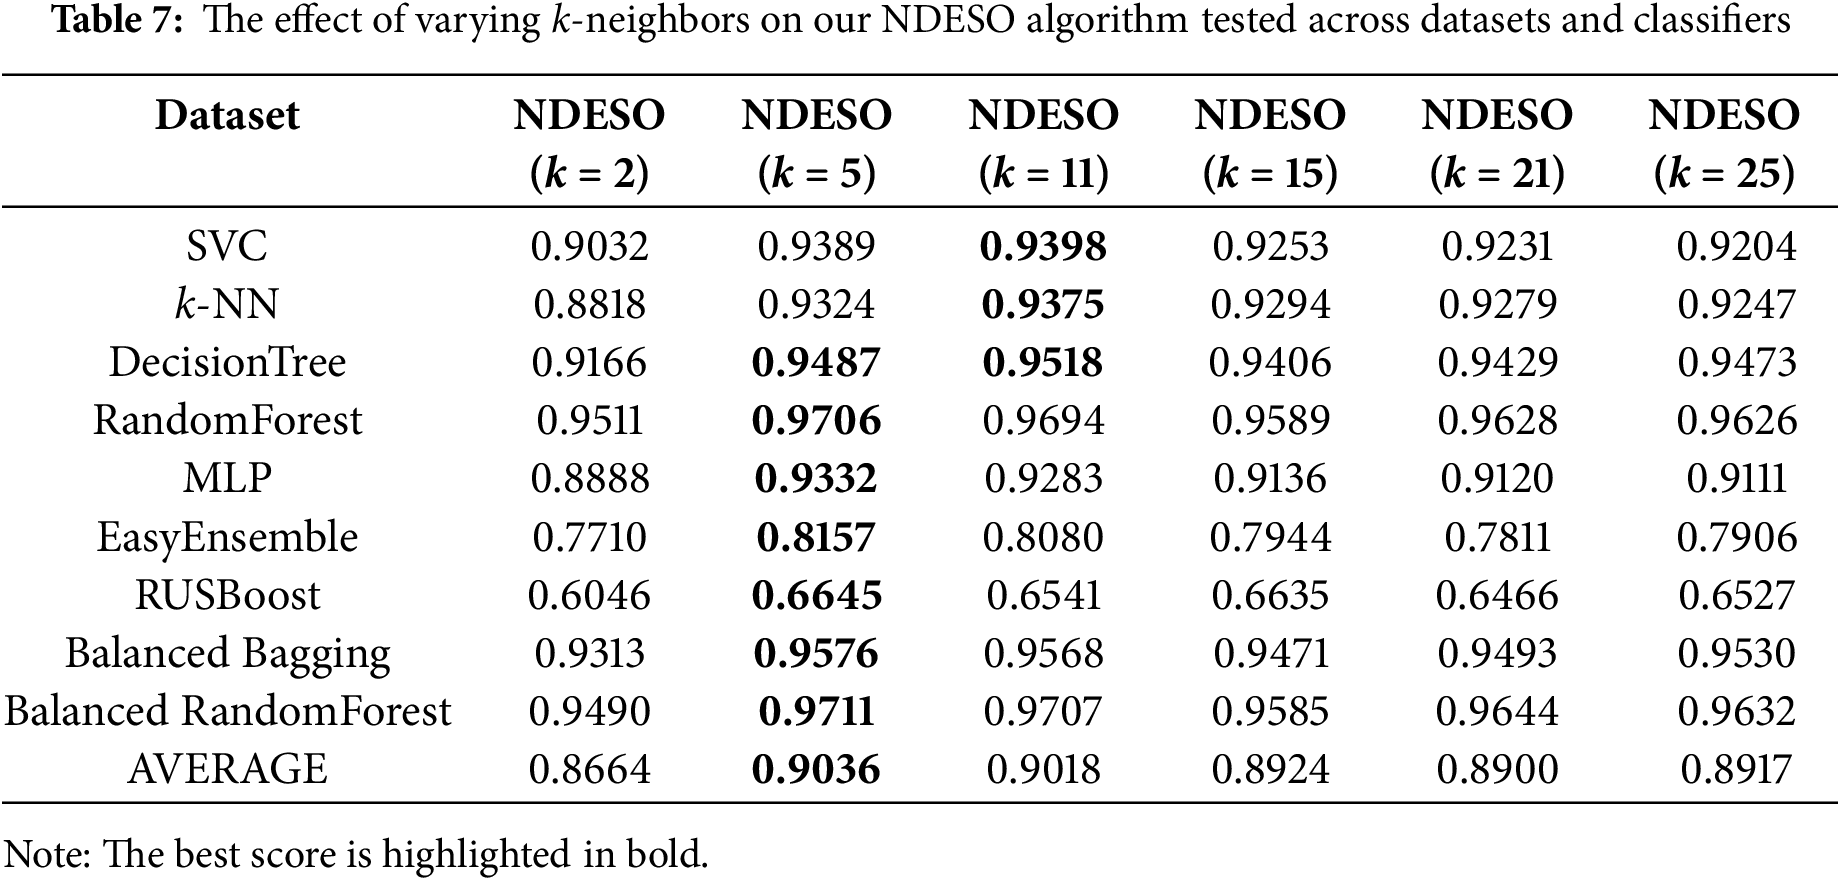
The performance trend is consistently achieved by our algorithm, as shown in the testing across all datasets and classifiers, summarized in Tables 5 and 6. Our algorithm scored the highest average G-mean of 0.9051 across all classifiers. With an average rating of 2.88, the lowest among all methods, further confirming that it outperforms other algorithms. We also conducted tests to demonstrate the robustness of our algorithm across different selections of k-neighbors = [2, 5, 11, 15, 21, 25], as shown in Table 7. The results indicate that our algorithm consistently performs well across different values of k, with k = 5 showing the best performance with an average G-mean of 0.9036, corresponding to our algorithm’s default parameter. This suggests that the approach remains effective even with varying k values across datasets and classifiers.
The radar plot presented in Fig. 10 demonstrates the consistently superior performance of our NDESO algorithm compared to other resampling methods across various datasets and classifiers. As illustrated in the plot, the line representing our algorithm is consistently positioned at the outermost edge in most classifications, indicating that it outperforms all other methods in terms of G-mean across the tested scenarios. This visually reinforces the effectiveness and robustness of NDESO, providing a clear indication of its superior classification results. However, using the RUS Boost classifier appears to be less effective for sparse imbalanced data, especially for imbalanced ratios with majority classes of more than 54%–56% [30]. This leads to poor performance across nearly all resamplers across datasets, as evidenced in both radar plots. On this classifier, our algorithm was unable to achieve the best performance, primarily because the classifier relies on random undersampling techniques that may discard important minority class data points. This approach contradicts the objective of our algorithm, which aims to generate additional data points after displacing noisy ones.
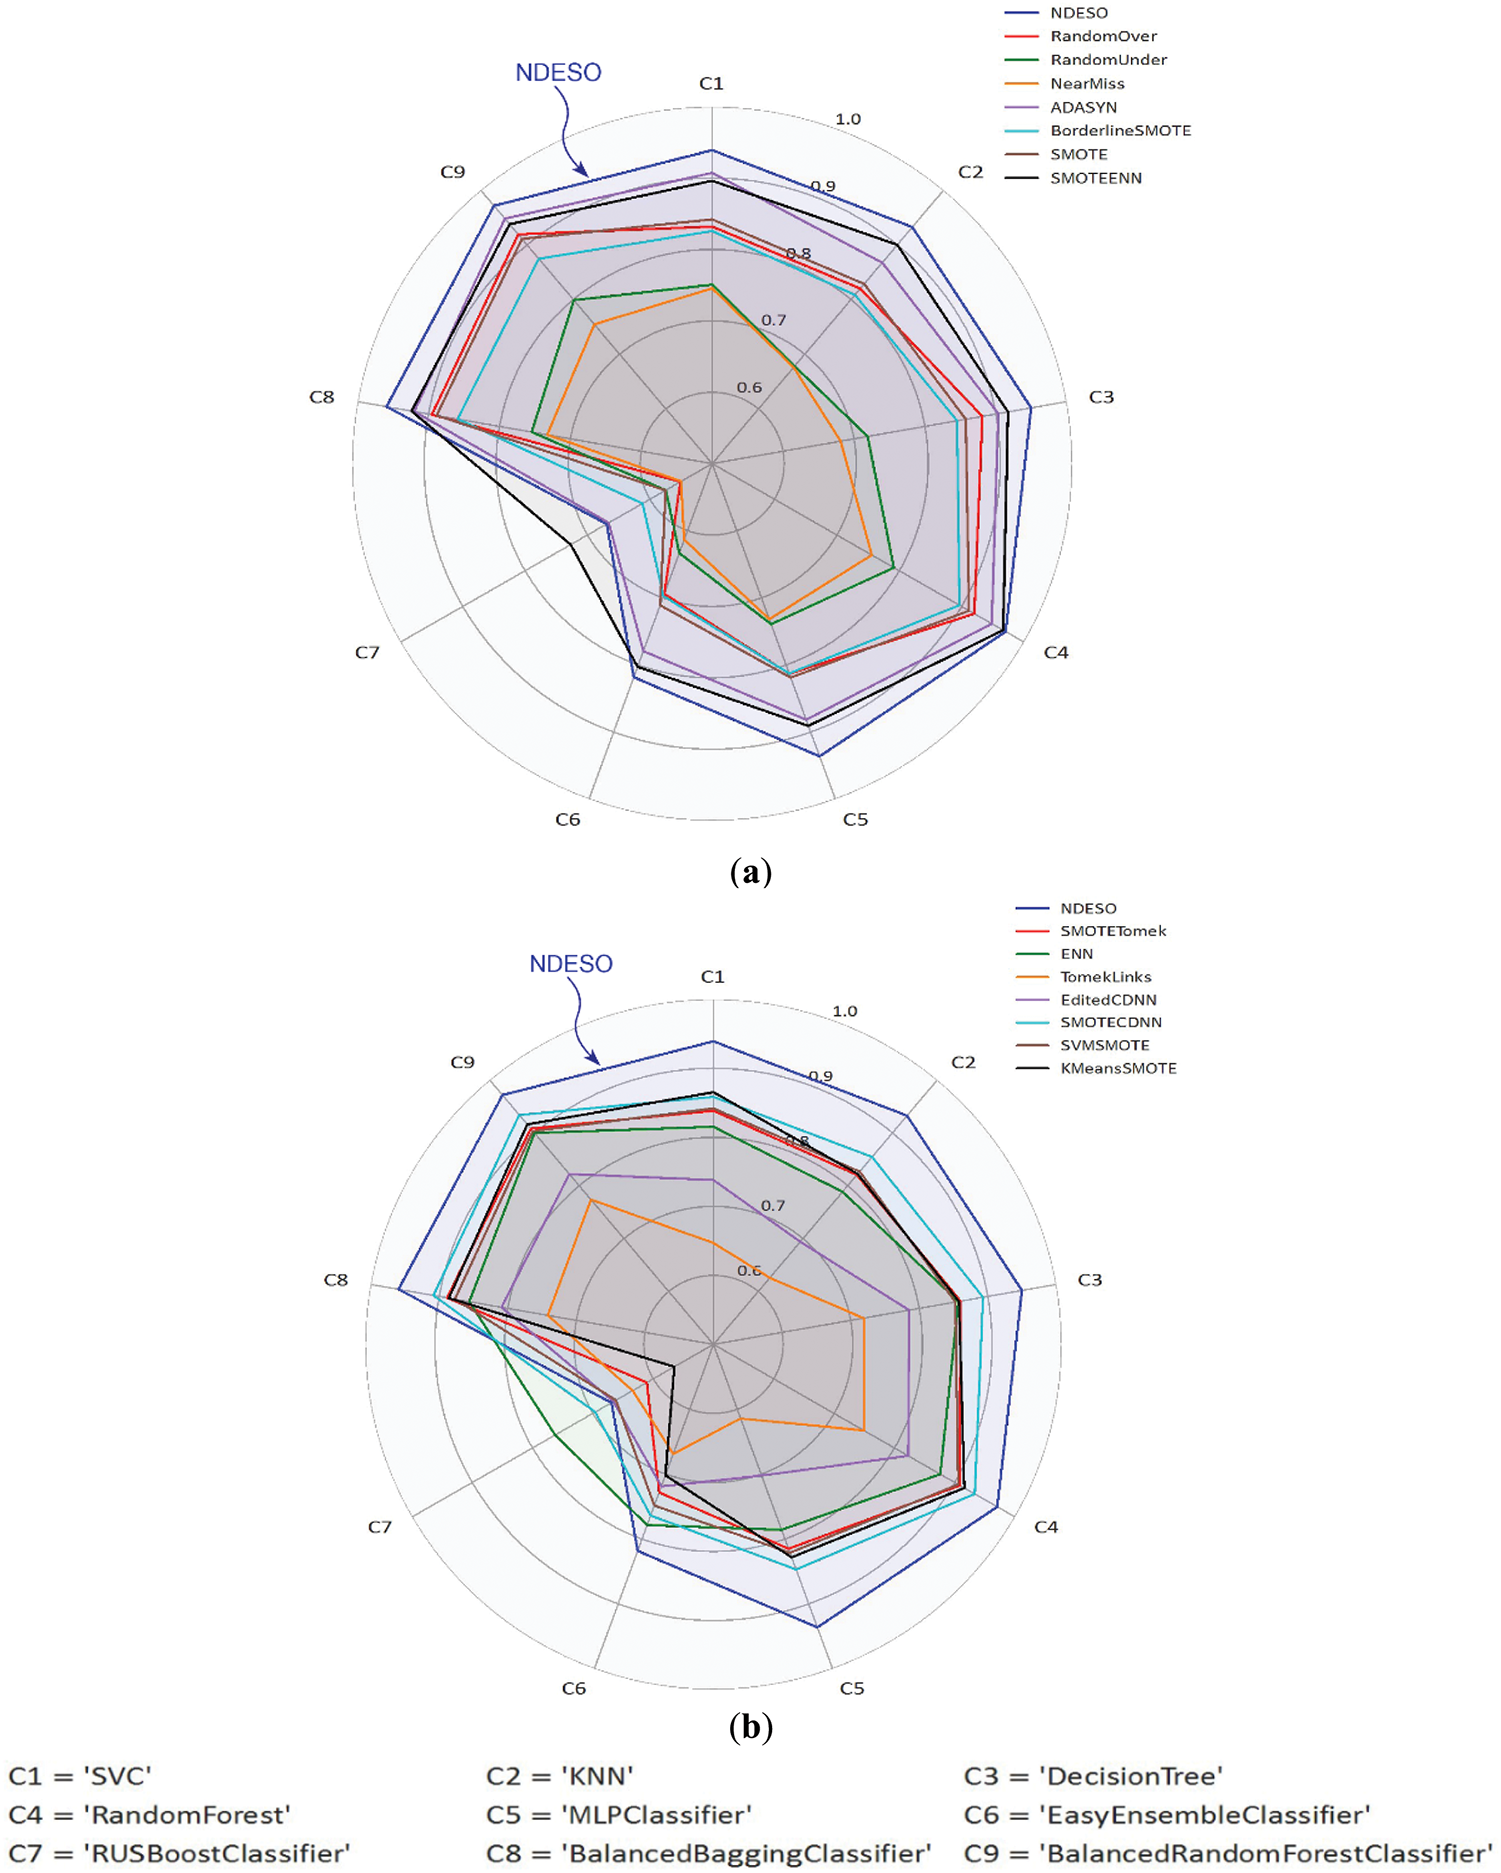
Figure 10: Comparison of the average G-mean scores of resampling methods across various classifiers and datasets, evaluating NDESO against: (a) ROS, RUS, NearMiss, ADASYN, Borderline-SMOTE, SMOTE, SMOTE-ENN; (b) SMOTE-Tomek, ENN, TomekLinks, Edited-CDNN, SMOTE-CNN, SVM-SMOTE, KMeans-SMOTE
The results of the Friedman test and subsequent Nemenyi post-hoc analysis for each classifier are presented in Fig. 11. Statistically, our approach demonstrates strong performance, as evidenced by the Friedman test yielding a p-value significantly lower than the threshold of 0.05, leading to the rejection of the null hypothesis. Furthermore, the Nemenyi post-hoc test reveals that our method shows significant performance, outperforming most of the other methods. This is reflected in the consistently lowest mean rank for our method, except for the RUS Boost classifier. Furthermore, only a few other methods cross the same critical difference threshold as our method, which underlines that the performance improvement achieved by our method, as indicated by the obtained G-mean scores, is statistically significant compared to other alternatives.
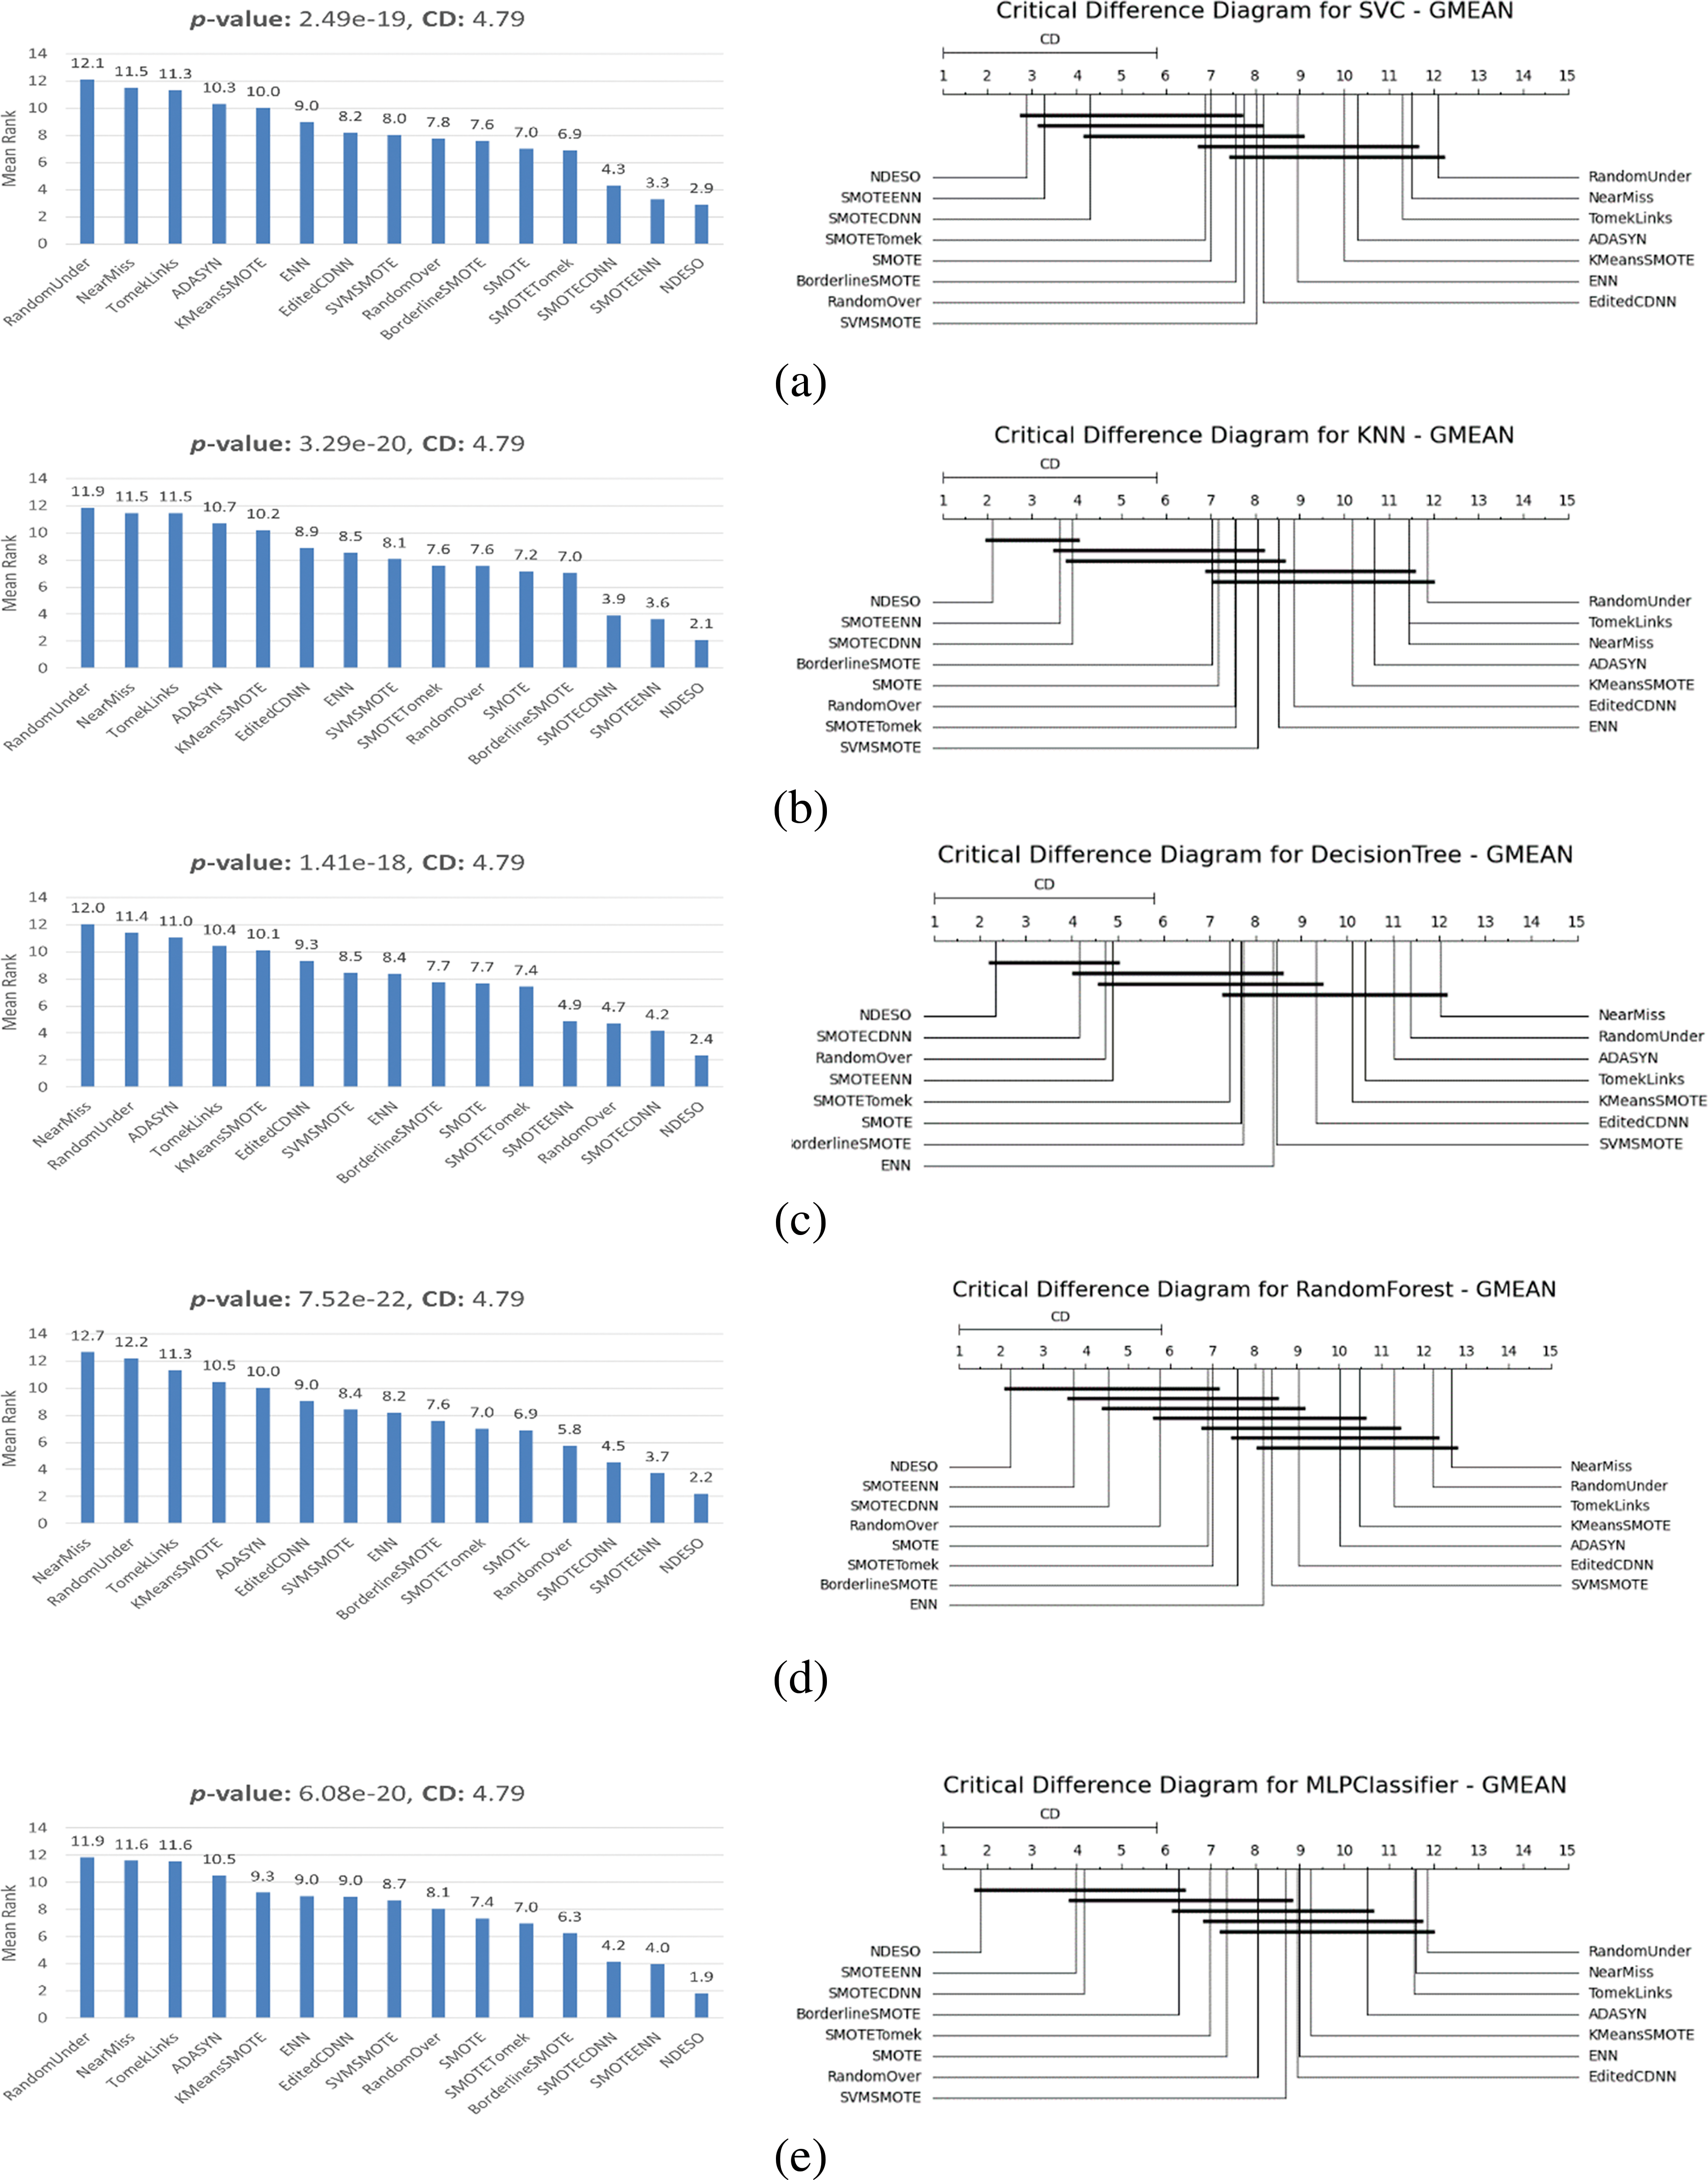
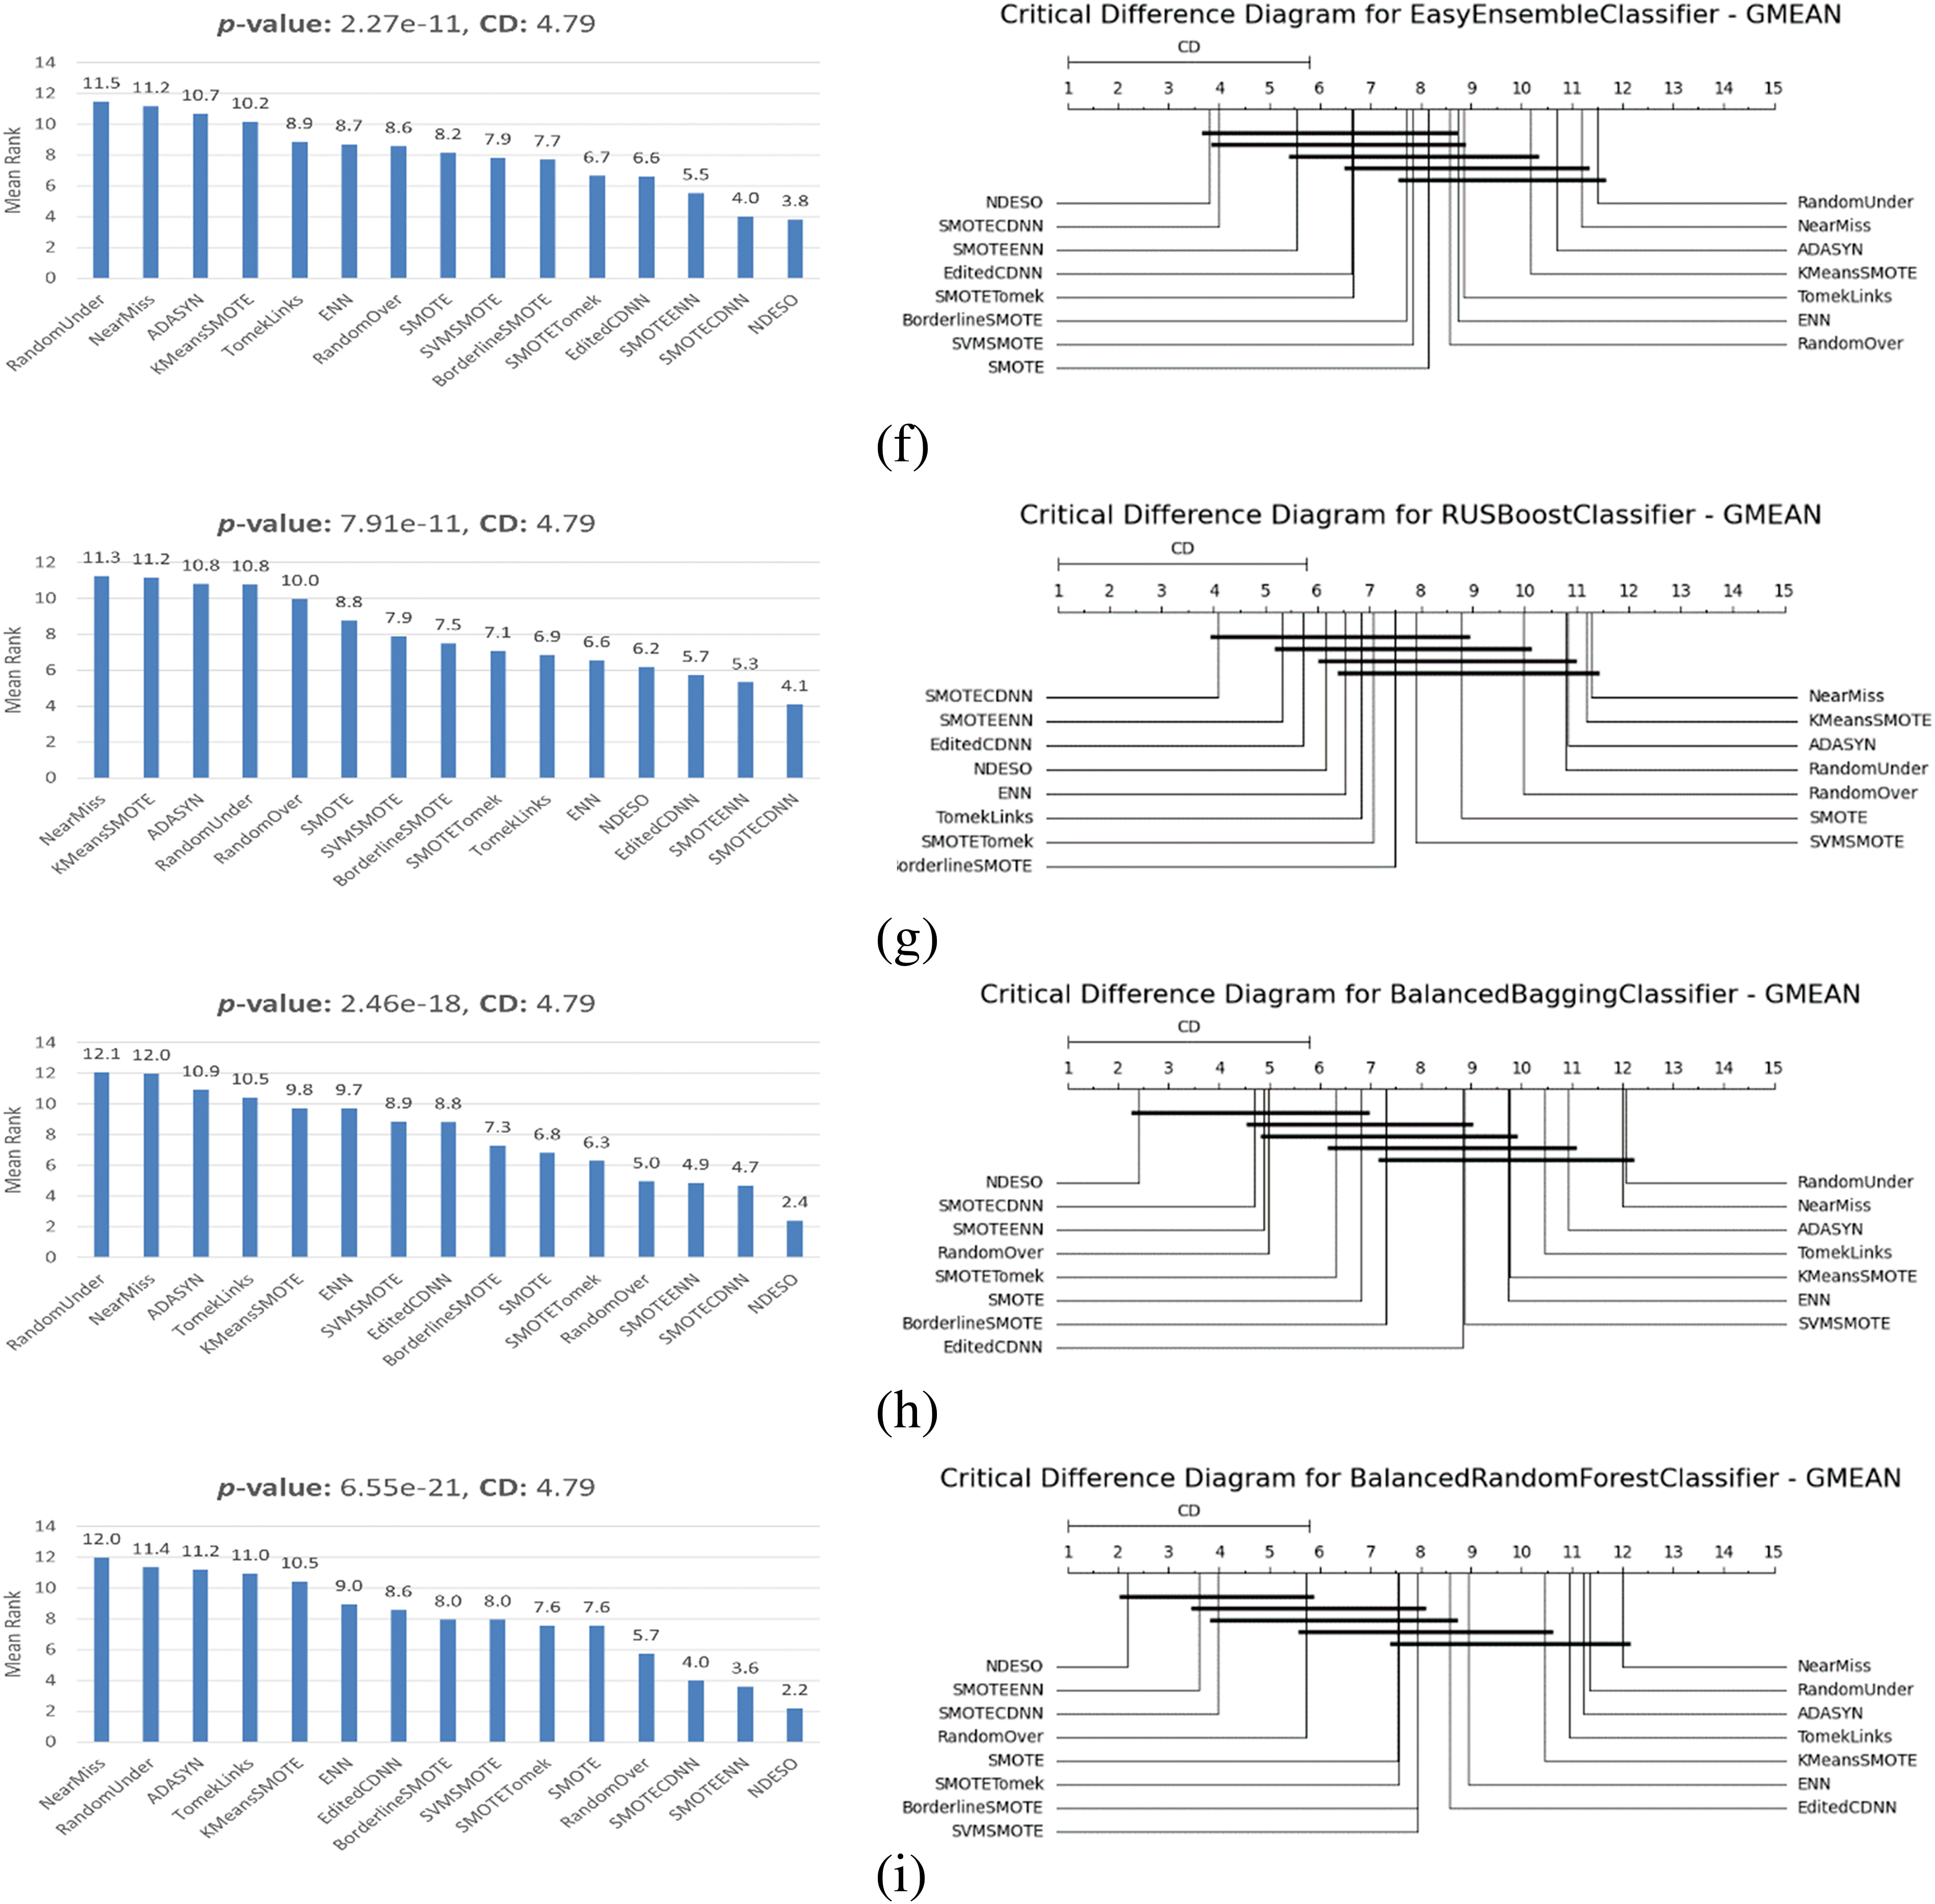
Figure 11: Statistical comparison of resampling methods across classifiers and datasets using the Friedman-Nemenyi post-test. The plots show the mean rank of each resampler (left) and the Critical Difference (CD) diagram (right) for the following classifiers: (a) SVC; (b) k-NN; (c) DecisionTree; (d) RandomForest; (e) MLP; (f) EasyEnsemble; (g) RUSBoost; (h) BalancedBagging; (i) BalancedRandomForest
For example, examining the test results for the MLP classifier, shown in Fig. 11, which correspond to the tabulated results in Table 4, a p-value of 6.08e−20 is shown. This strongly rejects the null hypothesis, confirming that the observed differences are highly unlikely to have occurred by chance. The Critical Difference (CD) = 4.796 from the Nemenyi test suggests that methods with a mean rank difference exceeding this value demonstrate statistically significant performance differences. Conversely, methods with mean rank differences within this value are considered to have no statistically significant differences. For instance, the following groups did not show significant performance differences, as their mean rank differences fall within the CD value (indicated by crossing the same bold line in the diagram):
• RandomUnder, NearMiss, TomekLinks, ADASYN, KMeans-SMOTE, ENN, ECDNN, SVM-SMOTE, RandomOver, and SMOTE
• NearMiss, TomekLinks, ADASYN, KMeans-SMOTE, ENN, ECDNN, SVM-SMOTE, RandomOver, SMOTE, and SMOTE-Tomek
• ADASYN, KMeans-SMOTE, ENN, ECDNN, SVM-SMOTE, RandomOver, SMOTE, SMOTE-Tomek, and Borderline-SMOTE
• SVM-SMOTE, RandomOver, SMOTE, SMOTE-Tomek, Borderline-SMOTE, SMOTE-CDNN, and SMOTE-ENN
• Borderline-SMOTE, SMOTE-CDNN, SMOTE-ENN, and NDESO
This indicates that our method, NDESO, shows a statistically significant performance difference when compared to all other methods, except for Borderline-SMOTE, SMOTE-CDNN, and SMOTE-ENN. However, the superior performance of our method is further supported by its lowest mean rank of 1.85, indicating it outperforms all other methods. In addition, our algorithm achieved an average G-mean score of 0.9362, higher than Borderline-SMOTE’s average of 0.8129, SMOTE-ENN’s average of 0.8909 (with one failure on the vowel dataset), and SMOTE-CDNN’s average of 0.8469, emphasizes its excellence.
We present the scatter plots and confusion matrices for the yeast dataset—one of the sparsest and most imbalanced datasets with ten classes—in Figs. 12 and 13, respectively. The t-SNE plots reveal that similar to the patterns observed with the NDE algorithm in Fig. 8, our NDESO algorithm generates data points with less overlap than other resamplers. In contrast, ECDNN produces relatively clean and separated data points but still exhibits significant overlaps. Additionally, the total number of classes, initially ten, is reduced to nine, indicating that ECDNN may have inadvertently removed critical data points. Furthermore, the confusion matrix plots highlight that our algorithm achieved the best performance, as evidenced by a more apparent dark blue diagonal pattern, reflecting a strong alignment between predicted and actual values. This further confirms the accuracy and reliability of NDESO in correctly classifying the data. ADASYN, ENN, and KMeans-SMOTE were unsuccessful in resampling this dataset, which can also be observed in Table 4, encountering the same error shown in Table 3.
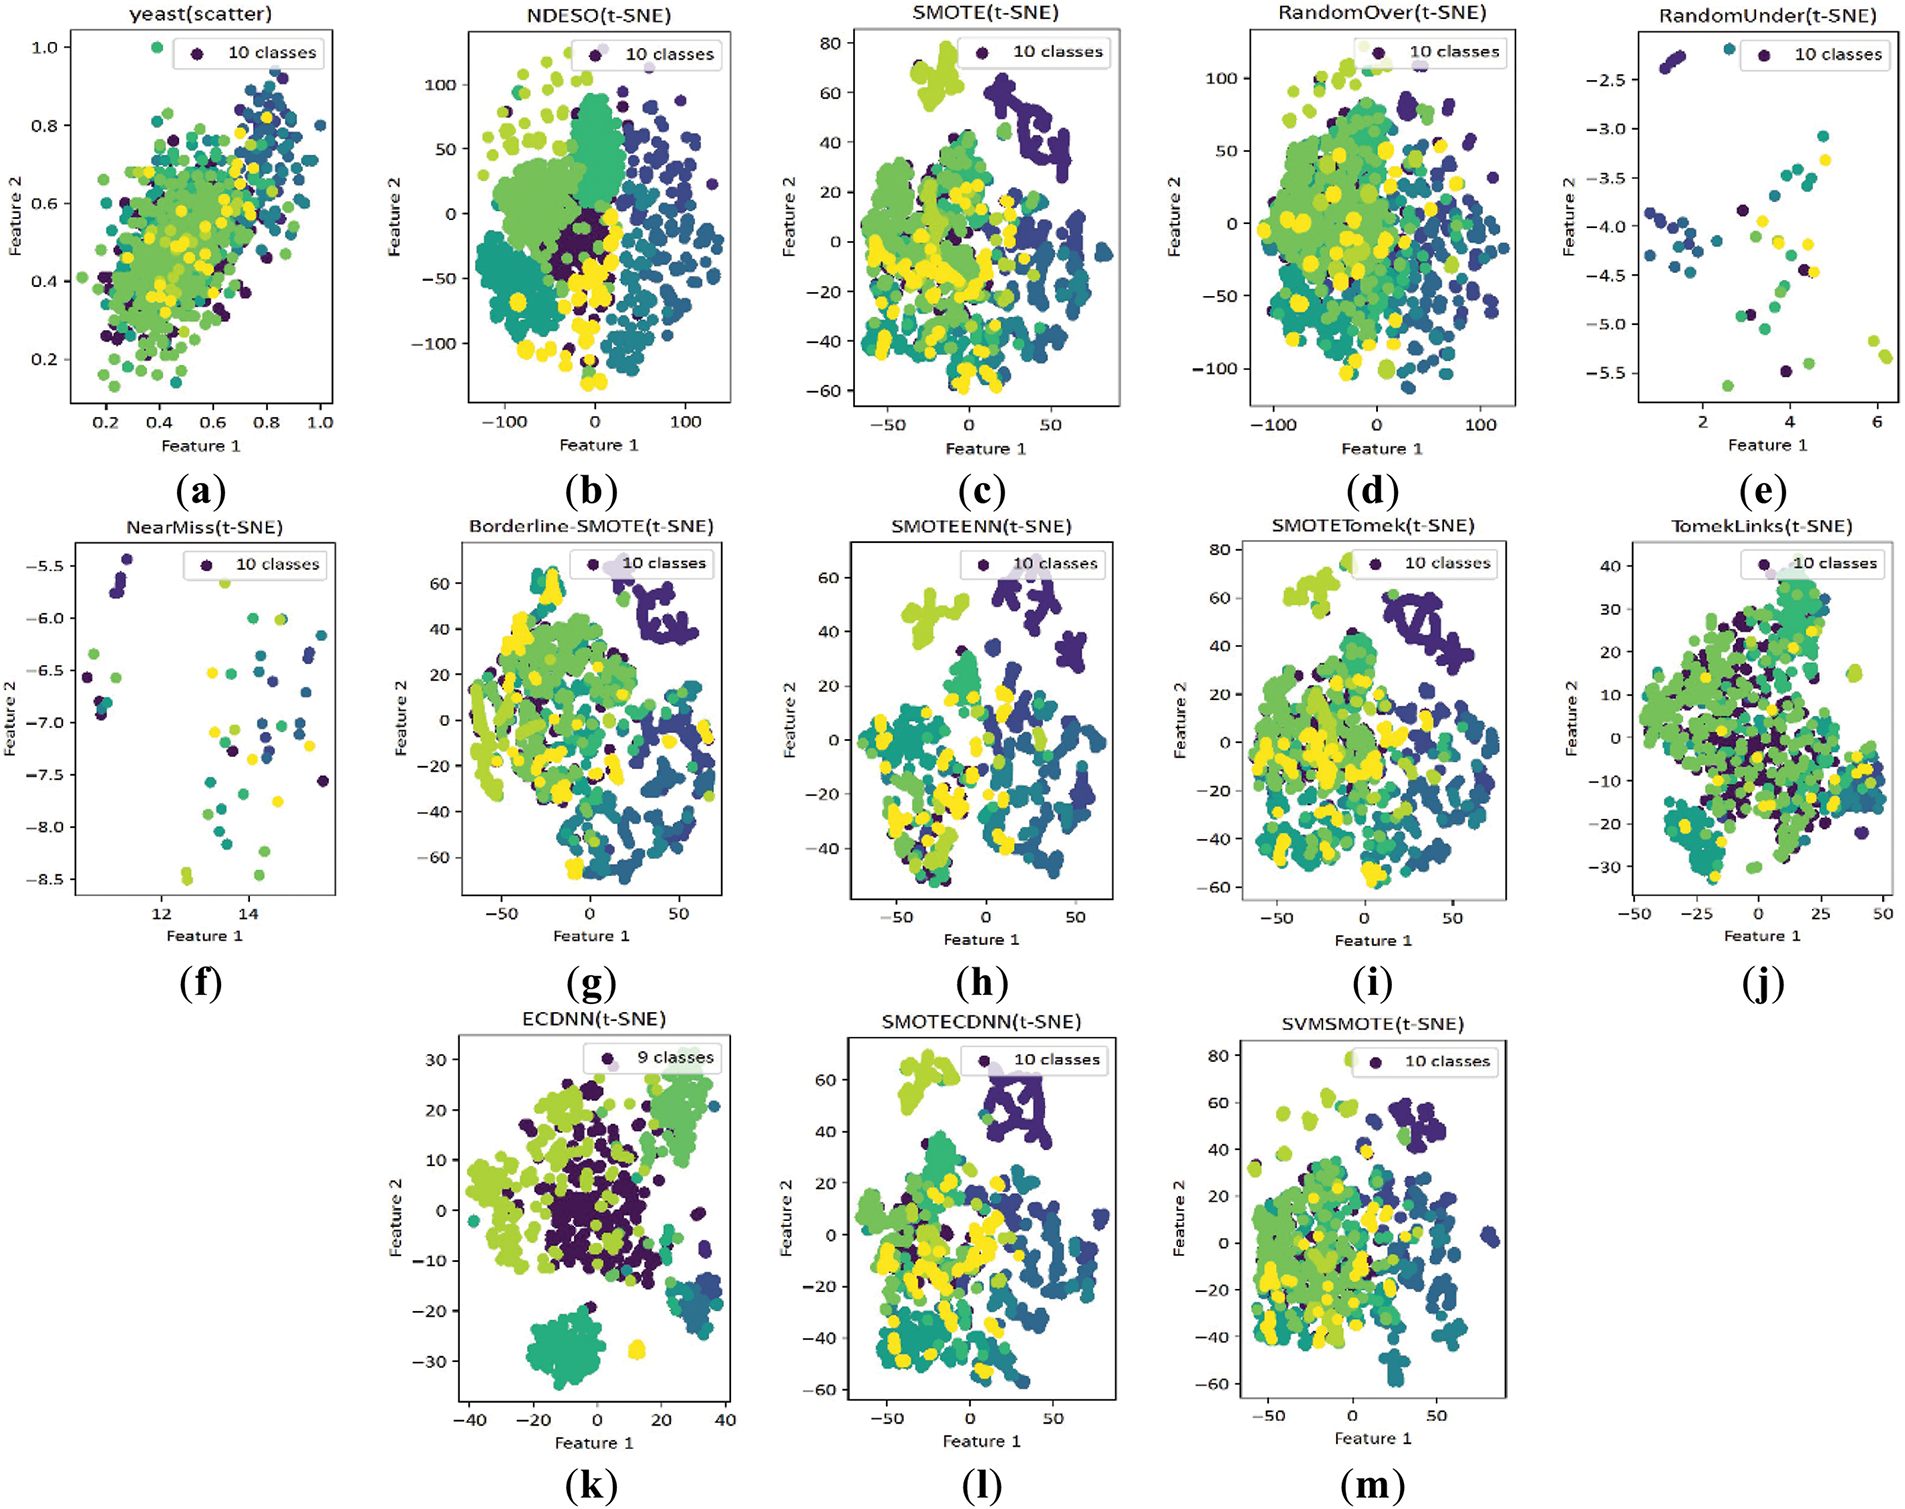
Figure 12: Scatter plots compare our NDESO algorithm with other methods on the Yeast dataset, showing distributions for (a) the original dataset alongside those generated by: (b) NDESO; (c) SMOTE; (d) ROS; (e) RUS; (f) NearMiss; (g) Borderline-SMOTE; (h) SMOTE-ENN; (i) SMOTE-Tomek; (j) TomekLinks; (k) ECDNN; (l) SMOTE-CDNN; (m) SVM-SMOTE
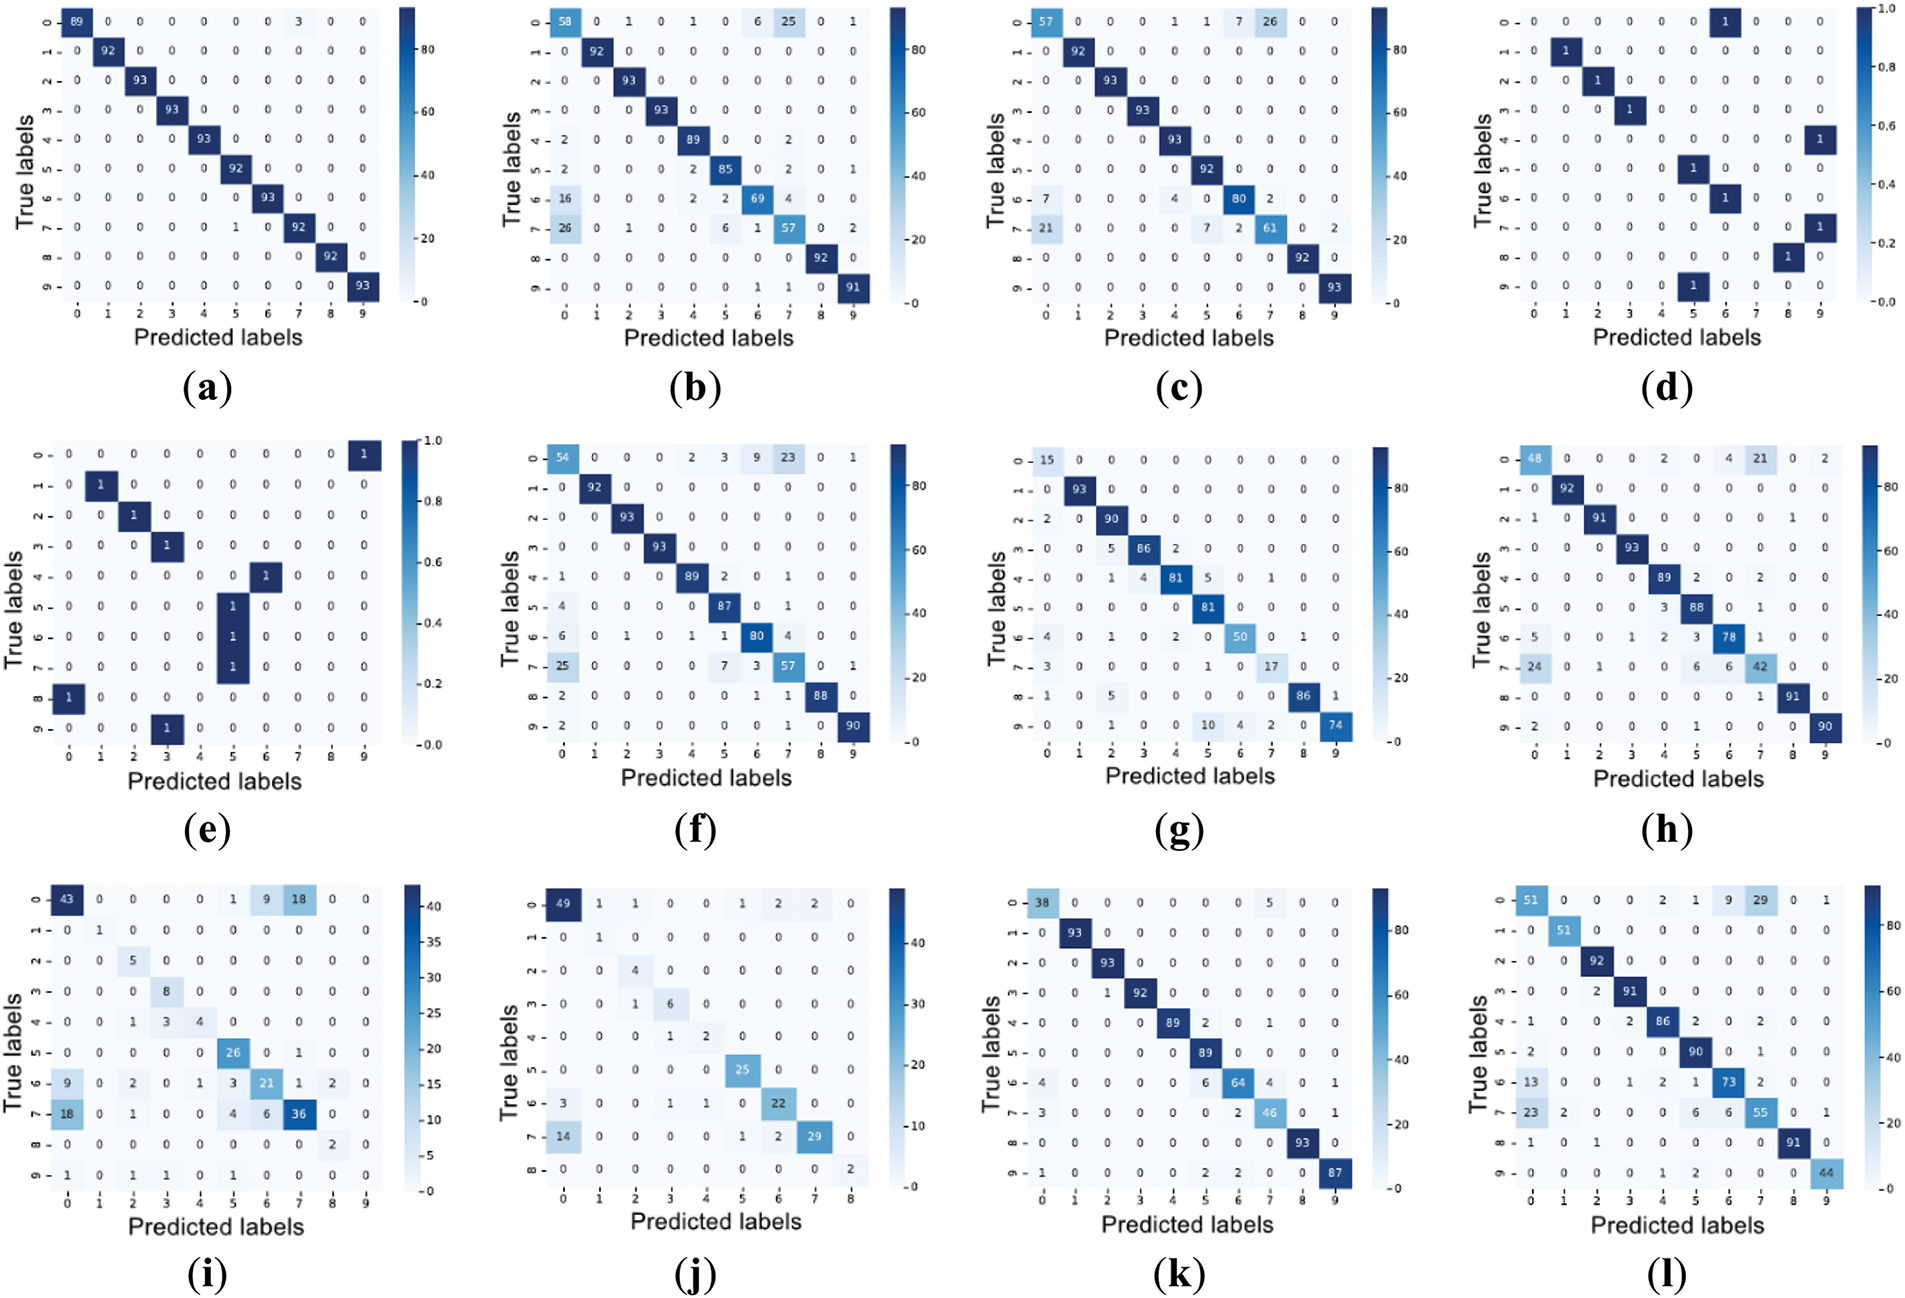
Figure 13: Confusion matrices, assessed using G-mean scores on the Yeast dataset, demonstrate the effectiveness of different resampling methods. NDESO achieved the highest accuracy in aligning predicted labels with true labels. The matrices are presented for: (a) NDESO; (b) SMOTE; (c) ROS; (d) RUS; (e) NearMiss; (f) Borderline-SMOTE; (g) SMOTE-ENN; (h) SMOTE-Tomek; (i) TomekLinks; (j) ECDNN; (k) SMOTE-CDNN; (l) SVM-SMOTE
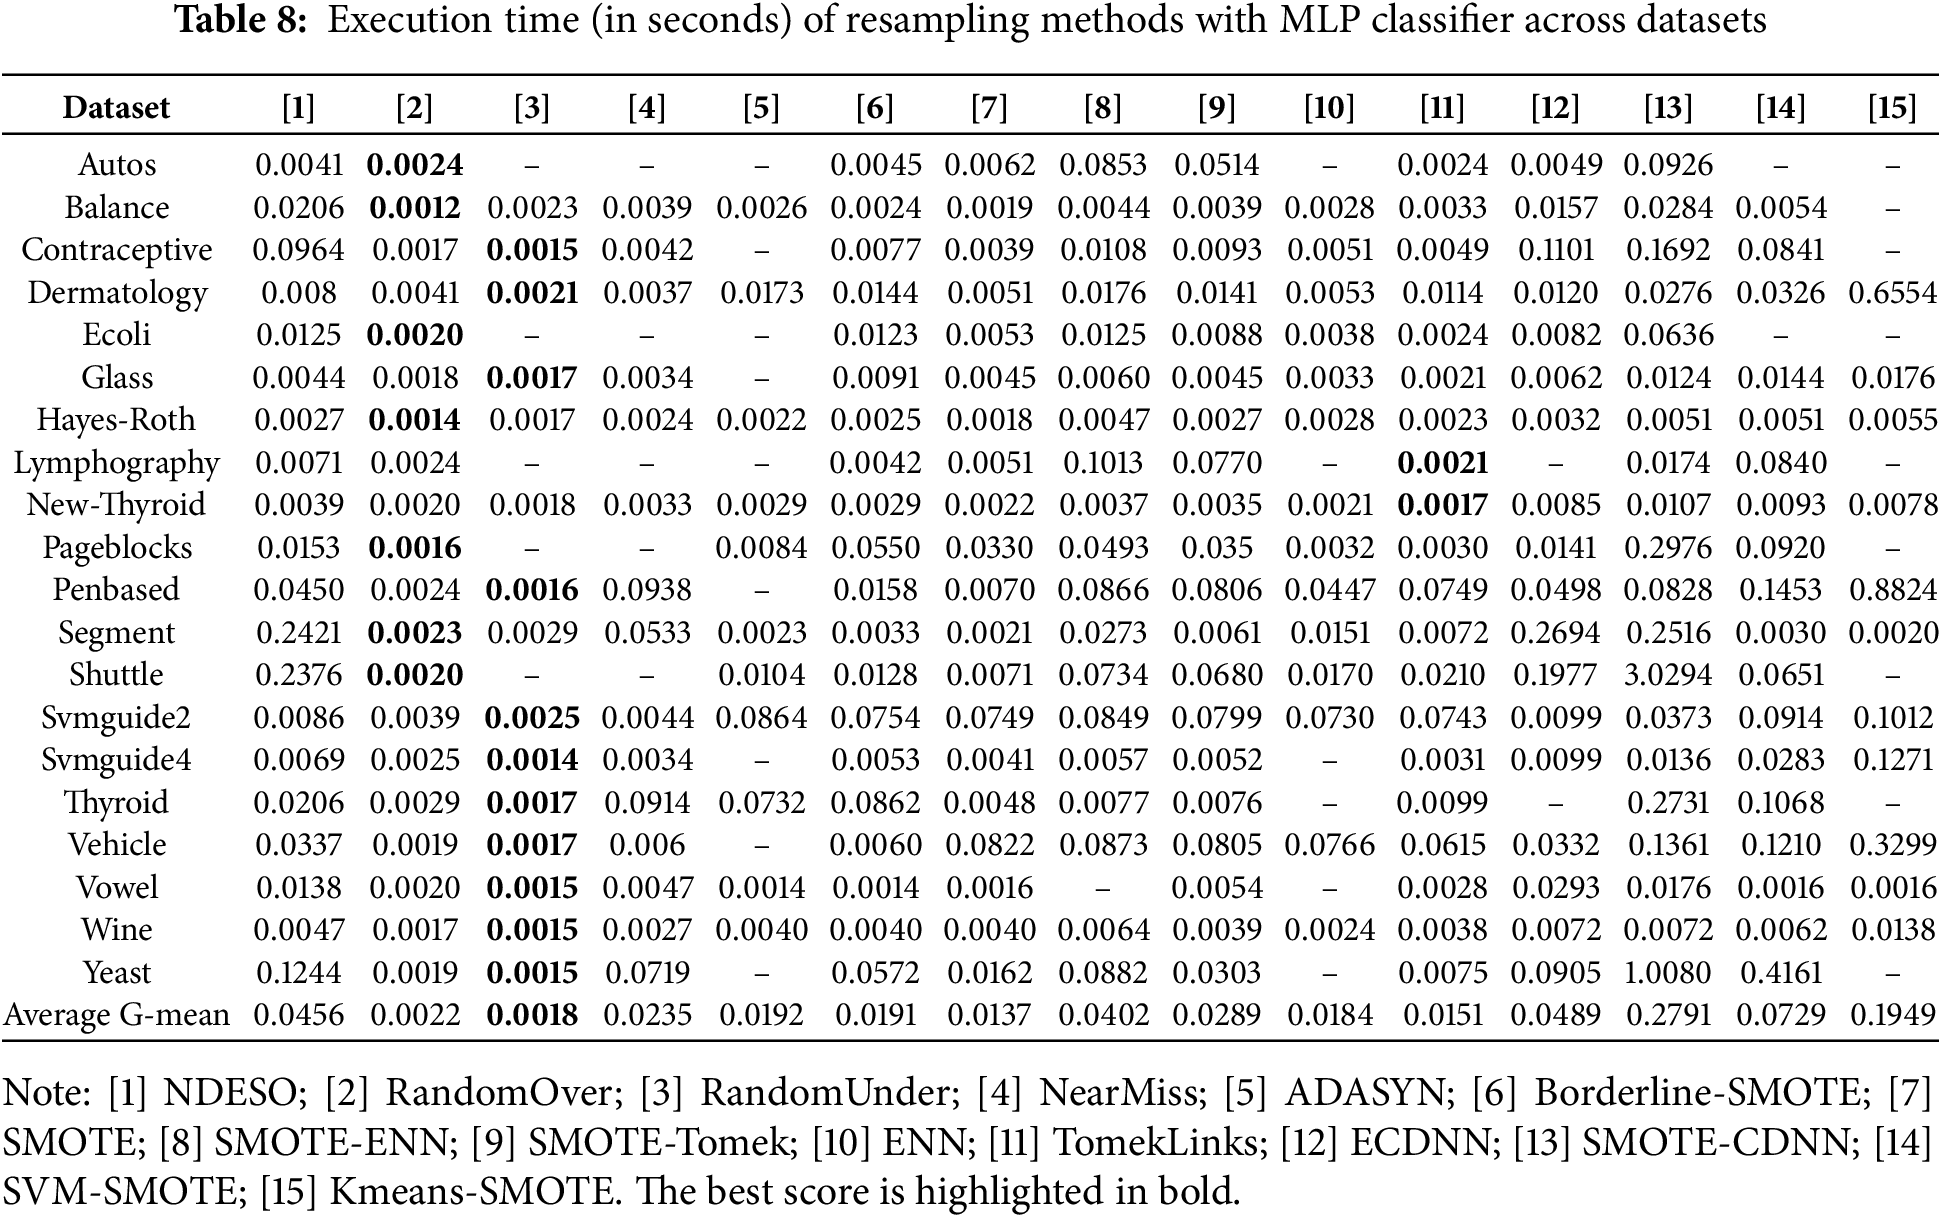
While our method shows a promising result, there is one notable caveat. Our algorithm calculates the average distance between a data point and its k-neighbors and then moves the data point closer to the centroid while maintaining the same distance. This distance calculation process can be computationally expensive, particularly for large datasets. As a result, when referring to Table 8, our method does not show the best performance in terms of execution time. The time recorded reflects only the duration of the resampling process applied to the initial data before the classification task and does not represent the total execution time. More straightforward methods such as RandomUnder, RandomOver, NearMiss, and SMOTE, along with some of their variants, perform better in terms of time efficiency. These methods rely on more straightforward sampling techniques, especially RandomUnder and NearMiss, which can substantially reduce the majority class to balance the dataset. However, this comes at a cost—these methods produce fewer representative samples, causing lower test performance. On the other hand, while our method is not the fastest, it is not the slowest either. Specifically, our method outperforms the SMOTE-CDNN, a more recent SMOTE variant with relatively good resampling results. Additionally, our method is faster than several other methods, such as ECDNN, SVM-SMOTE, and KMeans-SMOTE.
The SMOTE method and its variations have been widely exploited and proven effective in addressing imbalanced class problems in most scenarios. However, while these methods generate quantitatively balanced data, the synthetic data patterns often deviate from the original distribution, introducing noise into the resampled dataset, especially in cases where there are sparse data with overlapping data points. Recently, Wang et al. [23] proposed a hybrid method called SMOTE-CDNN that combines undersampling and oversampling techniques. The undersampling technique in this method removes data points that do not match the class prediction upon the centroid displacement. However, this process may unintentionally discard important information, causing the oversampling to replicate more from less essential ones, potentially increasing the amount of non-representative data points.
In this study, we propose an alternative approach that preserves these noisy data by shifting them closer to the center of their class before performing random oversampling to balance the dataset. There are several benefits to this approach:
1. Relative positioning
Moving these noisy data points keeps their relative positioning within the cluster intact, preserving their contribution toward its class data distribution.
2. Noise reduction
Noisy data points are outliers that can distort the representation of their class. Moving them closer to their centroid helps align them with the central of their class, reducing their impact as noise.
3. Class Boundaries
Moving them from overlapping data points increases the distinct boundaries between classes.
4. Statistical properties
Moving these noisy data points towards the center, the dataset’s statistical properties (e.g., mean, variance) are largely preserved.
5. Oversampling
Doing oversampling after such adjustments makes the generated synthetic data points more likely to align with the class’s data characteristics.
We have validated this hypothesis through various tests, which show that our method consistently outperforms most other resampling methods. Our method successfully handles datasets with an extensive variation in imbalance levels, ranging from ratios of 1:1, 1:94, and 1:164 to a very extreme ratio of 1:853. This ratio far exceeds the level tested in [23], which reached a maximum ratio of 1:130. In addition, the data distribution results of our method show a much better ability to overcome overlap or noise problems compared to SMOTE-CDNN and other SMOTE variations.
The differences between our method and existing approaches are twofold. First, instead of removing data points, as in NearMiss, ENN, or TomekLinks [19,20], our method repositions them, preserving their characteristics while refining their positions, preventing them from contributing as noise. This has the interpretation of recreating better data points while still maintaining similar data characteristics. Second, our method remains computationally efficient, as the repositioning process is straightforward and followed by generating synthetic data based on the improved pattern. This balance between simplicity and effectiveness ensures competitive speed, better than SMOTE-CDNN (which also uses a displacement approach), but achieves a more representative data distribution, leading to better performance.
The experimental results show that our proposed approach is effective in addressing the challenges posed by sparse and imbalanced data. However, as highlighted in the results analysis, our method does have certain limitations. To generate more representative resampling outcomes, it corrects noisy data points prior to oversampling, which introduces additional processing compared to several baseline methods. As a result, our method is not the fastest, although it outperforms other approaches, mainly SMOTE extensions such as SMOTE-CDNN, SVM-SMOTE, and K-Means SMOTE [24]. Additionally, the testing conducted in this study has utilized public datasets, with a maximum of 2310 instances and up to 34 features. While these datasets are sparse and exhibit extreme imbalance, with an imbalance ratio reaching 853, they are not sufficient on their own to fully assess the method’s robustness. More extensive testing is needed, particularly with large-scale and high-dimensional data, to better understand the consistency of our method’s performance when applied to larger datasets. Despite these limitations, our method holds the potential for addressing similar challenges in practical applications, especially in domains where critical data samples are sparse compared to less important data. For instance, in fraud detection in the financial sector, in predicting machine failures, or in other domains such as medical diagnostics, where positive data is limited due to the infrequent occurrence [31,32]. In such cases, our approach can mitigate the imbalance in the minority class, enabling better representation of the critical samples and ultimately improving model performance.
For further exploration, validating our approach through testing and comparison with solutions designed for big data and distributed computing would further highlight its potential, demonstrating how it can be scaled to handle broader and more complex case studies. Big data processing often requires more complex and resource-intensive workflows, especially when dealing with distributed systems and network constraints, as highlighted in various studies on resampling techniques for big data [33–35]. Additionally, exploring its application to binary big data formats, including images, spatial datasets, and graph-based representations, presents an interesting direction for further investigation. This could open up new opportunities in geospatial analysis, network science, and high-dimensional data processing, paving the way for broader adoption and adaptation of the proposed approach in various real-world scenarios.
This paper proposes a hybrid resampling method consisting of a noisy data point displacement approach with a random oversampling technique to handle imbalanced multiclass data. Our foundational approach performs noisy data point displacement by taking the average distance of a data point among its k-neighbors and repositioning it closer to the class centroid with equal distance. This procedure is repeated across overlapping data points, resulting in a cleaner class separation ready for oversampling. The method continues to refine the dataset by performing random oversampling to balance the data distribution. The approach was validated by confronting it with 14 other baseline resamplers on nine classifiers across 20 real-world datasets. Various parameter variations of the method have also been evaluated to demonstrate its robustness. Extensive testing results with statistical test confirmation have shown that our approach outperforms most baselines, highlighting our method’s suitability for various real-world imbalanced classification tasks. Further research on the effectiveness of our strategy towards resampling in big data environments with other types of datasets is an open topic for investigation.
Acknowledgement: The authors thank all editors and anonymous reviewers for their comments and suggestions.
Funding Statement: The authors received no specific funding for this study.
Author Contributions: The authors confirm their contribution to the paper as follows: study conception and design: I Made Putrama; data collection: I Made Putrama; analysis and interpretation of results: I Made Putrama; draft manuscript preparation: I Made Putrama; resources, validation, and supervision: Péter Martinek. All authors reviewed the results and approved the final version of the manuscript.
Availability of Data and Materials: The data that support the findings of this study are available on GitHub at https://github.com/goshlive/imbalanced-ndeso (accessed on 14 January 2025).
Ethics Approval: Not applicable.
Conflicts of Interest: The authors declare no conflicts of interest to report regarding the present study.
2https://sci2s.ugr.es/keel/imbalanced.php
3https://www.openml.org/search?type=data
References
1. Arafa A, El-Fishawy N, Badawy M, Radad M. RN-SMOTE: reduced noise SMOTE based on DBSCAN for enhancing imbalanced data classification. J King Saud Univ—Comput Inf Sci. 2022;34(8):5059–74. doi:10.1016/j.jksuci.2022.06.005. [Google Scholar] [CrossRef]
2. Ren J, Wang Y, Cheung Y, Gao XZ, Guo X. Grouping-based oversampling in kernel space for imbalanced data classification. Pattern Recognit. 2023;133:108992. doi:10.1016/j.patcog.2022.108992. [Google Scholar] [CrossRef]
3. Madkour AH, Abdelkader HM, Mohammed AM. Dynamic classification ensembles for handling imbalanced multiclass drifted data streams. Inf Sci. 2024;670:120555. doi:10.1016/j.ins.2024.120555. [Google Scholar] [CrossRef]
4. Lango M, Stefanowski J. What makes multi-class imbalanced problems difficult? An experimental study. Expert Syst Appl. 2022;199:116962. doi:10.1016/j.eswa.2022.116962. [Google Scholar] [CrossRef]
5. Yu T, Huo Y. Classification of imbalanced data set in financial field based on combined algorithm. Mob Inf Syst. 2022;2022:1–7. doi:10.1155/2022/1839204. [Google Scholar] [CrossRef]
6. Han T, Liu C, Yang W, Jiang D. Deep transfer network with joint distribution adaptation: a new intelligent fault diagnosis framework for industry application. ISA Trans. 2020;97:269–81. doi:10.1016/j.isatra.2019.08.012. [Google Scholar] [PubMed] [CrossRef]
7. Fan S, Zhang X, Song Z. Imbalanced sample selection with deep reinforcement learning for fault diagnosis. IEEE Trans Ind Inform. 2022;18(4):2518–27. doi:10.1109/TII.2021.3100284. [Google Scholar] [CrossRef]
8. Giorgio A, Cola G, Wang L. Systematic review of class imbalance problems in manufacturing. J Manuf Syst. 2023;71:620–44. doi:10.1016/j.jmsy.2023.10.014. [Google Scholar] [CrossRef]
9. Rezvani S, Wang X. A broad review on class imbalance learning techniques. Appl Soft Comput. 2023;143(9):110415. doi:10.1016/j.asoc.2023.110415. [Google Scholar] [CrossRef]
10. Liu M, Dong M, Jing C. A modified real-value negative selection detector-based oversampling approach for multiclass imbalance problems. Inf Sci. 2021;556:160–76. doi:10.1016/j.ins.2020.12.058. [Google Scholar] [CrossRef]
11. Niaz NU, Shahariar KMN, Patwary MJA. Class imbalance problems in machine learning: a review of methods and future challenges. In: Proceedings of the 2nd International Conference on Computing Advancements; 2022 Mar 10–12; Dhaka, Bangladesh. p. 485–90. doi:10.1145/3542954.3543024. [Google Scholar] [CrossRef]
12. Ding H, Sun Y, Wang Z, Huang N, Shen Z, Cui X. RGAN-EL: a GAN and ensemble learning-based hybrid approach for imbalanced data classification. Inf Process Manag. 2023;60(2):1–20. doi:10.1016/j.ipm.2022.103235. [Google Scholar] [CrossRef]
13. Pan T, Chen J, Zhang T, Liu S, He S, Lv H. Generative adversarial network in mechanical fault diagnosis under small sample: a systematic review on applications and future perspectives. ISA Trans. 2022;128:1–10. doi:10.1016/j.isatra.2021.11.040. [Google Scholar] [PubMed] [CrossRef]
14. Patange AD, Pardeshi SS, Jegadeeshwaran R, Zarkar A, Verma K. Augmentation of decision tree model through hyper-parameters tuning for monitoring of cutting tool faults based on vibration signatures. J Vib Eng Technol. 2023;11(8):3759–77. doi:10.1007/s42417-022-00781-9. [Google Scholar] [CrossRef]
15. Pancaldi F, Dibiase L, Cocconcelli M. Impact of noise model on the performance of algorithms for fault diagnosis in rolling bearings. Mech Syst Signal Process. 2023;188:109975. doi:10.1016/j.ymssp.2022.109975. [Google Scholar] [CrossRef]
16. Nasir F, Ahmed AA, SabirKiraz M, Yevseyeva I, Saif M. Data-driven decision-making for bank targetmarketing using supervised learning classifiers on imbalanced big data. Comput Mater Contin. 2024;81(1):1703–28. doi:10.32604/cmc.2024.055192. [Google Scholar] [CrossRef]
17. Wang N, Zhang ZL, Luo XG. Iterative minority oversampling and its ensemble for ordinal imbalanced datasets. Eng Appl Artif Intell. 2024;127(Pt A):107211. doi:10.1016/j.engappai.2023.107211. [Google Scholar] [CrossRef]
18. Vairetti C, Assadi JL, Maldonado S. Efficient hybrid oversampling and intelligent undersampling for imbalanced big data classification. Expert Syst Appl. 2024;246:123149. doi:10.1016/j.eswa.2024.123149. [Google Scholar] [CrossRef]
19. Zhang J, Mani I. KNN approach to unbalanced data distributions: a case study involving information extraction. In: Proceedings of the International Conference on Machine Learning (ICML 2003); 2003 Aug 21–24; Washington, DC, USA. p. 1–7. [Google Scholar]
20. Kulkarni A, Chong D, Batarseh FA. Foundations of data imbalance and solutions for a data democracy. Data Democr Nexus Artif Intell Softw Dev Knowl Eng. 2020;83–106. doi:10.1016/B978-0-12-818366-3.00005-8. [Google Scholar] [CrossRef]
21. Chawla NV, Bowyer KW, Hall LO, Kegelmeyer WP. SMOTE: synthetic minority over-sampling technique. J Artif Intell Res. 2002;16:321–57. doi:10.1613/jair.953. [Google Scholar] [CrossRef]
22. Yuan Y, Wei J, Huang H, Jiao W, Wang J, Chen H. Review of resampling techniques for the treatment of imbalanced industrial data classification in equipment condition monitoring. Eng Appl Artif Intell. 2023;126(Pt B):106911. doi:10.1016/j.engappai.2023.106911. [Google Scholar] [CrossRef]
23. Wang AX, Chukova SS, Nguyen BP. Synthetic minority oversampling using edited displacement-based k-nearest neighbors. Appl Soft Comput. 2023;148:110895. doi:10.1016/j.asoc.2023.110895. [Google Scholar] [CrossRef]
24. Ahsan MM, Ali MS, Siddique Z. Enhancing and improving the performance of imbalanced class data using novel GBO and SSG: a comparative analysis. Neural Netw. 2024;173:106157. doi:10.1016/j.neunet.2024.106157. [Google Scholar] [PubMed] [CrossRef]
25. He H, Bai Y, Garcia EA, Li S. ADASYN: adaptive synthetic sampling approach for imbalanced learning. In: Proceedings of the 2008 IEEE International Joint Conference on Neural Networks (IEEE World Congress on Computational Intelligence); 2008 Jun 1–8; Hong Kong, China. p. 132–8. doi:10.1109/IJCNN.2008.4633969. [Google Scholar] [CrossRef]
26. Islam A, Belhaouari SB, Rehman AU, Bensmail H. KNNOR: an oversampling technique for imbalanced datasets. Appl Soft Comput. 2022;115:108288. doi:10.1016/j.asoc.2021.108288. [Google Scholar] [CrossRef]
27. Wang AX, Chukova SS, Nguyen BP. Implementation and analysis of centroid displacement-based k-nearest neighbors. In: Chen WT, Yao LN, Cai TT, Pan SR, Shen T, Li X, editors. Advanced Data Mining and Applications. International Conference on Advanced Data Mining and Applications; 2022 Nov 28–30; Brisbane, QLD, Australia. Berlin/Heidelberg, Germany: Springer; 2022. p. 431–43. doi:10.1007/978-3-031-22064-7_31. [Google Scholar] [CrossRef]
28. Jia L, Wang Z, Sun P, Xu Z. R-WDLS: an efficient security region oversampling technique based on data distribution. Appl Soft Comput. 2024;154:111376. doi:10.1016/j.asoc.2024.111376. [Google Scholar] [CrossRef]
29. Demšar J. Statistical comparisons of classifiers over multiple data sets. J Mach Learn Res. 2006;7:1–30. doi:10.5555/1248547.1248548. [Google Scholar] [CrossRef]
30. Mujeeb S, Javaid N, Ahmed A, Gulfam SM, Qasim U, Shafiq M, et al. Electricity theft detection with automatic labeling and enhanced RUSBoost classification using differential evolution and jaya algorithm. IEEE Access. 2021;9:128521–39. doi:10.1109/ACCESS.2021.3102643. [Google Scholar] [CrossRef]
31. Huang H, Liu B, Xue X, Cao J, Chen X. Imbalanced credit card fraud detection data: a solution based on hybrid neural network and clustering-based undersampling technique. Appl Soft Comput. 2024;154:111368. doi:10.1016/j.asoc.2024.111368. [Google Scholar] [CrossRef]
32. Rithani M, Kumar RP, Ali A. A dynamic ensemble learning based data mining framework for medical imbalanced big data. Knowl Based Syst. 2025;310:112947. doi:10.1016/j.knosys.2024.112947. [Google Scholar] [CrossRef]
33. Bagui S, Li K. Resampling imbalanced data for network intrusion detection datasets. J Big Data. 2021;8(1):6. doi:10.1186/s40537-020-00390-x. [Google Scholar] [CrossRef]
34. Singh T, Khanna R, Satakshi, Kumar M. Improved multi-class classification approach for imbalanced big data on spark. J Supercomput. 2023;79(6):6583–611. doi:10.1007/s11227-022-04908-3. [Google Scholar] [CrossRef]
35. Wang H, Xiao M, Wu C, Zhang J. Distributed classification for imbalanced big data in distributed environments. Wirel Netw. 2024;30(5):3657–68. doi:10.1007/s11276-021-02552-y. [Google Scholar] [CrossRef]
Cite This Article
 Copyright © 2025 The Author(s). Published by Tech Science Press.
This work is licensed under a Creative Commons Attribution 4.0 International License , which permits unrestricted use, distribution, and reproduction in any medium, provided the original work is properly cited.
 Downloads
 Citation Tools