
 Submit a Paper
 Propose a Special lssue
 Open Access
ARTICLE
Enhancing Fire Detection with YOLO Models: A Bayesian Hyperparameter Tuning Approach
1 Department of Software, Sejong University, Seoul, 05006, Republic of Korea
2 Department of Computer Education, Sungkyunkwan University, Seoul, 03063, Republic of Korea
* Corresponding Author: Chun-Su Park. Email:
Computers, Materials & Continua 2025, 83(3), 4097-4116. https://doi.org/10.32604/cmc.2025.063468
Received 15 January 2025; Accepted 26 March 2025; Issue published 19 May 2025
 View Full Text
 Download PDF
Abstract
Fire can cause significant damage to the environment, economy, and human lives. If fire can be detected early, the damage can be minimized. Advances in technology, particularly in computer vision powered by deep learning, have enabled automated fire detection in images and videos. Several deep learning models have been developed for object detection, including applications in fire and smoke detection. This study focuses on optimizing the training hyperparameters of YOLOv8 and YOLOv10 models using Bayesian Tuning (BT). Experimental results on the large-scale D-Fire dataset demonstrate that this approach enhances detection performance. Specifically, the proposed approach improves the mean average precision at an Intersection over Union (IoU) threshold of 0.5 (mAP50) of the YOLOv8s, YOLOv10s, YOLOv8l, and YOLOv10l models by 0.26, 0.21, 0.84, and 0.63, respectively, compared to models trained with the default hyperparameters. The performance gains are more pronounced in larger models, YOLOv8l and YOLOv10l, than in their smaller counterparts, YOLOv8s and YOLOv10s. Furthermore, YOLOv8 models consistently outperform YOLOv10, with mAP50 improvements of 0.26 for YOLOv8s over YOLOv10s and 0.65 for YOLOv8l over YOLOv10l when trained with BT. These results establish YOLOv8 as the preferred model for fire detection applications where detection performance is prioritized.Keywords
Fires and wildfires cause significant damage to property, the environment, and human lives. In the United States, approximately 1.5 million fires occurred in 2022, resulting in 3790 civilian fatalities, 13,250 injuries, and $18 billion in property damage, according to the National Fire Protection Association [1]. Surprisingly, a fire occurred every 21 s on average in that year. In 2024, the United States experienced 7734 wildfires, with an average area burned per wildfire of 8299 hectares [2].
Various methods and sensors for early fire detection are essential for minimizing damage and saving lives [3]. Vision sensors, such as cameras, offer several advantages over non-visual techniques like ionization smoke sensors, which detect changes in air ionization levels. Cameras can monitor larger areas, including extensive regions when mounted on drones. They are also easy to install, cost-effective, and adaptable to different environments. Furthermore, camera data can be utilized to analyze fire development, including the speed and direction of spread. Consequently, visual-based fire detection has gained significant attention in recent years.
Early visual-based fire detection methods relied on rule-based or traditional machine learning approaches [4,5], which required significant effort in feature design. In contrast, by learning directly from data, deep learning (DL) [6] approaches have achieved state-of-the-art performance in vision tasks, including object detection [7], and have been applied to fire and smoke detection in images and videos. A comprehensive review [8] highlights the growing adoption of DL, particularly YOLO-based architectures [9], for fire and smoke detection. Unlike two-stage detectors like Faster R-CNN [10], YOLO follows a single-stage detection approach, enabling significantly faster inference while maintaining strong accuracy. This speed-accuracy tradeoff is crucial for real-time fire detection, where rapid response minimizes damage. For instance, YOLOv3 [11] not only achieves a slightly higher mAP than Faster R-CNN but is also nine times faster, demonstrating its superiority for time-sensitive applications. The YOLO series has evolved through multiple architectural advancements, with some widely used versions including YOLOv5 [12] (2020), YOLOv8 [13] (2023), and YOLOv10 [14] (2024). Basic information about these models and their performance metrics is illustrated in Fig. 1.

Figure 1: Variants of You Only Look Once (YOLO) versions (v5, v8, v10) compared by number of model parameters, Giga Floating Point Operations (GFLOPs), and mean average precision (mAP) at Intersection over Union (IoU) Thresholds of 0.50 to 0.95 (mAP50-95) on the Common Objects in Context (COCO) dataset [15]. The size of each dot on the chart indicates the model’s GFLOPs as an indicator of its computational complexity. One aspect of this study investigates whether the performance of YOLOv8 and YOLOv10 on the D-Fire dataset [16] is consistent with their performance on the COCO dataset
While previous studies have applied YOLO models for fire and smoke detection, most have focused on architectural modifications [17,18] while relying on default or manually selected hyperparameters, or have only employed a basic grid search for hyperparameter tuning [19]. This study proposes an alternative approach to enhance YOLO models for fire and smoke detection by optimizing training hyperparameters using Bayesian Tuning (BT). YOLOv8 and YOLOv10 are utilized in this study due to their recent advancements, widespread adoption in academia and industry, and their implementation within the Ultralytics framework [13], enabling direct comparative analysis. Moreover, as illustrated in Fig. 1, YOLOv10 surpasses YOLOv8 in performance on the COCO dataset [15]. However, in the context of fire and smoke detection, this trend remains ambiguous in literature. To investigate this, we train YOLOv8 and YOLOv10 models, evaluate their performance, and compare the results on the D-Fire dataset [16], a large-scale dataset for fire and smoke detection.
Our main contributions are summarized as follows:
• We provide an overview of the Optuna framework [20], outline its general applications, and present a procedure for applying Bayesian tuning to optimize the training parameters of YOLOv8 and YOLOv10 models. This approach enables the identification of optimal training configurations for each model.
• We perform the proposed Bayesian tuning process for the YOLOv8 and YOLOv10 models using the D-Fire dataset [16] to identify the optimal training hyperparameters for each model. We then utilize these optimized hyperparameters to train the models and evaluate their performance on the same dataset.
• We present detailed analyses of the hyperparameter tuning process and the object detection performance of the YOLOv8 and YOLOv10 models on the D-Fire dataset. Additionally, we offer insights into these models, including speed-accuracy trade-offs, generalization capacity evaluated through testing on a different dataset, and detection failure analysis supported by visualizations.
The rest of this paper is organized as follows: Section 2 provides an overview of the D-Fire dataset, the Optuna framework, and related YOLO-based fire and smoke detection studies. Section 3 describes our methodology, including evaluation metrics, the YOLO models utilized, and the proposed hyperparameter tuning protocol. Section 4 presents the experimental results, while Section 5 presents the key conclusions, discusses the limitations of this study, and outlines potential directions for future research.
Our method requires extensive image data for hyperparameter tuning, training, and testing the experimental YOLO models in real-world scenarios. To meet these requirements, the D-Fire dataset [16] was selected due to its large size, and well-defined training, validation, and testing subsets. The D-Fire dataset [16] contains a total of 21,527 images. Each image is manually annotated with bounding boxes categorized into two classes: fire and smoke. Consequently, four scenarios can occur in an image: (1) an image with fire, (2) an image with smoke, (3) an image with both fire and smoke, and (4) an image without any fire or smoke (referred to as “None”). Statistical data on image categories and bounding box classes of this dataset are presented in Fig. 2b. The D-Fire image dataset was divided by its authors into a training set comprising 17,221 images (80% of the total dataset) and a testing set comprising 4306 images (20%). The training set was further split into five folds for cross-validation, facilitating our proposed Bayesian hyperparameter optimization process. After training the models with the optimized parameters, their final performance is evaluated using the testing set.

Figure 2: D-Fire dataset for fire and smoke detection. (a) Sample images from the D-Fire dataset, demonstrating variation in resolution, lighting conditions, and sharpness. Bounding box sizes also exhibit significant variability; (b) Statistics of the D-Fire database by image category and bounding box classes
Dataset characteristics: The D-Fire dataset contains a diverse collection of fire/smoke images, exhibiting variations in resolution, lighting conditions, sharpness, surrounding environments, and bounding box sizes, as illustrated by sample images in Fig. 2a. However, this dataset lacks statistical summary regarding fire/smoke conditions, such as whether incidents occurred in indoor, outdoor, urban, or rural environments. To further characterize the dataset, we utilized FiftyOne [21] to evaluate thematic patterns in fire and smoke conditions based on image uniqueness. A quick analysis was conducted by examining samples in the dataset at different levels of uniqueness computed by [21]. The analysis revealed that most images depict outdoor scenes, primarily in mountainous, forested, or grassland regions, with urban settings being less prevalent. Additionally, fire and smoke are often observed at significant distances from the camera. A limitation of this dataset is the scarcity of indoor images. Regarding temporal distribution, daytime images dominate, followed by nighttime images, with a minor fraction captured during pre-evening hours.
Dataset selection: Previous datasets employed in YOLO-based fire and smoke detection studies have been characterized by being either large but not publicly accessible [22], small in scale [17], or lacking diversity in fire and smoke conditions [23]. In this study, we selected the D-Fire dataset due to its extensive image collection, predefined train-validation-test partitioning, and strong resemblance to real-world surveillance footage. Its high proportion of outdoor images, particularly those captured from a distance, makes it well-suited for developing fire/smoke detection models for public safety applications.
2.2 Optuna Framework for Hyperparameter Optimization
The performance of DL models is significantly influenced by hyperparameters such as the learning rate and the configuration values of optimizers [24]. A review paper [25] presents several methods for optimizing hyperparameters, including grid search, random search, and Bayesian optimization, providing foundational context for our approach. Although grid search and random search are straightforward to implement, they can be computationally expensive. In contrast, Bayesian optimization [25] is regarded as more efficient, requiring fewer evaluations to identify a suitable set of hyperparameters.
The Optuna framework [20] is a popular tool for hyperparameter optimization that provides an easy-to-use programming interface in Python. It allows for simple parallelization and supports various optimization algorithms. Optuna has demonstrated good performance in hyperparameter optimization tasks, as highlighted in [26]. The general workflow of Optuna is as follows:
1. Define the Search Space: Specify the hyperparameters to optimize and their respective search ranges.
2. Define the Objective Function: Formulate the function to be optimized (e.g., maximize mAP50 of a YOLO model).
3. Run the Optimization Trials: Each trial involves executing the objective function with a specific set of hyperparameters. The next set of hyperparameters is determined based on the results of previous trials using a sampler, which implements an optimization algorithm (e.g., random search).
4. Select the Best Hyperparameters: After all trials are completed, the optimal set of hyperparameters are those that yield the best value for the objective function.
Optuna provides various samplers that correspond to different optimization algorithms. Common samplers include GridSampler, RandomSampler, and TPESampler, which implement grid search, random search, and Tree-structured Parzen Estimator (TPE) [27], respectively.
2.3 YOLO-Based Fire and Smoke Detection
Numerous studies have explored YOLO architectures for fire and smoke detection, primarily focusing on architectural modifications while often neglecting hyperparameter optimization. For instance, the work [17] proposed modifications to YOLOv8 by incorporating an advanced attention mechanism to enhance detection performance but relied on manually selected hyperparameters, which may not be optimal. Additionally, their used dataset is not publicly available and contains only
A few studies have conducted hyperparameter optimization for YOLO models. The authors in [19] conducted hyperparameter tuning for YOLOv5 models on the D-Fire dataset [16], however they only used a simple grid search strategy for selecting the best hyperparameters. In contrast, the study by [29] optimized YOLOv8 hyperparameters using a more sophisticated hyperparameter tuning called one-factor-at-a-time (OFAT) approach, but this study tested with a publicly available dataset containing only 10,000 images, significantly fewer than the D-Fire dataset utilized in this research.
Overall, research on YOLO-based fire and smoke detection has primarily emphasized architectural modifications, with limited attention to hyperparameter optimization and a lack of performance evaluations across multiple YOLOv8 and YOLOv10 variants on large-scale, publicly available datasets. Our study aims to address these gaps by proposing an advanced hyperparameter optimization technique, Bayesian tuning, to improve the performance of both small and large variants of YOLOv8 and YOLOv10. Additionally, we provide a comprehensive performance comparison of these models using the D-Fire dataset, offering insights into their effectiveness for fire and smoke detection.
3 Proposed Method for Hyperparameter Tuning
This study focuses on optimizing training hyperparameters to enhance the performance of YOLO models (YOLOv8 and YOLOv10) for the fire/smoke detection task. The Optuna framework [20] is employed to perform Bayesian hyperparameter optimization. The study workflow, illustrated in Fig. 3, employs 5-fold cross-validation on the D-Fire dataset training set [16] to identify optimal hyperparameters that maximize the average mAP across folds (see Section 3.2). These parameters are then applied to train each model on the full training set, while model performance is assessed using the test set.
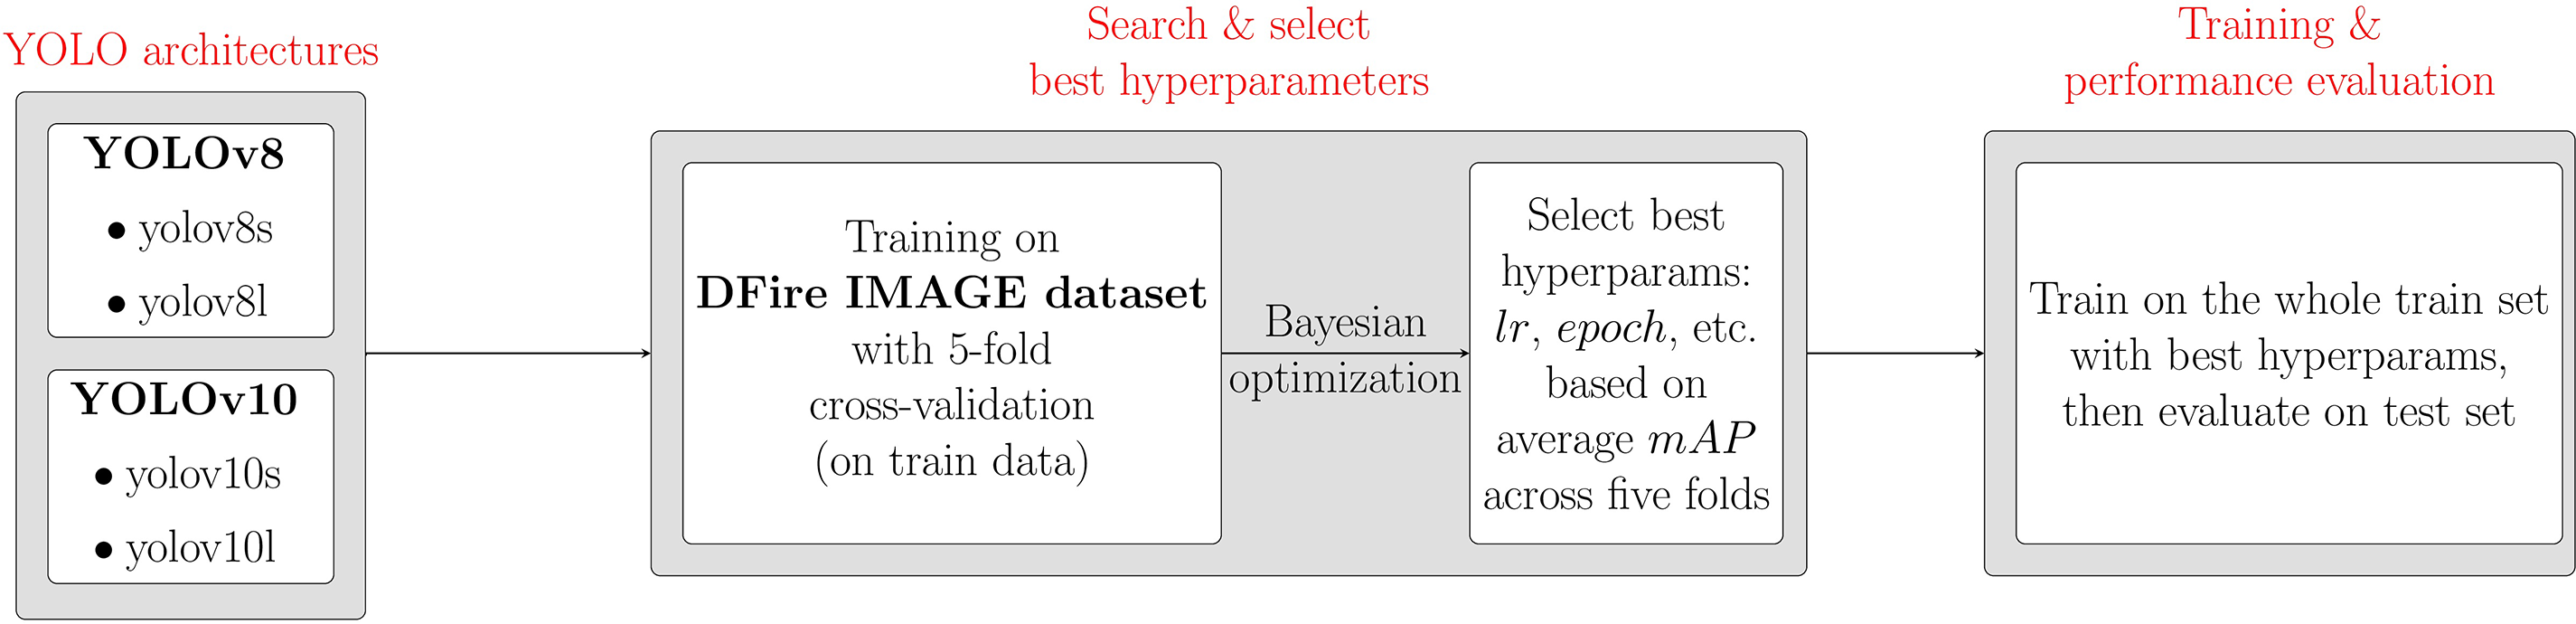
Figure 3: Workflow of this paper
3.1 YOLO Models Used in This Study
As mentioned in Section 1, YOLO-based object detectors have evolved through multiple versions. In this study, we focus on two more recent versions of YOLO: YOLOv8 [13] and YOLOv10 [14]. These YOLO versions are developed based on the YOLO Ultralytics framework [13], which offers ease of use through a simple user interface, demonstrating good speed and accuracy. The framework facilitates the training, exporting, and deployment of models across various environments and provides multiple model variants with the trade-off between speed and accuracy. This section presents an overview of the key architectural features of YOLOv8 and YOLOv10, along with their model variants to contextualize our study. Detailed information on YOLOv8 and YOLOv10 can be found in the original publications [13,14].
The network architecture of YOLOv8 [13] (Fig. 4a) incorporates several significant changes, including the replacement of the C3 module from YOLOv5 [12] with the new C2f module. Additionally, modifications to the kernel sizes in the backbone and bottleneck layers have been implemented. A key innovation is the introduction of a decoupled head with an anchor-free mechanism, which enhances both detection speed and accuracy.
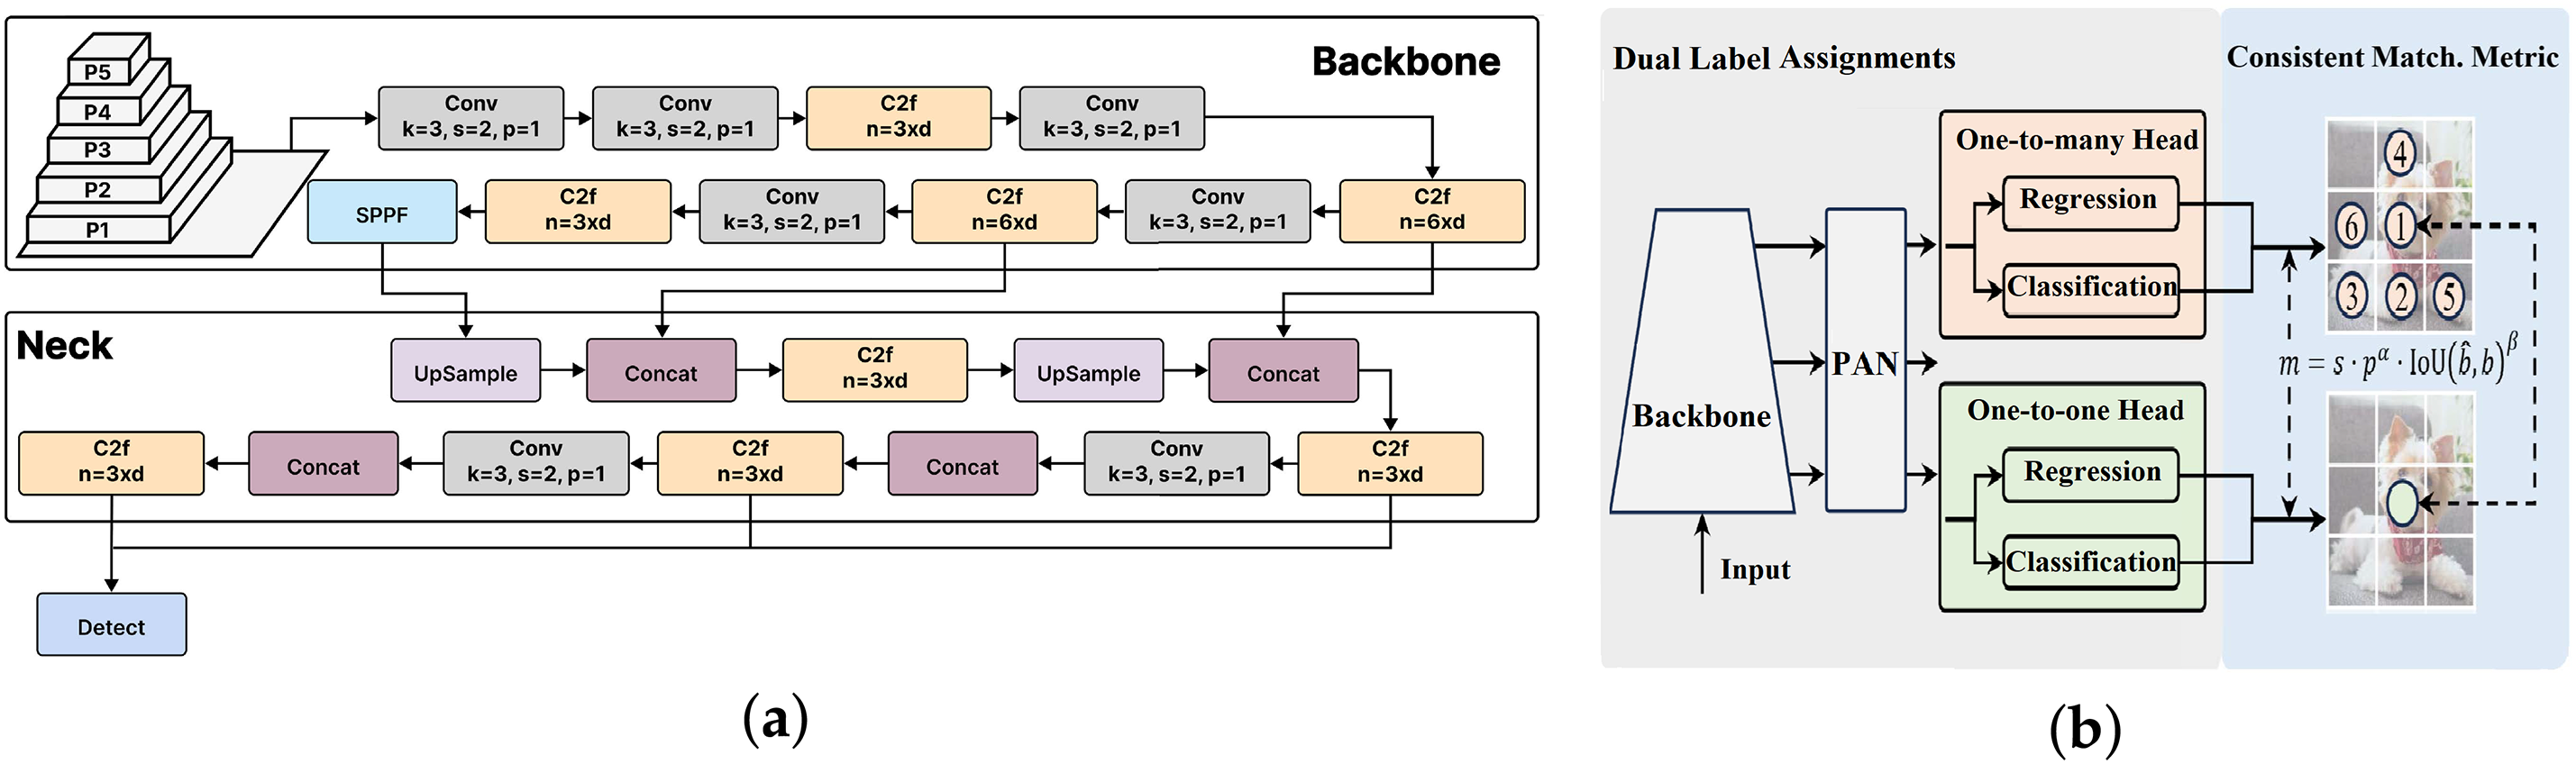
Figure 4: YOLO architectures used in this study. (a) YOLOv8 architecture (reproduced from [30] under the CC BY-NC-ND 4.0 license); (b) YOLOv10 architecture with Dual Label Assignments (adapted from [14] under the CC BY 4.0 license)
YOLOv8 provides five model variants, including YOLOv8n (nano), YOLOv8s (small), YOLOv8m (medium), YOLOv8l (large), and YOLOv8x (extra large), offering a range of options based on computational efficiency and performance requirements. In this paper, we utilize the YOLOv8s and YOLOv8l models for experimentation, as they represent two distinct categories: a smaller and faster model with reduced accuracy (YOLOv8s), and a larger and more accurate model with slower processing speed (YOLOv8l).
In May 2024, YOLOv10 [14] was introduced as an updated version of YOLO, developed by a research team at Tsinghua University and based on the Ultralytics framework [13]. The authors aimed to enhance speed and accuracy through two key implementations: 1) NMS (Non-Maximum Suppression)-Free training utilizes Dual Label Assignments with an additional one-to-one head alongside the traditional one-to-many head (as shown in Fig. 4b), eliminating the NMS post-processing step and increasing processing speed and 2) an efficiency-accuracy driven model design that features lightweight classification heads, decoupled downsampling strategies, and a rank-guided block design to reduce layer redundancy [31]. Additionally, YOLOv10 employs larger convolution filters for improved context capture and a partial self-attention mechanism to reduce complexity.
Similar to YOLOv8, YOLOv10 presents multiple model variants: YOLOv10n (nano), YOLOv10s (small), YOLOv10m (medium), YOLOv10b (balanced), YOLOv10l (large), and YOLOv10x (extra large). For this study, YOLOv10s was selected to represent the small and fast model, which is less accurate, while YOLOv10l was chosen to represent the large and accurate model, although it operates at a slower speed.
As shown in Fig. 1, YOLOv10 outperforms YOLOv8 on the COCO dataset [15] in terms of mAP50-95, with fewer parameters and lower GFLOPs. However, its performance advantage over YOLOv8 for fire and smoke detection remains unclear. One objective of this study is to address this gap by comparing the performance of YOLOv8 and YOLOv10 on the D-Fire dataset [16].
In this study, we employ common evaluation metrics for object detection, including Precision (P), Recall (R), F1-score, and Mean Average Precision (mAP) for performance assessment. P measures the proportion of correctly predicted positive instances among all predicted positives, while R evaluates the proportion of true positives relative to all actual positives in the ground truth. The F1-score provides a balance between P and R by computing their harmonic mean. The formulas for P, R, and
where TP, FP and FN represent true positive, false positive and false negative, respectively.
The primary evaluation metric used in this study is mAP [32]. Initially, Average Precision (AP) is computed for each class as the area under the precision-recall curve, as described in [32]. In the computation of AP, a specific threshold for Intersection over Union (IoU) is established (e.g., 0.25, 0.5, 0.75) to categorize predictions into true positives, false positives, and false negatives. In this context, IoU acts as a metric for assessing the accuracy of predicted bounding boxes in relation to the ground truth bounding box, as defined in Eq. (2):
where
Subsequently, the mAP (at a specified IoU threshold) is calculated as the mean of AP across all classes
For the assessment of computational costs, we use Floating Point Operations (FLOPs) to quantify the number of floating-point operations required for model execution. Specifically, we express the computational cost in terms of Giga Floating Point Operations (GFLOPs), representing billions of FLOPs. An increase in GFLOPs indicates a higher computational cost, while a decrease suggests lower computational demand.
3.3 Practical Bayesian Hyperparameter Tuning Using Optuna
Our proposed tuning process follows the general workflow of the Optuna framework, as described in Section 2.2. At the core of our approach, the Tree-structured Parzen Estimator (TPE) algorithm [27] is employed as the sampler for hyperparameter optimization. The TPE method is a widely recognized Bayesian optimization method designed to enhance the efficiency of hyperparameter searches [33]. During the optimization process utilizing the TPE sampler, for each parameter in each trial, a set of candidate values for each parameter is derived based on the results of previous trials. These values are then modeled with two Gaussian Mixture Models (GMMs)
• GMM
• GMM
The next hyperparameter value is selected to maximize the ratio
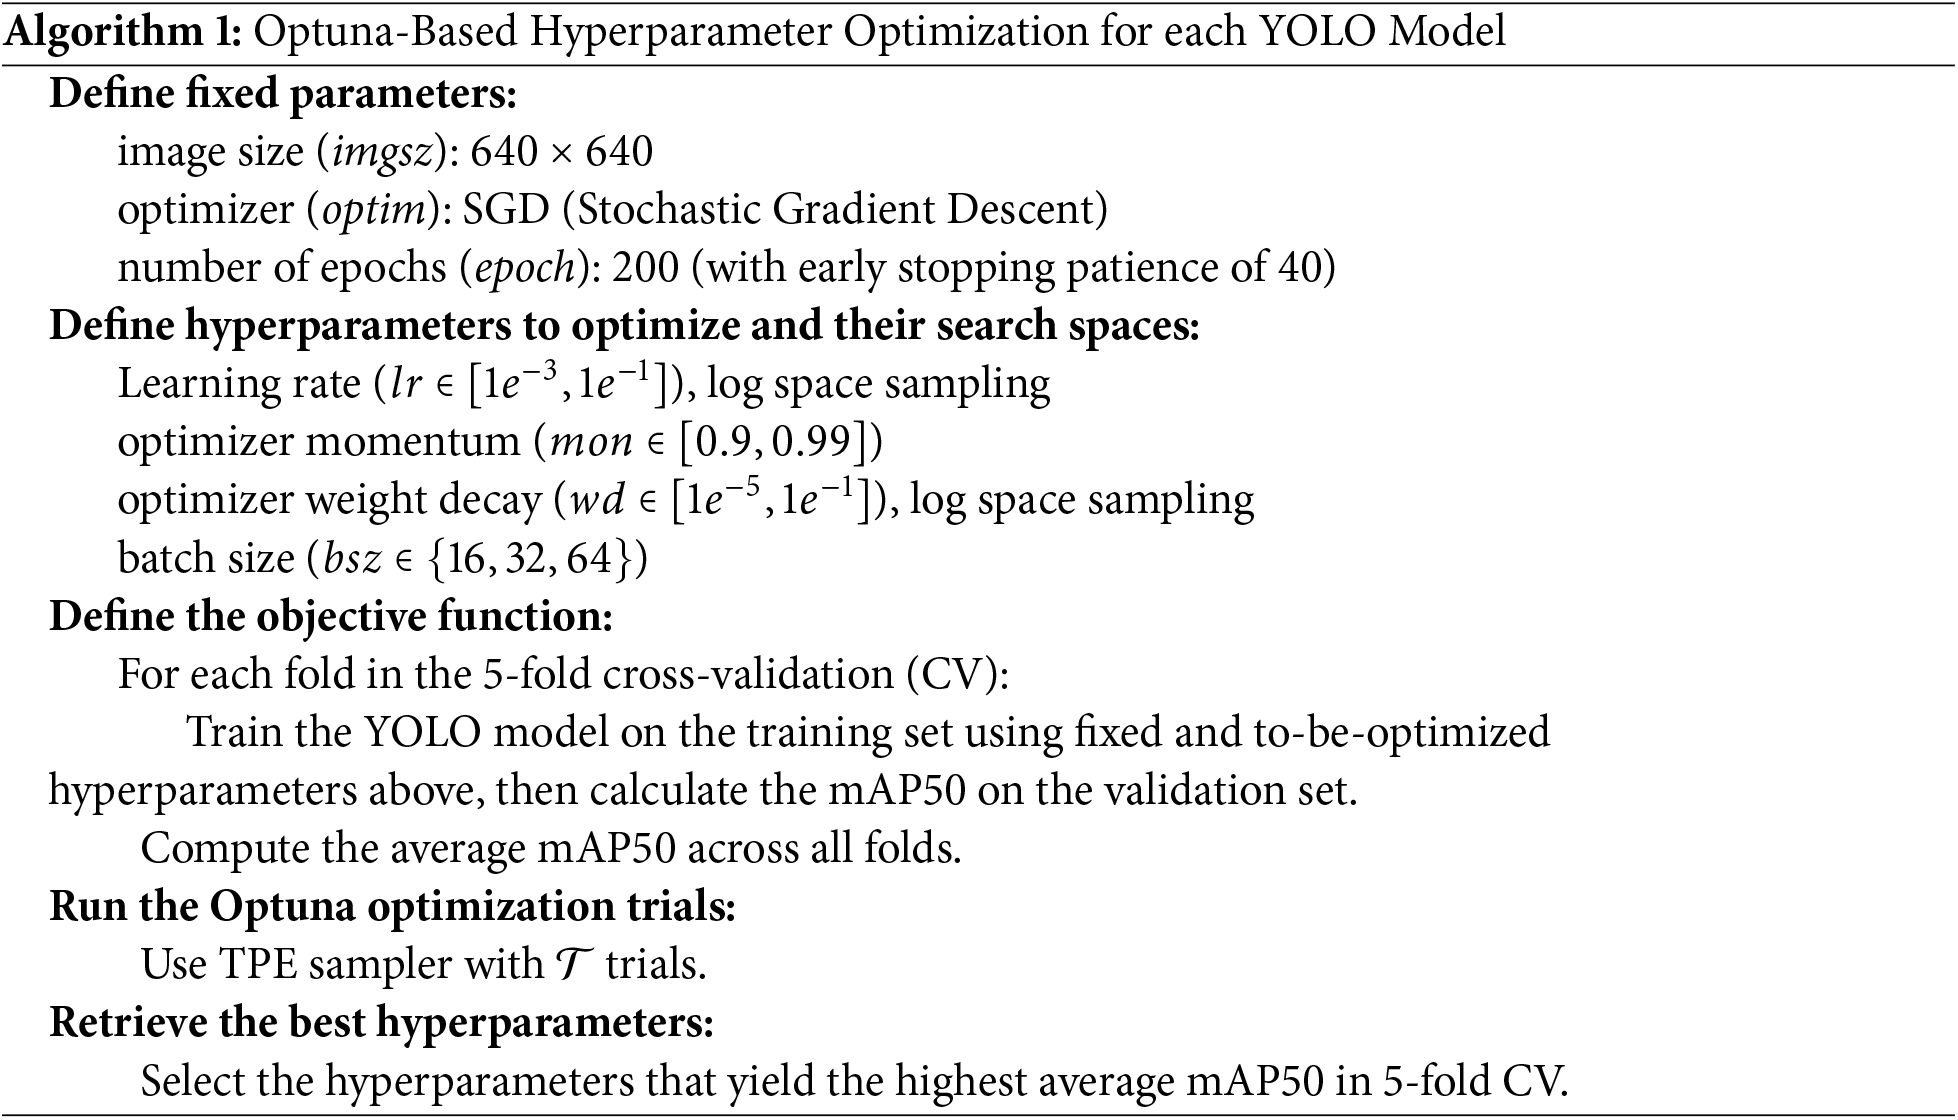
Algorithm 1 outlines the proposed hyperparameter optimization protocol, while Fig. 5 provides the flowchart of this procedure as implemented using the Optuna framework. Due to constraints related to computational resources and time, particularly when conducting 5-fold cross-validation on DL models, we held a specific set of parameters constant during the optimization process. The parameters fixed included:
• Image size (
• Optimizer (
• Training epochs (
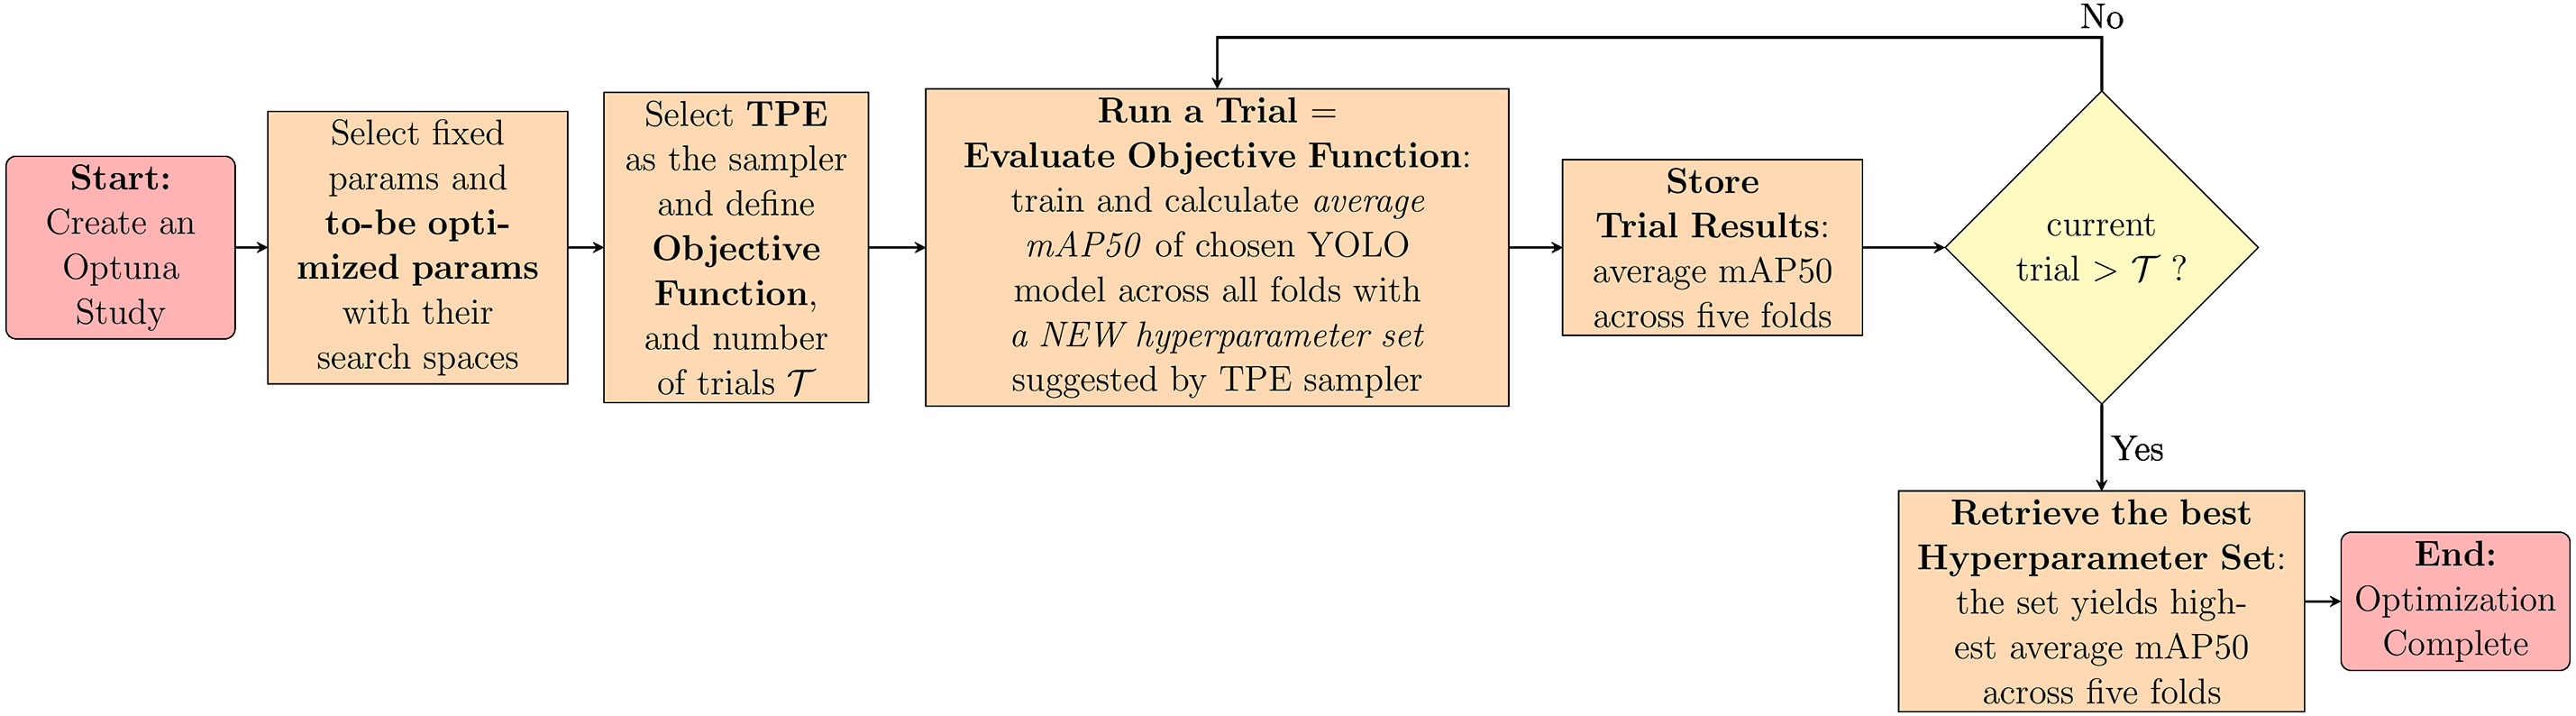
Figure 5: Flowchart illustrating the implementation of Algorithm 1 using the Optuna framework for hyperparameter optimization, with the objective of maximizing the average mAP50 over 5-fold cross-validation
The search for optimized hyperparameters was conducted within well-defined search spaces, which included:
• The learning rate (
• Momentum (
• Weight decay (
• Batch size (
The objective of this tuning step was to identify a set of hyperparameters that maximizes the average mAP50 across a 5-fold cross-validation on the D-Fire image dataset for each experimental YOLO model, specifically YOLOv8s, YOLOv8l, YOLOv10s, and YOLOv10l by systematically exploring the defined hyperparameter space using the TPE algorithm.
The experiments were conducted using a Windows 10 Pro 22H2 operating system with 64 GB of RAM and two NVIDIA GeForce RTX 3090 GPUs, each with 24 GB of VRAM. The NVIDIA CUDA Toolkit version 11.8 was used in conjunction with PyTorch 2.1.0 for training YOLO models. Pretrained weights for the YOLOv8 and YOLOv10 models from the Ultralytics framework [13] served as initial weights during the hyperparameter tuning and final training processes. The hyperparameter optimization process was performed using Optuna 3.6.1 [20] on the D-Fire training set, which is divided into five folds as described in Section 2.1. This process follows the procedure outlined in Algorithm 1 in Section 3.3, with a total of 20 trials (
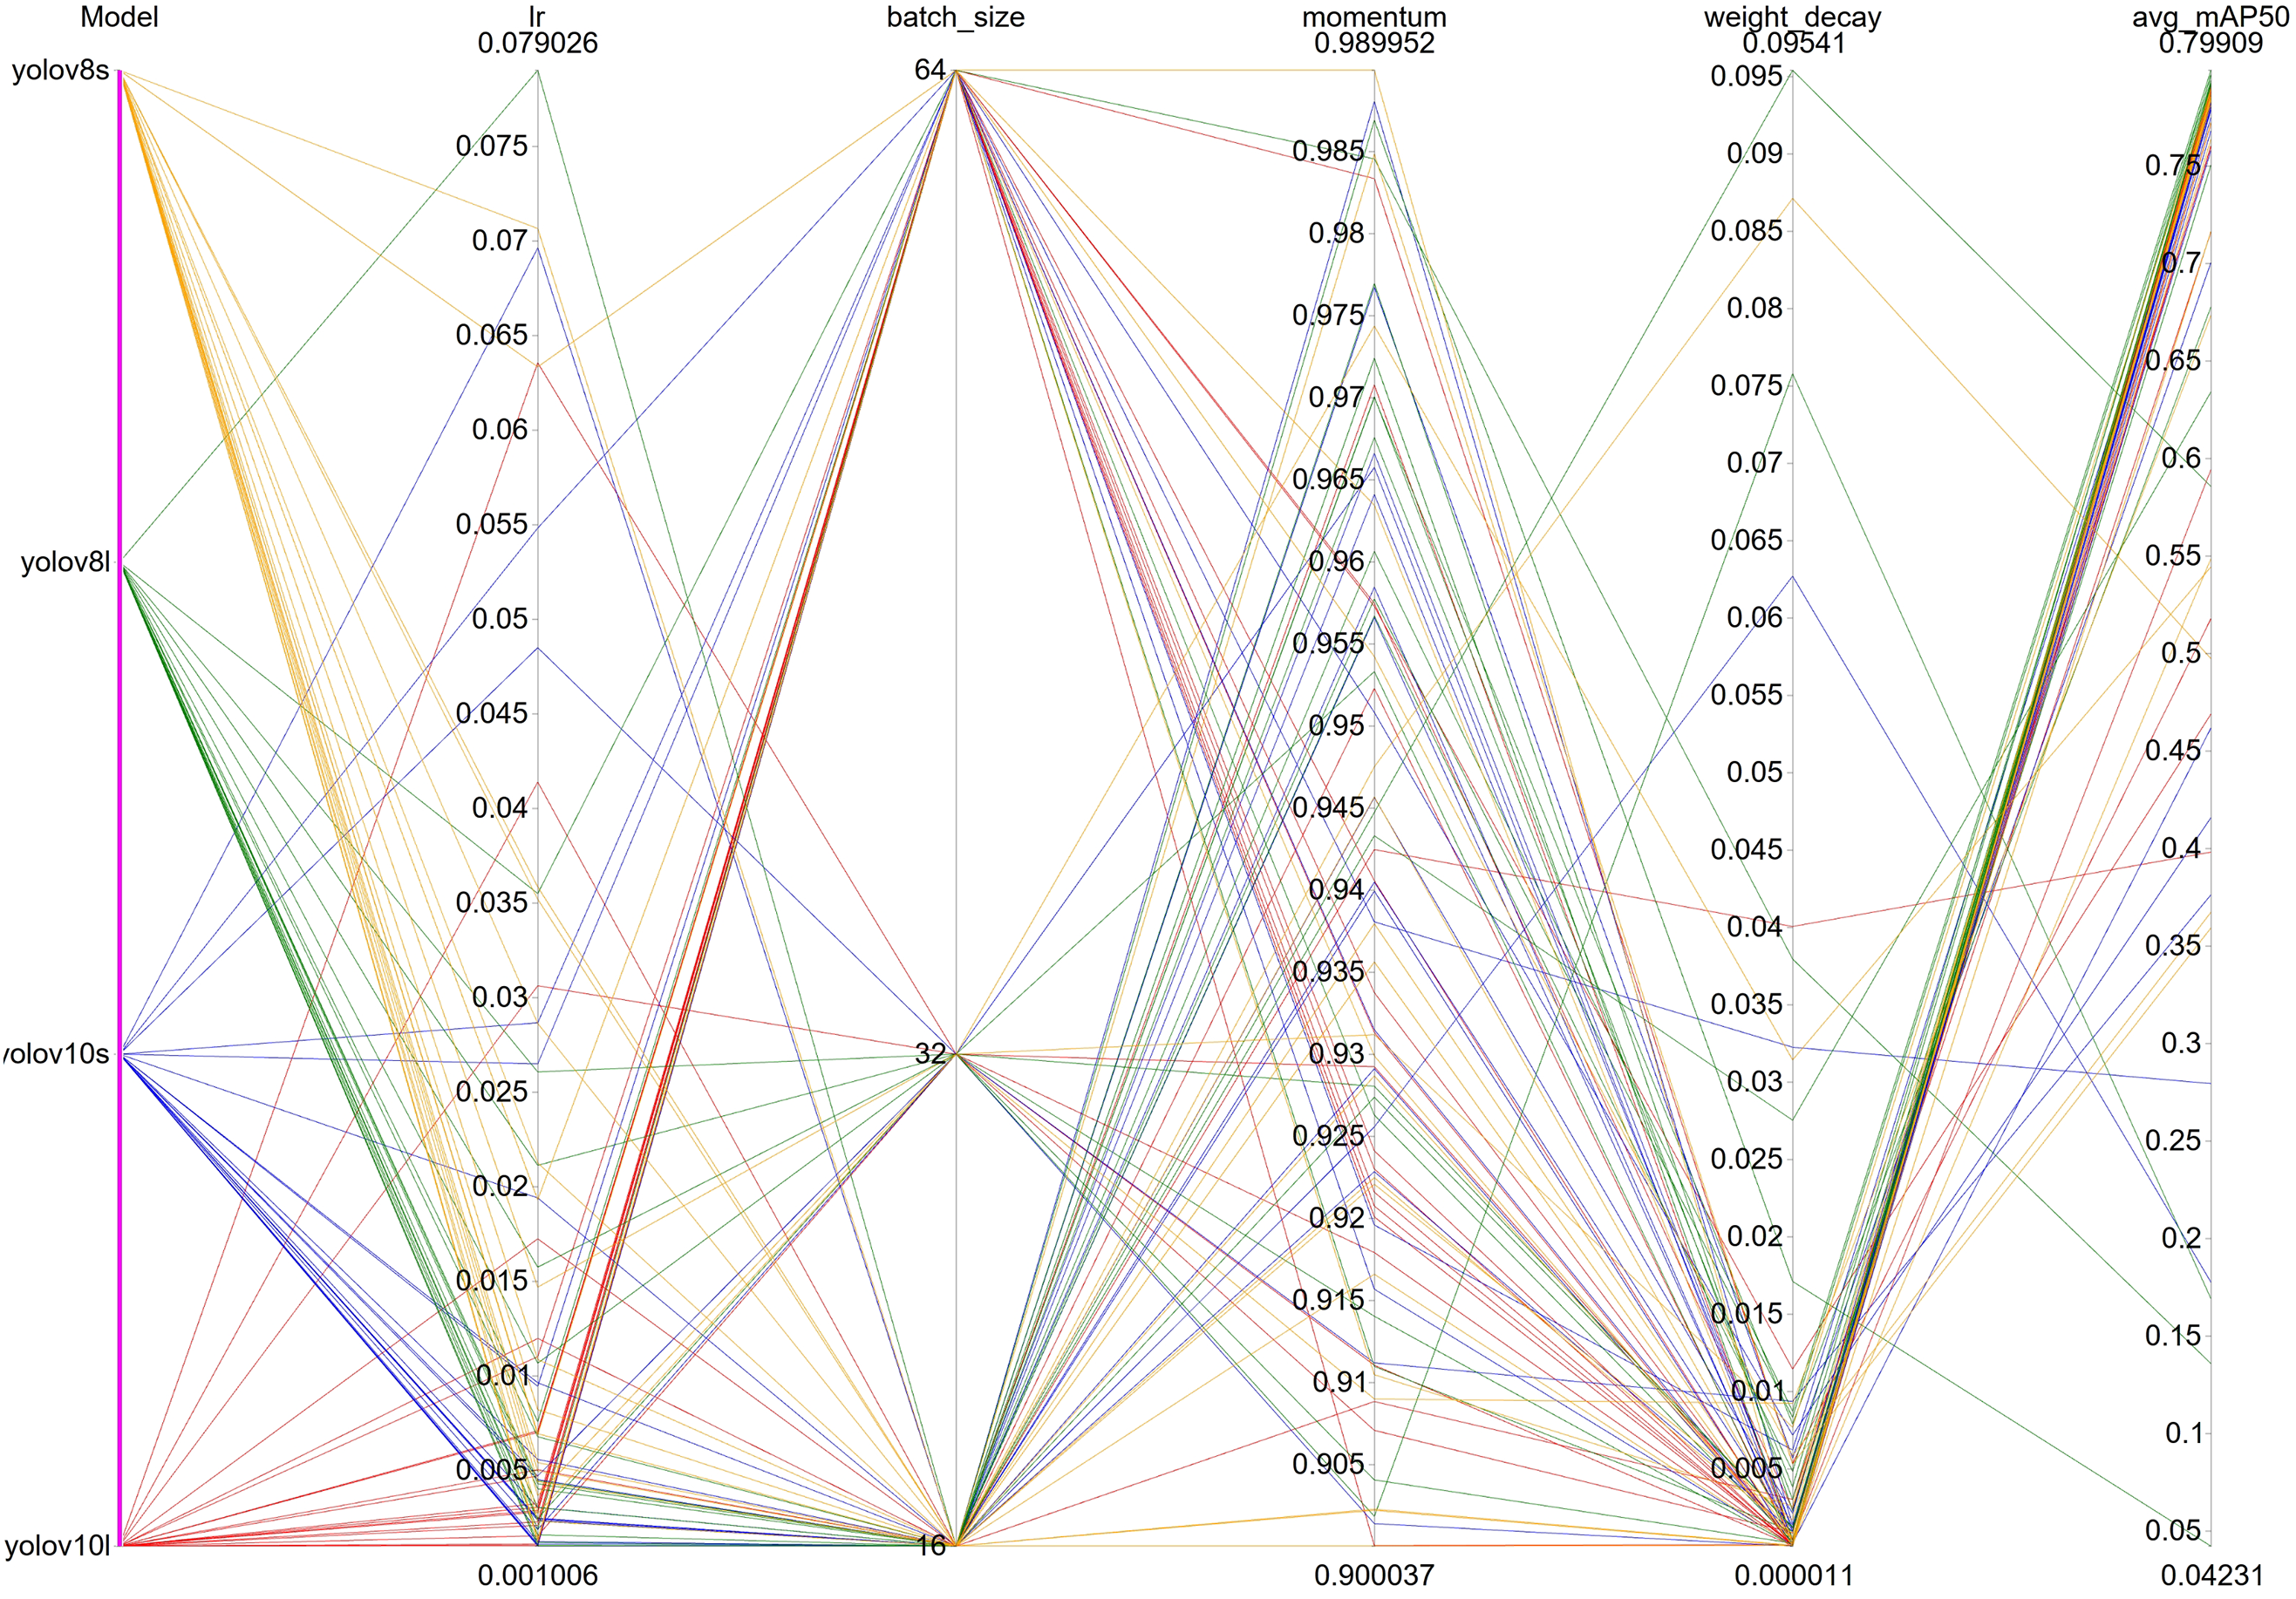
Figure 6: The parallel coordinate plot illustrates the interrelationships among the tuning hyperparameters across all Optuna trials for each YOLO model

As shown in Table 1, despite YOLOv10 being the later version, YOLOv8 models tend to excel in fire and smoke detection tasks within the D-Fire dataset. This observation may seem counterintuitive, given that YOLOv10 achieves higher mAP scores on the COCO dataset, as illustrated in Fig. 1. However, model performance is inherently dataset-dependent; a model may excel in one dataset while underperforming in another. The superior performance of YOLOv8 over YOLOv10 in fire and smoke detection was exhibited in other studies [18,38]. The study [18] found that YOLOv8n outperforms YOLOv10n in terms of mAP50 in the D-Fire dataset. Similarly, in the work [38], YOLOv8s surpasses YOLOv10s in mAP50 and mAP50-95.
Preliminary tuning results suggest that YOLOv8 models may outperform their YOLOv10 counterparts; however, definitive performance evaluation requires testing on the test set. Therefore, using the optimal hyperparameter sets for each model, all YOLO variants (YOLOv8s, YOLOv8l, YOLOv10s, and YOLOv10l) were trained five times on the complete D-Fire image dataset and subsequently evaluated on the test set. The average performance metrics from these five training sessions are presented in Table 2.

For comparative purposes, we also included performance metrics from other studies on the D-Fire dataset [18,19,39,40], as it is essential to evaluate the models’ performances on the same large-scale dataset. Note that Table 2 presents the performance of YOLO models under different hyperparameter selection methods. These methods include:
• Grid search (GS): Exhaustive search over a predefined set of hyperparameters.
• Manual selection (MS): Manual selection of hyperparameters based on prior knowledge or experience.
• Ultralytics default (UD): Default hyperparameters provided by the Ultralytics framework [13].
• Bayesian tuning (BT): Our proposed method.
Comparison Rules and Significance Test: To compare our work with existing studies, we utilize mean values for each metric due to the unavailability of the data required for conducting significance tests. To assess the performance of YOLOv8 and YOLOv10 models under different hyperparameter selection strategies, this study employs the Almost Stochastic Order (ASO) test, a statistical significance test originally proposed by [41] and reimplemented by [42] for enhanced usability. ASO is suitable for comparing the performance metrics of two models across multiple runs on the same test set. The test takes as input two lists of metric
Comparison across YOLO Versions: The results reveal consistent trends: YOLOv8 and YOLOv10 models generally outperform their YOLOv5 counterparts and derivatives (e.g., GTP-YOLO backbone) in terms of mAP50. For instance, YOLOv8s (UD) achieved an mAP50 of 79.27, exceeding YOLOv5s (GS) at 78.15 and GTP-YOLO at 78.20. Interestingly, YOLOv5l (GS) achieved the highest F1-score (0.78), with a marginal difference compared to other models (0.76–0.77).
Furthermore, Table 3, validated by the ASO test, confirms the findings from Table 1, indicating that YOLOv8 models consistently outperform their YOLOv10 counterparts in terms of mAP50 under identical hyperparameter selection strategies. For instance, YOLOv8s (UD) achieved an mAP50 of 79.27, exceeding YOLOv10s (UD) at 79.06. Similarly, YOLOv8l (BT) attained an mAP50 of 80.48, surpassing YOLOv10l (BT) by 0.65.

Performance Comparison between Model Variants: Larger models within the same YOLO version (L variants) generally outperform their smaller counterparts (S variants) regarding mAP50 and F1-score, as expected due to their higher number of parameters enabling better handling of complex scenarios. For instance, YOLOv8l (UD) achieved the mAP50 of 79.64 compared to YOLOv8s (UD) at 79.27, representing an improvement of 0.37 (ASO test = 0.0085). Similarly, when considering models using Bayesian Tuning, YOLOv10l (BT) got 79.83 compared to YOLOv10s (BT) at 79.27, representing an improvement of 0.14 (ASO test = 0.07165). Furthermore, both YOLOv8l and YOLOv10l demonstrated higher F1-scores than their smaller counterparts (YOLOv8s and YOLOv10s) when using the same hyperparameter selection strategies, with a slight improvement of less than 0.01 (all ASO tests < 0.011).
Effectiveness of Bayesian Hyperparameter Tuning: Bayesian tuning (BT) demonstrated superior performance in terms of mAP50 compared to the MS and UD hyperparameter selection strategies, particularly for larger models. This finding is statistically confirmed by the results presented in Table 4.
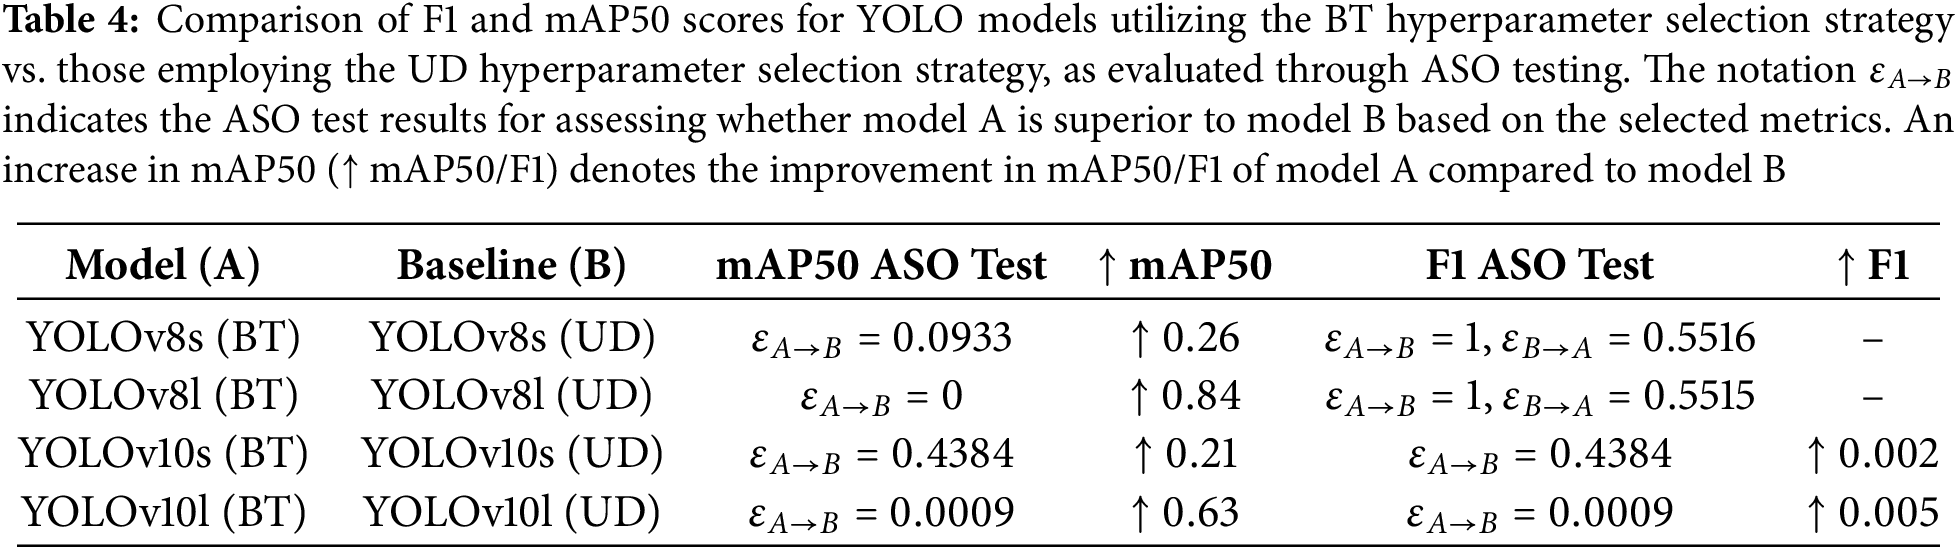
For instance, YOLOv8s (BT) achieved an mAP50 of 79.53, outperforming YOLOv8s (MS) at 78.70 and YOLOv8s (UD) at 79.27. Similarly, YOLOv8l (BT) reached a mAP50 of 80.48, representing an improvement of 0.84 over YOLOv8l (UD) at 79.64. Larger models showed more significant gains, with YOLOv8l (BT) and YOLOv10l (BT) achieving improvements of 0.84 and 0.63, respectively, compared to their UD counterparts. Smaller models, such as YOLOv8s (BT) and YOLOv10s (BT), also demonstrated improvements, with mAP50 increases of 0.26 and 0.21, respectively, although these gains were less substantial. These results demonstrate the effectiveness of Bayesian tuning, particularly for optimizing larger models. Besides, the BT approach led to a trade-off between precision and recall. For example, in the case of YOLOv8l (BT) compared to YOLOv8l (UD), precision improved while recall slightly declined. Similarly, when comparing YOLOv10l (BT) with YOLOv10l (UD), precision decreased but recall increased. Despite these variations, the F1-score exhibited only marginal changes, remaining nearly constant across both the Bayesian tuning (BT) and uniform distribution (UD) hyperparameter selection strategies.
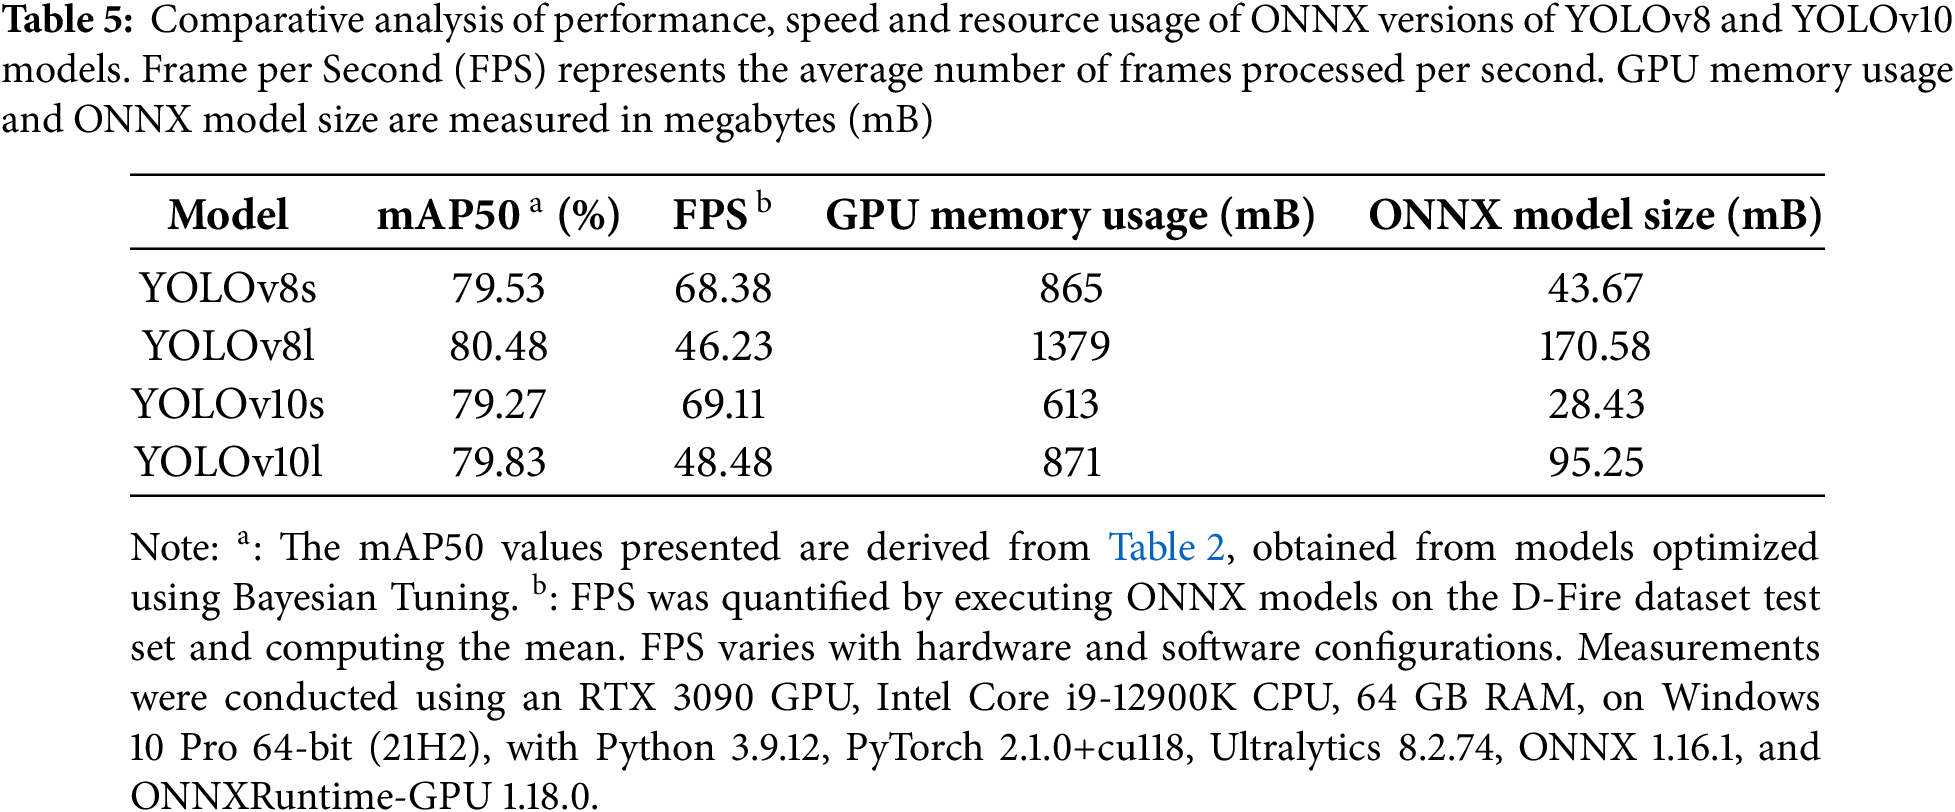
Trade Off between Detection Speed and Accuracy: As mentioned before, larger models (L variants) give better performance but come with a higher computational cost compared to smaller models (S variants). For instance, YOLOv8l (UD) achieved an mAP50 of 79.64, exceeding YOLOv8s (UD) at 79.27 by 0.37, while requiring 126.30 GFLOPs–nearly six times the computational cost of YOLOv8s (UD) at 28.40 GFLOPs. This trade-off between performance and computational cost is a key consideration when selecting a model for real-world application deployment. To gain a deeper understanding of this trade-off, we assessed the performance metrics, inference speeds, model sizes, and GPU memory utilization of YOLOv8 and YOLOv10 models, as presented in Table 5. The trained models were converted to the Open Neural Network Exchange (ONNX) format–a standard for model deployment, then evaluated on an NVIDIA RTX 3090 GPU. As shown in Table 5, larger models (YOLOv8s, YOLOv10s) achieve higher performance but experience a reduction of over 40% in inference speed compared to smaller models (YOLOv8l, YOLOv10l). Additionally, larger models require significantly more disk storage, which may pose challenges for deployment on edge devices with limited storage capacity. Notably, YOLOv10 models achieve marginally higher inference speeds than their YOLOv8 counterparts while also reducing GPU memory consumption. The choice of model depends on the specific application requirements, including detection accuracy and available computational resources.
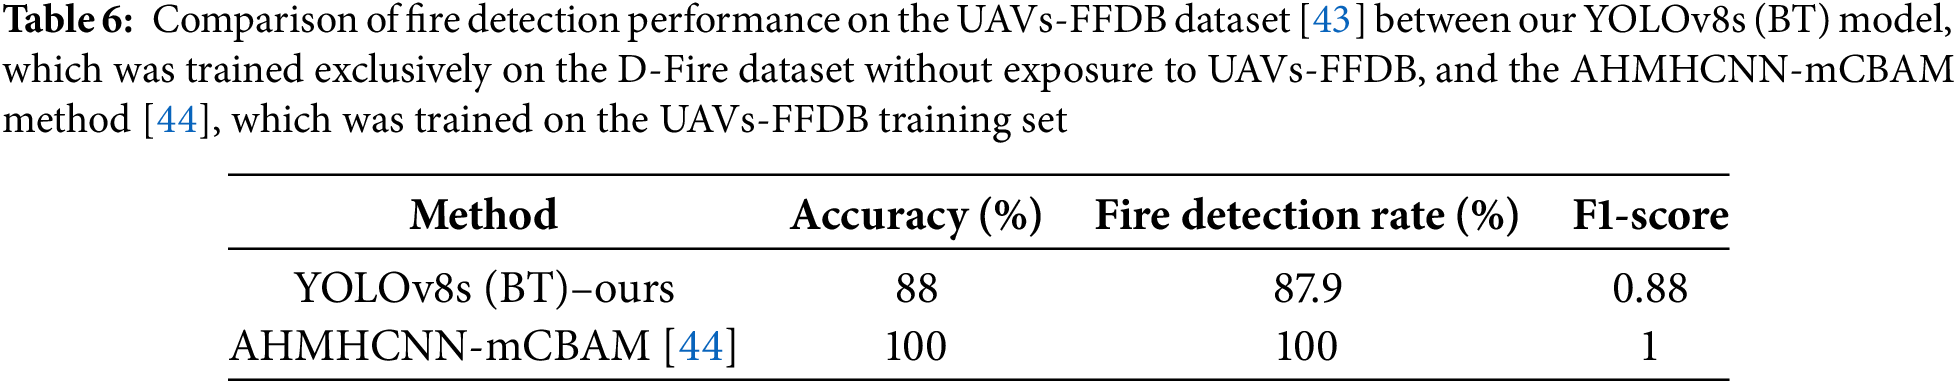
Generalization Capability: To assess the generalization capability of our trained models, we evaluate them on a dataset with different characteristics. Specifically, we utilize YOLOv8s (BT) trained on the D-Fire dataset and test it on the Unmanned Aerial Vehicles (UAVs)-based forest fire database (UAVs-FFDB) [43]. The D-Fire dataset primarily consists of outdoor images captured from a fixed camera viewpoint, whereas the UAVs-FFDB dataset contains images acquired from Unmanned Aerial Vehicles (UAVs) in forested areas, exhibiting a distinct data distribution. The UAVs-FFDB comprises 15,560 images categorized into four classes: Fire Incident in Evening, Fire Incident in Pre-Evening, Forest Evening without Fire, and Forest Pre-Evening without Fire. Following [44], we allocate 10% of the dataset for testing, resulting in 389 images per class. A new test set is constructed by merging images from the fire-related classes into a unified ”Fire” class and grouping the remaining classes into a “Non-Fire” category, resulting in 778 images per class.
Inference is performed using YOLOv8s (BT) on the new test set. An image is classified as ‘fire’ if at least one fire-class bounding box is detected; otherwise, it is categorized as ‘non-fire.’ The accuracy, Fire Detection Rate (FDR), and F1-score are computed as in [44]. The results are presented in Table 6. Our YOLOv8s (BT) achieves accuracy and FDR of approximately 90%, with an F1-score around 0.9. Although these metrics are lower than those reported in [44], they are nonetheless promising, given that our models were trained exclusively on the D-Fire dataset without exposure to the UAVs-FFDB. In contrast, the study in [44] utilized the UAVs-FFDB training set, comprising 80% of the total images. This highlights the model’s ability to generalize for fire detection in previously unseen environments.
Detection Visualizations: As shown in Table 2, YOLOv8 models outperform their YOLOv10 counterparts. Consequently, we focus our visual analysis exclusively on YOLOv8s and YOLOv8l to evaluate their effectiveness in fire and smoke detection. Specifically, we present the detection results of these models on some challenging scenes selected from the D-Fire image test set, as shown in Fig. 7. The first three rows display scenes that could be confused with fire or smoke; however, both YOLOv8s and YOLOv8l effectively ignore these, not predicting them as fire or smoke. The fourth row presents a low-resolution image of smoke situated far from the camera, which both models successfully detect, with YOLOv8l achieving a higher confidence score. The last two rows depict scenes containing smoke and multiple fire sources. The second last row indicates that YOLOv8l provides better predictions for fires. In the final row, YOLOv8s incorrectly identify the fire sources near a car as smoke, whereas YOLOv8l accurately detected these fire sources. However, both models mistakenly classified a distant yellow light, likely multiple incandescent streetlights from a city, as fire. These observations suggest that further improvements are needed to enhance the models’ performance across various scenarios.

Figure 7: Predictions of YOLOv8l on the D-Fire image test set, demonstrating its ability to ignore challenging scenes that could be confused with fire or smoke, such as sunsets and incandescent streetlights. Left column: the ground truth, middle column: YOLOv8s predictions; right column: YOLOv8l predictions
Detection Failure Analysis: As illustrated in Fig. 7, our trained YOLO models occasionally produce incorrect predictions. To investigate the underlying causes of these errors, we analyze two trained models, YOLOv8l and YOLOv10l, using the D-Fire test set. We identify failure cases and visualize the results using FiftyOne [21]. Our analysis focuses on two primary failure types: false positives (FP) and false negatives (FN). False positives occur when the model incorrectly detects fire or smoke, while false negatives arise when the model fails to detect actual fire or smoke. Representative failure cases are depicted in Fig. 8.
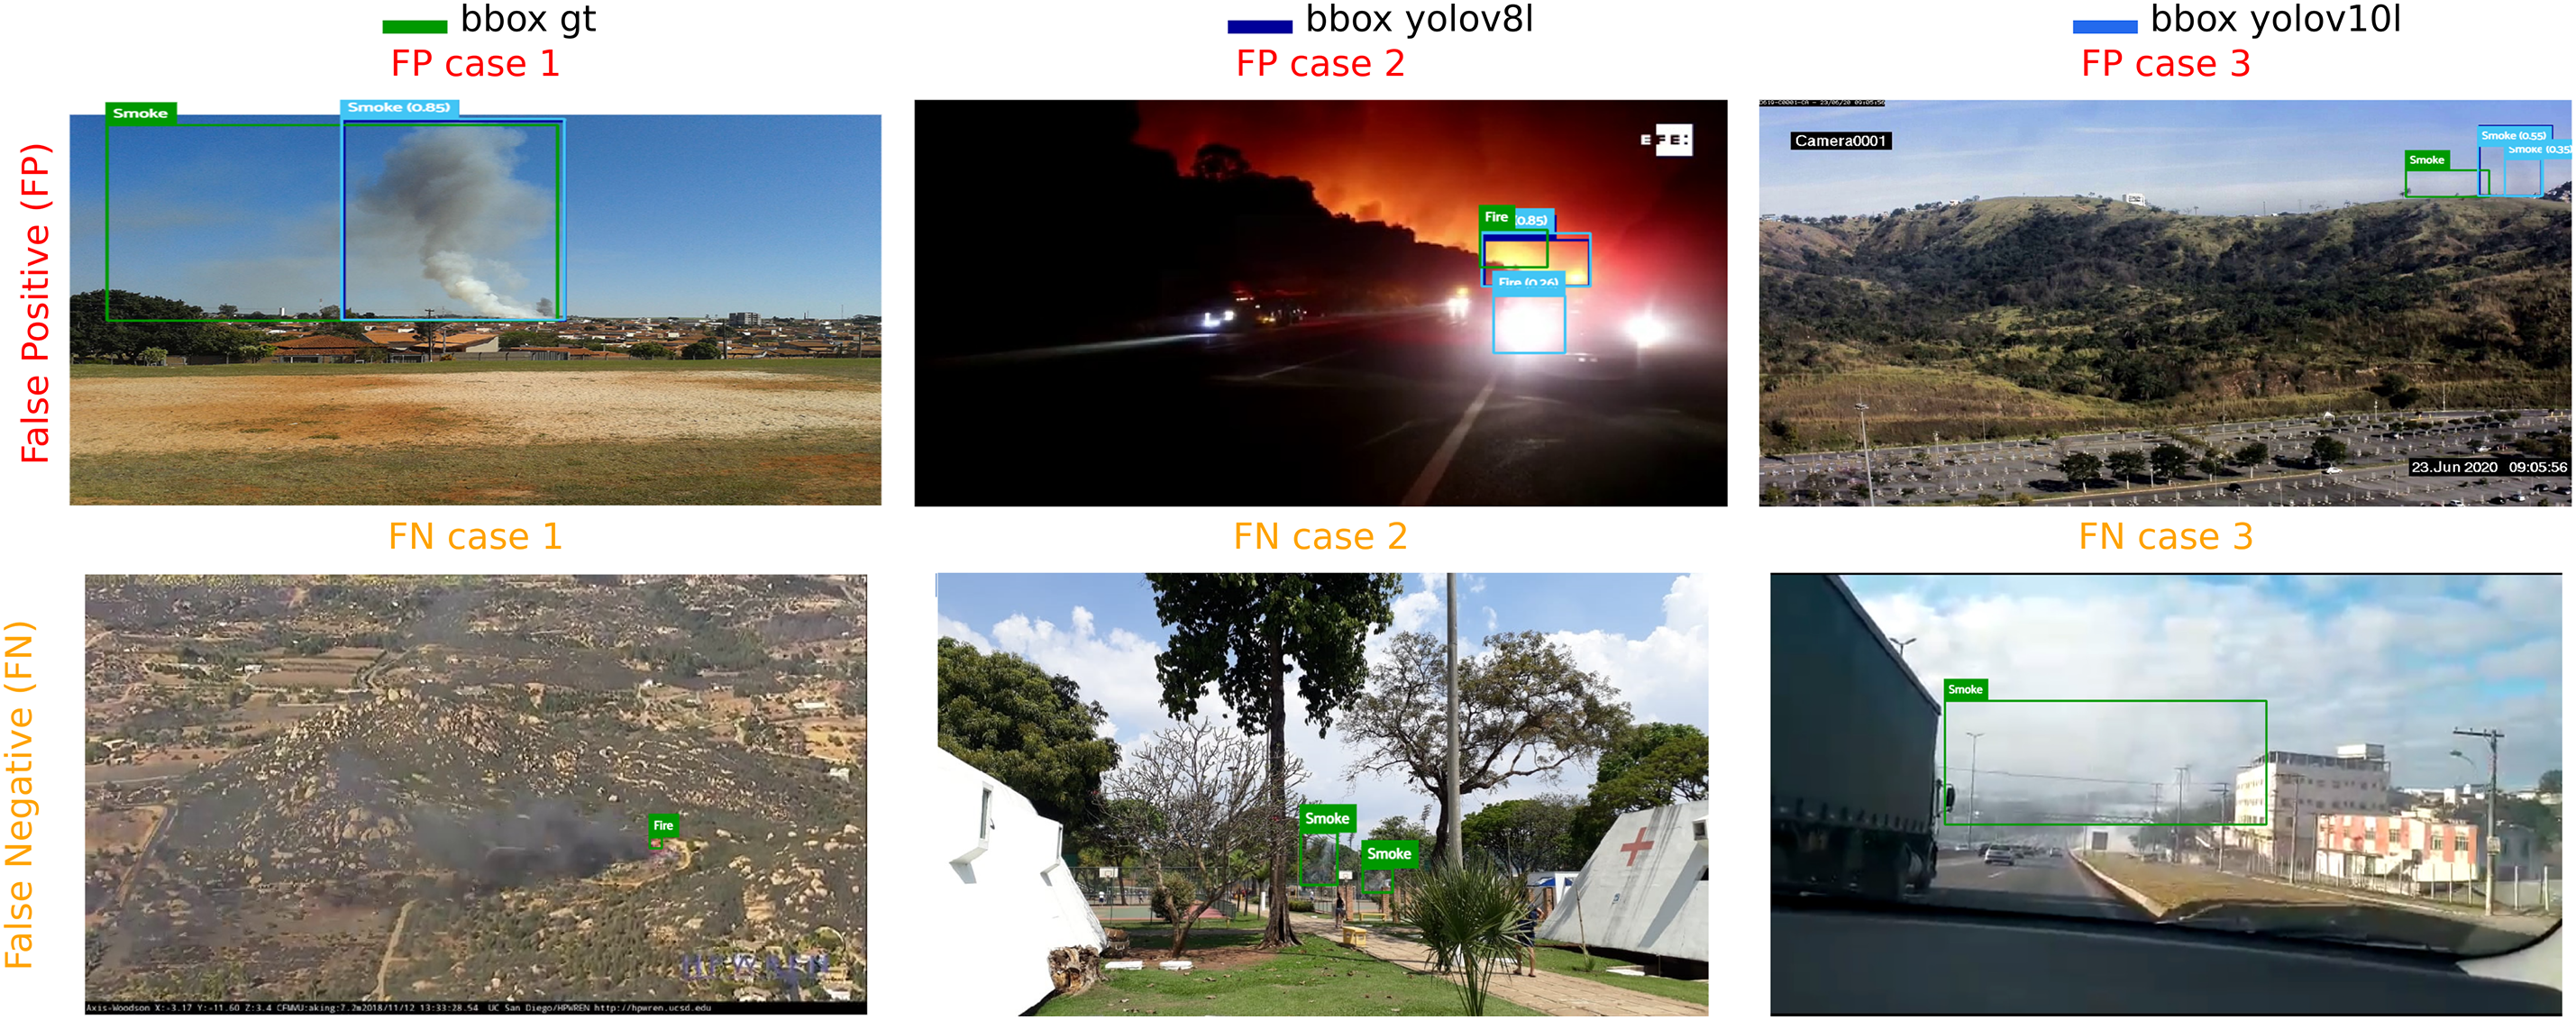
Figure 8: Representative failure cases of YOLOv8 and YOLOv10 models on the D-Fire dataset test set
False Positive Analysis: FP cases may result from localization errors or environmental complexities. In FP Case 1, both YOLOv8l and YOLOv10l detect smoke, but the predicted bounding box is significantly smaller than the ground truth. This discrepancy arises because smoke can gradually disperse over a large area with fading intensity, making accurate boundary prediction challenging. Environmental factors also contribute to false positives. In FP Case 2, intense car headlights near an actual fire region mislead the model, causing incorrect predictions. Similarly, in FP Case 3, distant areas with a certain level of gray coloration are mistakenly identified as smoke.
False Negative Analysis: FN cases often occur due to low image resolution or when the size of the fire/smoke is too small relative to the entire image. Again, complex environmental conditions can lead to false predictions. For example, in FN Case 2, two small smoke plumes are partially occluded by trees and blend into the background, making detection difficult. In FN Case 3, a large smoke area blends with the white sky, making it challenging for the model to detect.
To mitigate detection failures, potential strategies include enhancing the model’s architecture to better process complex scenes and developing larger, more diverse, and challenging training datasets. Further details on these strategies are discussed in Section 5 as future research directions.
This study proposes a Bayesian hyperparameter optimization method for selecting optimal training parameters for YOLOv8 and YOLOv10 models, employing the Optuna library for effective hyperparameter search. The models, trained with their optimal hyperparameters on the large-scale D-Fire dataset, demonstrated improved performance compared to configurations using manually selected or default hyperparameters. Our analysis demonstrates that YOLOv8 models outperform their YOLOv10 counterparts in fire and smoke detection.
However, the proposed approach has certain limitations. First, while the BT method effectively enhances YOLO model performance, it demands substantial computational resources and extensive time to optimize hyperparameters, particularly when employing 5-fold cross-validation. Additionally, this study did not include an ablation analysis to evaluate the impact of individual hyperparameters on model performance due to constraints in computational resources and time. Such an analysis could offer valuable insights into hyperparameter significance and inform future optimization strategies. Second, since the underlying architecture of the YOLO models remains unmodified, performance is inherently constrained by architectural limitations, such as difficulty in detecting small objects and complex scenes. Nevertheless, a key strength of the proposed hyperparameter tuning technique is its universality, allowing it to be applied across various YOLO model architectures.
As presented in Section 4, the best-performing YOLOv8 model (YOLOv8l) achieved an mAP50 of approximately 80%, indicating potential for further enhancement. Future improvements may be attained through architectural modifications and data augmentation, possibly in conjunction with hyperparameter tuning. Architectural enhancements could involve the integration of attention mechanisms and the design of specific layers to detect small objects, as suggested by [45]. Data augmentation is particularly promising, given that fire and smoke events are rare. Future research could explore the use of generative adversarial networks (GANs) [46] to produce synthetic fire and smoke images, as shown in [47], or incorporate adverse weather conditions–such as haze, fog, and nighttime settings–into the dataset, as demonstrated in [48], to increase its complexity and enhance model robustness.
Acknowledgement: We acknowledge the authors of the D-Fire Dataset for providing access to their dataset and for their assistance in clarifying dataset-related inquiries.
Funding Statement: This research was supported by the MSIT (Ministry of Science and ICT), Republic of Korea, under the ITRC (Information Technology Research Center) Support Program (IITP-2024-RS-2022-00156354) supervised by the IITP (Institute for Information & Communications Technology Planning & Evaluation). This work was also supported by the Technology Development Program (RS-2023-00264489) funded by the Ministry of SMEs and Startups (MSS, Republic of Korea).
Author Contributions: The authors confirm contribution to the paper as follows: Study conception and design: Van-Ha Hoang; Data curation: Van-Ha Hoang; Analysis and interpretation of results: Van-Ha Hoang, Jong Weon Lee, Chun-Su Park; Funding acquisition: Chun-Su Park, Jong Weon Lee; Writing—original draft preparation: Van-Ha Hoang; Writing—review and editing: Jong Weon Lee, Chun-Su Park. All authors reviewed the results and approved the final version of the manuscript.
Availability of Data and Materials: The data that support the findings of this study are openly available in gaiasd/DFireDataset: D-Fire: an image data set for fire and smoke detection at https://github.com/gaiasd/DFireDataset (accessed on 04 March 2025).
Ethics Approval: Not applicable.
Conflicts of Interest: The authors declare no conflicts of interest to report regarding the present study.
References
1. Fire loss in the United States—NFPA Research. [Internet]. [cited 2024 Oct 7]. Available from: https://www.nfpa.org/education-and-research/research/nfpa-research/fire-statistical-reports/fire-loss-in-the-united-states. [Google Scholar]
2. Annual area burnt per wildfire vs. number of fires, 2024. [Internet]. [cited 2024 Oct 7]. Available from: https://ourworldindata.org/grapher/annual-area-burnt-per-wildfire-vs-number-of-fires?tab=table. [Google Scholar]
3. Gaur A, Singh A, Kumar A, Kulkarni KS, Lala S, Kapoor K, et al. Fire sensing technologies: a review. IEEE Sensors J. 2019;19(9):3191–202. doi:10.1109/JSEN.2019.2894665. [Google Scholar] [CrossRef]
4. Foggia P, Saggese A, Vento M. Real-time fire detection for video-surveillance applications using a combination of experts based on color, shape, and motion. IEEE TRANS Circuits Syst Video Technol. 2015;25(9):1545–56. doi:10.1109/TCSVT.2015.2392531. [Google Scholar] [CrossRef]
5. Toulouse T, Rossi L, Celik T, Akhloufi M. Automatic fire pixel detection using image processing: a comparative analysis of rule-based and machine learning-based methods. Signal Image Video Process. 2016;10:647–54. doi:10.1007/s11760-015-0789-x. [Google Scholar] [CrossRef]
6. LeCun Y, Bengio Y, Hinton G. Deep learning. Nature. 2015;521(7553):436–44. doi:10.1038/nature14539. [Google Scholar] [PubMed] [CrossRef]
7. Zhao ZQ, Zheng P, St Xu, Wu X. Object detection with deep learning: a review. IEEE Trans Neural Netw Learn Syst. 2019;30(11):3212–32. doi:10.1109/TNNLS.2018.2876865. [Google Scholar] [PubMed] [CrossRef]
8. Cheng G, Chen X, Wang C, Li X, Xian B, Yu H. Visual fire detection using deep learning: a survey. Neurocomputing. 2024;596:127975. doi:10.1016/j.neucom.2024.127975. [Google Scholar] [CrossRef]
9. Redmon J, Divvala S, Girshick R, Farhadi A. You only look once: unified, real-time object detection. In: Proceedings of the IEEE Conference on Computer Vision and Pattern Recognition; 2016; Las Vegas, NV, USA. p. 779–88. [Google Scholar]
10. Ren S, He K, Girshick R, Sun J. Faster R-CNN: towards real-time object detection with region proposal networks. Adv Neural Inf Process Syst. 2015;28:91–9. [Google Scholar]
11. Li P, Zhao W. Image fire detection algorithms based on convolutional neural networks. Case Stud Therm Eng. 2020;19:100625. doi:10.1016/j.csite.2020.100625. [Google Scholar] [CrossRef]
12. Jocher G. YOLOv5 by Ultralytics; 2020. [Internet]. [cited 2024 Oct 7]. Available from: https://github.com/ultralytics/yolov5. [Google Scholar]
13. Jocher G, Chaurasia A, Qiu J. Ultralytics YOLOv8; 2023. [Internet]. [cited 2024 Oct 7]. Available from: https://github.com/ultralytics/ultralytics. [Google Scholar]
14. Wang A, Chen H, Liu L, Chen K, Lin Z, Han J, et al. YOLOv10: real-time end-to-end object detection. arXiv:2405.14458. 2024. [Google Scholar]
15. Lin TY, Maire M, Belongie S, Hays J, Perona P, Ramanan D, et al. Microsoft coco: common objects in context. In: Computer Vision-ECCV 2014: 13th European Conference; 2014 Sep 6–12; Zurich, Switzerland. p. 740–55. [Google Scholar]
16. de Venâncio PVA, Lisboa AC, Barbosa AV. An automatic fire detection system based on deep convolutional neural networks for low-power, resource-constrained devices. Neural Comput Appl. 2022;34(18):15349–68. doi:10.1007/s00521-022-07467-z. [Google Scholar] [CrossRef]
17. Zhang T, Wang F, Wang W, Zhao Q, Ning W, Wu H. Research on fire smoke detection algorithm based on improved YOLOv8. IEEE Access. 2024;12:117354–62. doi:10.1109/ACCESS.2024.3448608. [Google Scholar] [CrossRef]
18. Mamadaliev D, Touko PLM, Kim JH, Kim SC. ESFD-YOLOv8n: early smoke and fire detection method based on an improved YOLOv8n model. Fire. 2024;7(9):303. doi:10.3390/fire7090303. [Google Scholar] [CrossRef]
19. de Venâncio PVA, Campos RJ, Rezende TM, Lisboa AC, Barbosa AV. A hybrid method for fire detection based on spatial and temporal patterns. Neural Comput Appl. 2023;35(13):9349–61. doi:10.1007/s00521-023-08260-2. [Google Scholar] [CrossRef]
20. Akiba T, Sano S, Yanase T, Ohta T, Koyama M. Optuna: a Next-generation Hyperparameter Optimization Framework. In: Proceedings of the 25th ACM SIGKDD International Conference on Knowledge Discovery and Data Mining; Anchorage, AK, USA. 2019. p. 2623–26. [Google Scholar]
21. Moore BE, Corso JJ. FiftyOne. GitHub Note; 2020. [Internet]. [cited 2024 Oct 7]. Available from: https://githubcom/voxel51/fiftyone. [Google Scholar]
22. Talaat FM, ZainEldin H. An improved fire detection approach based on YOLO-v8 for smart cities. Neural Comput Appl. 2023;35(28):20939–54. doi:10.1007/s00521-023-08809-1. [Google Scholar] [CrossRef]
23. Huynh TT, Nguyen HT, Phu DT. Enhancing fire detection performance based on fine-tuned YOLOv10. Comput Mater Contin. 2024;81(2):2281–98. doi:10.32604/cmc.2024.057954. [Google Scholar] [CrossRef]
24. Li Z, Liu F, Yang W, Peng S, Zhou J. A survey of convolutional neural networks: analysis, applications, and prospects. IEEE Trans Neural Netw Learn Syst. 2021;33(12):6999–7019. doi:10.1109/TNNLS.2021.3084827. [Google Scholar] [PubMed] [CrossRef]
25. Yu T, Zhu H. Hyper-parameter optimization: a review of algorithms and applications. arXiv:2003.05689. 2020. [Google Scholar]
26. Shekhar S, Bansode A, Salim A. A comparative study of hyper-parameter optimization tools. In: 2021 IEEE Asia-Pacific Conference on Computer Science and Data Engineering (CSDE); Brisbane, QLD, Australia. 2021. p. 1–6. [Google Scholar]
27. Bergstra J, Bardenet R, Bengio Y, Kégl B. Algorithms for hyper-parameter optimization. Adv Neural Inform Process Syst. 2011;24:2546–54. [Google Scholar]
28. Akhmedov F, Nasimov R, Abdusalomov A. Dehazing algorithm integration with YOLO-v10 for ship fire detection. Fire. 2024;7(9):332. doi:10.3390/fire7090332. [Google Scholar] [CrossRef]
29. Ramos L, Casas E, Bendek E, Romero C, Rivas-Echeverría F. Hyperparameter optimization of YOLOv8 for smoke and wildfire detection: implications for agricultural and environmental safety. Artif Intell Agric. 2024;12:109–26. doi:10.1016/j.aiia.2024.05.003. [Google Scholar] [CrossRef]
30. Casas E, Ramos L, Bendek E, Rivas-Echeverría F. Assessing the effectiveness of YOLO architectures for smoke and wildfire detection. IEEE Access. 2023;11:96554–83. doi:10.1109/ACCESS.2023.3312217. [Google Scholar] [CrossRef]
31. Feng R, Zheng K, Huang Y, Zhao D, Jordan M, Zha ZJ. Rank diminishing in deep neural networks. Adv Neural Inform Process Syst. 2022;35:33054–65. [Google Scholar]
32. Padilla R, Netto SL, Da Silva EA. A survey on performance metrics for object-detection algorithms. In: 2020 International Conference on Systems, Signals and Image Processing (IWSSIP). Rio de Janeiro, Brazil: IEEE; 2020. p. 237–42. [Google Scholar]
33. Watanabe S. Tree-structured parzen estimator: understanding its algorithm components and their roles for better empirical performance. arXiv:2304.11127. 2023. [Google Scholar]
34. Sutskever I, Martens J, Dahl G, Hinton G. On the importance of initialization and momentum in deep learning. In: International Conference on Machine Learning. Vancouver, BC, Canada: PMLR; 2013. p. 1139–47. [Google Scholar]
35. Zhou P, Feng J, Ma C, Xiong C, Hoi SCH, E. W. Towards theoretically understanding why sgd generalizes better than adam in deep learning. Adv Neural Inform Process Syst. 2020;33:21285–96. [Google Scholar]
36. Goodfellow I, Bengio Y, Courville A. Deep learning. Cambridge, MA, USA: MIT Press; 2016. [Google Scholar]
37. Smith LN. A disciplined approach to neural network hyper-parameters: part 1–learning rate, batch size, momentum, and weight decay. arXiv:1803.09820. 2018. [Google Scholar]
38. Li X, Liang Y. Fire-RPG: an urban fire detection network providing warnings in advance. Fire. 2024;7(7):214. doi:10.3390/fire7070214. [Google Scholar] [CrossRef]
39. Kim S, Jang Is, Ko BC. Domain-free fire detection using the spatial-temporal attention transform of the YOLO backbone. Pattern Anal Appl. 2024;27(2):45. doi:10.1007/s10044-024-01267-y. [Google Scholar] [CrossRef]
40. Gonçalves LAO, Ghali R, Akhloufi MA. YOLO-based models for smoke and wildfire detection in ground and aerial images. Fire. 2024;7(4):140. doi:10.3390/fire7040140. [Google Scholar] [CrossRef]
41. Dror R, Shlomov S, Reichart R. Deep dominance-how to properly compare deep neural models. In: Proceedings of the 57th Annual Meeting of the Association for Computational Linguistics; 2019; Florence, Italy. p. 2773–85. [Google Scholar]
42. Ulmer D, Hardmeier C, Frellsen J. Deep-significance-easy and meaningful statistical significance testing in the age of neural networks. arXiv:2204.06815. 2022. [Google Scholar]
43. Mowla MN, Asadi D, Tekeoglu KN, Masum S, Rabie K. UAVs-FFDB: a high-resolution dataset for advancing forest fire detection and monitoring using unmanned aerial vehicles (UAVs). Data Brief. 2024;55:110706. doi:10.1016/j.dib.2024.110706. [Google Scholar] [PubMed] [CrossRef]
44. Mowla MN, Asadi D, Masum S, Rabie K. Adaptive hierarchical multi-headed convolutional neural network with modified convolutional block attention for aerial forest fire detection. IEEE Access. 2025;13:3412–33. doi:10.1109/ACCESS.2024.3524320. [Google Scholar] [CrossRef]
45. Zhou W, Cai C, Li C, Xu H, Shi H. AD-YOLO: a real-time yolo network with swin transformer and attention mechanism for airport scene detection. IEEE Trans Instrum Meas. 2024;73:5036112. doi:10.1109/TIM.2024.3472805. [Google Scholar] [CrossRef]
46. Goodfellow I, Pouget-Abadie J, Mirza M, Xu B, Warde-Farley D, Ozair S, et al. Generative adversarial nets. In: Advances in neural information processing systems 27. Cambridge, MA, USA: MIT Press; 2014. p. 2672–80. [Google Scholar]
47. Nguyen QD, Mai ND, Nguyen VH, Kakani V, Kim H. SynFAGnet: a fully automated generative network for realistic fire image generation. Fire Technol. 2024;60(3):1643–65. doi:10.1007/s10694-023-01540-2. [Google Scholar] [CrossRef]
48. Yar H, Ullah W, Khan ZA, Baik SW. An effective attention-based CNN model for fire detection in adverse weather conditions. ISPRS J Photogramm Remote Sens. 2023;206:335–46. doi:10.1016/j.isprsjprs.2023.10.019. [Google Scholar] [CrossRef]
Cite This Article
 Copyright © 2025 The Author(s). Published by Tech Science Press.
This work is licensed under a Creative Commons Attribution 4.0 International License , which permits unrestricted use, distribution, and reproduction in any medium, provided the original work is properly cited.
 Downloads
 Citation Tools