
 Submit a Paper
 Propose a Special lssue
 Open Access
ARTICLE
Design a Computer Vision Approach to Localize, Detect and Count Rice Seedlings Captured by a UAV-Mounted Camera
1 College of Engineering, Can Tho University, Can Tho City, 910900, Vietnam
2 School of Industrial Engineering and Management, International University, Vietnam National University, Ho Chi Minh City, 700000, Vietnam
3 Mekong Delta Development Research Institute, Can Tho University, Can Tho City, 910900, Vietnam
* Corresponding Author: Quang Hieu Ngo. Email:
(This article belongs to the Special Issue: Artificial Intelligence Algorithms and Applications)
Computers, Materials & Continua 2025, 83(3), 5643-5656. https://doi.org/10.32604/cmc.2025.064007
Received 01 February 2025; Accepted 07 April 2025; Issue published 19 May 2025
 View Full Text
 Download PDF
Abstract
This study presents a drone-based aerial imaging method for automated rice seedling detection and counting in paddy fields. Utilizing a drone equipped with a high-resolution camera, images are captured 14 days post-sowing at a consistent altitude of six meters, employing autonomous flight for uniform data acquisition. The approach effectively addresses the distinct growth patterns of both single and clustered rice seedlings at this early stage. The methodology follows a two-step process: first, the GoogleNet deep learning network identifies the location and center points of rice plants. Then, the U-Net deep learning network performs classification and counting of individual plants and clusters. This combination of deep learning models achieved a 90% accuracy rate in classifying and counting both single and clustered seedlings. To validate the method’s effectiveness, results were compared against traditional manual counting conducted by agricultural experts. The comparison revealed minimal discrepancies, with a variance of only 2–4 clumps per square meter, confirming the reliability of the proposed method. This automated approach offers significant benefits by providing an efficient, accurate, and scalable solution for monitoring seedling growth. It enables farmers to optimize fertilizer and pesticide application, improve resource allocation, and enhance overall crop management, ultimately contributing to increased agricultural productivity.Keywords
The accurate determination of rice seed density is crucial for successful paddy cultivation. A precise assessment of seed density is not only vital for maximizing crop yield but also plays a key role in effective resource management. This information can guide decisions related to seed distribution, irrigation practices, and fertilizer applications.
Historically, crop scientists have relied on manual field surveys to assess plant emergence rates, a process that is time-consuming and prone to errors [1]. The emergence of Unmanned Aerial Vehicles (UAVs) in agriculture has revolutionized monitoring practices [2]. UAVs offer significant advantages, including increased maneuverability and faster data collection, compared to traditional methods. UAVs have been widely used in land use and surface topography studies to capture high-resolution imagery for vegetation mapping [3,4]. Furthermore, the integration of UAV-mounted LiDAR technology has enhanced data acquisition capabilities, enabling more comprehensive and accurate analysis [5–7].
High-resolution cameras are becoming increasingly prevalent for agricultural monitoring. Image processing and computer vision techniques offer versatile toolkits for various applications, including crop monitoring, disease detection, weed control, and yield prediction. Methods such as edge detection and thresholding have been widely explored [8–10]. However, these methods primarily focus on identifying individual seeds, which can be challenging under high-density planting scenarios. Recent studies have estimated wheat plant density and quantified wheat seeds [11–13].
It is important to note that data collection in previous studies often relied on manual methods, which may not be practical for large-scale agricultural areas. Image processing, particularly with deep learning techniques, has shown great promise for utilizing UAV imagery for various agricultural monitoring tasks. These applications include detecting pine wilt disease [14], assessing the chlorophyll content in peanut leaves [15], and identifying blackgrass weeds [16]. Deep learning can significantly improve image classification and monitoring accuracy. Previous studies have extensively explored the use of deep learning to identify and track crop pests and diseases [17–20].
It is crucial to note that the effectiveness of deep learning in analyzing maize seedlings may be influenced by the specific characteristics of the maize plant. Factors such as plant size and relatively stable environmental conditions may affect the performance of image-processing techniques used for tasks such as estimating plant density, rice seedling throwing apparatus [21], evaluating emergence rates [22,23] and counting leaves [24].
Several studies have explored the use of drones in rice farming, particularly for seeding and monitoring plant growth stages [25,26]. These studies have primarily focused on drone-assisted seed planting techniques and have mainly assessed plant development during the middle and later stages. An alternative approach, presented in studies by [27,28], utilizes Convolutional Neural Networks (CNNs) to identify weeds and rice blast diseases in seedlings. However, the feasibility of this method for large-scale agricultural applications is challenging. Kong et al. [29] used X-ray computed tomography (CT) scans to assess rice seed density by calculating the seed setting rates from CT images. However, the high cost of CT makes this method impractical for widespread use. Guo et al. [30] proposed a novel approach that leverages deep learning algorithms to estimate sowing density based on seed-setting rates. However, this method requires harvesting the entire rice crops before analysis, making it unsuitable for real-time adjustments to fertilizer and pesticide applications.
Wu et al. [31] and Tseng et al. [32] utilized drones equipped with CNNS to successfully detect and count rice seedlings. However, these methods are currently limited to transplanted rice fields that have specific block-like planting patterns. Additionally, these techniques primarily focus on relatively mature rice plants, where panicles begin to form.
Rice cultivation primarily involves two methods, transplanting and direct sowing. During transplanting, seedlings are nurtured in a nursery before being carefully placed in the field, ensuring uniform spacing and plant development. In contrast, sowing involves scattering seeds directly into the field, often producing several seeds per hole. Weather conditions significantly affect germination and seedling establishment, leading to varying outcomes in each hole, from empty to single or multiple plants. This study differs from previous research by focusing on counting seedlings in directly sown rice fields. Given the variability in seedling growth and distribution across shown fields, a dedicated dataset and determination of an optimal altitude for accurate seedling counts are crucial considerations.
Conventionally, estimating rice plant density involves laborious counting of individual tillers within a 50 × 50 cm quadrat. This manual method requires sampling from multiple locations across the field, which is time consuming and costly. This study introduces a novel approach to assess rice seed density during crucial transplanting and tillering stages. By employing a camera mounted on an UAV, this study examined various flight altitudes to determine the optimal height for capturing detailed images of young rice plants. To mitigate uncertainties arising from environmental factors and the inherent randomness of seed germination, this study integrated a thresholding technique with a three-layer CNN to improve accuracy.
The accuracy of the proposed method was verified by comparing its results with manual counts performed on a sample within an area of one meter square within the rice field. This method demonstrates the potential for rapid and cost-effective assessment of rice plant density. This early detection of areas with low plant density not only saves labor costs but also provides valuable visual information. This information empowers farmers to make informed decisions about the necessity of replanting them in specific areas.
The structure of this paper is organized as follows: Section 2 describes the method for determining the position of rice plants, the dataset creation process, and the classification approach for identifying positions as either single seedlings or cluster seedlings. Section 3 presents the results of this study and verifies them against expert manual measurements. Additionally, this chapter includes a discussion comparing our findings with previous studies. Section 4 provides the conclusions, summarizing the key achievements of this paper.
2.1 Experimental Site and Data Acquistion
Data acquisition was conducted on 07 January 2024 in Thu Thua, Long An Province, Vietnam, as shown in Fig. 1.
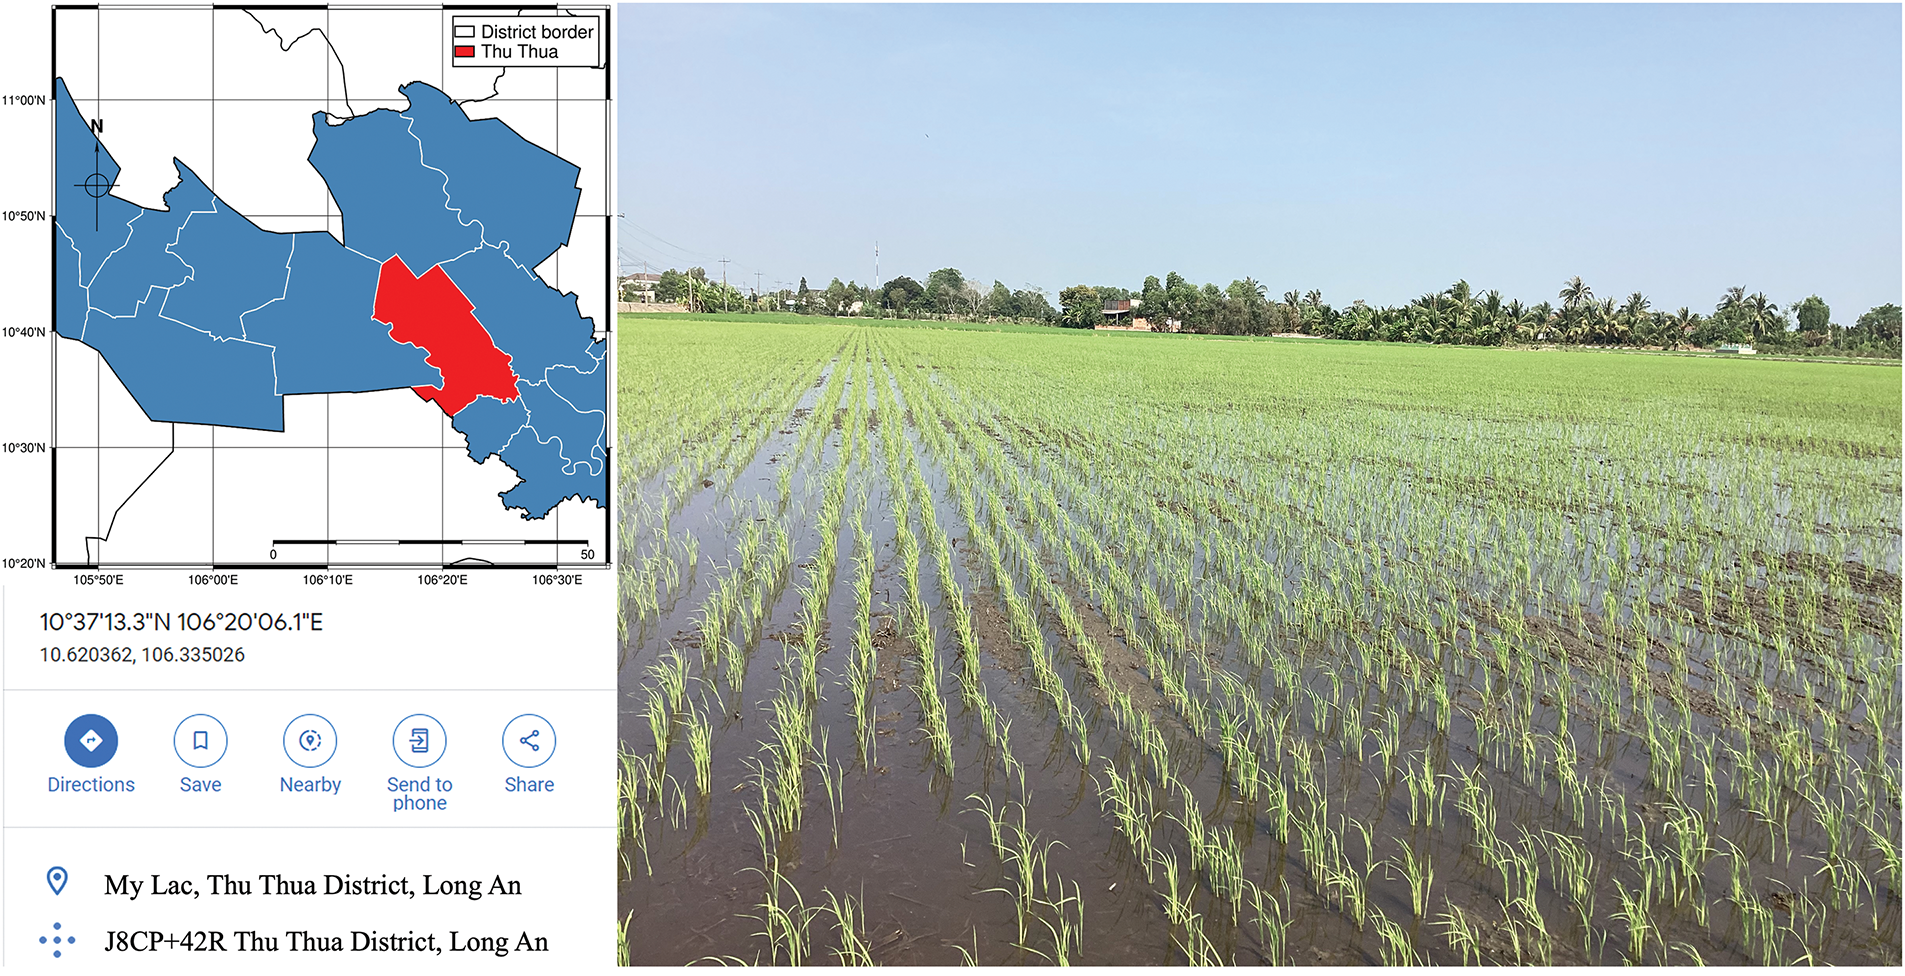
Figure 1: The observation location area and weather condition
Seventeen days after sowing, both the seed rate and number of tillers were carefully measured. To capture this data, a Phantom Pro 4 drone equipped with a DJI-FC6310S camera (capturing images at 4864 × 3648 pixels) was employed. Although video recording is possible, autonomous flight paths are preferred to ensure consistent image quality across varying environmental conditions. The FieldAgent software was used to plan and execute these autonomous flights. The ground sample distance (GSD) was calculated manually for each altitude, and is detailed in Table 1.
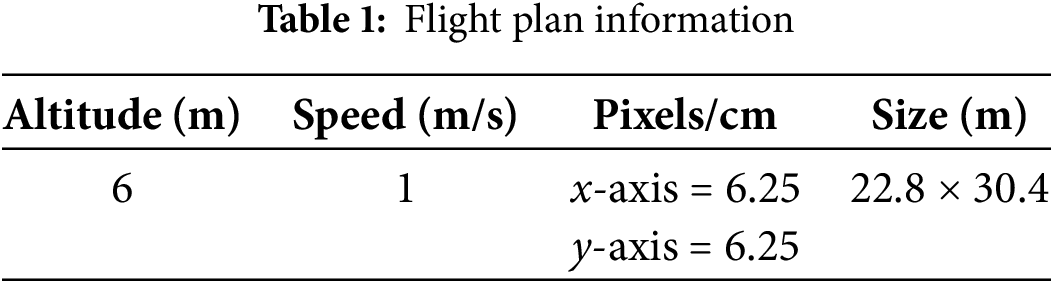
Image data was acquired at 10:15 AM on the designated observation day. During data collection, strong winds were present, blowing in the opposite direction of the drone’s flight path. Favorable lighting conditions ensured optimal image capture. To account for variations in environmental backgrounds, data collection sites were randomly selected within the field. These conditions included challenging scenarios such as backlighting, reflections on water surfaces, dark backgrounds, and the presence of objects that could be difficult to identify.
The experimental field was spanned approximately 2 ha, with a seeding rate of 40 kg/ha. A wider spacing of 10 × 15 cm2 was implemented, with approximately three seedlings planted per hill, and fertilizer was applied at a depth of 7 cm. During the vegetative stage, young rice plants primarily develop leaves and stems. The timing of tillering can vary depending on rice variety, nutrient availability, and prevailing weather conditions. In this study, a sowing machine was used to precisely plant IR4625 rice seeds one day after germination.
To complement the advanced imaging techniques used in this study, traditional methods were also employed to assess rice seed density 14 days after sowing (Fig. 2) [33]. Four distinct polyvinyl chloride (PVC) squares, each measuring 50 cm × 50 cm, were strategically placed at the four corners of the paddy field. These squares, aligned with the tractor’s plowing path as shown in Fig. 3, serve as visual landmarks. The images can be accurately divided into smaller manageable sections by identifying and locating these squares within the aerial images. It is important to note that the seed sowing machine used in this study created evenly spaced holes, with a predetermined distance of 10–12 cm between each hole. Therefore, knowing the precise coordinates of these PVC landmarks can provide valuable clues for identifying the locations of individual seed holes and clusters within images.
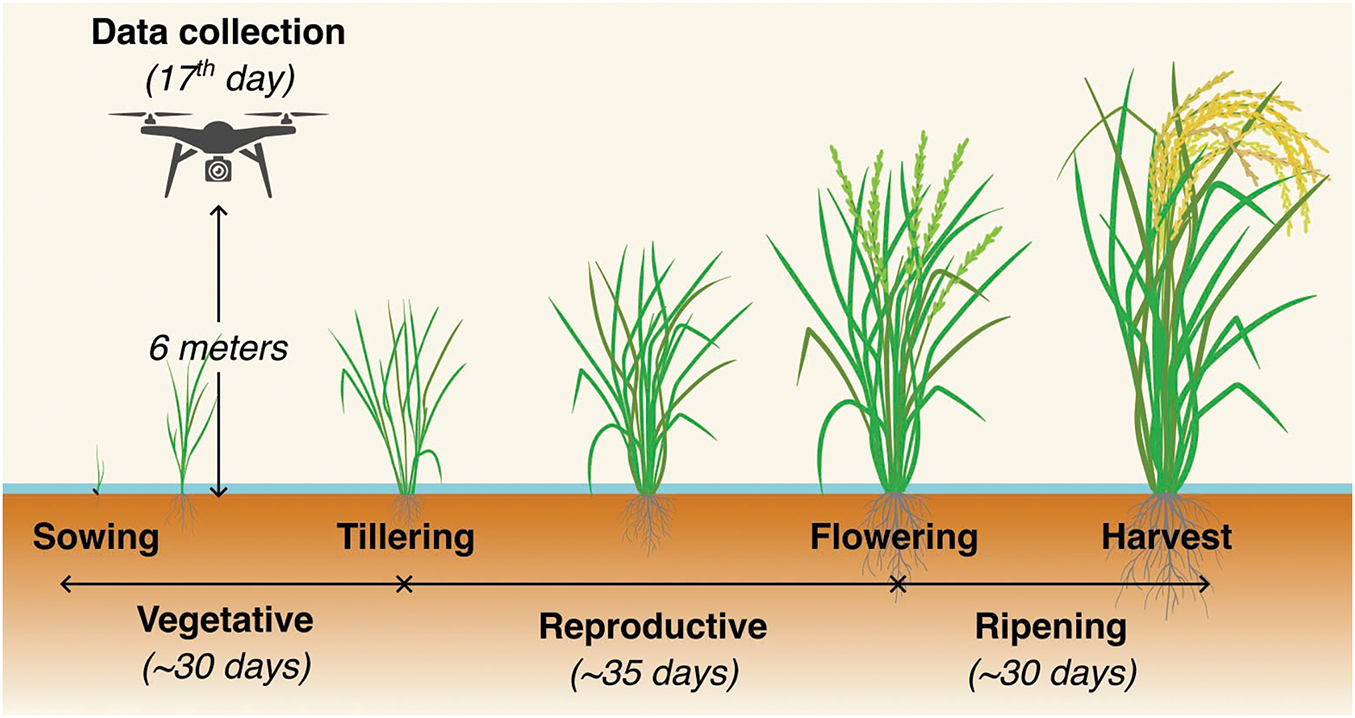
Figure 2: Rice crop cycle and data acquisition time adapted with permission from reference [33]
Figure 3: Rice seed density evaluation on field
The proposed system is illustrated in Fig. 4. Aerial images were converted into binary images, and a Hough line transformation was applied to detect the four edges of each landmark. Finally, the center point of each landmark was calculated.
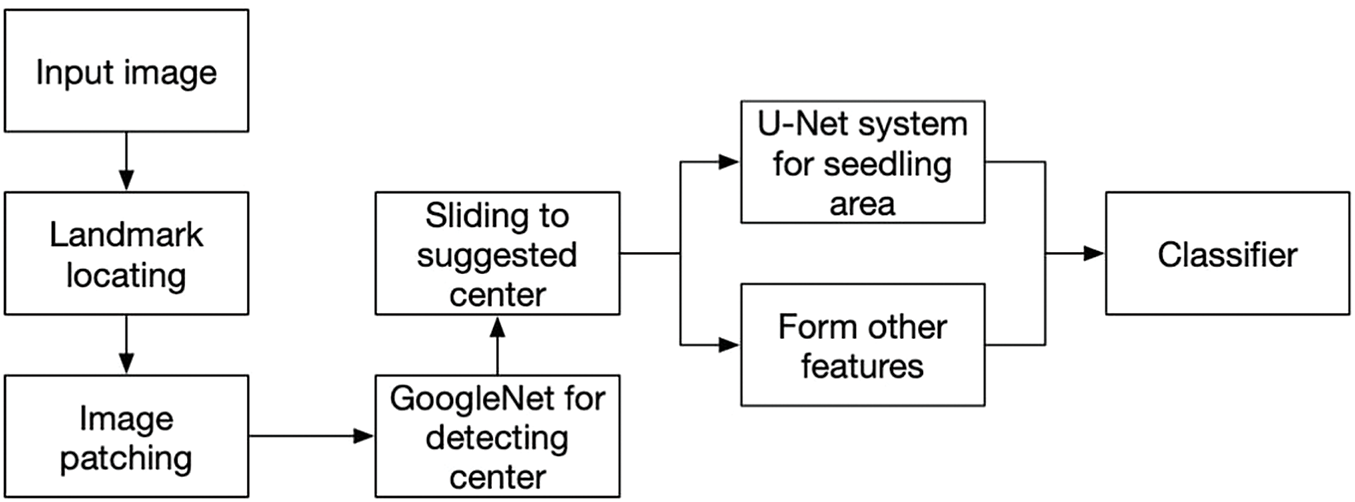
Figure 4: Proposed system
To detect seedling positions, a dot map was generated, and labels were assigned to each cluster center. In this study, the objects were categorized into three classes: single rice seedlings, clusters of rice seedlings, and undefined objects. For each dot representing a potential seedling or cluster, a square window of size 35 × 35 pixels was defined, with the dot coordinates serving as the window’s center. This window was used to extract a feature vector from the image.
To accomplish this, the study primarily employed spatial descriptors, specifically Gabor filters, and histograms of color ratios. Gabor filters are steerable filters that are sensitive to both orientation and frequency. They act as linear filters, analyzing the presence of specific frequency components within the image in different directions around the point of interest. Research in computer vision suggests that the frequency and orientation responses of Gabor filters closely resemble those of the human visual system. This makes them particularly well-suited for representing and distinguishing textures. Mathematically, Gabor filters are recognized for their optimal joint resolution in both spatial and frequency domains. In the discrete domain, two-dimensional Gabor filters are defined as Eqs. (1) and (2):
In the Gabor filter equation, B and C represent the normalization factors determined during the process. Parameter f defines the specific frequency being analyzed within the texture. By adjusting the values of
To enhance the precision of locating the center point during the window-sliding process, GoogLeNet was employed to predict the initial center point. Although landmarks can be identified and initial estimates of sowing hole locations can be made, a comprehensive view of the entire cluster is necessary for an accurate density assessment. During the inference stage, the window slides towards the center point, as predicted by GoogLeNet [34]. The predicted center point was then subjected to a re-evaluation process. If the predicted center falls within an acceptable margin of error from the actual center of the window, a feature vector is extracted. This feature vector was subsequently used as an input for the classifier to assign labels. The loss function employed to train GoogLeNet is defined by Eq. (3) providing by [35].
where (
2.3 Data Creation and Preparation
To train the proposed system, three different datasets were prepared and created regarding 3 different stages [33]. The first dataset comprises images in which cluster centers, that is, dots, are located at various positions. In this set, the images of undefined objects have center coordinates of (0, 0). In this study, we employ the U-Net deep learning network. U-Net offers several advantages in image segmentation, particularly for remote sensing and biological applications. Additionally, the U-Net model demonstrates superior efficiency in training with limited data compared to other convolutional neural networks (CNNs). Moreover, U-Net is well-suited for applications with small batch sizes, which is particularly relevant to this study, as the size of rice plants is relatively small. For Unet training, a set of raw and mask images were created, and some typical samples are shown in Fig. 5.
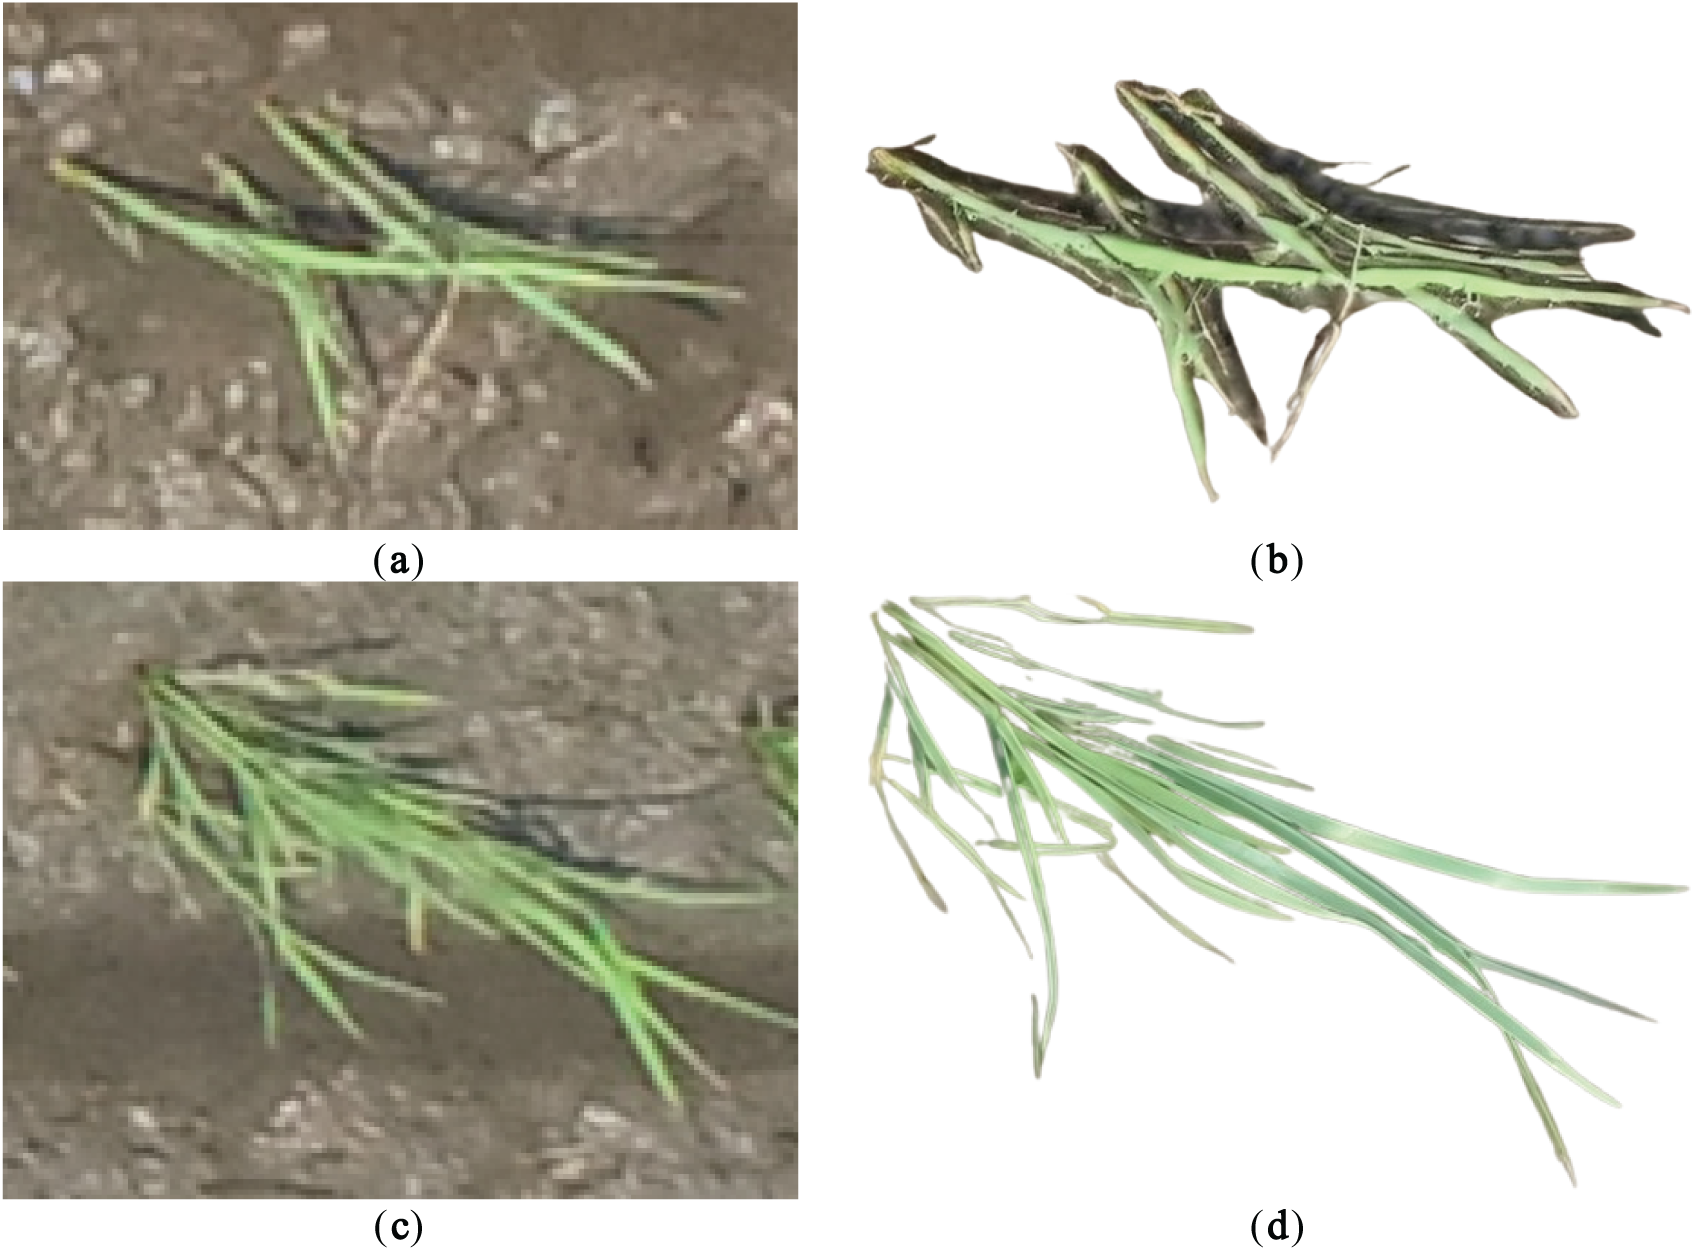
Figure 5: Samples for training U-Net. (a) Single seedling; (b) Single seedling mask; (c) Clusters of seedling; (d) Clusters of seedling mask
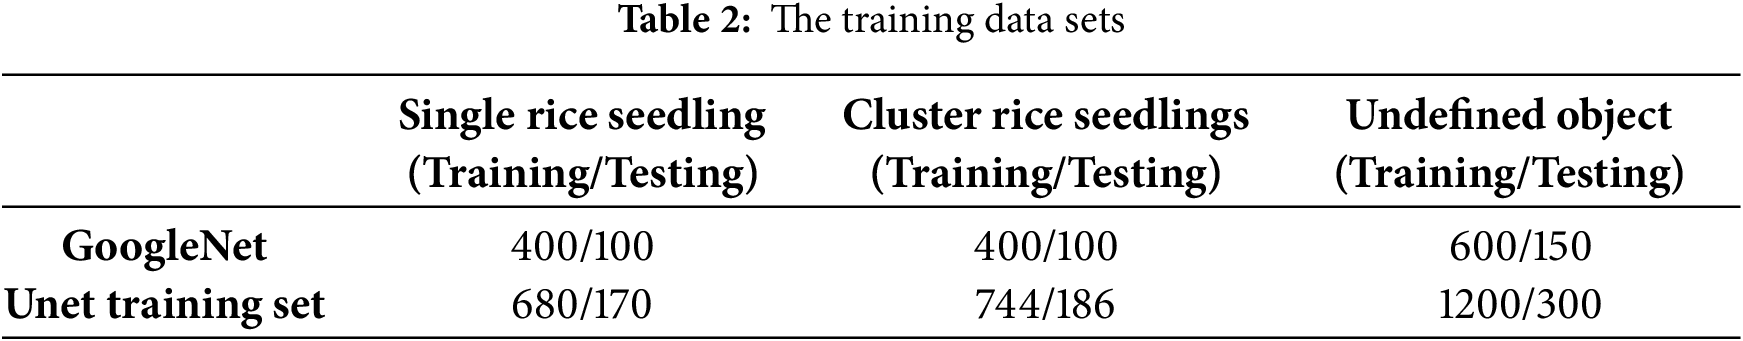
To enrich the dataset and improve its suitability for training, various augmentation techniques have been applied, including image transformations, such as rotation, blurring, denoising, and blending. These transformations were iteratively applied to increase the diversity of the dataset. The resulting augmented dataset was more comprehensive and robust, encompassing a wider range of visual characteristics and complexities. This enhanced dataset improves the ability of the model to generalize and perform well during training and evaluation. A detailed breakdown of the class distribution within the augmented dataset is presented in Table 2 with 80% for training and 20% for testing.
Following the training phase, key performance metrics such as accuracy, precision, recall, and F1-score, as defined in Eqs. (4)–(7) were calculated using the confusion matrix to assess the model’s performance:
where
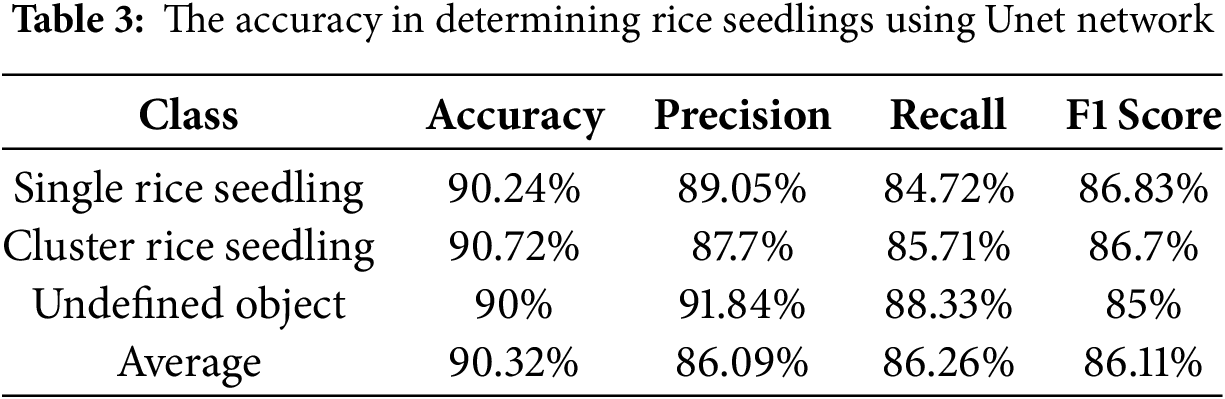
The model was trained on a personal computer equipped with an Intel Core i5-14400F processor and 16 GB of RAM. Using MATLAB software, the training process was conducted on a single CPU for approximately 133 min. The training procedure consisted of 30 epochs, with 339 iterations per epoch. The performance of the proposed model was evaluated using a confusion matrix Fig. 6 and a set of statistical metrics (Table 3). The proposed model demonstrated a significantly high accuracy. Misclassifications were minimal, with 15 of 130 samples being incorrectly classified between “single rice seedlings” and “undefined objects.”
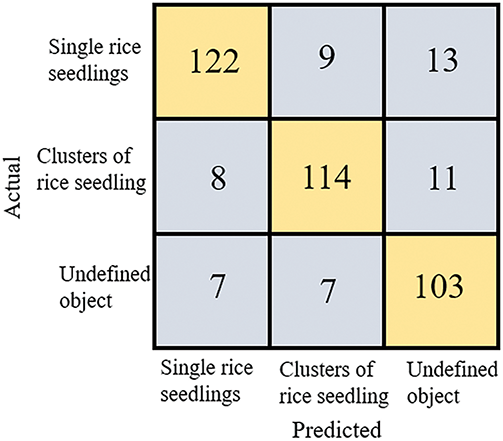
Figure 6: Confusion matrix of proposed approach
3.1 Rice Seedling Localization and Detection
Extensive experimentation has determined that the optimal altitude for UAV operation is six meters above ground level. Fig. 7 illustrates the results of the proposed model, where the red dots indicate the center of each seedling. These findings demonstrate that our method effectively estimates the number of seedlings in each aerial image, despite variations in plant size across the field. However, challenges arise in the precise location of individual rice seeds within certain image regions. These challenges are particularly evident when dust or other unidentified objects obscure the view of the rice plants or when the seeds are very small and may be mistakenly classified as background features by conventional analysis techniques.
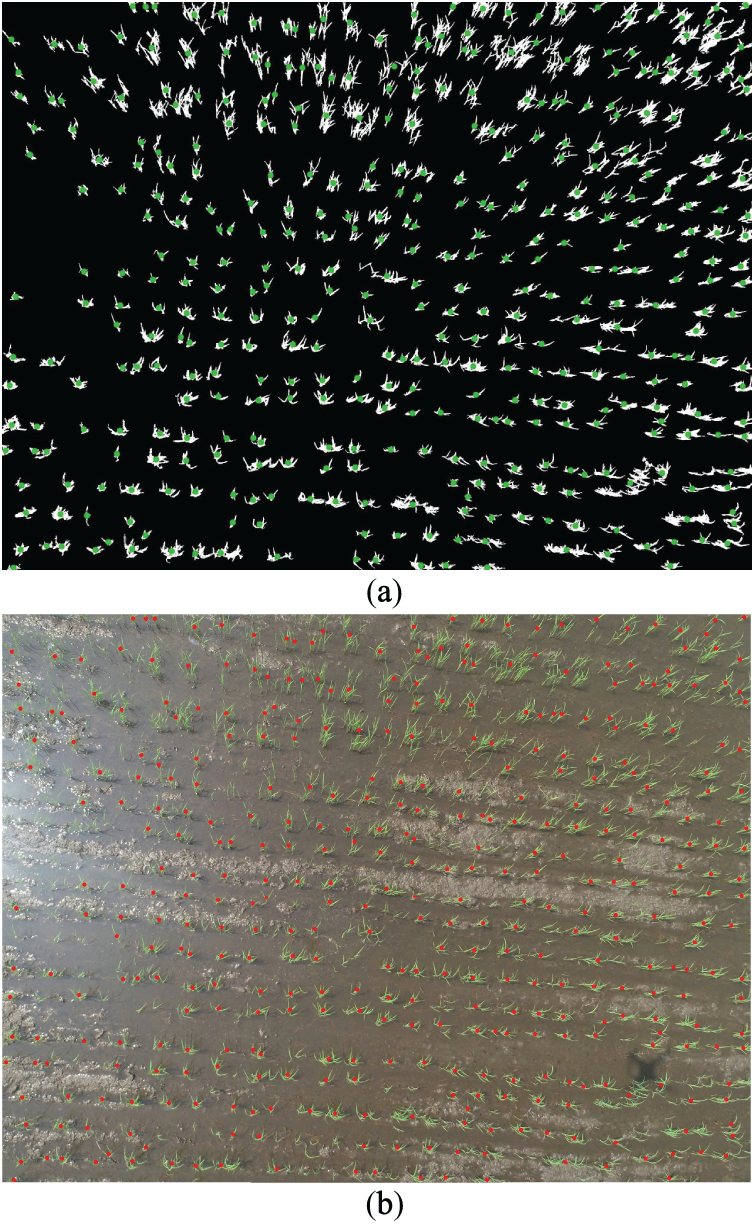
Figure 7: Seedling localization and detection results. (a) Thresholding localization; (b) Seedling detection
3.2 Rice Seedling Classifying and Counting
Fig. 8 shows the results of classifying and counting rice plants from the aerial images. The results show that the proposed method can detect and classify nearly all rice plants in the image frame. The green rectangle represents a single rice seedling, whereas the yellow rectangle represents a cluster rice seedling. The detailed results indicate that the proposed method can classify single rice plants even under backlit conditions. Under good lighting conditions, the proposed method could classify almost all single and clustered rice seedlings.
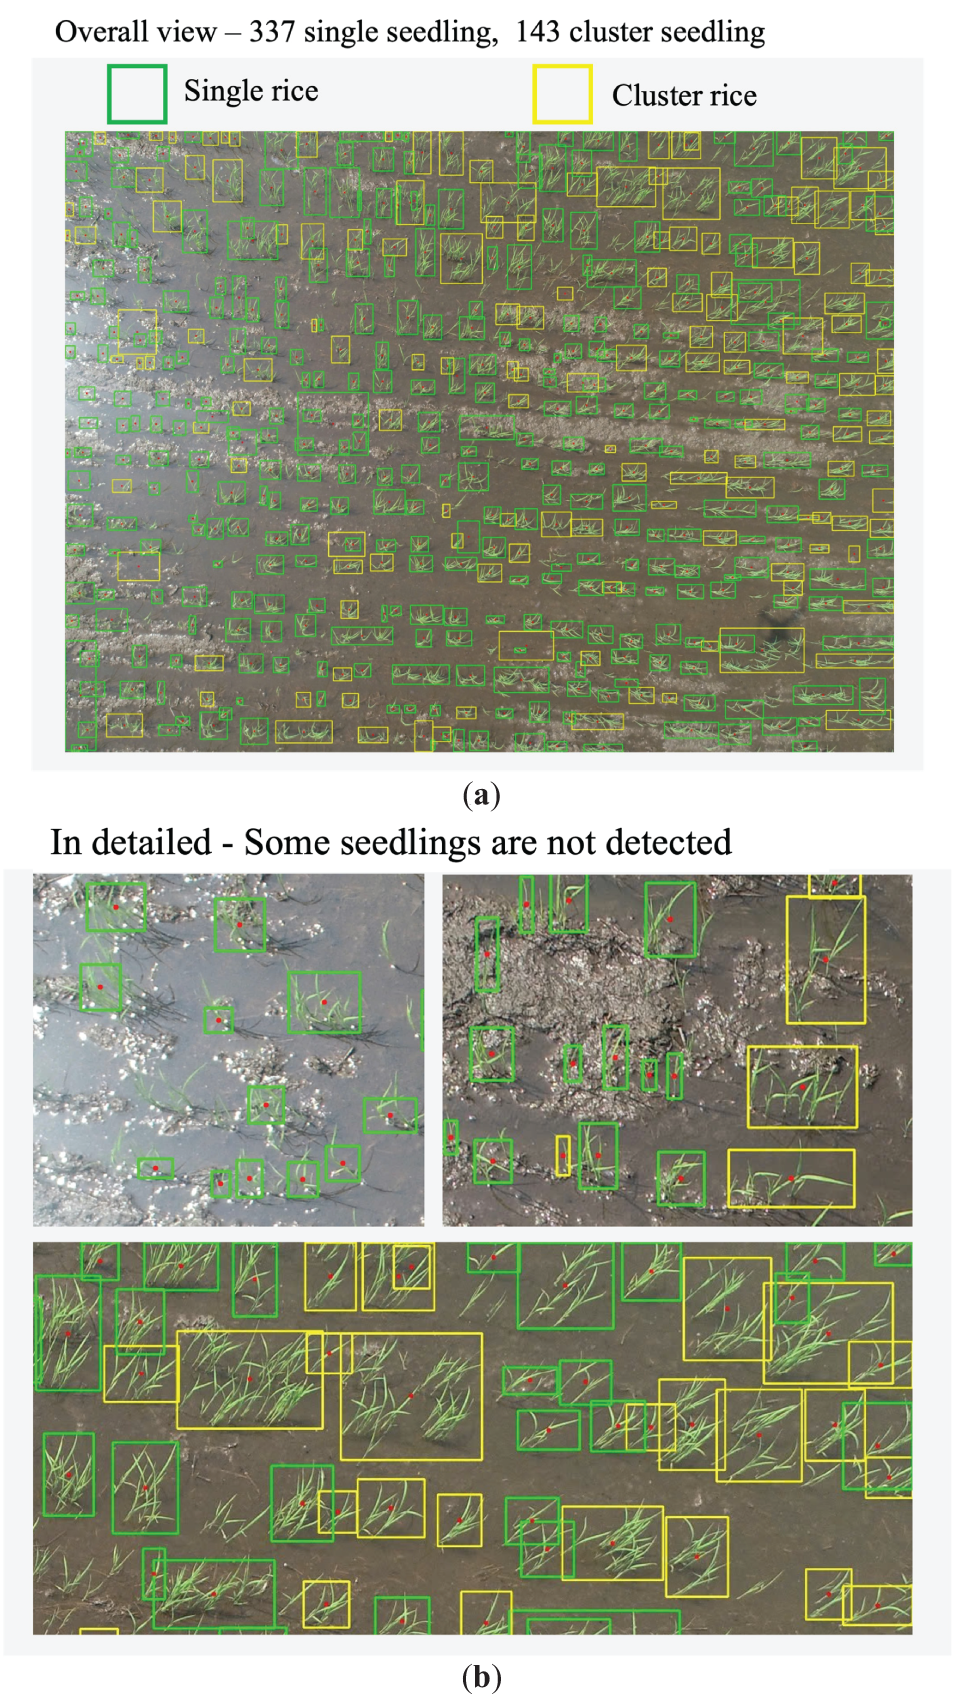
Figure 8: Rice seedling classifying and counting. (a) Seedling detection and classification. (b) Seedling detection and classification in local area
To evaluate the effectiveness of UAV technology compared with traditional methods, we initially focused on two key parameters: “hill density per square meter” and “tiller number per square meter.” However, because of the overlapping canopy caused by germination, only the “hill density per square meter” could be reliably measured.
In traditional method, the hill density per square meter, five sample plots, each measuring 50 × 50 cm2, were randomly placed at the four corners and the center of the field (Fig. 1). Within each plot, the number of single seedlings and cluster seedlings per square was recorded. Using data from these plots, the hill density was extrapolated to estimate the total density for the entire paddy field.
In our method, samples were collected from UAVs at designated locations. For each area, images were randomly selected for analysis, and the values derived from these images were averaged and compared with the manually calculated results. Since the image dimensions could be measured (as shown in Table 1), the average value for the sampled areas was determined.
Table 4 presents the results obtained from the five different images captured at an altitude of 6 m.

At an altitude of 6 m, the proposed UAV-based method and the traditional ground-based approach for estimating hill density showed minimal differences, typically ranging from 2 to 4 hills per square meter. Additionally, it is important to note that valuable information about rice germination can be obtained by analyzing the average number of clusters and individual rice seedlings per square meter.
To compare our research findings with those of several state-of-the-art studies on seedling detection and counting. Zhang et al. [12] achieved 93% accuracy in segmenting rice plants using LW-SegNet and LW-Unet with a multi-spectral camera mounted on a UAV at a 30-m flight altitude. Tseng et al. [32] and Yang et al. [37] leveraged the UAV Open Dataset to detect transplanted rice plants at a 40-m altitude, achieving accuracies between 99% and 100% using various deep learning methods. Bai et al. [38] focused on reproductive stages and introduced RiceNet, a network that improved rice plant counting accuracy, achieving the lowest mean absolute error (MAE) of 8.6 and root mean square error (RMSE) of 11.2 compared to other networks.
Previous studies have also employed deep learning networks to count rice plants in the field. However, these studies primarily focused on accuracy evaluation and were conducted on transplanted rice plants, which had already reached a considerable size. Moreover, the germination period of the rice plants in those studies was relatively long. Our research focuses on the stage when rice plants are about to begin tillering, at which point the germination rate in the field can be observed. We classified them in different groups, including one rice seedling and a cluster of seedlings, and calculated the number of hill/m2. This is highly significant in supporting farmers during the later stages of the growing season.
This study presents a methodology for assessing rice seed density at varying altitudes using a camera mounted on an Unmanned Aerial Vehicle (UAV). To validate the approach, manual observations were conducted on the same day in a paddy field during the tillering stage. The UAV operated autonomously at a flight altitude of 6 m, guided by FieldAgent software, to capture aerial images. The evaluation of rice seed density was carried out through the following steps:
• The center points of seedlings were detected using a landmark-based approach in combination with the GoogleNet network.
• Rice seedlings were classified into three distinct categories: single rice seedlings, clusters of rice seedlings, and undefined objects.
• Feature vectors were extracted at each detected center point, and seedlings were classified using the U-Net network.
• At an altitude of 6 m, the proposed method achieved classification accuracies of 90.24% for single rice seedlings and 90.72% for cluster rice seedlings. Compared to traditional methods, the difference in estimation was minimal, with only a 1–2 hill/m2 variation.
This study primarily focused on detecting, counting, and evaluating rice seed density, without addressing the rice seed loss rate, which will be explored in future research. Additionally, rice seed density was calculated offline after UAV image collection. Future studies may investigate the feasibility of real-time processing by integrating an embedded PC with field robots, enabling more efficient data analysis and decision-making in precision agriculture.
Acknowledgement: We would like to thank Luong Gia Bao, last year student at the College of Engineering, Can Tho University, for helping us generate training and testing datasets as well as validate model manually.
Funding Statement: This study was funded by the Ministry of Education and Training Project (code number: B2023-TCT-08).
Author Contributions: The authors confirm contribution to the paper as follows: Methodology, formal analysis, writing—review and editing, software, formal analysis, Trong Hieu Luu; methodology, writing—original draft, Phan Nguyen Ky Phuc; investigation, resources, writing—review and editing, supervision, Quang Hieu Ngo; methodology, resources, validation, visualization, Thanh Tam Nguyen; validation, resources, data curation, Huu Cuong Nguyen. All authors reviewed the results and approved the final version of the manuscript.
Availability of Data and Materials: The data that support the findings of this study are available from the first author, Trong Hieu Luu (luutronghieu@ctu.edu.vn), upon reasonable request.
Ethics Approval: Not applicable.
Conflicts of Interest: The authors declare no conflicts of interest to report regarding the present study.
References
1. Zualkernan I, Abuhani DA, Hussain MH, Khan J, ElMohandes M. Machine learning for precision agriculture using imagery from unmanned aerial vehicles (UAVsa survey. Drones. 2023;7(6):382. doi:10.3390/drones7060382. [Google Scholar] [CrossRef]
2. Leiva JN, Robbins J, Saraswat D, She Y, Ehsani R. Evaluating remotely sensed plant count accuracy with differing unmanned aircraft system altitudes, physical canopy separations, and ground covers. J Appl Remote Sens. 2017;11(3):036003. doi:10.1117/1.jrs.11.036003. [Google Scholar] [CrossRef]
3. Zhu H, Lu X, Zhang K, Xing Z, Wei H, Hu Q, et al. Optimum basic seedling density and yield and quality characteristics of unmanned aerial seeding rice. Agronomy. 2023;13(8):1980. doi:10.3390/agronomy13081980. [Google Scholar] [CrossRef]
4. Zhou H, Fu L, Sharma RP, Lei Y, Guo J. A hybrid approach of combining random forest with texture analysis and VDVI for desert vegetation mapping based on UAV RGB data. Remote Sens. 2021;13(10):1891. doi:10.3390/rs13101891. [Google Scholar] [CrossRef]
5. Trepekli K, Friborg T. Deriving aerodynamic roughness length at ultra-high resolution in agricultural areas using UAV-borne LiDAR. Remote Sens. 2021;13(17):3538. doi:10.3390/rs13173538. [Google Scholar] [CrossRef]
6. Kellner JR, Armston J, Birrer M, Cushman KC, Duncanson L, Eck C, et al. New opportunities for forest remote sensing through ultra-high-density drone lidar. Surv Geophys. 2019;40(4):959–77. doi:10.1007/s10712-019-09529-9. [Google Scholar] [PubMed] [CrossRef]
7. Sankey TT, McVay J, Swetnam TL, McClaran MP, Heilman P, Nichols M. UAV hyperspectral and lidar data and their fusion for arid and semi-arid land vegetation monitoring. Remote Sens Ecol Conserv. 2018;4(1):20–33. doi:10.1002/rse2.44. [Google Scholar] [CrossRef]
8. García-Martínez H, Flores-Magdaleno H, Khalil-Gardezi A, Ascencio-Hernández R, Tijerina-Chávez L, Vázquez-Peña MA, et al. Digital count of corn plants using images taken by unmanned aerial vehicles and cross correlation of templates. Agronomy. 2020;10(4):469. doi:10.3390/agronomy10040469. [Google Scholar] [CrossRef]
9. Li B, Xu X, Han J, Zhang L, Bian C, Jin L, et al. The estimation of crop emergence in potatoes by UAV RGB imagery. Plant Methods. 2019;15:15. doi:10.1186/s13007-019-0399-7. [Google Scholar] [PubMed] [CrossRef]
10. Zhao B, Zhang J, Yang C, Zhou G, Ding Y, Shi Y, et al. Rapeseed seedling stand counting and seeding performance evaluation at two early growth stages based on unmanned aerial vehicle imagery. Front Plant Sci. 2018;9:1362. doi:10.3389/fpls.2018.01362. [Google Scholar] [PubMed] [CrossRef]
11. Liu S, Baret F, Andrieu B, Burger P, Hemmerlé M. Estimation of wheat plant density at early stages using high resolution imagery. Front Plant Sci. 2017;8:739. doi:10.3389/fpls.2017.00739. [Google Scholar] [PubMed] [CrossRef]
12. Zhang P, Sun X, Zhang D, Yang Y, Wang Z. Lightweight deep learning models for high-precision rice seedling segmentation from UAV-based multispectral images. Plant Phenomics. 2023;5:0123. doi:10.34133/plantphenomics.0123. [Google Scholar] [PubMed] [CrossRef]
13. Ma X, Deng X, Qi L, Jiang Y, Li H, Wang Y, et al. Fully convolutional network for rice seedling and weed image segmentation at the seedling stage in paddy fields. PLoS One. 2019;14(4):e0215676. doi:10.1371/journal.pone.0215676. [Google Scholar] [PubMed] [CrossRef]
14. Yu R, Luo Y, Zhou Q, Zhang X, Wu D, Ren L. Early detection of pine wilt disease using deep learning algorithms and UAV-based multispectral imagery. For Ecol Manag. 2021;497:119493. doi:10.1016/j.foreco.2021.119493. [Google Scholar] [CrossRef]
15. Qi H, Wu Z, Zhang L, Li J, Zhou J, Jun Z, et al. Monitoring of peanut leaves chlorophyll content based on drone-based multispectral image feature extraction. Comput Electron Agric. 2021;187:106292. doi:10.1016/j.compag.2021.106292. [Google Scholar] [CrossRef]
16. Su J, Yi D, Coombes M, Liu C, Zhai X, McDonald-Maier K, et al. Spectral analysis and mapping of blackgrass weed by leveraging machine learning and UAV multispectral imagery. Comput Electron Agric. 2022;192:106621. doi:10.1016/j.compag.2021.106621. [Google Scholar] [CrossRef]
17. Jung M, Song JS, Shin AY, Choi B, Go S, Kwon SY, et al. Construction of deep learning-based disease detection model in plants. Sci Rep. 2023;13(1):7331. doi:10.1038/s41598-023-34549-2. [Google Scholar] [PubMed] [CrossRef]
18. Zhang T, Li K, Chen X, Zhong C, Luo B, Grijalva I, et al. Aphid cluster recognition and detection in the wild using deep learning models. Sci Rep. 2023;13(1):13410. doi:10.1038/s41598-023-38633-5. [Google Scholar] [PubMed] [CrossRef]
19. Bezabh YA, Salau AO, Abuhayi BM, Mussa AA, Ayalew AM. CPD-CCNN: classification of pepper disease using a concatenation of convolutional neural network models. Sci Rep. 2023;13(1):15581. doi:10.1038/s41598-023-42843-2. [Google Scholar] [PubMed] [CrossRef]
20. Gao X, Zan X, Yang S, Zhang R, Chen S, Zhang X, et al. Maize seedling information extraction from UAV images based on semi-automatic sample generation and Mask R-CNN model. Eur J Agron. 2023;147:126845. doi:10.1016/j.eja.2023.126845. [Google Scholar] [CrossRef]
21. Yuan P, Yang Y, Wei Y, Zhang W, Ji Y. Design and experimentation of rice seedling throwing apparatus mounted on unmanned aerial vehicle. Agriculture. 2024;14(6):847. doi:10.3390/agriculture14060847. [Google Scholar] [CrossRef]
22. Xu X, Wang L, Liang X, Zhou L, Chen Y, Feng P, et al. Maize seedling leave counting based on semi-supervised learning and UAV RGB images. Sustainability. 2023;15(12):9583. doi:10.3390/su15129583. [Google Scholar] [CrossRef]
23. Velumani K, Lopez-Lozano R, Madec S, Guo W, Gillet J, Comar A, et al. Estimates of maize plant density from UAV RGB images using faster-RCNN detection model: impact of the spatial resolution. Plant Phenomics. 2021;2021:9824843. doi:10.34133/2021/9824843. [Google Scholar] [PubMed] [CrossRef]
24. Yeh JF, Lin KM, Yuan LC, Hsu JM. Automatic counting and location labeling of rice seedlings from unmanned aerial vehicle images. Electronics. 2024;13(2):273. doi:10.3390/electronics13020273. [Google Scholar] [CrossRef]
25. Adeluyi O, Harris A, Foster T, Clay GD. Exploiting centimetre resolution of drone-mounted sensors for estimating mid-late season above ground biomass in rice. Eur J Agron. 2022;132:126411. doi:10.1016/j.eja.2021.126411. [Google Scholar] [CrossRef]
26. Worakuldumrongdej P, Maneewam T, Ruangwiset A. Rice seed sowing drone for agriculture. In: 2019 19th International Conference on Control, Automation and Systems (ICCAS); 2019 Oct; Jeju, Republic of Korea: IEEE. p. 980–5. doi:10.23919/ICCAS47443.2019.8971461. [Google Scholar] [CrossRef]
27. Liang WJ, Zhang H, Zhang GF, Cao HX. Rice blast disease recognition using a deep convolutional neural network. Sci Rep. 2019;9(1):2869. doi:10.1038/s41598-019-38966-0. [Google Scholar] [PubMed] [CrossRef]
28. Ma J, Li Y, Liu H, Du K, Zheng F, Wu Y, et al. Improving segmentation accuracy for ears of winter wheat at flowering stage by semantic segmentation. Comput Electron Agric. 2020;176:105662. doi:10.1016/j.compag.2020.105662. [Google Scholar] [CrossRef]
29. Kong H, Chen P. Mask R-CNN-based feature extraction and three-dimensional recognition of rice panicle CT images. Plant Direct. 2021;5(5):e00323. doi:10.1002/pld3.323. [Google Scholar] [PubMed] [CrossRef]
30. Guo Y, Li S, Zhang Z, Li Y, Hu Z, Xin D, et al. Automatic and accurate calculation of rice seed setting rate based on image segmentation and deep learning. Front Plant Sci. 2021;12:770916. doi:10.3389/fpls.2021.770916. [Google Scholar] [PubMed] [CrossRef]
31. Wu J, Yang G, Yang X, Xu B, Han L, Zhu Y. Automatic counting of in situ rice seedlings from UAV images based on a deep fully convolutional neural network. Remote Sens. 2019;11(6):691. doi:10.3390/rs11060691. [Google Scholar] [CrossRef]
32. Tseng HH, Yang MD, Saminathan R, Hsu YC, Yang CY, Wu DH. Rice seedling detection in UAV images using transfer learning and machine learning. Remote Sens. 2022;14(12):2837. doi:10.3390/rs14122837. [Google Scholar] [CrossRef]
33. Luu TH, Cao HL, Ngo QH, Nguyen TT, Makrini IE, Vanderborght B. RiGaD: an aerial dataset of rice seedlings for assessing germination rates and density. Data Brief. 2024;57:111118. doi:10.1016/j.dib.2024.111118. [Google Scholar] [PubMed] [CrossRef]
34. Szegedy C, Liu W, Jia Y, Sermanet P, Reed S, Anguelov D, et al. Going deeper with convolutions. In: 2015 IEEE Conference on Computer Vision and Pattern Recognition (CVPR); 2015 Jun 7–12; Boston, MA, USA. p. 1–9. doi:10.1109/CVPR.2015.7298594. [Google Scholar] [CrossRef]
35. Huber PJ. Robust estimation of a location parameter. Ann Math Stat. 1964;35(1):73–101. doi:10.1214/aoms/1177703732. [Google Scholar] [CrossRef]
36. Ronneberger O, Fischer P, Brox T. U-Net: convolutional networks for biomedical image segmentation. In: Navab N, Hornegger J, Wells WM, Frangi AF, editors. Medical image computing and computer-assisted intervention—MICCAI 2015. Berlin/Heidelberg, Germany: Springer; 2015. p. 234–41. doi:10.1007/978-3-319-24574-4_28. [Google Scholar] [CrossRef]
37. Yang MD, Tseng HH, Hsu YC, Yang CY, Lai MH, Wu DH. A UAV open dataset of rice paddies for deep learning practice. Remote Sens. 2021;13(7):1358. doi:10.3390/rs13071358. [Google Scholar] [CrossRef]
38. Bai X, Liu P, Cao Z, Lu H, Xiong H, Yang A, et al. Rice plant counting, locating, and sizing method based on high-throughput UAV RGB images. Plant Phenomics. 2023;5:20. doi:10.34133/plantphenomics.0020. [Google Scholar] [PubMed] [CrossRef]
Cite This Article
 Copyright © 2025 The Author(s). Published by Tech Science Press.
This work is licensed under a Creative Commons Attribution 4.0 International License , which permits unrestricted use, distribution, and reproduction in any medium, provided the original work is properly cited.
 Downloads
 Citation Tools