
 Submit a Paper
 Propose a Special lssue
 Open Access
ARTICLE
Enhanced Wheat Disease Detection Using Deep Learning and Explainable AI Techniques
Department of Natural, Engineering and Technology Sciences, Faculty of Graduate Studies, Arab American University, Ramallah, P.O. Box 240, Palestine
* Corresponding Author: Ahmad Hasasneh. Email:
Computers, Materials & Continua 2025, 84(1), 1379-1395. https://doi.org/10.32604/cmc.2025.061995
Received 07 December 2024; Accepted 23 April 2025; Issue published 09 June 2025
 View Full Text
 Download PDF
Abstract
This study presents an enhanced convolutional neural network (CNN) model integrated with Explainable Artificial Intelligence (XAI) techniques for accurate prediction and interpretation of wheat crop diseases. The aim is to streamline the detection process while offering transparent insights into the model’s decision-making to support effective disease management. To evaluate the model, a dataset was collected from wheat fields in Kotli, Azad Kashmir, Pakistan, and tested across multiple data splits. The proposed model demonstrates improved stability, faster convergence, and higher classification accuracy. The results show significant improvements in prediction accuracy and stability compared to prior works, achieving up to 100% accuracy in certain configurations. In addition, XAI methods such as Local Interpretable Model-agnostic Explanations (LIME) and Shapley Additive Explanations (SHAP) were employed to explain the model’s predictions, highlighting the most influential features contributing to classification decisions. The combined use of CNN and XAI offers a dual benefit: strong predictive performance and clear interpretability of outcomes, which is especially critical in real-world agricultural applications. These findings underscore the potential of integrating deep learning models with XAI to advance automated plant disease detection. The study offers a precise, reliable, and interpretable solution for improving wheat production and promoting agricultural sustainability. Future extensions of this work may include scaling the dataset across broader regions and incorporating additional modalities such as environmental data to enhance model robustness and generalization.Keywords
Wheat is the third most consumed food in the world after corn and rice. It provides essential vitamins and minerals, having a significant impact on human nutrition. According to the Food and Agriculture Organization of the United Nations (FAO), one in ten people worldwide suffers from severe malnutrition due to insufficient food. The yield per hectare in developing countries is lower than that in developed countries [1]. The difference is due to the use of modern technology and methods in agriculture. Currently, the Fourth Industrial Revolution is transforming industries, including agriculture [2]. Artificial intelligence (AI), machine learning, and deep learning play crucial roles in transforming the agricultural industry. These technologies facilitate precision farming, leading to reduced resource waste and increased profits [3,4].
Approximately 90% of the world’s wheat-growing area is exposed to at least one type of wheat disease, resulting in annual production losses of more than 62 million tons. This loss represents approximately 8.5% of the world’s wheat production, which is enough to meet the nutritional needs of up to 173 million people each year [5]. In Egypt, wheat diseases severely affect farmers, leading to losses of up to 42.94% [6].
Traditionally, wheat diseases have been detected through manual inspection of each plant. However, this method is subjective, slow, and often inaccurate [7,8]. With technological advancements, machine learning and deep learning are increasingly being used for rapid detection and identification of wheat diseases, helping to prevent grain waste and ensure high crop yields, thereby maximizing farmers’ profits [9,10].
Deep learning methods, such as convolutional neural networks (CNNs), have achieved high accuracy in image classification tasks. Unlike traditional feature-based supervised learning methods like random forests and support vector machines (SVMs), deep learning approaches are end-to-end. These methods automatically extract and learn features from data without the need for manual feature engineering. Nowadays, deep learning models are increasingly used in image analysis. Many deep learning models have been trained on large datasets.
The use of XAI adds a crucial dimension to these advancements, enabling transparency and interpretability in model predictions. XAI techniques, such as LIME and SHAP, allow stakeholders to understand how and why the model reaches specific decisions. This is particularly valuable in agriculture, where trust and transparency are essential for adoption. By providing visual and numerical explanations, XAI not only enhances model reliability but also helps farmers and agricultural experts make informed decisions, ensuring broader acceptance of AI solutions in the field.
The quality of wheat grains affects many aspects of people’s lives. Global food shortages persist, and developing countries, especially in Asia and Africa, struggle with hunger and malnutrition. Low food production affects the overall health and happiness of rural families [11]. As information and communication technology tools improve, farmers are gaining access to better technological solutions. Consequently, mobile applications utilizing artificial intelligence are becoming useful in classifying wheat diseases [12,13].
In this study, the main objectives are to (1) develop an enhanced CNN model for wheat disease detection, (2) integrate Explainable AI techniques (LIME and SHAP) to provide transparent insights into the model’s decision-making, and (3) evaluate the model’s accuracy and stability against recent benchmark studies.
The rest of this paper is organized as follows: Section 2 provides a description and comparison of related work. Section 3 presents the proposed method. Section 4 discusses the experimental results. Finally, Section 5 concludes the paper and suggests future work.
Numerous studies have utilized machine learning and deep learning methods to develop robust models for the detection of wheat and plant diseases. This literature review examines various studies that have worked with different machine learning and deep learning methods to identify wheat and plant diseases, highlighting the datasets used, methodologies, and performance outcomes. Multiple approaches, including traditional ML and deep CNN architectures, have been proposed to enhance classification accuracy.
The authors of [14] used a dataset of tomato leaf samples showing six different diseases. Histogram equalization was used to improve image quality, and k-means clustering was used for dividing the images into regions showing signs of disease. They proposed multiple feature extraction methods, such as discrete wavelet transform (DWT), principal component analysis (PCA), and gray level co-occurrence matrix (GLCM), for machine learning algorithms including SVM, k-nearest neighbors (K-NN), and CNN. The model showed classification accuracy with SVM (88%), K-NN (97%), and CNN (99.6%) on tomato disease samples.
The study in [15] used a dataset collected from different wheat fields in Pakistan, comprising 3150 images categorized into brown rust, severe yellow rust, and healthy leaves. The images were processed using segmentation methods such as mask-based and resizing to differentiate between healthy and unhealthy areas. Various machine learning models were proposed and trained on the preprocessed data. The primary model developed is a fine-tuned random forest classifier (RFC), optimized to achieve high accuracy and efficiency. The proposed framework achieved a very high accuracy of 99.8%, better than the performance of existing machine learning techniques used for wheat disease classification.
Some researchers consider lightweight CNN models for the detection of wheat and plant diseases because they are computationally efficient and can be deployed on edge devices. The authors of [16] used a dataset collected from wheat fields in the district of Kotli, Azad Kashmir, Pakistan. A total of 3750 images were initially captured, reevaluated, and faulty images removed, leaving 1567 images. They proposed a lightweight CNN model consisting of eight layers, including three convolutional layers with 16, 32, and 64 filters each using a 3 × 3 kernel size. The model uses a training-validation-test split with three variations (S1: 70%:15%:15%, S2: 75%:15%:10%, S3: 80%:10%:10%) to evaluate the performance. The S3 variant (80% training, 10% validation, 10% testing) demonstrated superior performance, achieving 93% accuracy. The lightweight CNN architecture is emphasized as being suitable for real-time applications, potentially even on smartphones.
The study in [17] used a wheat disease dataset with seven classes, including six disease classes and one healthy class. Some data were collected from the LWDCD2020 dataset, and other images captured using mobile phone photography. The dataset was filled with images showing various stages of disease and varied backgrounds. After augmentation, they proposed a lightweight multiscale CNN integrating Inception, ResNet, and attention mechanisms, achieving 98.7% accuracy and outperforming classic and lightweight CNNs.
In [18], the images were collected from the Anhui Agricultural University Industry-University Research Base. The images contain healthy wheat ears and those affected by scab and glume blight, totaling 568 images. The images were preprocessed using the Retinex algorithm to enhance them by reducing lighting effects and augmenting the data through transformations like rotation and flipping. They proposed a lightweight CNN model, SimpleNet, which utilizes an attention mechanism and feature fusion to enhance model performance for disease identification in complex background settings.
Other researchers have used CNN models. For instance, Ref. [19] used a dataset (LWDCD2020), containing approximately 12,000 images across nine different classes of wheat diseases and one normal class. All images were preprocessed to ensure dimensional uniformity, resized to 224 × 224 pixels, and standardized before being split for training and testing. They proposed a new deep convolutional neural network model consisting of 21 convolution layers, 7 max-pooling layers, achieving 97.88% accuracy and outperforming popular models like VGG16 and RESNET50. The study in [20] used a dataset composed of 4800 images of eleven different wheat diseases like leaf rust and powdery mildew, and images of healthy crops, achieving 98.84% accuracy with a CNN-based classifier.
The study in [21] used two datasets. They proposed CNN-CA-I (image-based) and CNN-CA-W (weather-based), reporting accuracies of 92.6% and 90.1%, respectively. The authors of [22] tested a CNN model on 5932 rice leaf images and 1500 potato leaf images, achieving 99.58% and 97.66% accuracy, respectively.
Several researchers have used pre-trained CNN models. The authors of [23] used the dataset WheatRust21, which consists of 6556 images collected from field conditions. They proposed a fine-tuned EfficientNet B4 model, which outperformed other models with testing accuracy of 99.35%. In [24] a CNN for Powdery Mildew wheat disease, combined with transfer learning, achieved up to 89.9% accuracy. In [25], a modified VGG19 showed high performance (96.08%) on rice leaf diseases.
The authors of [26] used the PlantVillage dataset, which consists of approximately 10,000 images representing various crop diseases and healthy plants. They proposed multiple CNNs (VGG-16, VGG-19, ResNet-50) with transfer learning. The ResNet-50 model integrated into a web application achieved 98.98%. In [27], a VGG16 model pretrained on ImageNet classified wheat rust diseases with 99.54% accuracy. In [28], 5170 images in 27 disease classes were analyzed using MobileNet, VGG16, InceptionV3, and InceptionResNetV2, with MobileNet showing strong results.
The study in [29] used two datasets—PlantVillage and FWDI—and seven different CNN architectures, including VGG-16, Inception-v3, ResNet-50, DenseNet-121, EfficientNet-B6, ShuffleNet-v2, and MobileNetV3. Three training strategies were applied (scratch, fixed feature extraction, fine-tuning), with Inception-v3 reaching 92.5% accuracy. Additionally, the integration of XAI in plant disease diagnosis has gained traction, offering insights into model decision-making processes. The study in [30] demonstrated the efficacy of CNNs for early crop disease detection, combined with XAI visualization to explain predictions, achieving 89.75% accuracy. Another work [31] explored early diagnosis of plant stress using hyperspectral and thermal imaging, highlighting how XAI can enhance interpretability.
Finally, a dataset of 147,500 images representing 58 plant leaf classes was improved by three augmentation techniques: basic image manipulation (BIM), deep convolutional GAN (DCGAN), and neural style transfer (NST). A 14-layer DCNN trained for 1000 epochs reached 99.9655% accuracy. The related work shows there are existing knowledge gaps that are primarily related to stability in training and prediction accuracy fluctuations. In summary, these diverse studies highlight the need for stability, high accuracy, and interpretability—gaps our proposed model addresses with batch normalization, hyperparameter tuning, and XAI (LIME, SHAP).
Batch normalization is used to stabilize the learning process, thus reducing accuracy fluctuations. Additionally, a carefully tuned learning rate leads to more precise parameter updates and improved convergence, enhancing the model’s overall robustness.
In today’s technologically advanced era, the early detection of plant diseases is critical for ensuring timely and effective treatment, which directly supports consistent agricultural productivity and food security. Transitioning from traditional manual disease detection methods to automated systems can significantly benefit farmers by providing accurate, scalable, and real-time solutions.
This study focuses on enhancing wheat disease detection by developing a modified version of the lightweight CNN model introduced in [16]. The proposed methodology integrates advanced techniques to improve prediction accuracy and model stability while maintaining computational efficiency, making it suitable for real-world agricultural applications.
The workflow of the proposed method consists of several key modules: dataset collection, image pre-processing, feature extraction using convolutional layers, classification, model compilation, training, and evaluation. These modules collectively ensure a streamlined and robust process for disease detection. The training experiments were conducted on Google Colab using default Python settings with GPU support. The overall workflow, illustrating the step-by-step methodology, is presented in Fig. 1.
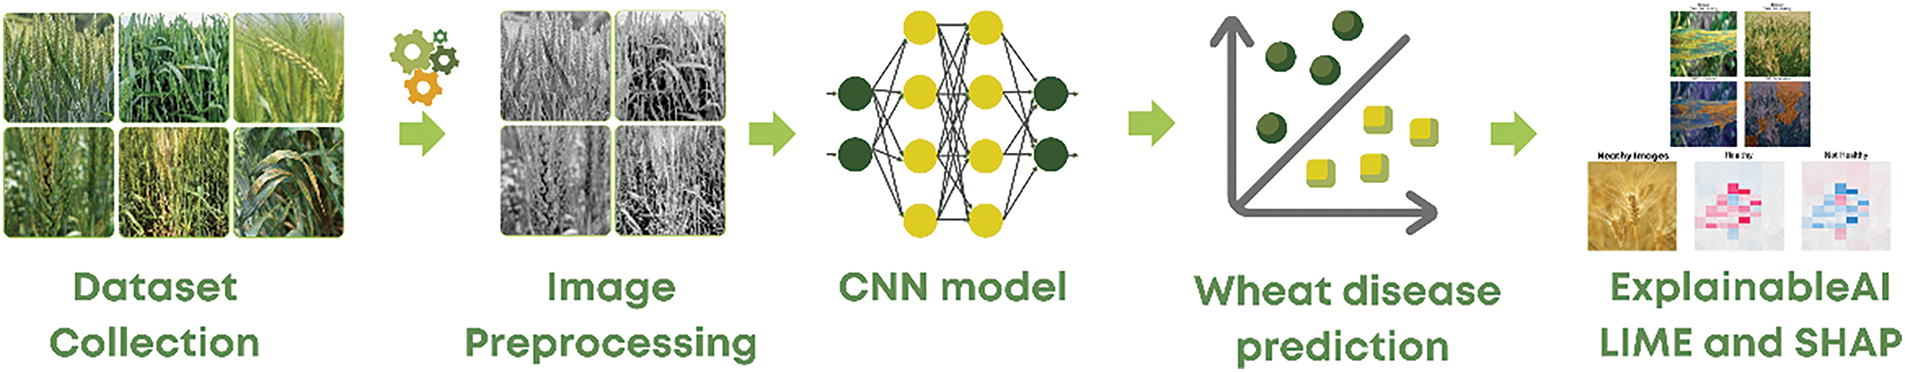
Figure 1: The workflow of the proposed method
The dataset for this research work involved images taken from wheat fields of Kotli district in Azad Kashmir, Pakistan, using mobile phones in different states. In all, 3750 images—kept safe at various angles and locations inside the fields—were used in the initial study. After examining, they carefully removed faulty and poor-quality photos and produced 1567 much-refined images. Annotated manually from the field expert side, these images attained the credibility and precision of the tags. From this set, 450 images were chosen for experiment purposes, equally divided under the subjects “healthy” and “unhealthy” into 225 each.
Figs. 2 and 3 show sample images from that dataset, taking typical examples of healthy and unhealthy wheat plants. Their use also refers to the method used in Ref. [16], to be able to compare directly with results and validate improvements on the proposed model. It is also recognized that the relatively small dataset size (450 images) may limit the model’s generalizability. Additionally, collecting images from a single district is acknowledged as a limitation to geographical diversity. Future efforts should aim to expand the dataset across varied regions. With this relatively more modest data set, these enhancements don’t penalize the proposed CNN by significantly affecting its performance. Several aspects are due to the model’s light architecture, which was designed to learn efficiently from less data. Batch normalization and dropout integration while training also lead to better generalization within the model and reduce overfitting issues. These steps further ensured the model could reach the level of accuracy and stability it had manifested within real-world working agricultural environments from the achieved features and benefits.
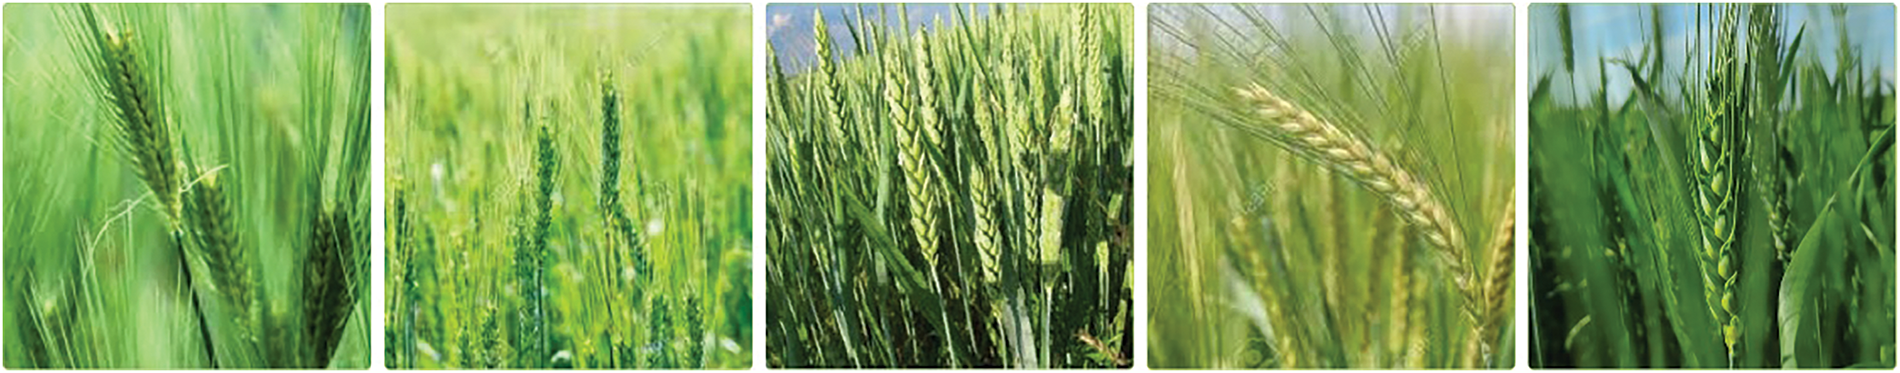
Figure 2: Sample healthy images from the captured dataset in [16]. Reprinted with permission under CC BY 4.0 License from Tech Science Press
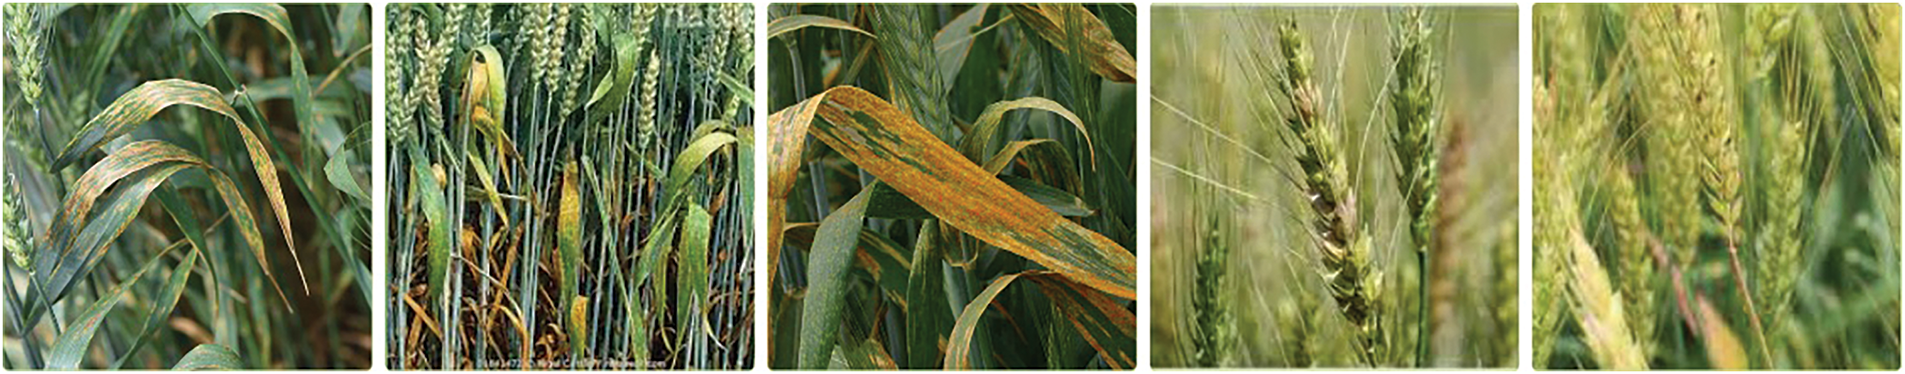
Figure 3: Sample unhealthy images from the captured dataset in [16]. Reprinted with permission under CC BY 4.0 License from Tech Science Press
To ensure a fair comparison with the work in [16], the dataset was divided into three distinct split ratios: S1 (70% training, 15% validation, 15% testing), S2 (75% training, 15% validation, 10% testing), and S3 (80% training, 10% validation, 10% testing). These splits were designed to evaluate the model’s performance across varying amounts of training and testing data while maintaining consistency with previous research. The proposed model was trained and validated on each of these splits, allowing for a thorough analysis of its robustness and learning behavior under different data configurations.
The preprocessing step readied the dataset for input into the CNN model by preparing the photos. The photographs were resized to a specific dimension so that each one has dimensions of 200 × 200 pixels and fits the model’s input requirements. Data augmentation techniques (e.g., flipping, rotation) were applied to address potential overfitting.
The datasets were randomly shuffled during the training and validation phases to ensure a greater diversity of samples available to the model, prevent biases due to image ordering, and allow assumptions for better generalization throughout the data. These preprocessing steps play a vital role in modernizing the data and increasing efficiency in learning the model.
3.3 Convolutional Neural Network
The CNN would involve wheat plant photo processing through convolution operations, resulting in a feature mapping to extract significant semantics while conserving the spatial relationship. The basic CNN architecture typically has convolutional layers that apply filters to learn patterns, pooling layers for dimensionality reduction of feature maps, and a final classification in fully connected layers.
The proposed CNN model structure begins with an input layer designed for 200 × 200 × 3 (RGB) images. It is followed by three convolutional layers embedding 32, 64, and 64 filters, each with a 3 × 3 kernel size. A stride of (1, 1) and ‘same’ padding are adopted in all convolutional layers to keep spatial dimensions unchanged in the inputting image. The ReLU activates and propagates it to the model through each layer to accommodate diverse models in capturing complicated patterns.
In each convolutional layer, the learning process shifts toward a better and more general image when intersecting toward being followed by batch normalization for stabilizing the learning process and boosting generalization. The outputs from the intermediate layers are normalized, accelerating the pace of training, regularizing the models, and making them less sensitive to initialization. Sometimes, max pooling is applied in the batch normalization layer with a pool size of 2 × 2 and stride of 2 to reduce the dimensionality of the features maps and reduce the complexity computationally.
After all features have been extracted, the flattened layer comes in and turns the feature maps into a one-dimensional vector, which qualifies the data for fully connected layers. The final dense layer contains only two units representing the other classes for the other pair of classifications. The dense layer with softmax activation also provides an output probability distribution over the two classes to facilitate model classification.
The implementation of this CNN is very lightweight to ensure efficient computational services. It has great potential for real-time applications and, hence, edge-based agricultural applications, as is evident from Fig. 4, where the holistic architecture of the proposed model is illustrated, detailing every component of it in the classification process.
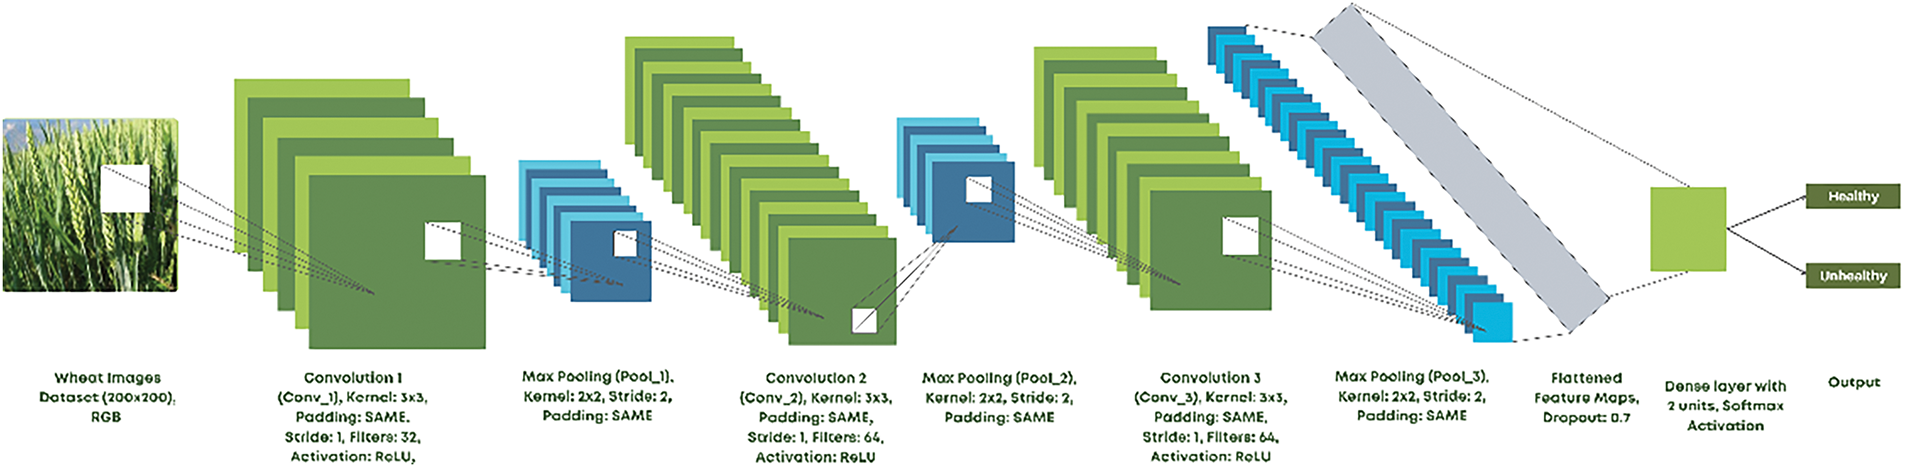
Figure 4: Proposed CNN model structure
3.4 Explainable Artificial Intelligence
To ensure transparency in the decision-making process of the proposed CNN model, this study incorporates XAI techniques, specifically LIME and SHAP [32,33]. These methods provide insights into the model’s behavior, allowing stakeholders to understand how predictions are made and fostering trust in the system.
LIME focuses on explaining individual predictions by approximating the complex CNN model with a simpler, interpretable model, such as a linear regression or decision tree, in the vicinity of a specific input. By perturbing the input and observing the effects on the model’s predictions, LIME identifies the key features or regions of an image that significantly influence the classification decision. For instance, in this study, LIME helps pinpoint specific areas in wheat images that the model considers crucial for determining whether the crop is healthy or unhealthy. This localized explanation is particularly valuable for non-technical users, as it provides intuitive visual feedback on the model’s reasoning.
SHAP complements LIME by offering both local and global interpretability. It explains how individual features contribute to the model’s predictions by distributing the output among the input features based on their importance. Unlike LIME, which focuses on instance-specific explanations, SHAP provides an overarching view of feature importance across the entire dataset. Specifically, SHAP is grounded in cooperative game theory, treating each feature as a ‘player’ in a coalition and computing Shapley values to quantify feature contributions, thus reflecting the theoretical basis and assumptions behind its calculation of importance. In this study, SHAP reveals patterns and trends that the model relies on to distinguish between healthy and diseased wheat, offering a broader perspective on the model’s decision-making process. This insight is critical for validating the model’s behavior against domain knowledge and identifying any potential biases.
The combination of LIME and SHAP in this research ensures a comprehensive understanding of the CNN model’s predictions, both at the instance level and across the dataset. These techniques not only enhance the interpretability of the model but also improve its usability for agricultural experts and farmers by building confidence in the system’s outputs. Additionally, the insights provided by XAI facilitate iterative model refinement and ensure alignment with real-world requirements.
Several key metrics are employed to evaluate the proposed model’s performance, including accuracy, precision, recall, and F1-score, which are standard for classification tasks. These metrics provide a comprehensive view of the model’s performance by considering both correct predictions and errors, enabling robust assessment across different aspects of classification. Class-wise performance evaluations are also conducted to analyze the classifier’s performance for each class individually.
where TP is the True Positive, TN is the True Negative, FP is the False Positive, and FN is the False Negative.
These metrics are evaluated at both overall and class levels to ensure the model’s reliability and robustness, particularly in distinguishing between healthy and unhealthy wheat images.
4.1 Model Training with Multiple Dataset Splits
The dataset comprised images of healthy and unhealthy wheat crops organized into two directories. Given the relatively small size of the dataset, multiple experiments were conducted to investigate the potential for model underfitting and to evaluate the model’s performance under various dataset splits.
The proposed model was trained on all three splits. Fig. 5 shows the training and validation loss curves for the splits S1, S2, and S3, while Fig. 6 presents the corresponding accuracy curves. These visualizations provide insights into the model’s learning behavior across epochs. In the baseline model reported in [17], the training process showed significant fluctuations in accuracy, ranging from 20% to 100% across epochs. These fluctuations indicate instability in the learning process, leading to inconsistent performance. To address these issues, batch normalization was integrated into the CNN architecture. Batch normalization normalizes the inputs to each layer for each mini-batch, effectively reducing internal covariate shifts and stabilizing the training process. Additionally, the learning rate was reduced to 0.0009, allowing the model to perform smaller, more precise updates to its parameters. This modification improved convergence and ensured greater stability during training. The impact of these enhancements is evident in the loss and accuracy curves for S1, S2, and S3.
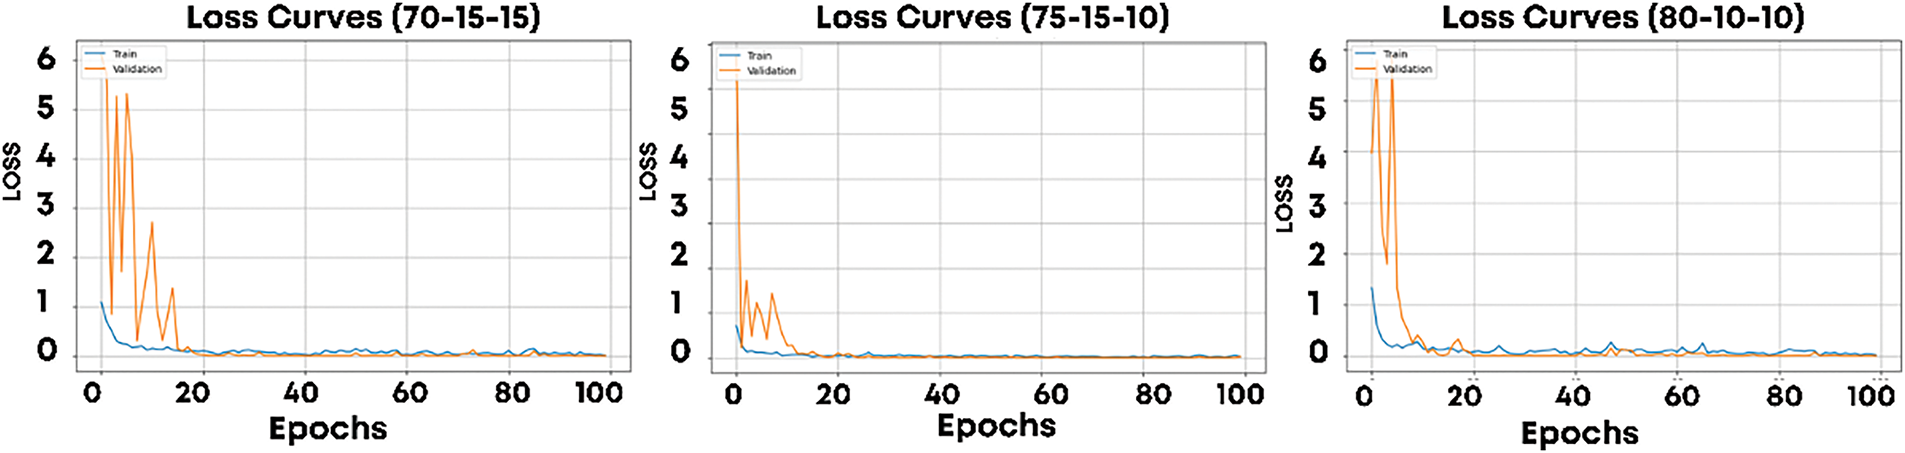
Figure 5: Training and validation loss for S1, S2, and S3 dataset splits
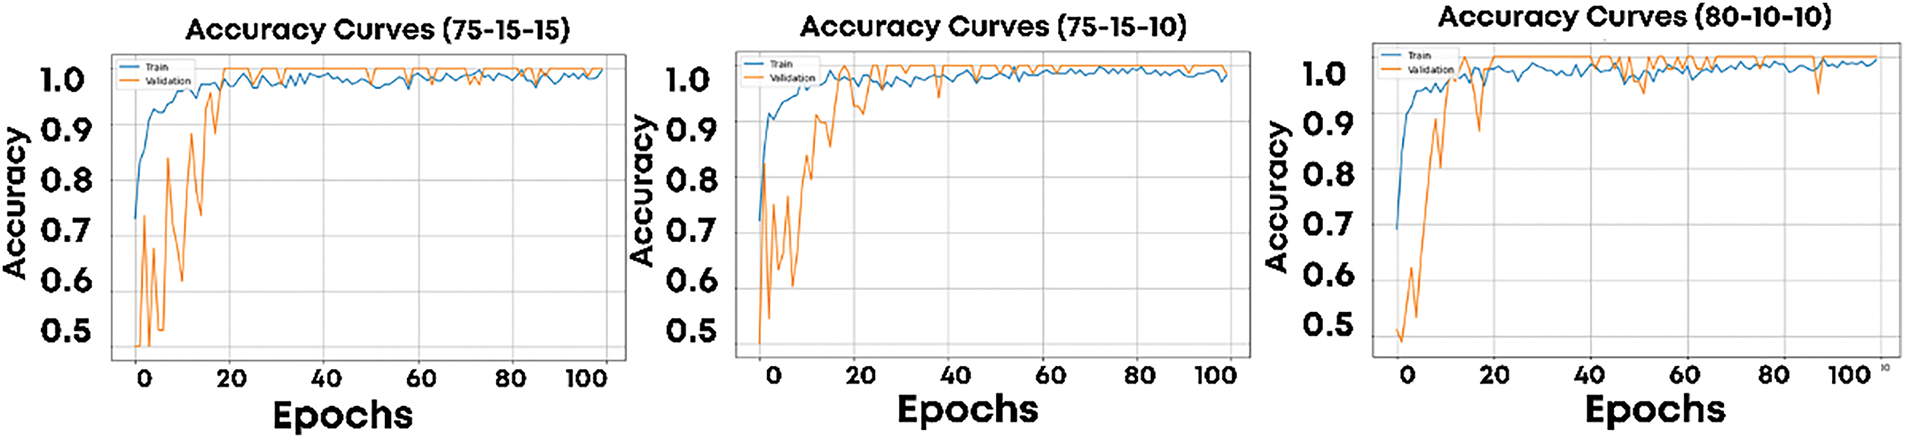
Figure 6: Training and validation accuracy for S1, S2, and S3 dataset splits
In Fig. 5, the loss curves for both training and validation datasets show smooth convergence with minimal fluctuations, indicating consistent learning across epochs. Similarly, Fig. 6 demonstrates stable and steadily improving accuracy for both training and validation datasets. Unlike the results in [16], where validation accuracy fluctuated significantly, the proposed model maintains a stable and high accuracy throughout training. This improvement highlights the effectiveness of batch normalization and learning rate tuning in addressing the instability observed in prior work. Across all three splits, the model exhibits strong performance, with convergence observed within 20–30 epochs for each split. The consistent behavior across S1, S2, and S3 demonstrates the robustness of the proposed model, even when the amount of training data varies.
4.2 Model Testing with Multiple Dataset Splits
The proposed model was evaluated using three dataset splits: S1 (70% training, 15% validation, 15% testing), S2 (75% training, 15% validation, 10% testing), and S3 (80% training, 10% validation, 10% testing). These splits allowed for a thorough assessment of the model’s performance and its ability to generalize under varying data distributions. Table 1 presents a class-wise comparison of precision, recall, and F1-scores between the proposed model and the baseline. The confusion matrices for these splits, shown in Fig. 7, highlight the model’s classification results for both healthy and unhealthy wheat images.
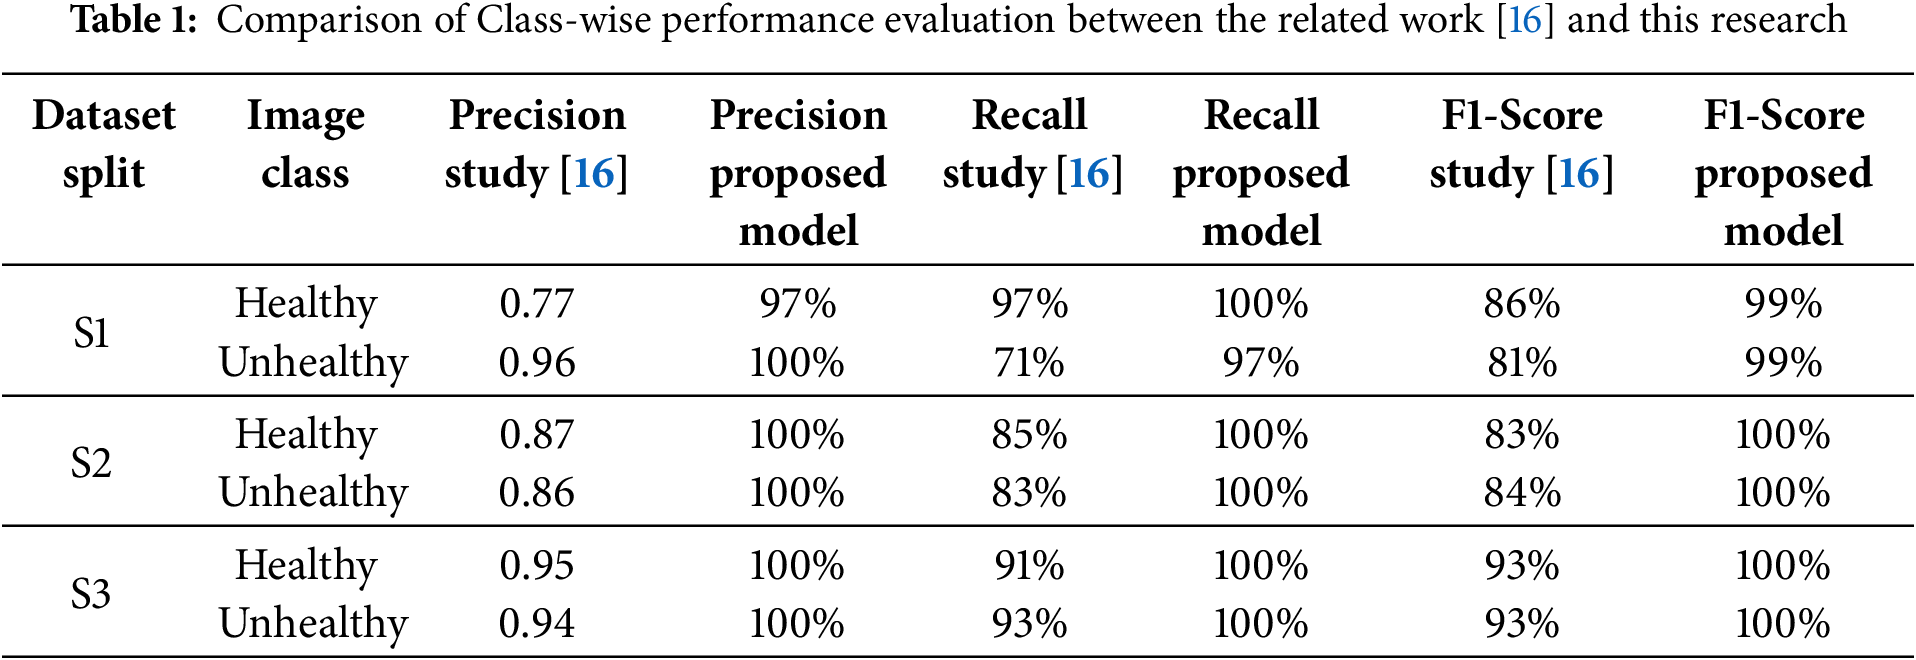
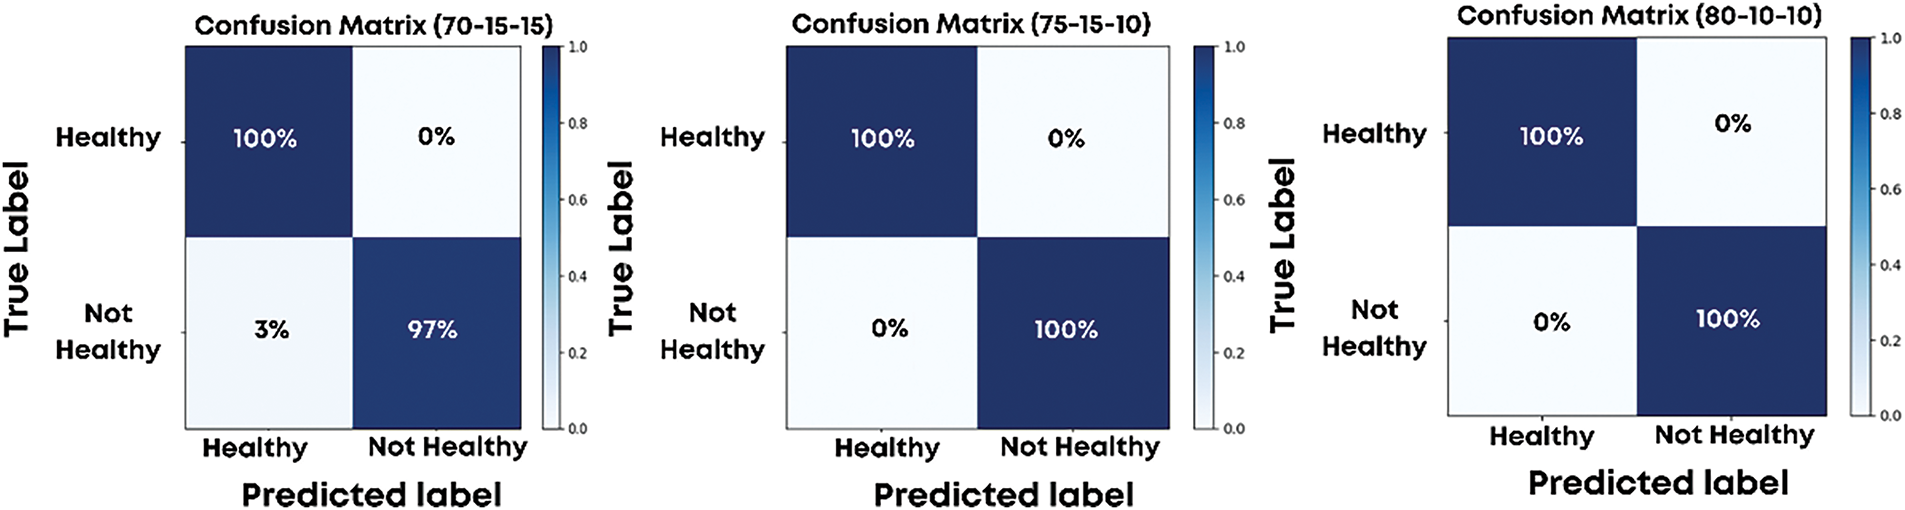
Figure 7: Confusion matrix for S1, S2, and S3 dataset splits
For the S1 split, the model achieved a true positive rate of 1.00 for healthy crops and 0.97 for unhealthy crops, resulting in an overall accuracy of 99%. The class-wise evaluation metrics, including precision, recall, and F1-scores, were consistently high. For the healthy class, precision, recall, and F1-scores were 0.97, 1.00, and 0.99, respectively, while for the unhealthy class, they were 1.00, 0.97, and 0.99. These results demonstrate the model’s ability to accurately classify wheat images with minimal errors.
For the S2 and S3 splits, the model achieved perfect classification, as evident from the confusion matrices showing no false positives or false negatives. The precision, recall, and F1-scores for both healthy and unhealthy classes were 1.00, resulting in a perfect accuracy of 100%. This exemplary performance across splits demonstrates the robustness of the model and its capacity to generalize effectively, even with varying amounts of training and testing data.
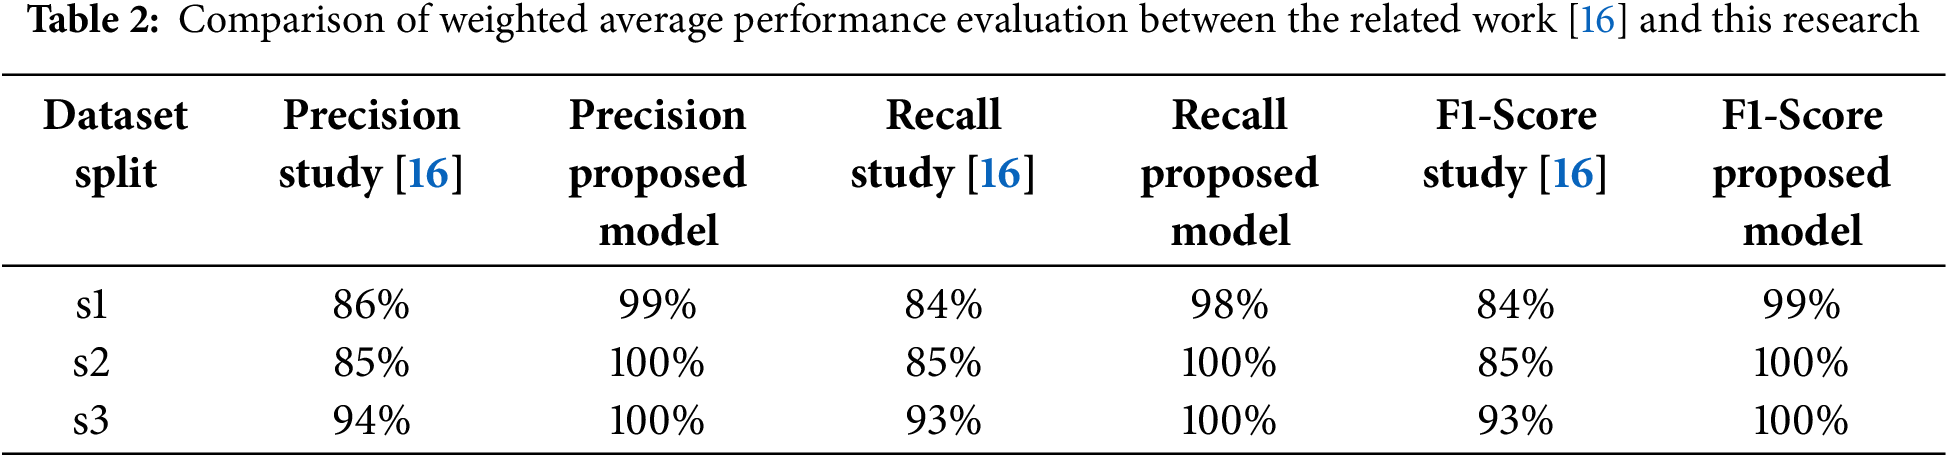
A comparison with the related work in [16], as presented in Table 2, underscores the improvements brought by the proposed model. In particular, the addition of a batch normalization layer and fine-tuning of the learning rate significantly enhanced class-wise metrics, especially for the healthy class, where precision, recall, and F1-scores consistently outperformed the baseline.
The key contributions to these improvements include the integration of batch normalization, which stabilized the learning process by normalizing the inputs to each layer, and a reduced learning rate of 0.0009, which allowed for smaller, more precise updates to the model parameters. Additionally, using dropout layers helped address overfitting concerns, especially given the relatively small dataset of 450 images. These adjustments not only minimized fluctuations in training accuracy but also enhanced the model’s overall stability and performance. The results clearly demonstrate that the proposed model is well-suited for wheat disease classification and can serve as a reliable tool for agricultural applications.
4.3 Comparative Performance with Other Models
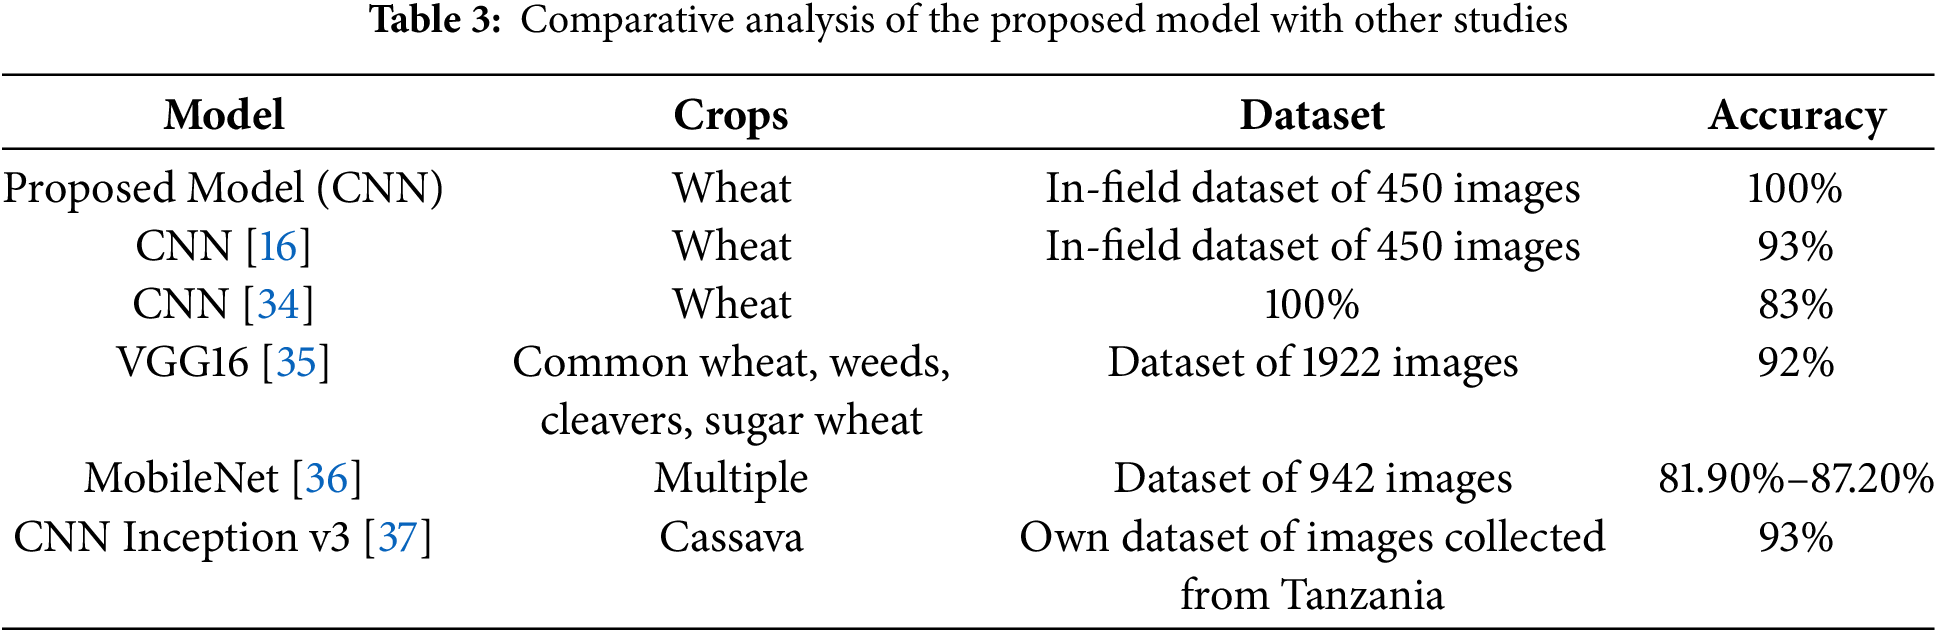
A comparison with other CNN methodologies is provided in Table 3 below for a better understanding of the proposed model’s effectiveness. The comparative metrics of various models, such as dataset size, target crop, and reported accuracy, are included in the table showing where our approach has distinct advantages over the others in wheat disease detection.
Furthermore, the weighted average performance metrics shown in Table 3 reveal similar enhancements, with the proposed model achieving higher precision, recall, and F1-scores across all dataset splits compared to [16]. These improvements validate the effectiveness of the modifications made to the model architecture.
Table 3 shows that the Proposed Model performs better than several other CNN versions. It achieved an accuracy of 100% on its in-field wheat dataset. This accomplishment illustrates the effectiveness of batch normalization, the use of lower learning rates, and dropout techniques to control overfitting even when the dataset size is relatively small.
Also, the variation in dataset size, the target crops, and the reported accuracies demonstrate the necessity of diversity in data and custom-tailored architectural choices. Some models, like CNN [16] try to utilize a more or less similar dataset. Still, their accuracy is lower (93%) due to inadequate adjustment of hyperparameters coupled with insufficient addition of stabilization layers. However, VGG16 [35] and CNN Inception v3 [37] differ since they achieve results above 90% accuracy over different crops, but they differ significantly in designs and contextual datasets. This suggests that no single model outmatches all other models without considering specific domains.
In summary, the flawless accuracy of the model might be considered overfitting, especially when using a small dataset, but strong guarantees of interpretability are provided through LIME and SHAP. Further, a more diverse dataset or other forms of augmentation are suggested to improve generalizability. In any case, the results confirm the potential of our modified CNN design for practical and precise wheat disease detection using image analysis in field agriculture.
4.4 Explainable AI Explanations
In order to make the CNN model’s predictions transparent and interpretable, two XAI methods were used: LIME and SHAP, which provided highly descriptive insights on how the model categorizes wheat crops in healthy and unhealthy states, with entirely complementary views of interpretability on the model.
Instead, LIME was employed to provide localized explanations for the CNN model’s predictions by highlighting specific areas of input images that affected the classification outcome. Results of LIME experiments for healthy and unhealthy wheat images are shown in Fig. 8, where the original images are above the corresponding LIME explanations.
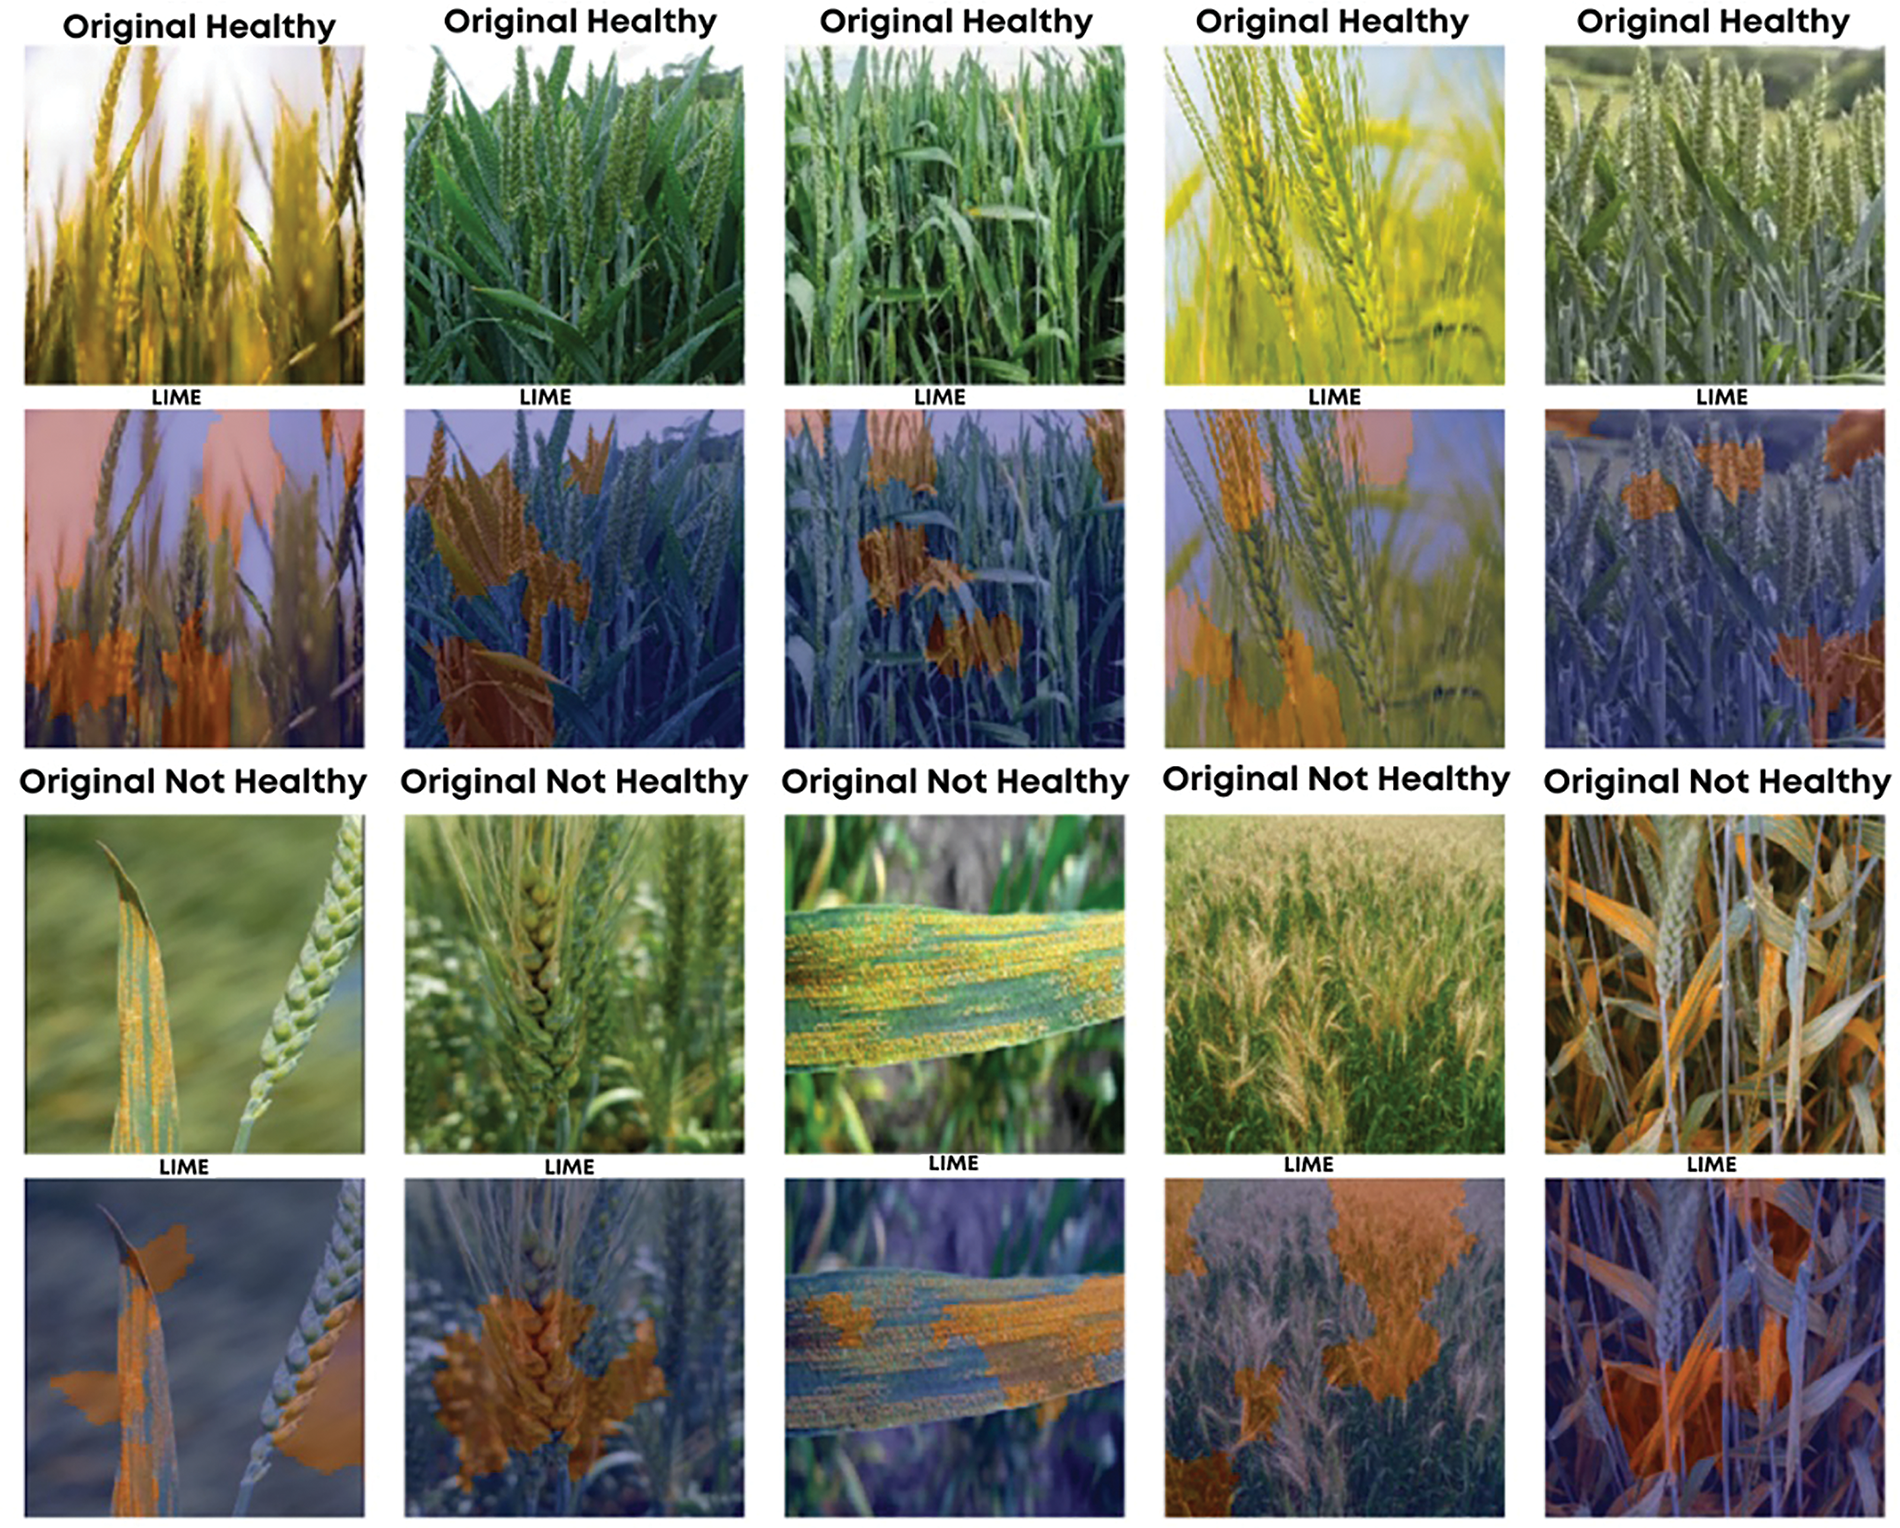
Figure 8: Visualization of healthy and diseased wheat crops with LIME explanations for class predictions
For healthy wheat images, LIME highlighted areas with a distinct green color and structural uniformity among the spikes. Consistent with long-standing domain knowledge, this feature suggests that the model spots meaningful and biologically valid criteria for defining a healthy crop. LIME thus made the model’s decision to classify an image as “healthy” appear well-founded.
Conversely, LIME identified discolorations, rough surfaces, and large patches indicative of diseases like rust or fungal infections as areas of interest for unhealthy wheat images. For example, it highlighted areas with yellowing or brown spots, demonstrating that the model pays attention to some of the most common signs of diseases. Such localized explanations help tie the predictions to the model’s reasoning and provide actionable insights for farmers, who can estimate the extent of disease-affected regions on their farms.
On a broader scale, the LIME outputs reveal crucial spots from the images, improving the model’s overall transparency at an instance-specific level. This can be highly compelling for end-users like farmers and agricultural experts, helping them understand what drives the model’s decisions.
SHAP was also employed to provide both local and global explanations by quantifying the contribution of individual features to the model’s predictions. Fig. 9 presents SHAP visualizations for healthy (left) and unhealthy (right) wheat images. The SHAP color maps overlay the input images, where red regions indicate a positive contribution to the predicted class, and blue regions represent a negative contribution.
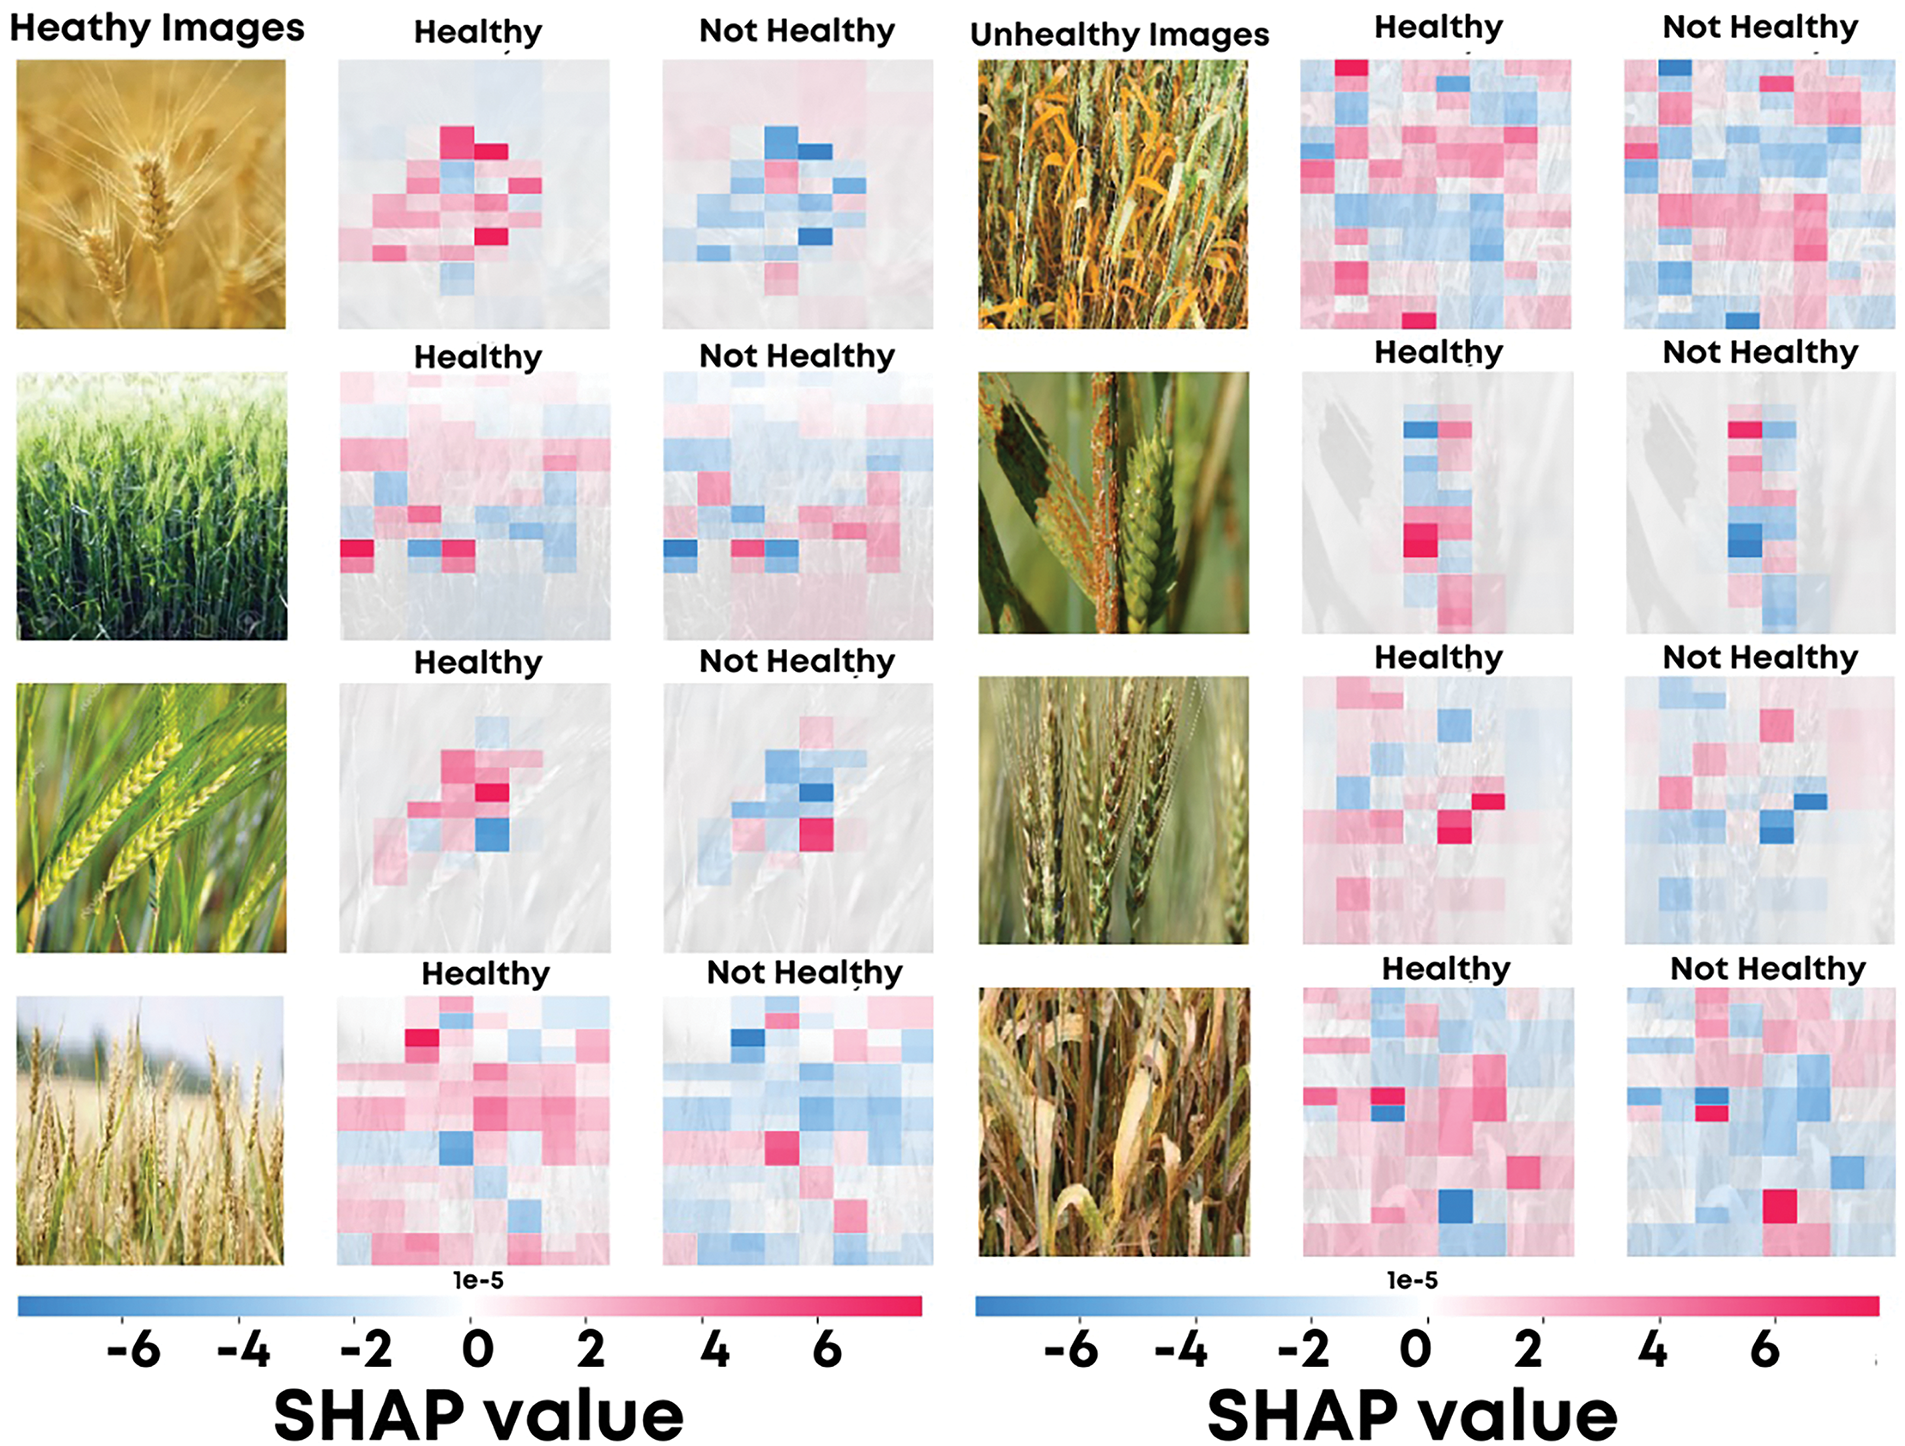
Figure 9: SHAP visualizations showing feature contributions for healthy and unhealthy wheat image classifications
In the context of global and local explanations, SHAP quantified the value of each feature in predicting a model’s output. The SHAP visualizations for healthy and unhealthy wheat images in Fig. 9 use red regions to highlight positive contributions to class predictions, while blue regions show negative contributions.
SHAP maps for healthy wheat images marked regions with green hues, smooth textures, and uniform crop structures. These features contributed significantly to the correct classification of the healthy class, as shown by the red regions in the SHAP maps. This illustrates how the model identifies valid biological patterns for predicting healthy crops.
For unhealthy wheat images, SHAP maps highlighted discolorations, irregular textures, and visible signs of diseases like rust or late blight. These areas indicate where the model extracts features associated with wheat diseases.
Moreover, SHAP provides a top-down view by aggregating the importance of features across the whole dataset. This helps to understand which features the model systematically relies on and to assess the robustness and generalization of the model.
The combined use of SHAP and LIME methods characterized a reliable understanding of the CNN model, enhancing interpretability. LIME captures localized, instance-specific explanations for single images, while SHAP attributes feature contributions at a regional and global scale across the dataset. Together, they improve the interpretability and trustworthiness of the model by demonstrating that its classifications are grounded in biologically meaningful features.
Particularly for agricultural professionals and farmers, the visual explanations provided by LIME and SHAP, as reflected in Figs. 8 and 9, are valuable. They enable users to understand the model’s predictions, identify problematic regions in unhealthy crops, and take informed actions for crop management. This demonstrates convincingly how models can be applied in realistic agricultural settings.
This study provided a comprehensive model of wheat disease classification based on previous understanding from [16]. With the use of batch normalization and an optimized learning rate of 0.0009, training instability was minimized, allowing accurate rates as high as 100% in inevitable data splits. The selected lightweight design aimed at real-time, edge-computing applications critical for practical implementation in resource-constrained farming regions. The conclusion was drawn to emphasize these stability and performance improvements while incorporating contemporary precision agriculture requirements.
Even so, some boundaries were still related to the small size of the data set (450 images) and its limited geographical region. A high rate of dropout of 70%, along with standard augmentation strategies such as flipping and rotation, were used to control overfitting, but the creation of a more expansive and geographically diverse set remains a necessity. In the future, more sophisticated augmentation techniques, like those based on GANs, and larger transfer learning architectures, such as the vision transformer in [38], will be used to improve overfitting resistance. Subsequent refinement of XAI techniques, specifically LIME and SHAP, will also aim toward greater transparency in the classification process to foster trust among end users.
Refinements such as dataset expansion, advanced augmentation, transfer learning, and comprehensive XAI can create a more accurate, stable, and interpretable automated system for wheat disease detection. These endeavors are believed to tremendously improve precision agriculture by providing a reliable and easy-to-use system for crop health management.
Acknowledgement: Not applicable.
Funding Statement: The authors received no specific funding for this study.
Author Contributions: Study conception and design: Hussam Qushtom and Sari Masri; data collection: Hussam Qushtom and Sari Masri; analysis and interpretation of results: Hussam Qushtom and Sari Masri; draft manuscript preparation: Hussam Qushtom, Sari Masri and Ahmad Hasasneh. All authors reviewed the results and approved the final version of the manuscript.
Availability of Data and Materials: The dataset used in this study was obtained directly from the authors of Ref. [16] upon request. This study utilized non-public data provided by Dr. Thabit Sabbah (Al-Quds Open University), which has not yet been released in public repositories. The authors confirm that written authorization was obtained from the original data provider.
Ethics Approval: Not applicable.
Conflicts of Interest: The authors declare no conflicts of interest to report regarding the present study.
References
1. Pawlak K. Food security situation of selected highly developed countries against developing countries. J Agribus Rural Dev. 2016;40(2):385–98. doi:10.17306/JARD.2016.42. [Google Scholar] [CrossRef]
2. Trivelli L, Apicella A, Chiarello F, Rana R, Fantoni G, Tarabella A. From precision agriculture to Industry 4.0: unveiling technological connections in the agrifood sector. Br Food J. 2019;121(8):1730–43. doi:10.1108/BFJ-11-2018-0747. [Google Scholar] [CrossRef]
3. Shadrin D, Menshchikov A, Somov A, Bornemann G, Hauslage J, Fedorov M. Enabling precision agriculture through embedded sensing with artificial intelligence. IEEE Trans Instrum Meas. 2020;69(7):4103–13. doi:10.1109/TIM.2019.2947125. [Google Scholar] [CrossRef]
4. Akintuyi OB. Adaptive AI in precision agriculture: a review: investigating the use of self-learning algorithms in optimizing farm operations based on real-time data. Open Access Res J Multidiscip Stud. 2024;7(2):16–30. doi:10.53022/oarjms.2024.7.2.0023. [Google Scholar] [CrossRef]
5. Chai Y, Senay S, Horvath D, Pardey P. Multi-peril pathogen risks to global wheat production: a probabilistic loss and investment assessment. Front Plant Sci. 2022;13:1034600. doi:10.3389/fpls.2022.1034600. [Google Scholar] [PubMed] [CrossRef]
6. Mabrouk O, Fahim M, Abd El Badeea O, Omara R. The impact of wheat yellow rust on quantitative and qualitative grain yield losses under Egyptian field conditions. Egypt J Phytopathol. 2022;50(1):1–19. doi:10.21608/ejp.2022.117996.1054. [Google Scholar] [CrossRef]
7. Kumari N, Saini BS. Fully automatic wheat disease detection system by using different CNN models. In: Shakya S, Du KL, Ntalianis K, editors. Sentiment analysis and deep learning. Singapore: Springer Nature; 2023. p. 351–65. [Google Scholar]
8. Nigam S, Jain R, Singh VK, Marwaha S, Arora A, Jain S. EfficientNet architecture and attention mechanism-based wheat disease identification model. Procedia Comput Sci. 2024;235(2):383–93. doi:10.1016/j.procs.2024.04.038. [Google Scholar] [CrossRef]
9. Sheenam S, Khattar S, Verma T. Automated wheat plant disease detection using deep learning: a multi-class classification approach. In: Proceedings of the 2023 3rd International Conference on Intelligent Technologies (CONIT); 2023 Jun 23–25; Hubli, India. [Google Scholar]
10. Chandu HP, Gayam V, Kotipalli KD, Ramireddygari P, Tokala S, Enduri MK. Machine and deep learning approaches for crop disease detection: an in-depth analysis. In: Proceedings of the 2024 IEEE 9th International Conference for Convergence in Technology (I2CT); 2024 Apr 5–7; Pune, India. [Google Scholar]
11. Uzhinskiy A, Ososkov G, Goncharov P, Nechaevskiy A. Multifunctional platform and mobile application for plant disease detection. CEUR Workshop Proc. 2019;2507:110–4. [Google Scholar]
12. Tripathy SS, Poddar R, Satapathy L, Mukhopadhyay K. Chapter 35—Image processing-based artificial intelligence system for rapid detection of plant diseases. In: Sharma P, Yadav D, Gaur RK, editors. Bioinformatics in agriculture. Amsterdam, The Netherlands: Elsevier; 2022. p. 619–24. [Google Scholar]
13. Arulmurugan S, Bharathkumar V, Gokulachandru S, Mohamad Yusuf M. Plant guard: AI-enhanced plant diseases detection for sustainable agriculture. In: Proceedings of the 2024 International Conference on Inventive Computation Technologies (ICICT); 2024 Apr 24–26; Lalitpur, Nepal. [Google Scholar]
14. Harakannanavar SS, Rudagi JM, Puranikmath VI, Siddiqua A, Pramodhini R. Plant leaf disease detection using computer vision and machine learning algorithms. Glob Transit Proc. 2022;3(1):305–10. doi:10.1016/j.gltp.2022.03.016. [Google Scholar] [CrossRef]
15. Khan H, Haq IU, Munsif M, Mustaqeem, Khan SU, Lee MY. Automated wheat diseases classification framework using advanced machine learning technique. Agriculture. 2022;12(8):1226. doi:10.3390/agriculture12081226. [Google Scholar] [CrossRef]
16. Ashraf M, Abrar M, Qadeer N, Alshdadi A, Sabbah T, Attique Khan M. A convolutional neural network model for wheat crop disease prediction. Comput Mater Contin. 2023;75(2):3867–82. doi:10.32604/cmc.2023.035498. [Google Scholar] [CrossRef]
17. Fang X, Zhen T, Li Z. Lightweight multiscale CNN model for wheat disease detection. Appl Sci. 2023;13(9):5801. doi:10.3390/app13095801. [Google Scholar] [CrossRef]
18. Bao W, Yang X, Liang D, Hu G, Yang X. Lightweight convolutional neural network model for field wheat ear disease identification. Comput Electron Agric. 2021;189(4):106367. doi:10.1016/j.compag.2021.106367. [Google Scholar] [CrossRef]
19. Goyal L, Sharma CM, Singh A, Singh PK. Leaf and spike wheat disease detection & classification using an improved deep convolutional architecture. Inform Med Unlocked. 2021;25(2):100642. doi:10.1016/j.imu.2021.100642. [Google Scholar] [CrossRef]
20. Hossen M, Mohibullah M, Muzammel C, Ahmed T, Acharjee S, Panna M. Wheat diseases detection and classification using convolutional neural network (CNN). Int J Adv Comput Sci Appl. 2022;13:719–26. doi:10.14569/issn.2156-5570. [Google Scholar] [CrossRef]
21. Pokkuluri KS, Nedunuri SUD, Devi U. Crop disease prediction with convolution neural network (CNN) augmented with cellular automata. Int Arab J Inf Technol. 2022;19(5):765–73. doi:10.34028/iajit. [Google Scholar] [CrossRef]
22. Sharma R, Singh A, Jhanjhi NZ, Masud M, Jaha E, Verma S. Plant disease diagnosis and image classification using deep learning. Comput Mater Contin. 2021;71:2125–40. doi:10.32604/cmc.2022.020017. [Google Scholar] [CrossRef]
23. Nigam S, Jain R, Marwaha S, Arora A, Haque MA, Dheeraj A, et al. Deep transfer learning model for disease identification in wheat crop. Ecol Inform. 2023;75(1):102068. doi:10.1016/j.ecoinf.2023.102068. [Google Scholar] [CrossRef]
24. Kumar D, Kukreja V. N-CNN based transfer learning method for classification of powdery mildew wheat disease. In: Proceedings of the 2021 International Conference on Emerging Smart Computing and Informatics (ESCI); 2021 Mar 5–7; Pune, India. [Google Scholar]
25. Latif G, Abdelhamid SE, Mallouhy RE, Alghazo J, Kazimi ZA. Deep learning utilization in agriculture: detection of rice plant diseases using an improved CNN model. Plants. 2022;11(17):2230. doi:10.3390/plants11172230. [Google Scholar] [PubMed] [CrossRef]
26. Islam M, Adil MAA, Talukder A, Ahamed KU, Uddin MA, Hasan K, et al. DeepCrop: deep learning-based crop disease prediction with web application. J Agric Food Res. 2023;14(4):100764. doi:10.1016/j.jafr.2023.100764. [Google Scholar] [CrossRef]
27. Sood S, Singh H, Jindal S, Sood S, Singh H, Jindal S. Rust disease classification using deep learning based algorithm: the case of wheat. In: Ribeiro-Barros AI, Tevera DS, Goulao LF, Tivana LD, editors. Food systems resilience. London, UK: IntechOpen; 2022. p. 197–230. [Google Scholar]
28. Moupojou E, Tagne A, Retraint F, Tadonkemwa A, Wilfried D, Tapamo H, et al. FieldPlant: a dataset of field plant images for plant disease detection and classification with deep learning. IEEE Access. 2023;11:35398–410. doi:10.1109/ACCESS.2023.3263042. [Google Scholar] [CrossRef]
29. Jiang J, Liu H, Zhao C, He C, Ma J, Cheng T, et al. Evaluation of diverse convolutional neural networks and training strategies for wheat leaf disease identification with field-acquired photographs. Remote Sens. 2022;14(14):3446. doi:10.3390/rs14143446. [Google Scholar] [CrossRef]
30. Patil P, Pamali SK, Devagiri SB, Sushma AS, Mirje J. Plant leaf disease detection using XAI. In: Proceedings of the 2024 3rd International Conference on Artificial Intelligence for Internet of Things (AIIoT); 2024 May 3–4; Vellore, India. doi:10.1109/AIIoT58432.2024.10574617. [Google Scholar] [CrossRef]
31. Lysov M, Pukhkiy K, Vasiliev E, Getmanskaya A, Turlapov V. Ensuring explainability and dimensionality reduction in a multidimensional HSI world for early XAI-diagnostics of plant stress. Entropy. 2023;25(5):801. doi:10.3390/e25050801. [Google Scholar] [PubMed] [CrossRef]
32. Lundberg S, Lee SI. A unified approach to interpreting model predictions. arXiv:1705.07874v2. 2017. [Google Scholar]
33. Ribeiro MT, Singh S, Guestrin C. Why should I trust you?: explaining the predictions of any classifier. In: Proceedings of the 22nd ACM SIGKDD International Conference on Knowledge Discovery and Data Mining; 2016 Aug 13–17; San Francisco, CA, USA. [Google Scholar]
34. Maqsood MH, Mumtaz R, Haq IU, Shafi U, Zaidi SMH, Hafeez M. Super resolution generative adversarial network (SRGANS) for wheat stripe rust classification. Sensors. 2021;21(23):7903. doi:10.3390/s21237903. [Google Scholar] [PubMed] [CrossRef]
35. Dnvsls I, Sumallika SMT, Sudha M. An artificial intelligence based weed classification using VGG16 classifier and rmsprop optimizer. J Theor Appl Inf Technol. 2022;100(6):1806–16. [Google Scholar]
36. Xiong Y, Liang L, Wang L, She J, Wu M. Identification of cash crop diseases using automatic image segmentation algorithm and deep learning with expanded dataset. Comput Electron Agric. 2020;177(4):105712. doi:10.1016/j.compag.2020.105712. [Google Scholar] [CrossRef]
37. Ramcharan A, Baranowski K, McCloskey P, Ahmed B, Legg J, Hughes DP. Deep learning for image-based cassava disease detection. Front Plant Sci. 2017;8:1–7. doi:10.3389/fpls.2017.01852. [Google Scholar] [PubMed] [CrossRef]
38. Sari M, Ahmad H, Mohammed T, Chakib T. Exploring the impact of image-based audio representations in classification tasks using vision transformers and explainable AI techniques. Information. 2024;15(12):751. doi:10.3390/info15120751. [Google Scholar] [CrossRef]
Cite This Article
 Copyright © 2025 The Author(s). Published by Tech Science Press.
This work is licensed under a Creative Commons Attribution 4.0 International License , which permits unrestricted use, distribution, and reproduction in any medium, provided the original work is properly cited.
 Downloads
 Citation Tools