
 Submit a Paper
 Propose a Special lssue
 Open Access
ARTICLE
Salient Features Guided Augmentation for Enhanced Deep Learning Classification in Hematoxylin and Eosin Images
1 School of Information, North China University of Technology, Beijing, 100144, China
2 Department of Computer and Information Science, University of Macau, Macau SAR, 999078, China
3 Department of Artificial Intelligence, Chongqing Technology and Business University, Chongqing, 400067, China
4 Department of Mathematics, University of Macau, Macau SAR, 999078, China
5 Computer Science Department, Lakehead University, Thunder Bay, ON P7B 5E1, Canada
6 School of Computer Science and Engineering, South China University of Technology, Guangzhou, 510640, China
7 Beijing National Research Center for Information Science and Technology, Tsinghua University, Beijing, 100084, China
* Corresponding Author: Tengyue Li. Email:
Computers, Materials & Continua 2025, 84(1), 1711-1730. https://doi.org/10.32604/cmc.2025.062489
Received 19 December 2024; Accepted 10 February 2025; Issue published 09 June 2025
 View Full Text
 Download PDF
Abstract
Hematoxylin and Eosin (H&E) images, popularly used in the field of digital pathology, often pose challenges due to their limited color richness, hindering the differentiation of subtle cell features crucial for accurate classification. Enhancing the visibility of these elusive cell features helps train robust deep-learning models. However, the selection and application of image processing techniques for such enhancement have not been systematically explored in the research community. To address this challenge, we introduce Salient Features Guided Augmentation (SFGA), an approach that strategically integrates machine learning and image processing. SFGA utilizes machine learning algorithms to identify crucial features within cell images, subsequently mapping these features to appropriate image processing techniques to enhance training images. By emphasizing salient features and aligning them with corresponding image processing methods, SFGA is designed to enhance the discriminating power of deep learning models in cell classification tasks. Our research undertakes a series of experiments, each exploring the performance of different datasets and data enhancement techniques in classifying cell types, highlighting the significance of data quality and enhancement in mitigating overfitting and distinguishing cell characteristics. Specifically, SFGA focuses on identifying tumor cells from tissue for extranodal extension detection, with the SFGA-enhanced dataset showing notable advantages in accuracy. We conducted a preliminary study of five experiments, among which the accuracy of the pleomorphism experiment improved significantly from 50.81% to 95.15%. The accuracy of the other four experiments also increased, with improvements ranging from 3 to 43 percentage points. Our preliminary study shows the possibilities to enhance the diagnostic accuracy of deep learning models and proposes a systematic approach that could enhance cancer diagnosis, contributing as a first step in using SFGA in medical image enhancement.Keywords
Tumour condition evaluation, deep learning is being used as a function to recognize cells and other objects of interest at cell level over a H&E image as accurate as possible. So, achieving high classification performance is a key objective. The effectiveness of a deep learning model is significantly influenced by the quality and variety of the training data. In order to improve model accuracy, researchers have explored various techniques for enhancing training images. Our proposed method is called Salient Features Guided Augmentation (SFGA), which leverages machine learning and image processing to enhance the salient features in training images, thereby improving the discriminating power of deep learning models.
The motivation for utilizing enhanced training images in deep learning training arises from the challenge of distinguishing subtly appearing cell features on H&E image tiles. Deep learning models are designed to learn the patterns and features that differentiate between different cell types. However, these features, such as morphology and structural characteristics, are inherently subtle and can be difficult to discern in images extracted as small square tiles from H&E images [1–4].
One of the main limitations of H&E images is their limited colour richness, which can hinder the visibility of crucial cell features. Moreover, the manifestation of these cell features on images is often noisy, unstructured, and messy, further complicating their distinguishability. To overcome these challenges and enhance the discriminating power of deep learning models, image processing methods can be employed to improve the visibility and clarity of these cell features.
Image processing methods can be used to make the relevant features from the H&E images outstanding, which can then be utilized as prominent information in the training process. These remarkable features can capture specific characteristics of cell structures and morphology, providing valuable insights to the deep learning model. Feature enhancement techniques, such as edge detection, texture analysis, or shape analysis, can be applied to identify and quantify important features that may not be readily distinguishable by visual inspection alone.
However, the exploration of which image processing techniques should be used for different types of cell classifications, corresponding to specific cell features, has not been extensively investigated in the research community. This area remains relatively unexplored, lacking an unanimously agreed-upon standard for mapping cell features to appropriate image processing techniques. As a result, there is a need to address this knowledge gap and establish a consistent framework.
To address this challenge, we propose the concept of “guided augmentation.” This approach initially involves fast and simple machine learning techniques to identify relevant cell features from the cell image samples. By identifying these salient features, we can determine which image processing techniques should be employed to enhance the training samples effectively. In essence, the selection of image processing techniques is guided by the salient features discovered from each new cell image sample.
By employing this guided augmentation approach, we ensure that the chosen image processing techniques align effectively with the identified salient features. This pairing is crucial in enhancing the training samples to highlight and emphasize the discriminative aspects of the cell features. It ensures that the image processing techniques are selected purposefully and contribute to improving the overall discriminating power of the deep learning model. Fig. 1 shows the design of the SFGA framework.
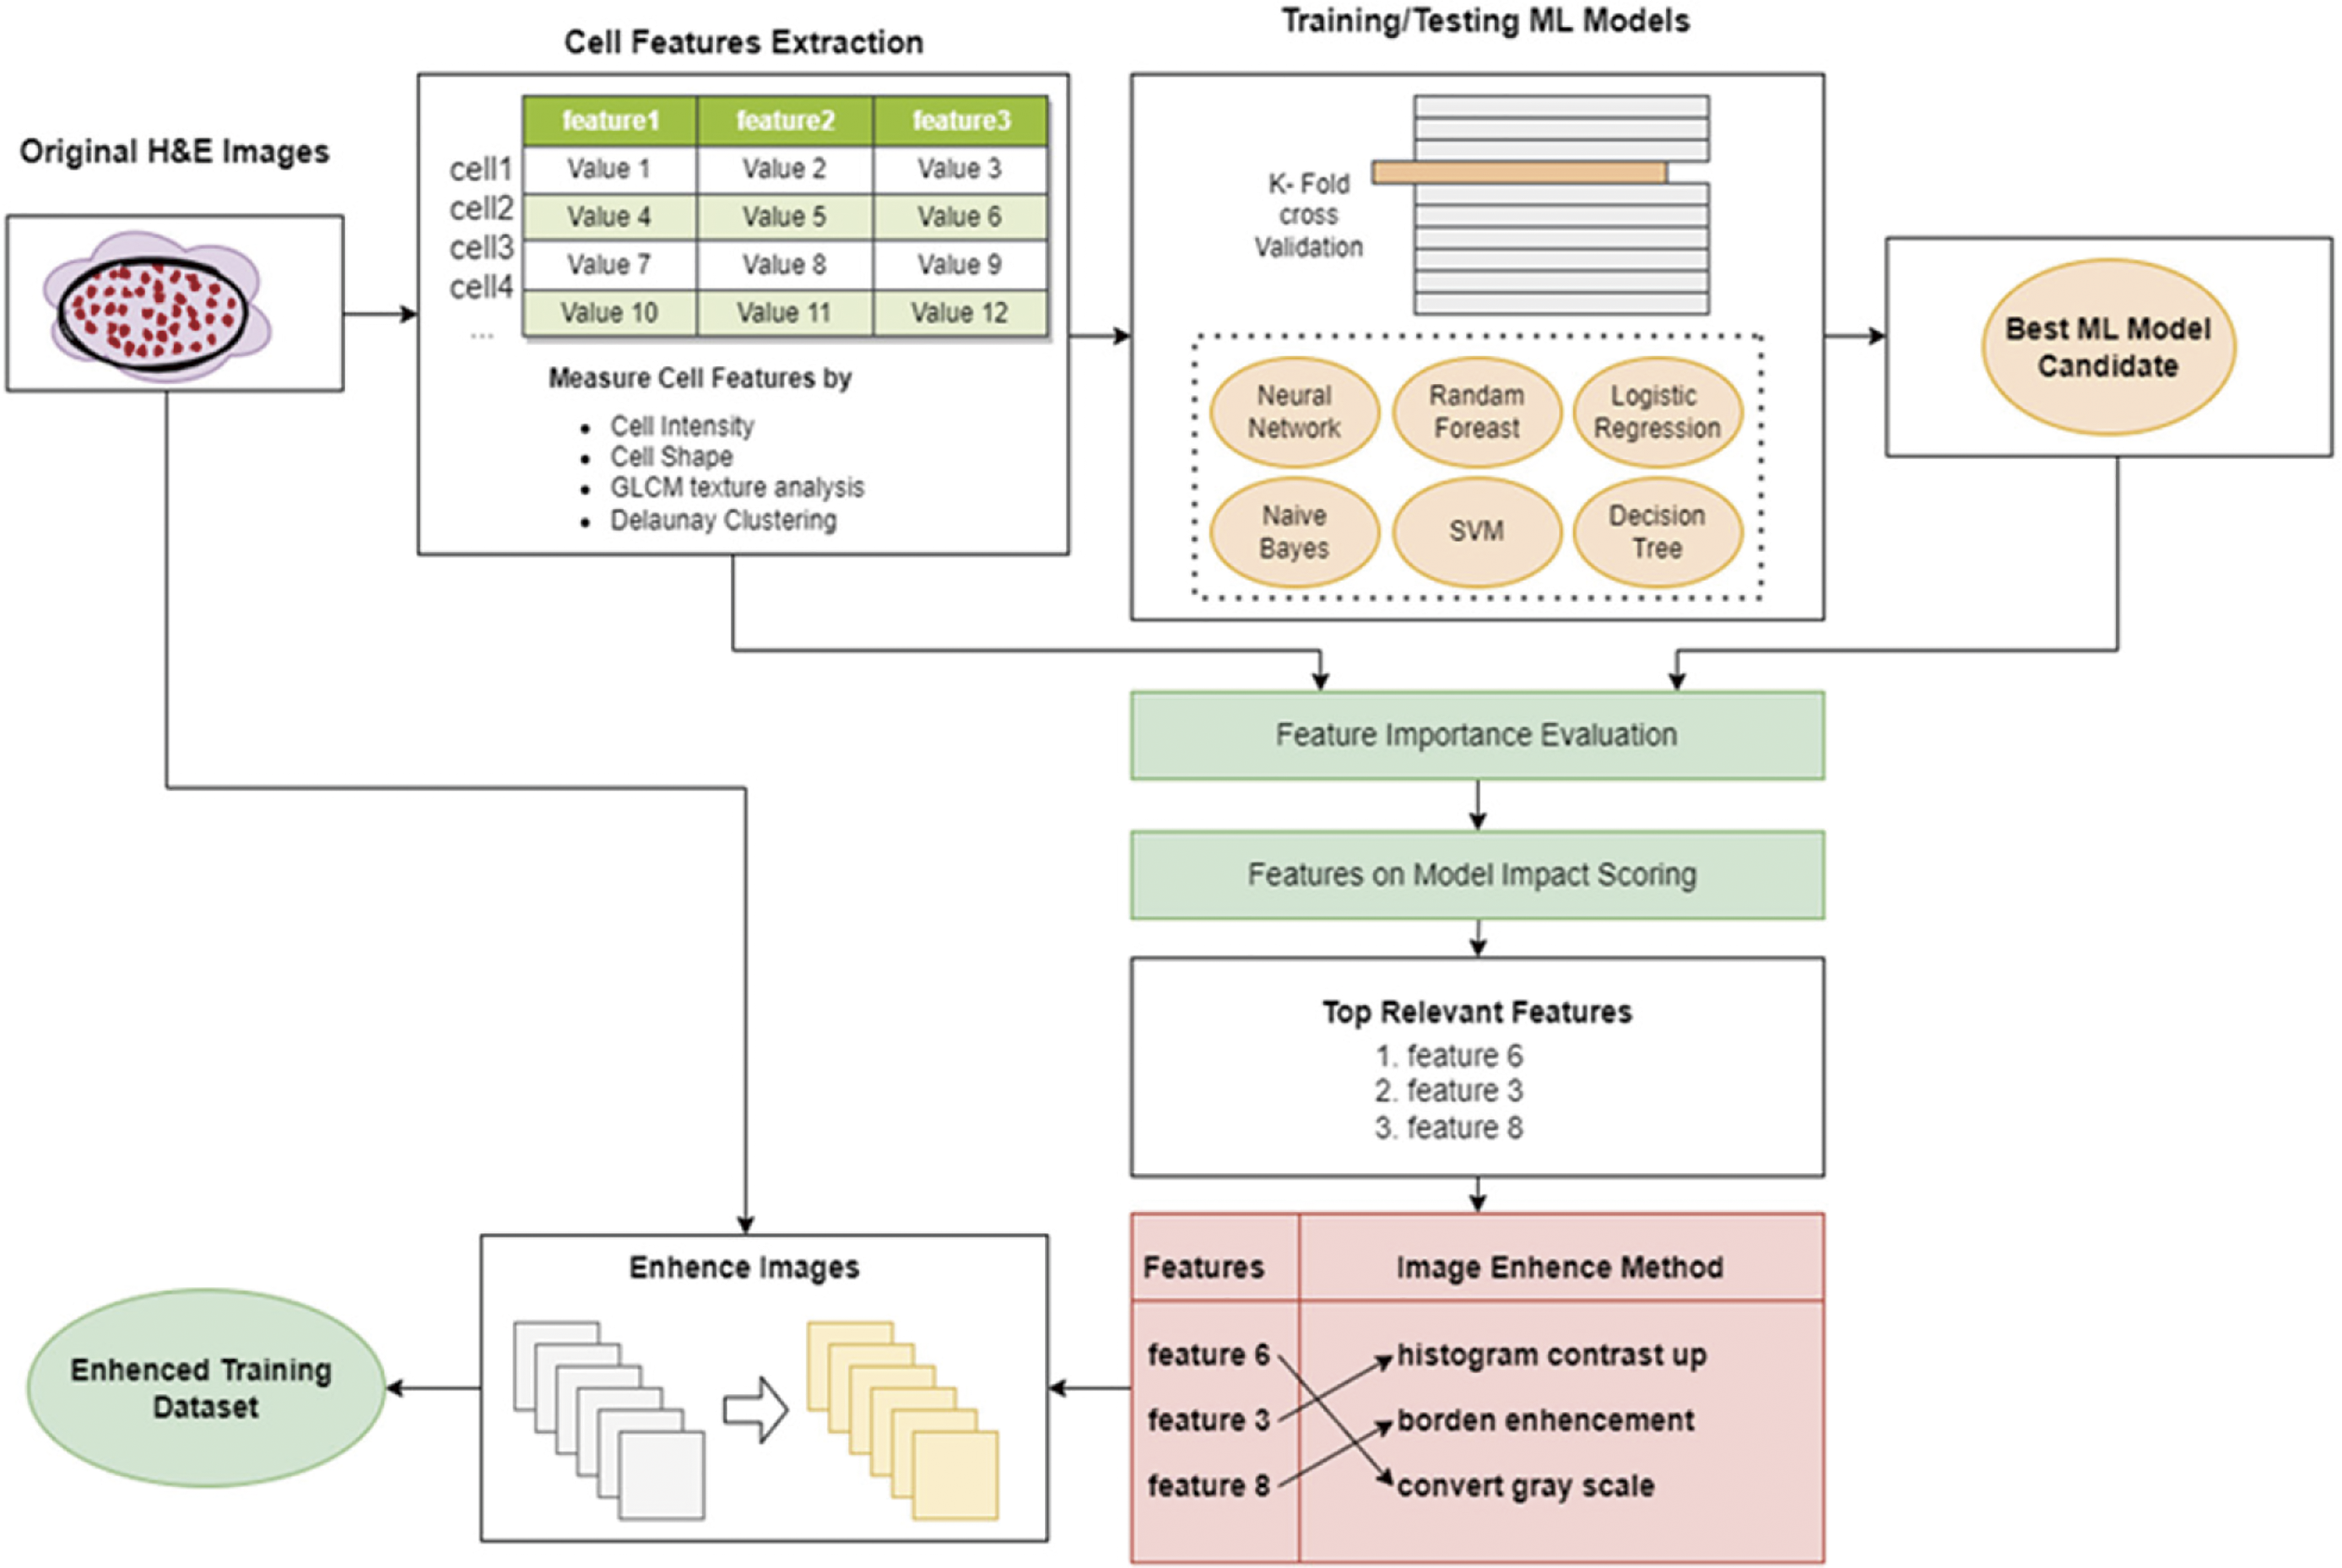
Figure 1: The design of DL-SFGA framework
By adopting this guided augmentation methodology, researchers can establish a more systematic and consistent approach to selecting and applying image processing techniques in conjunction with the identified salient features. As a result, the deep learning model can better capture these subtle differences and achieve improved classification performance.
Cell detection tasks rely heavily on feature extraction and enhancement methods. These methods include texture, color, and shape features as well as Histogram of Oriented Gradients (HOG) features, deep activation features, and multi-scale feature extraction [5–9]. By using these methods, the accuracy of cell detection and classification tasks can be improved [10–13].
Several methods have been proposed to achieve precise segmentation of cervical cell nuclei and cytoplasm. One such method [14] combines Multi-Scale Convolutional Networks (MSCN) and graph segmentation, achieving an accuracy rate of 93.5% and 92.7% for nucleus and cytoplasm segmentation, respectively. Deep Convolutional Neural Networks (CNN) have also been used to segment and classify epithelial and stromal regions in histopathological tissue images. Color histogram and color moment methods are employed to extract cell color features, with high accuracy rates compared to other methods [15].
A comprehensive review article [16] covers various methods, including shape feature extraction methods such as edge detection and shape descriptors like Hu moments, for cell nucleus detection, segmentation, and classification. Additionally, some methods employ Histogram of Oriented Gradients (HOG) features to capture local shape information.
For example, a CNN-based approach [17] has been proposed to detect invasive ductal carcinoma, achieving superior detection performance compared to traditional approaches. Another method [18] uses pre-trained deep CNNs (e.g., VGG, ResNet) to extract deep activation features to detect and classify cell nuclei in routine colon cancer tissues. A multi-scale feature extraction method, which employs HOG and SIFT, has also been proposed to automatically segment mutually contacting cells in breast cancer histopathological images, with promising results.
However, in recent years, research on feature extraction and enhancement methods has been relatively limited, primarily due to the rapid development of deep learning techniques, particularly CNNs. Neural networks can automatically learn features in images, diminishing the significance of manually designed feature extraction and enhancement methods. Many researchers have shifted their focus towards designing more efficient and accurate neural network architectures to extract useful features directly from raw images [19]. Nevertheless, feature extraction and enhancement methods still hold value in certain scenarios. For instance, in situations with limited data or imbalanced categories, feature extraction and enhancement methods can aid in improving model performance. Furthermore, task-specific feature extraction and enhancement methods may complement deep learning models, enhancing their accuracy in specific domains. Overall, while deep learning has largely replaced traditional feature extraction and enhancement methods, these methods still hold value in certain contexts. The proper application of both deep learning and traditional feature extraction and enhancement methods is crucial for effectively training robust deep learning models on a given dataset. However, the research community has not systematically explored the selection and application of such enhanced image processing techniques, necessitating the need for a well-defined and consistent framework. Therefore, we propose the SFGA approach.
The SFGA approach selects the best machine learning algorithm from a group of algorithms. This algorithm is the one that can best understand the dataset. We then use feature importance ranking strategies to rank the most important features using that algorithm. By using these strategies, we can quickly determine the most important features out of 200.
The second feature strategy uses the SHAP algorithm, which provides a measure of feature importance specifically for linear models when dealing with multicollinearity. The salient features are extracted from the training samples, providing insights into the distinctive characteristics that aid in classification.
Once the salient features are identified, the SFGA method maps these features to corresponding image processing techniques to enhance the training images. The objective is to emphasize and highlight the salient features, making them more prominent and distinguishable. By augmenting the training images in a way that enhances the discriminative features, the deep learning model can learn more effectively and improve its classification performance.
To achieve this, SFGA applies various image processing methods that align with the salient features identified by the machine learning algorithm. These methods include contrast enhancement, edge enhancement, texture enhancement, color enhancement.
By incorporating these image processing techniques based on the identified salient features, the SFGA method enhances the training images, thereby improving the deep learning model’s discriminating power. The augmented training dataset, with enhanced salient features, is then used to retrain the deep learning model, allowing it to learn more effectively and make more accurate classifications.
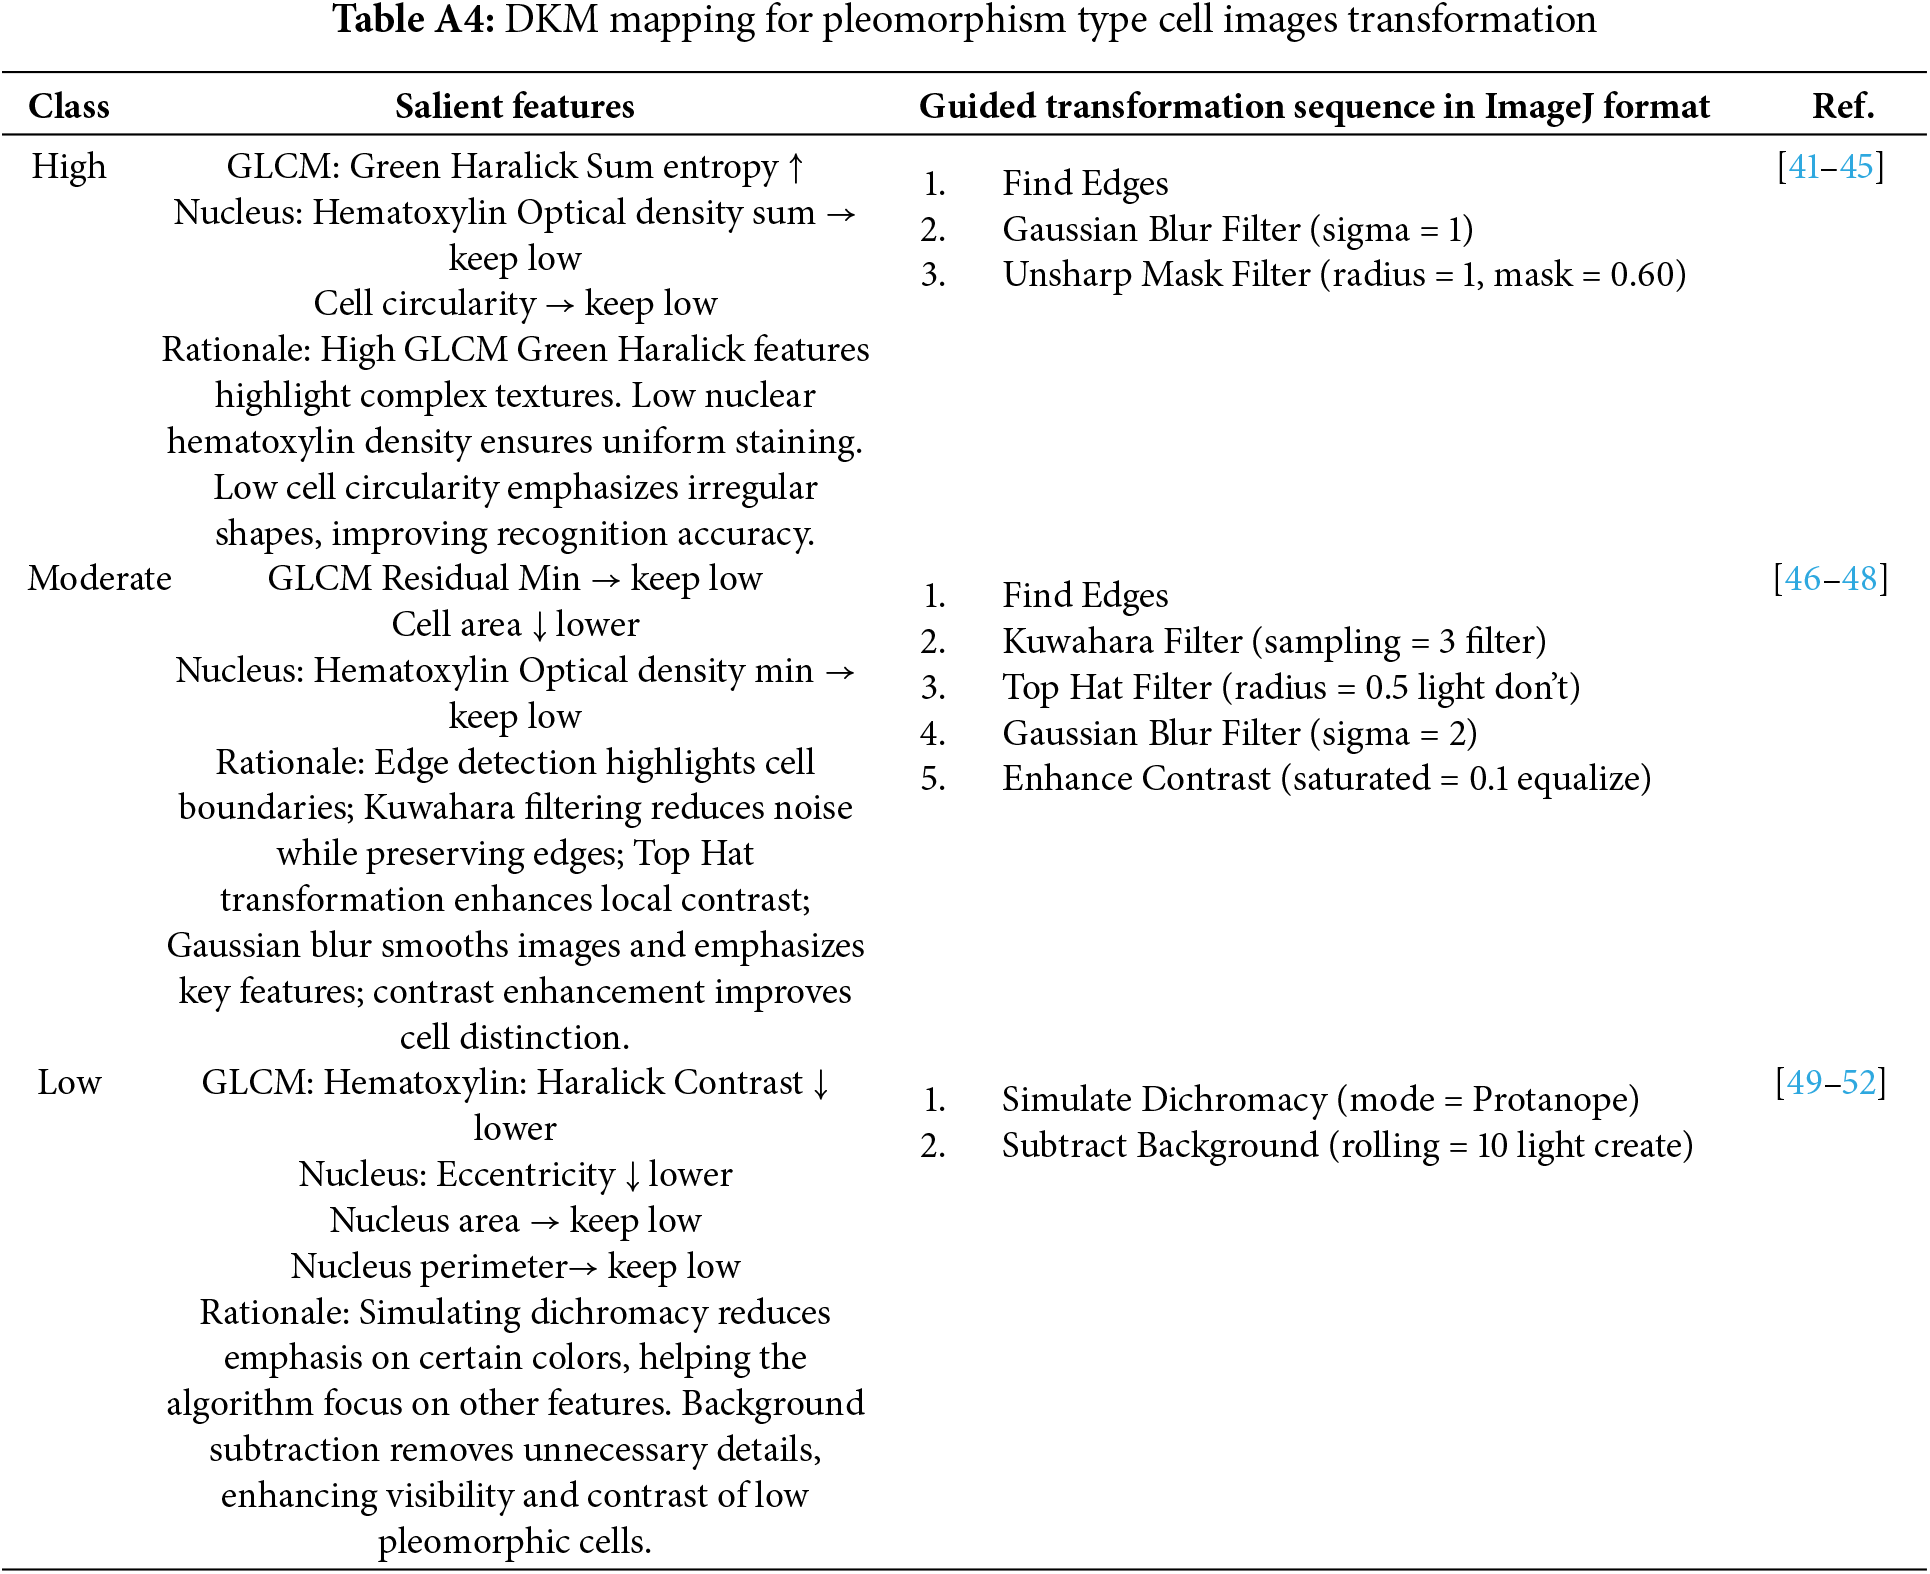
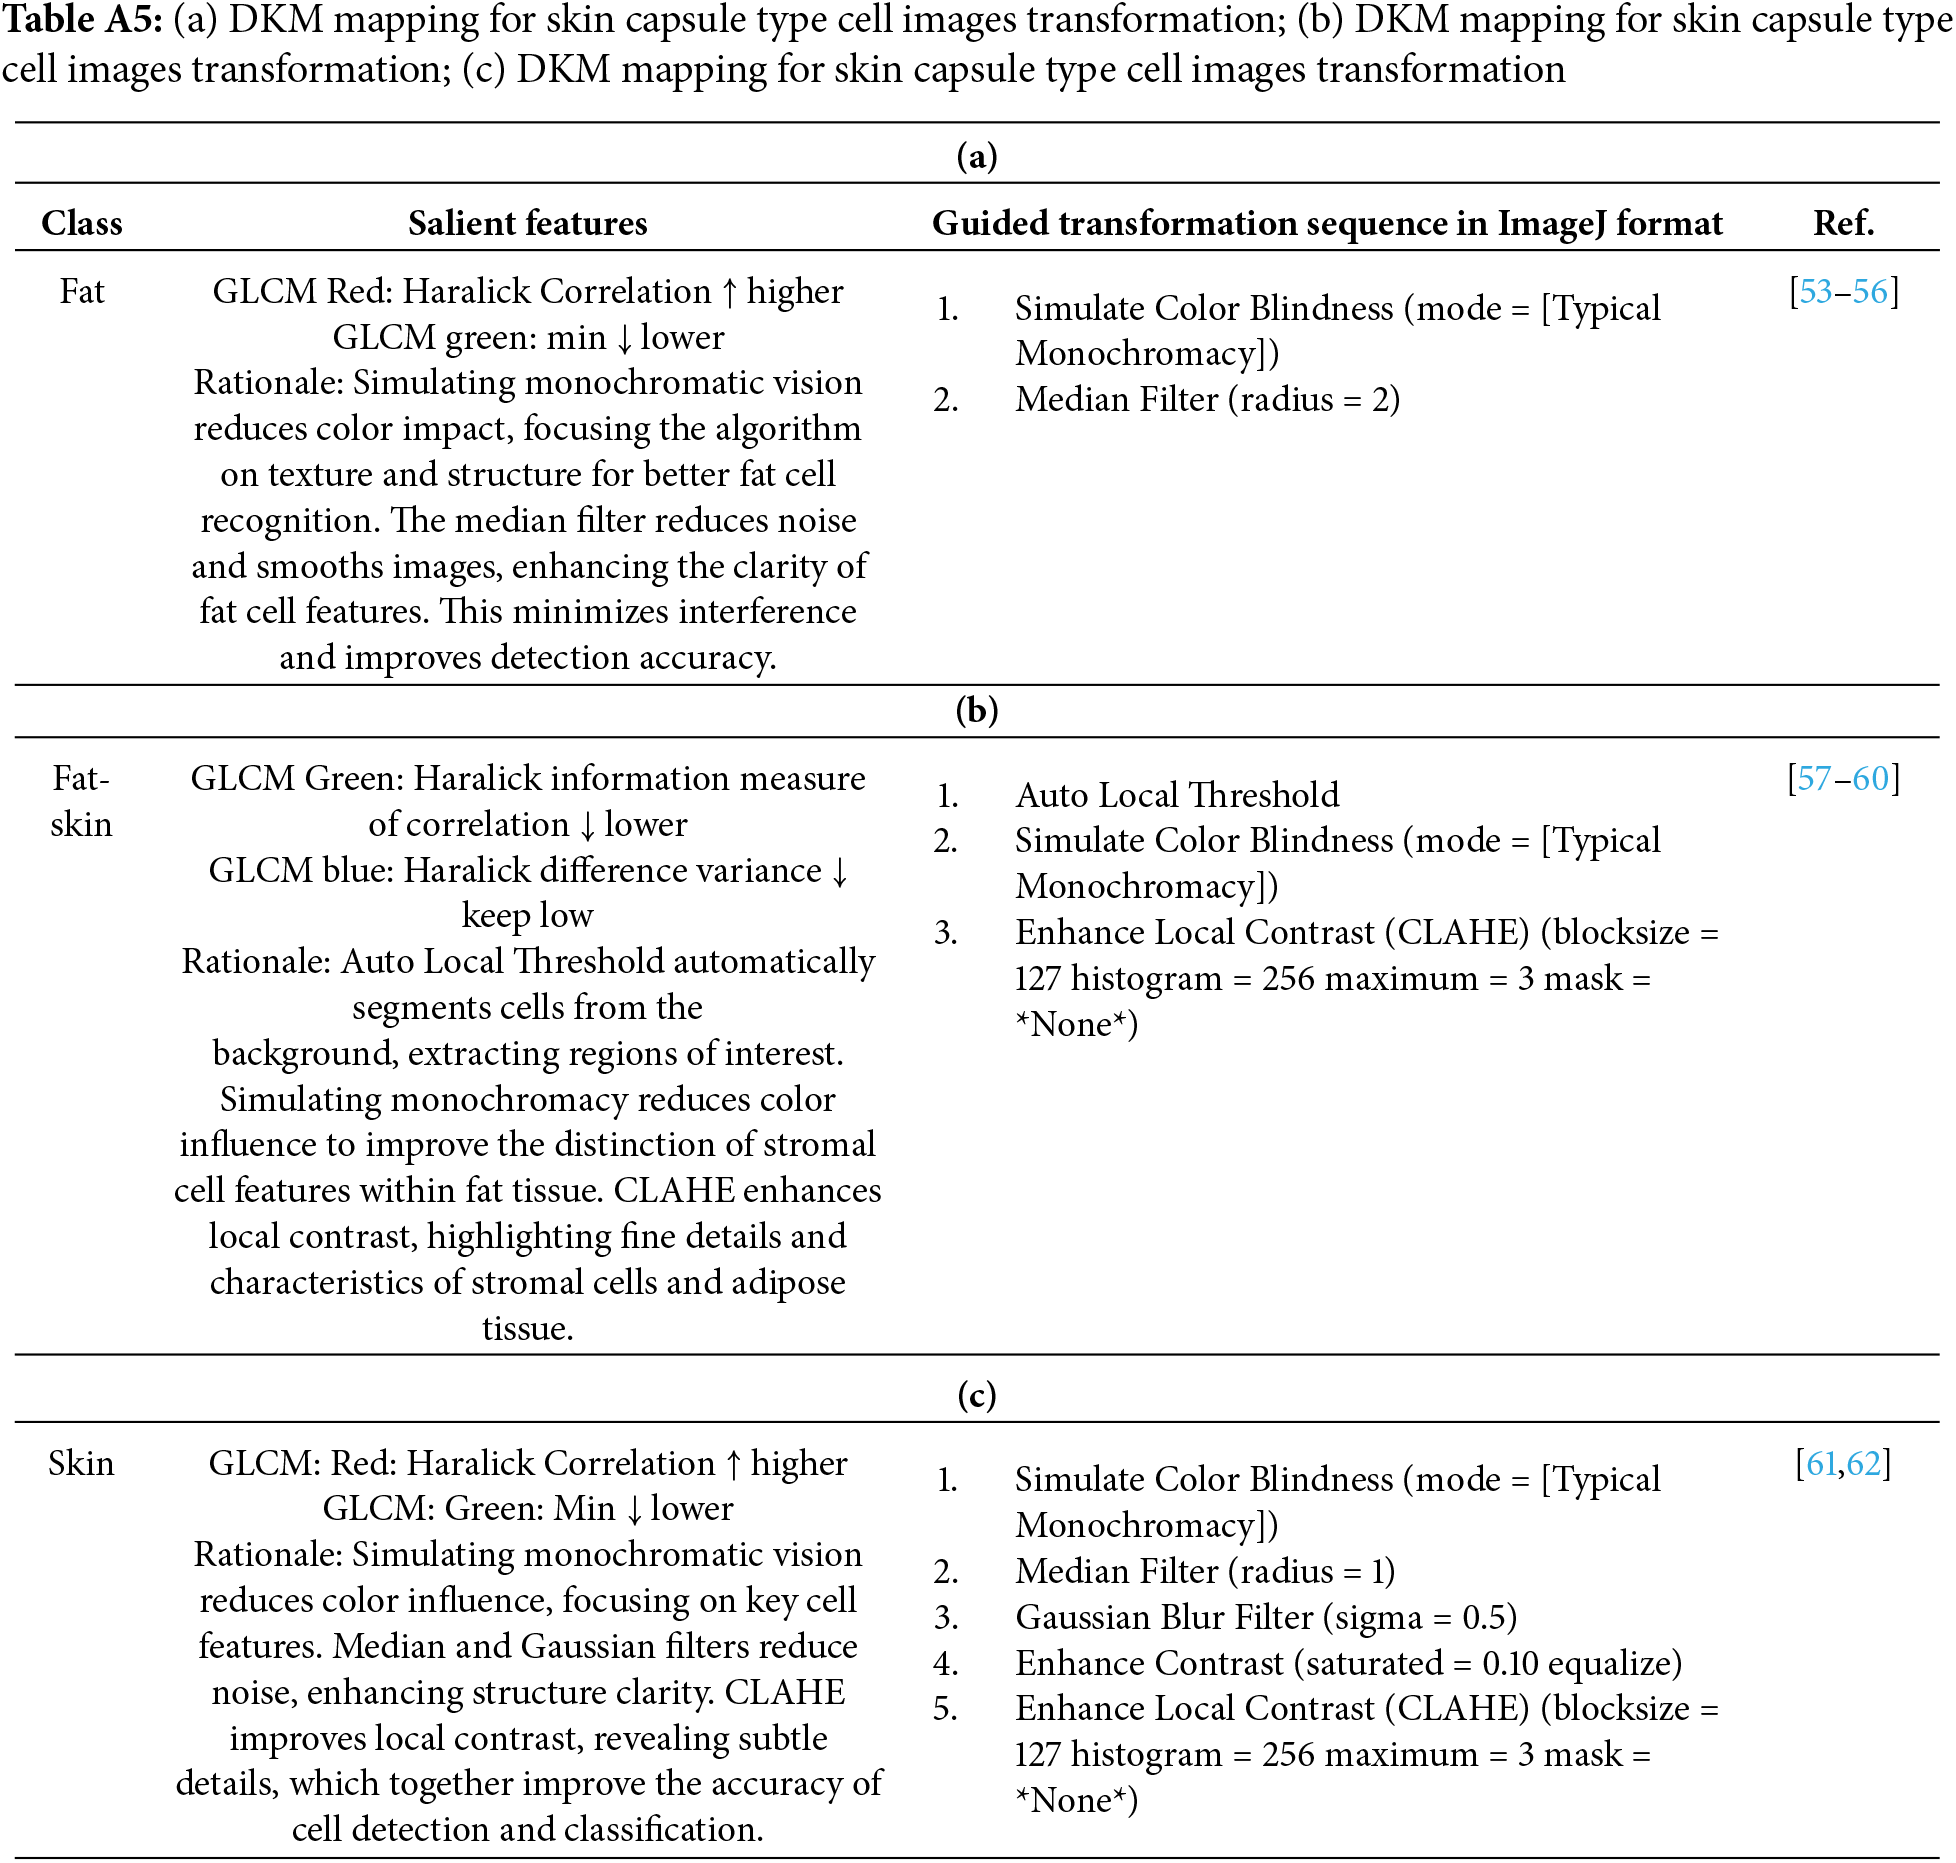
To help with this process, we introduce a supporting process called “Domain Knowledge Mapping” (DKM). DKM involves exploring existing literature to identify prior image processing techniques that have successfully enhanced H&E training images for classification tasks. By relying on well-established techniques, we can avoid using unverified information. We can find the DKM mapping tables in Tables A1–A5 of the appendix. An example is shown in Table A1, which is about the enhancement of tumor-immune-epithelial cells. Fig. 2 shows the corresponding enhancement results.
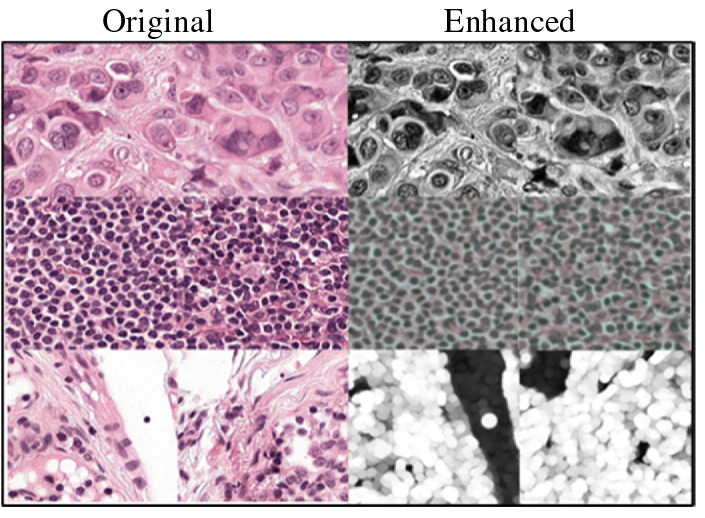
Figure 2: Examples for original (left) and enhanced (right) images
With DKM, a toolbox of image processing techniques is readily available for enhancing the deep learning training images after identifying the salient features of the cells involved in the classification task. To facilitate the semi-automatic procedure of SFGA, the image processing tasks should be automated by programming the mapping of the salient features and image processing techniques and their parameters as software codes or scripts. It is important to standardize the image processing techniques and their parameters being used across all training samples for a certain cell classification task.
The Salient Features Guided Augmentation (SFGA) method is formulated through a series of definitions and methods. It involves converting an original image set into a matrix of data instances and features (p × q matrix) in Definition 1. In Definition 2, a candidate model is selected from a model set based on its performance in training using the features, accuracy, error, and F1 score. Definitions 3 and 4 describe how important and salient features are chosen based on performance changes and Shapley values, respectively. Finally, in Definition 5, the selected features are used to enhance images through established image enhancement methods.
Definition 1 (Cells Matrix). Suppose that there is an original image set
Definition 2 (Candidate Model). In order to select an appropriate Training/Testing ML Model, we should build up a model set M which contains Machine learning methods
Definition 3 (Important Features). The top-h important features can be selected by the following method. For each feature, where
Then define a set PH which contains all elements
Definition 4 (Salient Features). The top-k salient features can be selected by the following method. Let
And the Shapley values can be computed and used as feature attributions. The formula of the Shapley values are:
Define a set
Definition 5 (Enhance Images Features). The features for enhancing the images can be selected by the following method. First, choose the features both are important features and salient feature. These features are contained in the set
SFGA method combines these definitions to guide the selection and enhancement of features for image processing and model training.
In this paper, our experimentation utilizes the CAMELYEON 2017 dataset [20]. The CAMELYEON 2017 dataset is publicly available at https://iciar2018-challenge.grand-challenge.org/ (accessed on 10 Jan 2025). Which contains 1399 H&E-stained breast cancer sentinel lymph node sections. In collaboration with medical experts, we selected 50 Whole-Slide Images (WSI) featuring various characteristics, including ENE. Each WSI has a resolution of approximately 200,000 × 100,000 pixels in 3-channel RGB format, with an uncompressed data size of 55.88 GB per level. For practical handling, we used the compressed version at 40× magnification, with file sizes averaging 2 to 4 GB.
Given that a typical region of interest (ROI) within an H&E-stained image contains at least 20,000 cells along with various other materials, it presents a considerable labeling effort. To facilitate this, we employ the Watershed cell segmentation algorithm [21], which leverages intensity and texture differences to segment individual cells accurately. The algorithm defines markers representing cell locations and fills the space between them to create segmented regions of uniform intensity, ensuring precise and non-overlapping cell segmentation.
The primary objective of our data preparation process is two-fold. Firstly, it involves creating doctor’s annotations to establish ground truth for training samples in the construction of a deep learning model. Secondly, it aims to identify salient features from cell characteristics, which are essential for enhancing deep learning training images using our novel Salient Features Guided Augmentation (SFGA) method. The important initial step in this process is the creation of annotations by a doctor with more than a decade of experience, who was engaged from the First People’s Hospital of Foshan. The tasks in our experiment encompass cell instance segmentation, mitotic counts, nuclear pleomorphism, tubule formation, and capsule skin recognition.
The SFGA approach selects the best machine learning. We conducted a series of experiments to test the effectiveness of our deep learning-based concept for enabling Cell-Level Analytics (CLA), which is a crucial part of ITA. Our objective was to verify the performance of deep learning and our proposed SFGA-enhanced model in various cell-level recognition tasks, including tumour-immune-fibroblast classification, proliferating cell recognition, mitotic cell recognition, nuclear pleomorphism classification, and capsule skin recognition.
We used ResNet 48 as the deep learning model. The design of the experimentation is shown in Fig. 3. The experimental design included two types of data augmentation: standard augmentation (rotations from 0 to 360 degrees in 5-degree increments, scaling with six zoom levels from 0 to 5, and random shifts of 20 pixels) and light augmentation (only image rotation). Six combinations were tested: Original, Original + Augmentation, Original + (Light)Augmentation, Enhanced, Enhanced + Augmentation, and Enhanced + (Light)Augmentation.
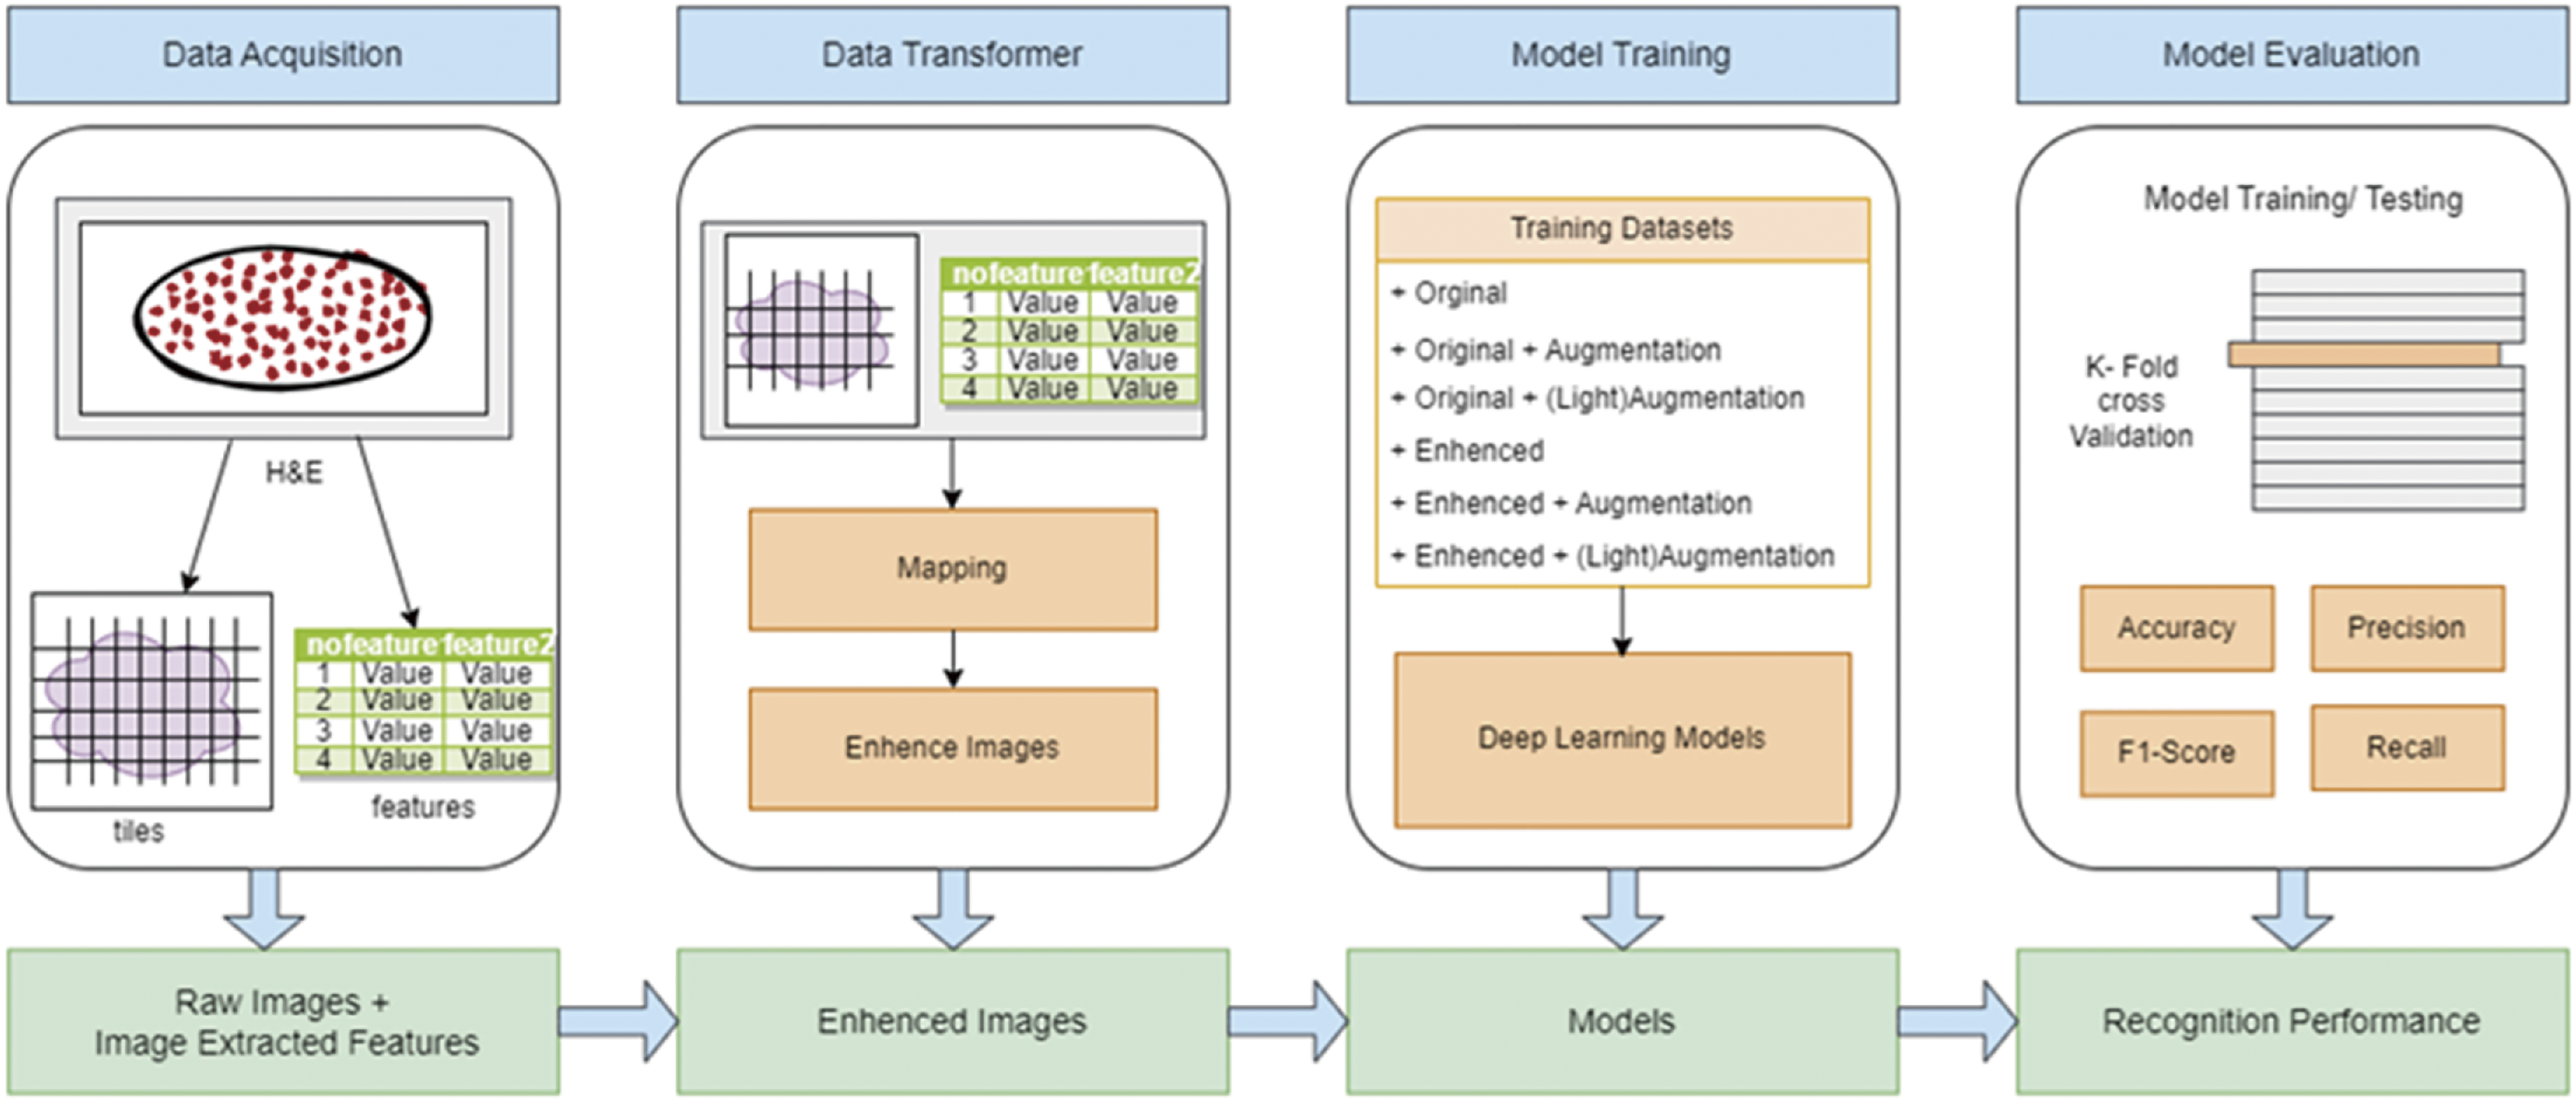
Figure 3: Design of experimentation with ResNet 48 for cell-types classification
Using breast cancer metastasis at the lymph node as the source, we split the dataset into 80% training and 20% validation. After data acquisition, training image tiles were enhanced using SFGA, and salient features were identified to determine suitable image processing techniques for improving model accuracy. The model was trained using 5-fold cross-validation to avoid overfitting and generate performance metrics, followed by performance evaluation.
Our results show that deep learning-based CLA tools can support higher-level pattern-level analytics. DL-SFGA provides satisfactory inference accuracy, meeting high-performance expectations for cancer metastasis medical evaluation. Figs. 4 and 5 present radar charts comparing different DL-SFGA + augmentation combinations for cell type recognition, and butterfly charts highlighting the performance gains of DL-SFGA over the original dataset.
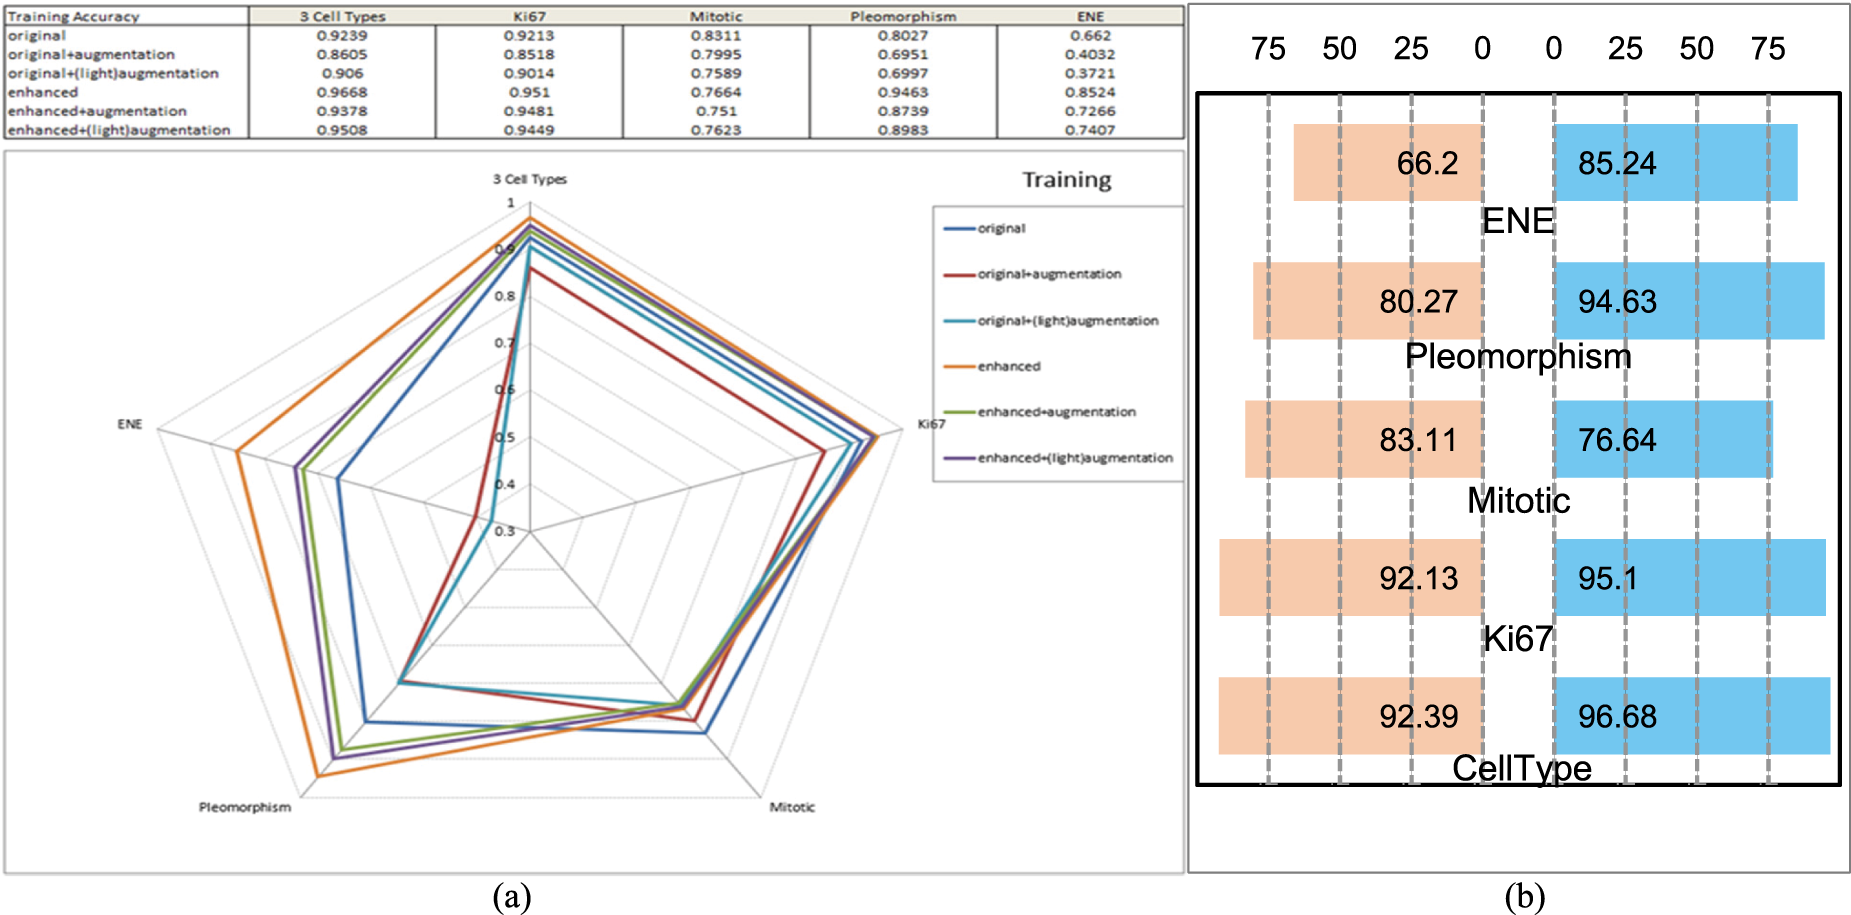
Figure 4: Performance of training. (a) Radar chart of performance comparison of deep learning wrt cell recognition, in training accuracy. (b) Butterfly chart of performance comparison of deep learning wrt DL-SFGA enhancement, in training accuracy
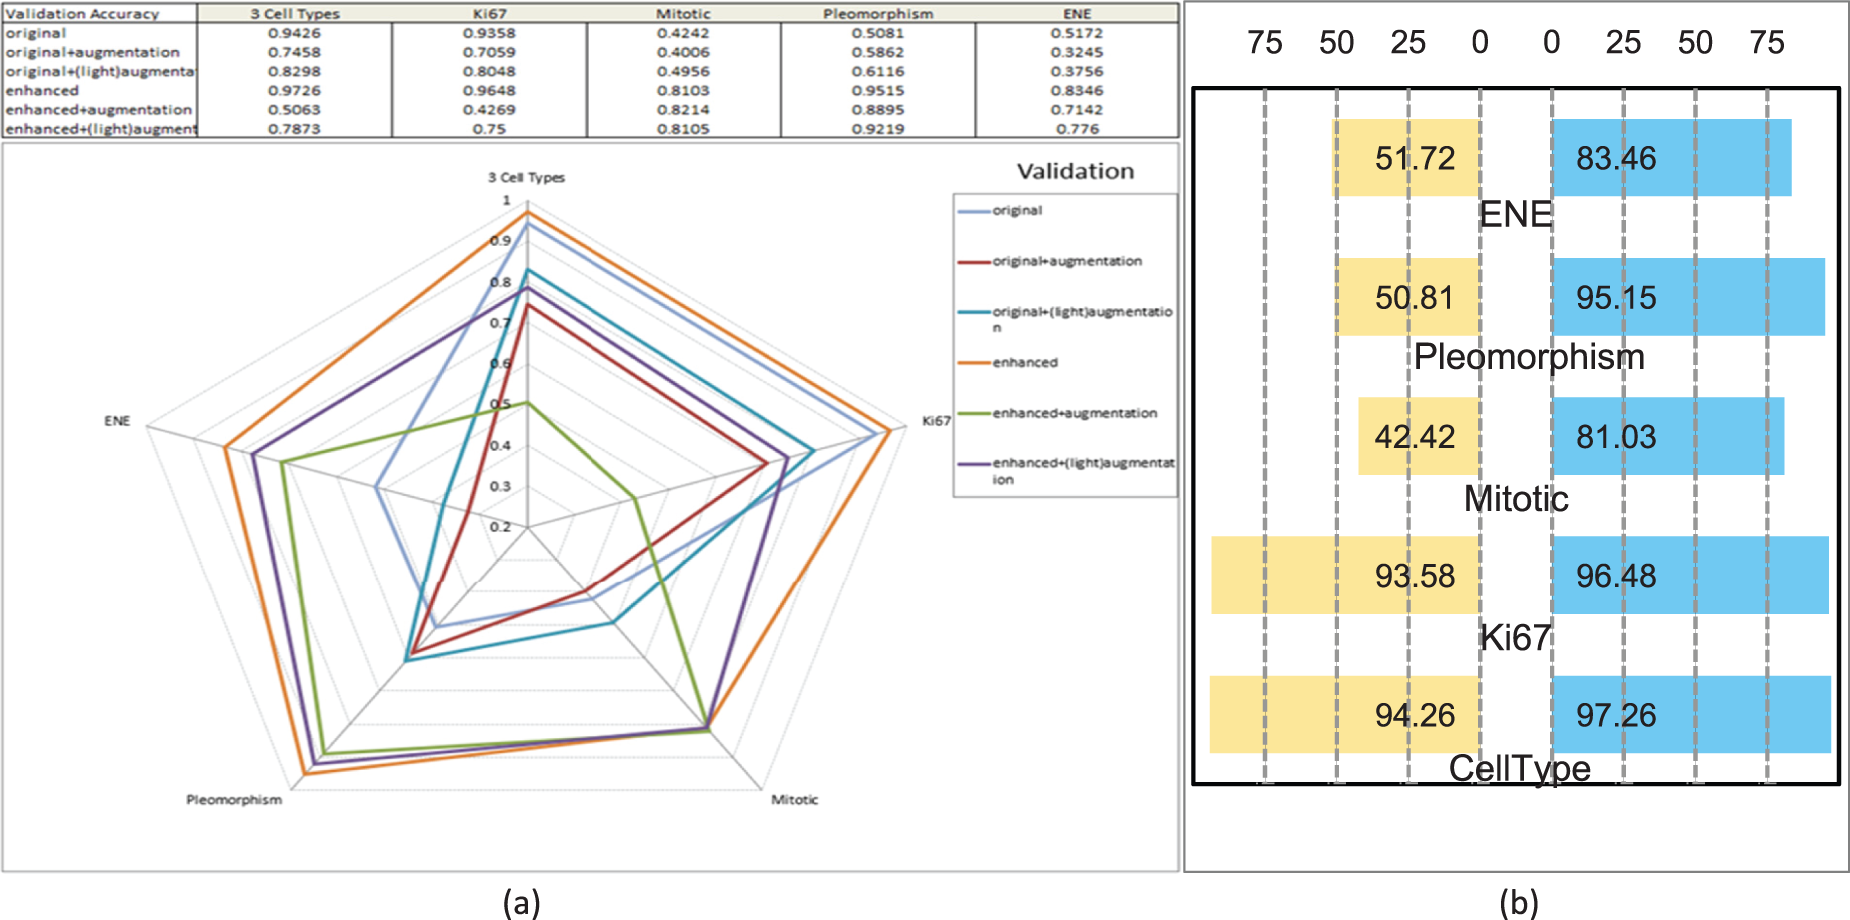
Figure 5: Performance of validation. (a) Radar chart of performance comparison of deep learning wrt cell recognition, in validation accuracy. (b) Butterfly chart of performance comparison of deep learning wrt DL-SFGA enhancement, in validation accuracy
5.1 Experiment 01: Tumor-Immune-fibroblast Cell
Fig. 6 shows the training and validation accuracy curves for tumor-immune-fibroblast cell type classification under various data augmentation settings. The ‘Original’ dataset delivers strong performance with a final training accuracy of 78.375% and an average of 92.398%. The loss converges to 0.642 at the final training stage, averaging 0.208 overall. On the validation set, the model achieves 85.67% accuracy at epoch 200, with an average of 94.26%, and loss values of 0.509 and 0.176.
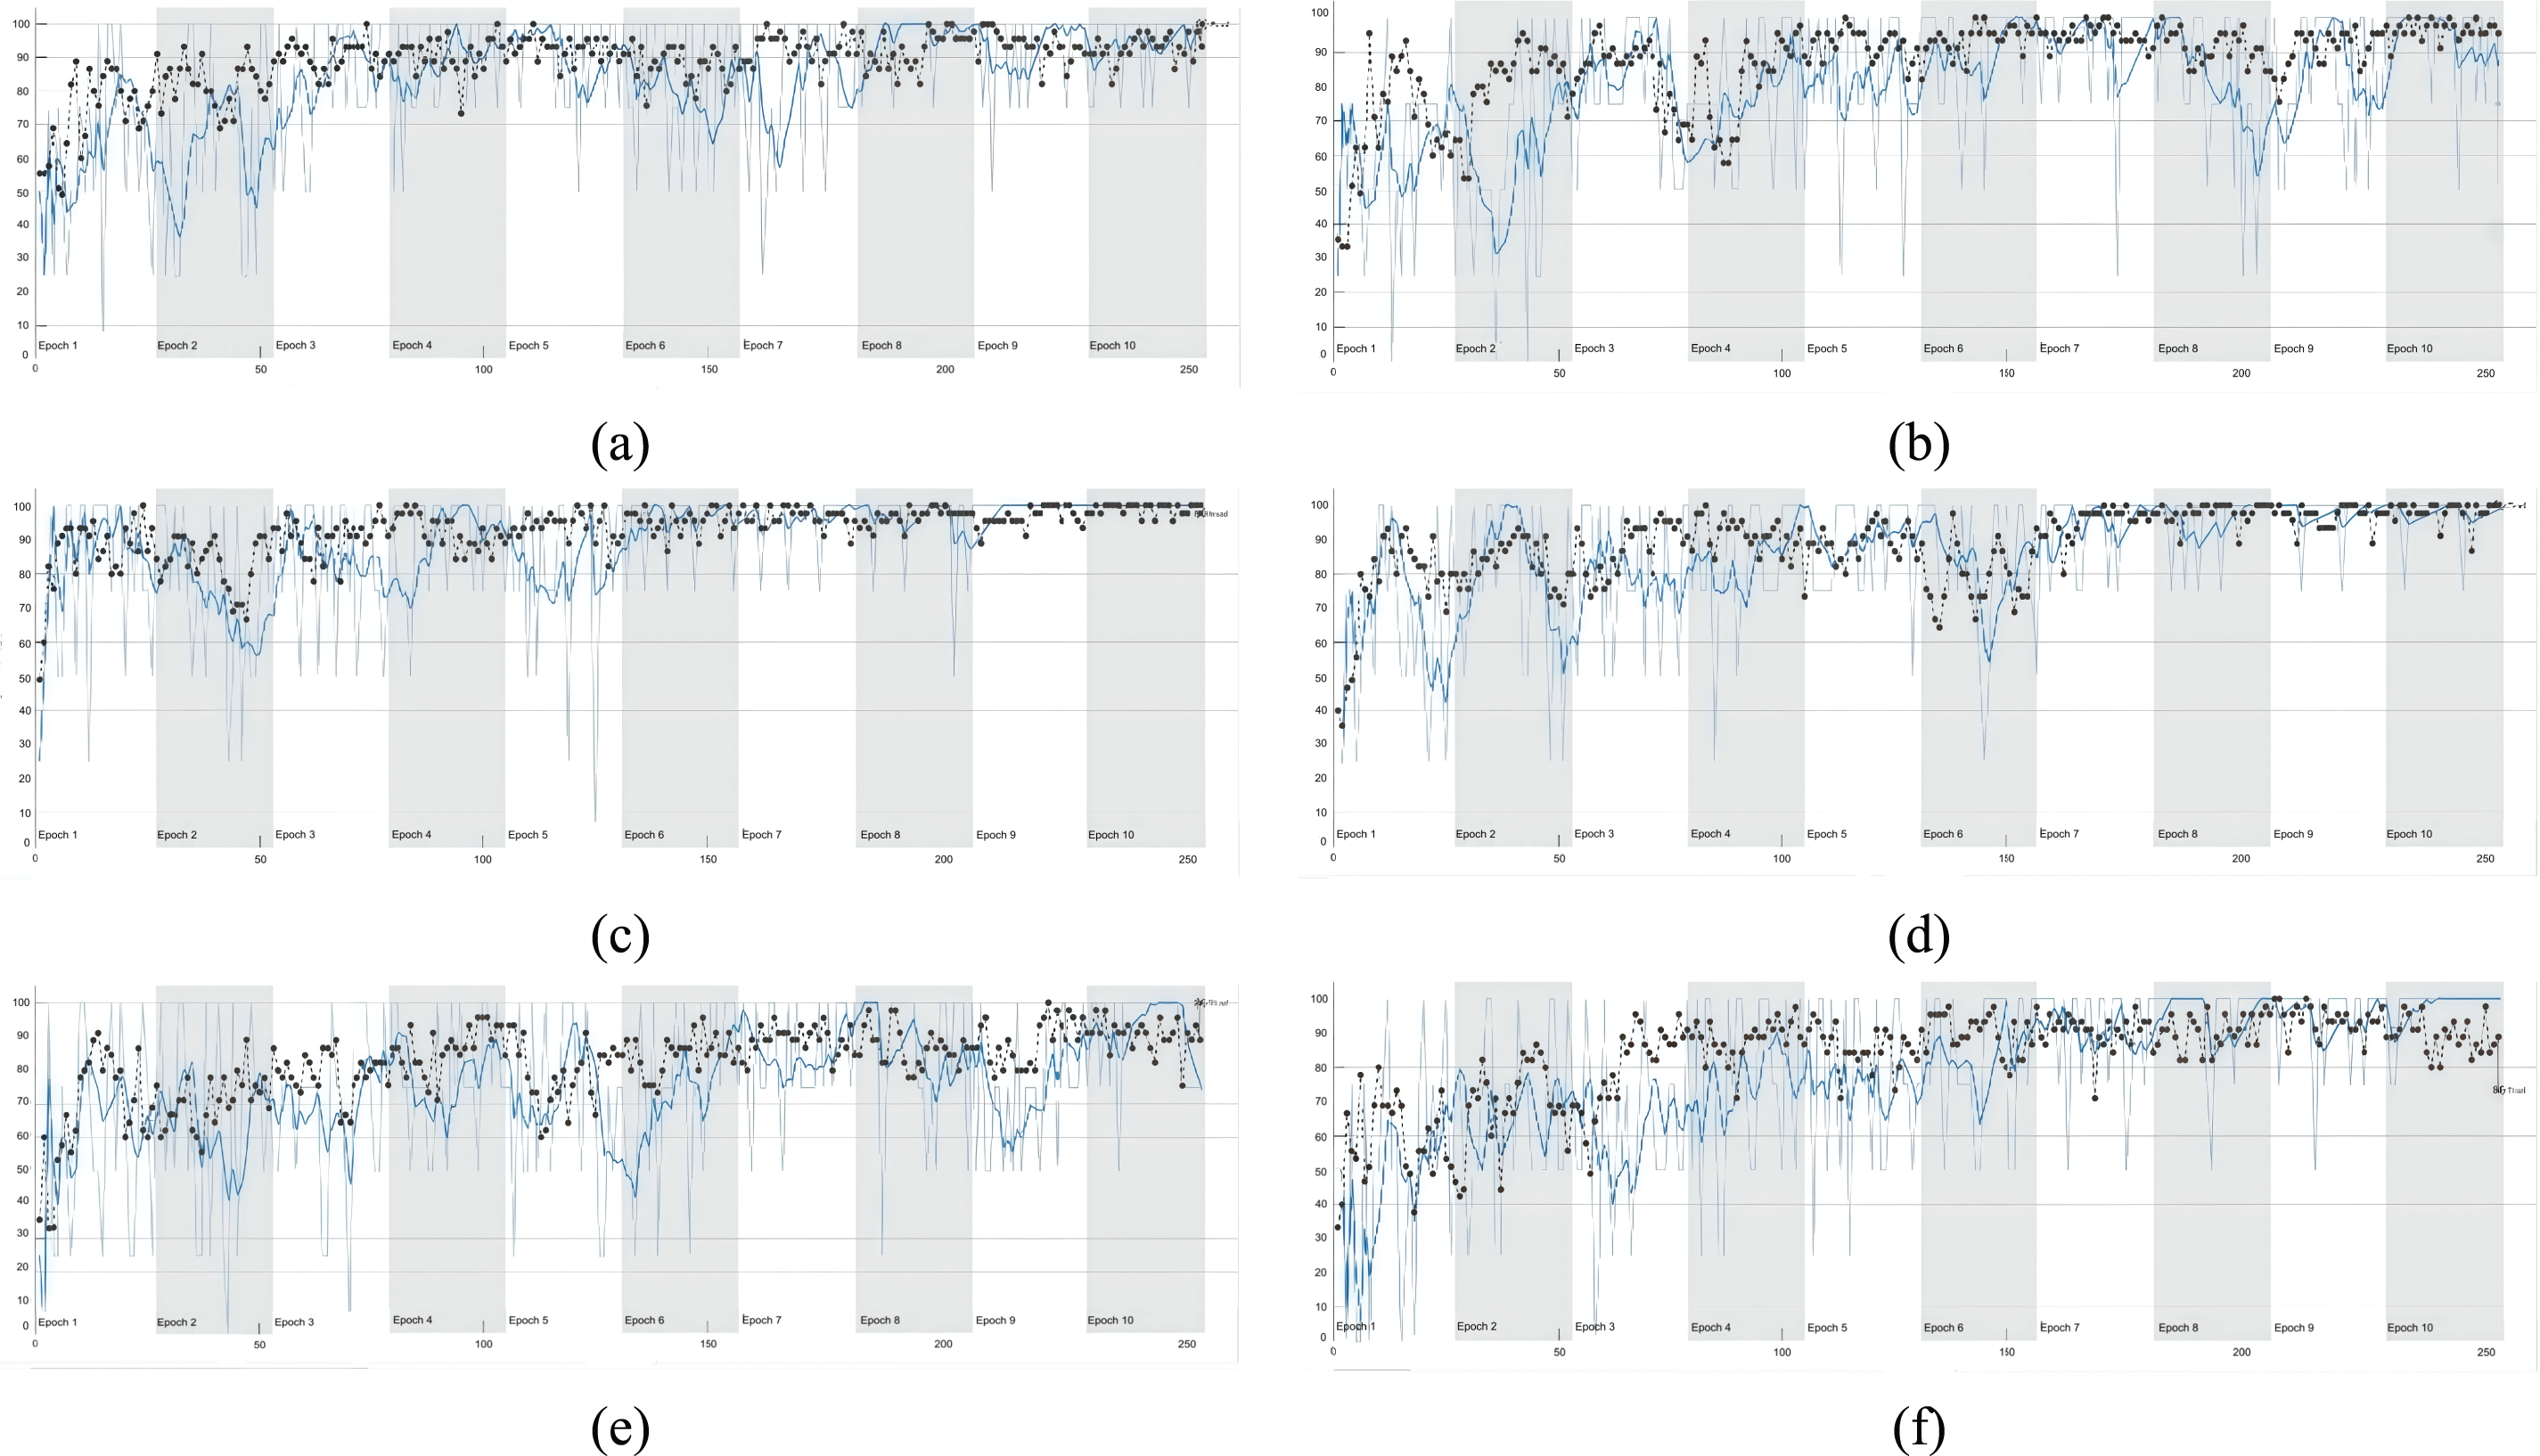
Figure 6: Deep learning performance curves—the training and validation accuracy diagram of tumour-immune-fibroblast cell types classification. (a) is original, (b) is original + augmentation, (c) is original + augmentation (light). (d) is enhanced, (e) is enhanced + augmentation, (f) is enhanced + augmentation (light)
Applying standard augmentation to the ‘Original’ dataset led to a slight decrease in performance, with final training accuracy dropping to 72.5% and validation accuracy to 80.12%. However, using a lighter augmentation strategy improved performance, achieving a final training accuracy of 80% and validation accuracy of 87.4%. Using an ‘Enhanced’ dataset without further augmentation resulted in substantial performance gains, with final training accuracy reaching 86.75% and validation accuracy hitting 91.6% at epoch 200. Reapplying augmentation to this ‘Enhanced’ dataset, however, caused a decline in performance, particularly in the average validation accuracy.
In conclusion, for cell detection tasks, the best performance was achieved using a high-quality enhanced dataset without additional augmentation, highlighting the importance of superior data quality. Future research could explore more advanced augmentation techniques.
5.2 Experiment 02: Proliferating Cells
This study aims to evaluate the impact of data augmentation and enhancement on model performance for identifying Ki67 positive cells in Haematoxylin and Eosin (H&E) stained samples through six different dataset configurations. The ‘Original’ dataset served as a benchmark, achieving a final training accuracy of 75.625% and an average training accuracy of 92.134%; its performance on the validation set was equally impressive, with final and average accuracies of 81.02% and 93.58%, respectively.
However, applying standard augmentation to the ‘Original’ dataset led to a decline in all metrics, likely due to overfitting. Light augmentation improved this situation. When using the ‘Enhanced’ dataset, there was a significant performance boost, with training accuracy reaching 77.375% and averaging at 95.10%, while validation accuracy soared to 96.49%. Yet, standard augmentation on the ‘Enhanced’ dataset caused a sharp drop in validation performance, indicating that excessive augmentation on already enhanced data may lead to overfitting. Light augmentation once again showed better results.
The experimental findings suggest that although data augmentation can expand and diversify training data, it must be applied cautiously to avoid issues like overfitting. Data enhancement clearly benefits model performance, underscoring the importance of investing in high-quality, enhanced datasets for complex tasks such as Ki67 positive cell detection.
5.3 Experiment 03: Mitotic Cell
In the pursuit of identifying mitotic cells in H&E stained samples, our study involved investigating six distinct data configurations and their subsequent impact on model performance.
Using the ‘Original’ dataset, the model performed well on the training set with a final training accuracy of 69.125% and an average training accuracy of 83.119%. However, validation performance showed a decline with final and average accuracies of 53.85% and 42.43%, respectively, indicating overfitting. Increasing the original dataset did not improve this situation and may have exacerbated overfitting. Applying light augmentation, however, improved the average validation accuracy to 49.56%, suggesting that it can aid generalization.
Transitioning to the ‘Enhanced’ dataset significantly boosted performance, with the average validation accuracy rising to 81.039%. Further augmenting the enhanced dataset increased the average validation accuracy to 82.14%, despite a slight drop in final training accuracy to 63.75%. This suggests that data augmentation introduces additional diversity and robustness, positively impacting model performance.
In summary, our study shows that data enhancement is crucial for improving model performance and generalization but requires careful calibration. Future research should focus on optimizing these techniques to enhance model performance and generalizability in detecting mitotic cells in H&E-stained samples.
5.4 Experiment 04: Nuclear Pleomorphism
In the process of identifying polymorphic cells in H&E-stained samples, our study provides significant insights.
For the ‘Original’ dataset, the model achieved a training accuracy of 63.75% at epoch 200, with an average of 80.27%; validation accuracy was 63.31% at epoch 200, averaging 50.82%. The notable discrepancy between training and validation performance suggests potential overfitting. For the ‘Original + Augmentation’ dataset, despite slight decreases in both training (61.75%) and validation (61.57%) accuracies at epoch 200, this decline may be attributed to the introduction of unnecessary complexity by the augmentation strategy. In contrast, the ‘Original + (Light)Augmentation’ dataset showed improved validation accuracy (61.82% at epoch 200, averaging 61.16%), suggesting that lighter augmentation can reduce noise or distortion, thereby enhancing model performance.
When applied to the ‘Enhanced’ dataset, enhancement techniques significantly boosted model performance: training accuracy reached 89.5% at epoch 200 (averaging 94.63%), and validation accuracy was 92.42% (averaging 95.16%). This indicates that appropriate enhancement methods, such as denoising or contrast adjustment, can substantially improve learning outcomes by reducing irrelevant variations and emphasizing key features. The ‘Enhanced + (Light)Augmentation’ dataset demonstrated the best results, achieving training and validation accuracies of 82.88% (averaging 89.84%) and 85.70% (averaging 92.20%), respectively, at epoch 200.
5.5 Experiment 05: Capsule Skin
This analysis aims to evaluate the impact of various data enhancement techniques on the performance of models detecting extranodal extension (ENE) in H&E-stained lymph nodes. The results highlight the importance of dataset manipulation and its effect on model performance. Fig. 7 shows the training and validation accuracy curves for capsule skin recognition under various data augmentation settings.
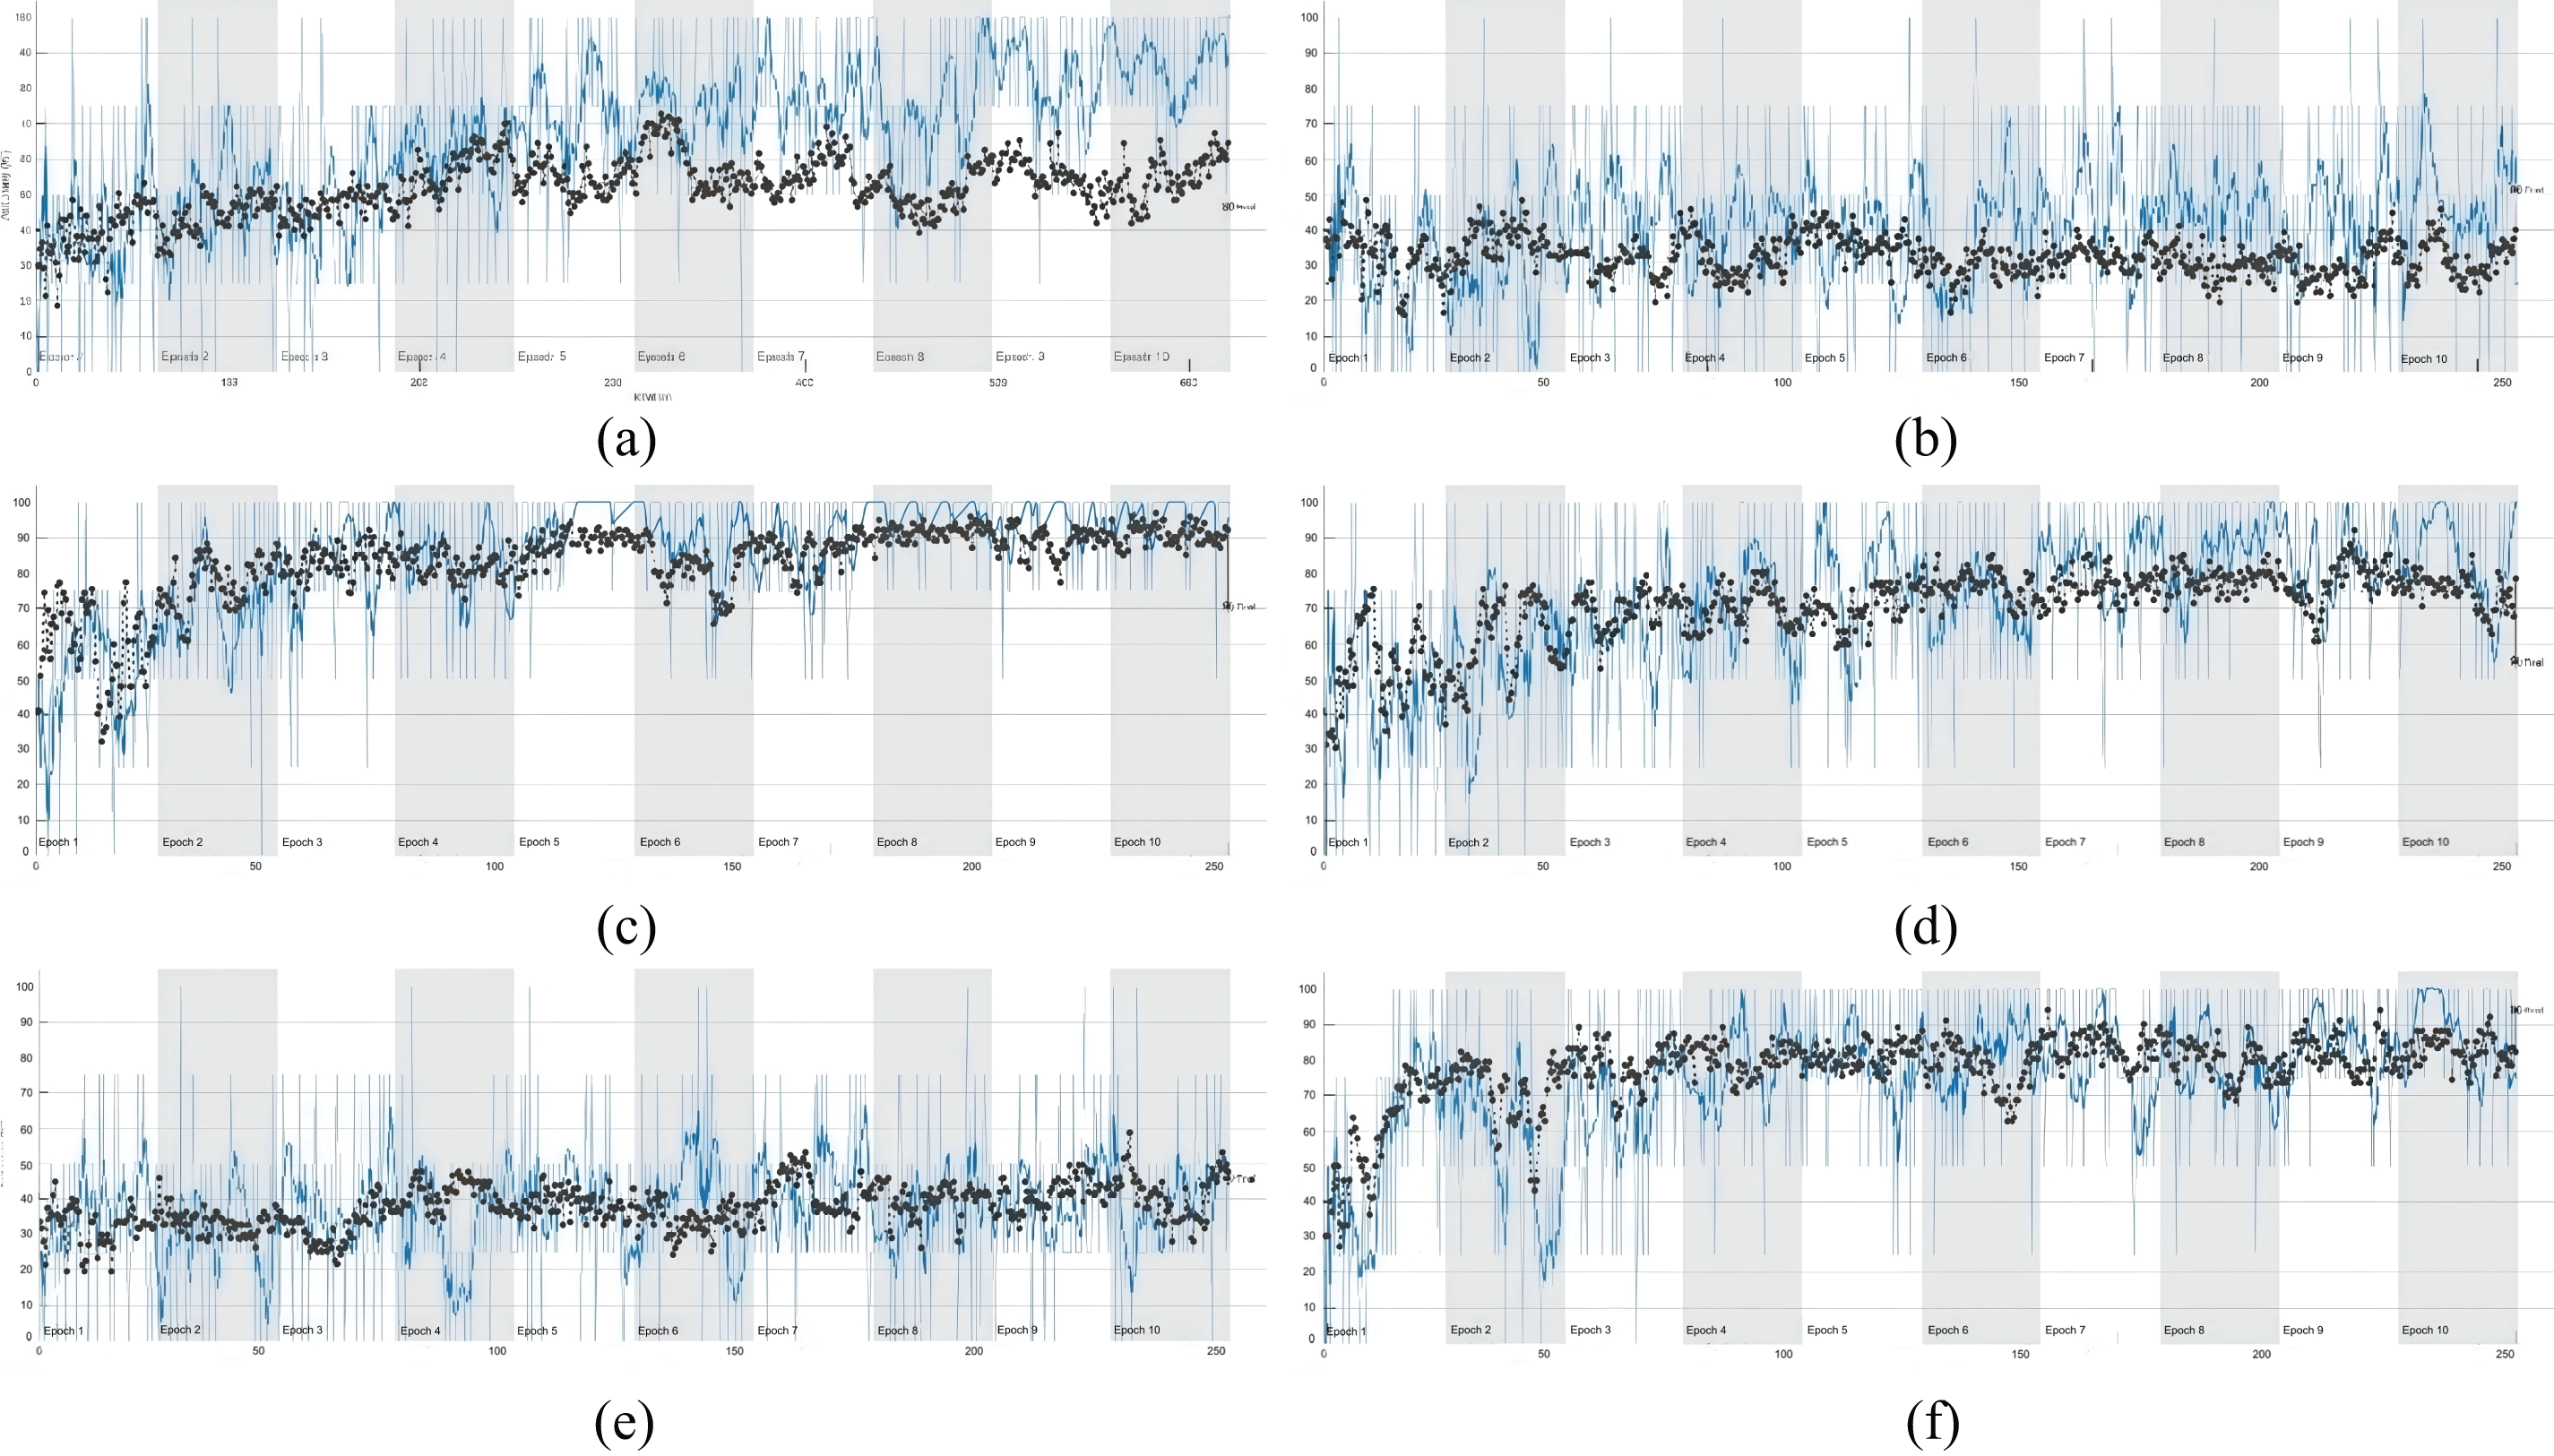
Figure 7: Deep learning performance curves—the training and validation accuracy diagram of capsule skin recognition classification. (a) is original, (b) is original + augmentation, (c) is original + augmentation (light). (d) is enhanced, (e) is enhanced + augmentation, (f) is enhanced + augmentation (light)
Models trained on the ‘Enhanced’ dataset showed significant advantages, with training accuracy reaching 85.24%, far exceeding the ‘Original’ dataset’s 66.21%. For validation data, the ‘Enhanced’ dataset achieved a validation accuracy of 83.46%, markedly higher than the ‘Original’ dataset’s 51.72%. This indicates that the enhanced dataset not only improves training effectiveness but also enhances the model’s adaptability to new, unseen data.
However, not all augmentation methods yield positive outcomes. Excessive augmentation led to decreased training and validation accuracies in the ‘Original + Augmentation’ dataset, dropping to 40.32% and lower levels, respectively. This suggests that improper or excessive use of augmentation can harm model performance. In contrast, the ‘Enhanced + (Light)Augmentation’ approach showed promise, achieving average training and validation accuracies of 72.66% and 71.42%, respectively. However, further application to an already ‘Enhanced’ dataset provided limited improvements. In terms of loss, the ‘Enhanced’ dataset exhibited the lowest training and validation losses, with averages of 0.437 and 0.486, respectively, significantly lower than those of the ‘Original’ and ‘Augmented’ datasets. This underscores the robustness of the enhanced dataset.
Overall, these results demonstrate that appropriate data enhancement can significantly improve ENE detection performance in H&E-stained lymph nodes.
In conclusion, SFGA, or Salient Feature Guided Augmentation, stands as an innovative and promising approach in the field of machine learning and image processing. By utilizing machine learning methods to identify and enhance the most influential features within the model, SFGA addresses the critical challenge of improving the input data for deep learning models. This approach offers several distinct advantages that can significantly impact the field of computer vision and image analysis. It not only facilitates the systematic and consistent application of image processing techniques but also enhances the discriminative power of models, ultimately leading to improved performance in various tasks, including image classification and object recognition. SFGA is a noteworthy contribution to the ongoing efforts to enhance the accuracy and efficiency of deep learning models, making it a valuable tool for researchers and practitioners in the domain of artificial intelligence and computer vision. With its potential to advance the state-of-the-art in image analysis, SFGA demonstrates its significance as a novel method that can empower machine learning models to better understand and interpret complex visual data, ultimately contributing to advancements in fields like healthcare, autonomous systems, and beyond. Nevertheless, SFGA approach offers several advantages.
Higher Accuracy. By identifying the features that have the most impact on the model and focusing on adjusting them, this method can improve the model’s performance compared to directly training it with original images. It may achieve higher accuracy in specific tasks compared to training models solely with raw images.
Improved Generalization. Targeted adjustments to input images can effectively reduce the influence of noise and irrelevant information on the model, thereby enhancing its generalization ability. This means the model may exhibit better predictive performance when faced with new, unseen data.
Data Augmentation. Based on the identified key features, input images can be selectively enhanced, thereby increasing the diversity of the training data. This helps improve the model’s generalization ability, especially in situations with limited data.
Enhanced Explainability. Analysing feature importance using machine learning methods enhances the interpretability of the model. This is particularly helpful for understanding the model’s behaviour in specific tasks and identifying potential issues, especially in fields like medical imaging where interpretability is crucial.
Rapid Iteration and Optimization. After identifying the features that have the most impact on the deep learning model which may take a long time to converge, the model can be iterated and optimized more quickly by focusing only on these key features. This reduces training time and computational resource requirements, improving the efficiency of model optimization.
The Salient Features Guided Augmentation (SFGA) approach, as outlined in this research, offers a promising avenue for enhancing the accuracy of deep learning models in the realm of medical image analysis, particularly for tasks such as cancer diagnosis and cell feature recognition. As we look ahead, several potential avenues for future work and research directions emerge.
Firstly, it is necessary to explore more advanced augmentation techniques and optimize SFGA parameters. Although experiments have demonstrated the advantages of SFGA in data augmentation, further research should focus on developing new strategies to mitigate overfitting, improve model generalization capabilities, and enhance the effectiveness of SFGA by optimizing algorithm selection, fine-tuning image processing techniques, and exploring the optimal combination of different augmentation techniques. This will not only contribute to the performance of existing models but may also reveal new features or patterns, which are crucial for medical image analysis. We are planning a refined model, SFGA-II, which will tune the model parameters to suit the diversity of data. By then, a wide range of datasets will be used, similar to Simon Graham’s HoverNet paper, where the team tests pan-cancer datasets over a million.
Secondly, integrating SFGA into real-world clinical settings and ensuring its robustness and scalability is key to achieving practical applications. Collaboration with medical institutions and pathologists can validate the effectiveness and practicality of this method in clinical practice. For proof of concept, as a naive SFGA model for the first time, we focused on distinguishing three basic classes of tissue cells, prioritizing accuracy over robustness. Future work will include robustness and performance analysis, which are crucial for clinical applications. To address the challenges of scalability in dealing with the diverse and extensive datasets commonly encountered in clinical practice, future work needs to ensure that SFGA operates stably and efficiently on large datasets and under various pathological conditions.
Additionally, it is nowadays a trend to apply large language models in guiding model building. Our work is one of the early steps towards this goal, although we proposed a narrow application domain on histological image analysis. Future research should include meticulous comparisons with other works, which will require significant efforts in reprogramming and setting up large language models as part of our comparison.
Furthermore, future work will involve conducting theoretical and experimental error analysis to explain any obvious decline in performance by conducting large-scale empirical verification. For the experiments conducted so far, default parameters were used. It is our plan to work on hyperparameter optimization to fine-tune those parameter settings for the model as well as for feature extraction and enhancement techniques. Computational overhead or dependency on feature importance rankings are indeed important, and we plan to write further analysis as a separate paper in the future.
Future research and development in the areas mentioned above especially on the aspects of rigorous performance assessment such as the model’s specificity, sensitivity and balanced F1-scores will contribute to the continued advancement of AI in healthcare and have a positive impact on patient outcomes and the field of medical image analysis.
Acknowledgement: The authors are grateful to all the editors and anonymous reviewers for their comments and suggestions.
Funding Statement: This project was supported by grants from the North China University of Technology Research Start-Up Fund (11005136024XN147-14) and (110051360024XN151-97), Guangzhou Development Zone Science and Technology Project (2023GH02), the National Key R&D Program of China (2021YFE0201100 and 2022YFA1103401 to Juntao Gao), National Natural Science Foundation of China (981890991 to Juntao Gao), Beijing Municipal Natural Science Foundation (Z200021 to Juntao Gao), and CAS Interdisciplinary Innovation Team (JCTD-2020-04 to Juntao Gao), and 0032/2022/A, by Macau FDCT, and MYRG2022-00271-FST.
Author Contributions: Study conception and design: Tengyue Li, Shuangli Song, Jiaming Zhou; data collection: Simon Fong, Geyue Li; analysis and interpretation of results: Qun Song, Sabah Mohammed; draft manuscript preparation: Weiwei Lin, Juntao Gao. All authors reviewed the results and approved the final version of the manuscript.
Availability of Data and Materials: All the data and materials that are required to reproduce these findings can be shared by contacting the corresponding author on reasonable request.
Ethics Approval: Not applicable.
Conflicts of Interest: The authors declare no conflicts of interest to report regarding the present study.


References
1. Iqbal MJ, Javed Z, Sadia H, Qureshi IA, Irshad A, Ahmed R, et al. Clinical applications of artificial intelligence and machine learning in cancer diagnosis: looking into the future. Cancer Cell Int. 2021;21(1):270. doi:10.1186/s12935-021-01981-1. [Google Scholar] [PubMed] [CrossRef]
2. Kumar Y, Gupta S, Singla R, Hu YC. A systematic review of artificial intelligence techniques in cancer prediction and diagnosis. Arch Comput Methods Eng. 2022;29(4):2043–70. doi:10.1007/s11831-021-09648-w. [Google Scholar] [PubMed] [CrossRef]
3. Litjens G, Kooi T, Bejnordi BE, Setio AAA, Ciompi F, Ghafoorian M, et al. A survey on deep learning in medical image analysis. Med Image Anal. 2017;42(13):60–88. doi:10.1016/j.media.2017.07.005. [Google Scholar] [PubMed] [CrossRef]
4. Tizhoosh HR, Pantanowitz L. Artificial intelligence and digital pathology: challenges and opportunities. J Pathol Inform. 2018;9(1):38. doi:10.4103/jpi.jpi_53_18. [Google Scholar] [PubMed] [CrossRef]
5. Rulaningtyas R, Hyperastuty AS, Rahaju AS. Histopathology grading identification of breast cancer based on texture classification using GLCM and neural network method. J Phys: Conf Ser. 2018;1120:012050. doi:10.1088/1742-6596/1120/1/012050. [Google Scholar] [CrossRef]
6. Luca AR, Ursuleanu TF, Gheorghe L, Grigorovici R, Iancu S, Hlusneac M, et al. Impact of quality, type and volume of data used by deep learning models in the analysis of medical images. Inform Med Unlocked. 2022;29(1):100911. doi:10.1016/j.imu.2022.100911. [Google Scholar] [CrossRef]
7. Boschman J, Farahani H, Darbandsari A, Ahmadvand P, Van Spankeren A, Farnell D, et al. The utility of color normalization for AI-based diagnosis of hematoxylin and eosin-stained pathology images. J Pathol. 2022;256(1):15–24. doi:10.1002/path.5797. [Google Scholar] [PubMed] [CrossRef]
8. Anuranjeeta A, Saxena S, Shukla KK, Sharma S. Cellular image segmentation using morphological operators and extraction of features for quantitative measurement. Biosci Biotech Res Asia. 2016;13(2):1101–12. doi:10.13005/bbra/2139. [Google Scholar] [CrossRef]
9. Ghazvinian Zanjani F, Zinger S, de With PHN, E. Bejnordi B, van der Laak JAWM. Histopathology stain-color normalization using deep generative models. In: 1st Conference on Medical Imaging with Deep Learning (MIDL 2018); 2018 Jul 4–6; Amsterdam, The Netherland. p. 1–11. [Google Scholar]
10. Song Y, Zhang L, Chen S, Ni D, Lei B, Wang T. Accurate segmentation of cervical cytoplasm and nuclei based on multiscale convolutional network and graph partitioning. IEEE Trans Biomed Eng. 2015;62(10):2421–33. doi:10.1109/TBME.2015.2430895. [Google Scholar] [PubMed] [CrossRef]
11. Hu C, Sun X, Yuan Z, Wu Y. Classification of breast cancer histopathological image with deep residual learning. Int J Imaging Syst Tech. 2021;31(3):1583–94. doi:10.1002/ima.22548. [Google Scholar] [CrossRef]
12. Sirinukunwattana K, Ahmed Raza SE, Tsang YW, Snead DRJ, Cree IA, Rajpoot NM. Locality sensitive deep learning for detection and classification of nuclei in routine colon cancer histology images. IEEE Trans Med Imaging. 2016;35(5):1196–206. doi:10.1109/TMI.2016.2525803. [Google Scholar] [PubMed] [CrossRef]
13. Xu Y, Jia Z, Ai Y, Zhang F, Lai M, Chang EI. Deep convolutional activation features for large scale Brain Tumor histopathology image classification and segmentation. In: 2015 IEEE International Conference on Acoustics, Speech and Signal Processing (ICASSP); 2015 Apr 19–24; South Brisbane, QLD, Australia; 2015. p. 947–51. doi:10.1109/ICASSP.2015.7178109. [Google Scholar] [CrossRef]
14. Xu J, Luo X, Wang G, Gilmore H, Madabhushi A. A Deep Convolutional Neural Network for segmenting and classifying epithelial and stromal regions in histopathological images. Neurocomputing. 2016;191(11):214–23. doi:10.1016/j.neucom.2016.01.034. [Google Scholar] [PubMed] [CrossRef]
15. Irshad H, Veillard A, Roux L, Racoceanu D. Methods for nuclei detection, segmentation, and classification in digital histopathology: a review—current status and future potential. IEEE Rev Biomed Eng. 2013;7:97–114. doi:10.1109/rbme.2013.2295804. [Google Scholar] [PubMed] [CrossRef]
16. Cruz-Roa A, Basavanhally A, González F, Gilmore H, Feldman M, Ganesan S, et al. Automatic detection of invasive ductal carcinoma in whole slide images with convolutional neural networks. In: Medical imaging 2014: digital pathology. San Diego, CA, USA: Bellingham (WASPIE; 2014. doi: 10.1117/12.2043872. [Google Scholar] [CrossRef]
17. Nelson AD, Krishna S. An effective approach for the nuclei segmentation from breast histopathological images using star-convex polygon. Procedia Comput Sci. 2023;218(3):1778–90. doi:10.1016/j.procs.2023.01.156. [Google Scholar] [CrossRef]
18. Das DK, Dutta PK. Efficient automated detection of mitotic cells from breast histological images using deep convolution neutral network with wavelet decomposed patches. Comput Biol Med. 2019;104:29–42. doi:10.1016/j.compbiomed.2018.11.001. [Google Scholar] [PubMed] [CrossRef]
19. Khan SD, Basalamah S, Lbath A. Multi-module attention-guided deep learning framework for precise gastrointestinal disease identification in endoscopic imagery. Biomed Signal Process Control. 2024;95(3):106396. doi:10.1016/j.bspc.2024.106396. [Google Scholar] [CrossRef]
20. Litjens G, Bandi P, Ehteshami Bejnordi B, Geessink O, Balkenhol M, Bult P, et al. H&E-stained sentinel lymph node sections of breast cancer patients: the CAMELYON dataset. GigaScience. 2018;7(6):giy065. doi:10.1093/gigascience/giy065. [Google Scholar] [PubMed] [CrossRef]
21. watershed.pdf. [Internet]. [cited 2023 Jun 09]. Available from: https://people.cmm.minesparis.psl.eu/users/beucher/publi/watershed.pdf. [Google Scholar]
22. Liu S, Zhang X. Image decolorization combining local features and exposure features. IEEE Trans Multimed. 2019;21(10):2461–72. doi:10.1109/TMM.2019.2903413. [Google Scholar] [CrossRef]
23. Ye Z, Qian JM, Hosny A, Zeleznik R, Plana D, Likitlersuang J, et al. Deep learning-based detection of intravenous contrast enhancement on CT scans. Radiol Artif Intell. 2022;4(3):e210285. doi:10.1148/ryai.210285. [Google Scholar] [PubMed] [CrossRef]
24. Avcı H, Karakaya J. A novel medical image enhancement algorithm for breast cancer detection on mammography images using machine learning. Diagnostics. 2023;13(3):348. doi:10.3390/diagnostics13030348. [Google Scholar] [PubMed] [CrossRef]
25. Mohamed Y. Abdallah Y, Alqahtani T. Research in medical imaging using image processing techniques. In: Medical imaging—principles and applications. London: IntechOpen; 2019. [Google Scholar]
26. Sun Q, Yang X, Guo J, Zhao Y, Liu Y. CIEGAN: a deep learning tool for cell image enhancement. Front Genet. 2022;13:913372. doi:10.3389/fgene.2022.913372. [Google Scholar] [PubMed] [CrossRef]
27. Ibrahim NY, Talaat AS. An enhancement technique to diagnose colon and lung cancer by using double CLAHE and deep learning. Int J Adv Comput Sci Appl. 2022;13(8):276–82. doi:10.14569/ijacsa.2022.0130833. [Google Scholar] [CrossRef]
28. Udendhran R, Balamurugan M, Suresh A, Varatharajan R. Enhancing image processing architecture using deep learning for embedded vision systems. Microprocess Microsyst. 2020;76(2):103094. doi:10.1016/j.micpro.2020.103094. [Google Scholar] [CrossRef]
29. Lembhe A, Motarwar P, Patil R, Elias S. Enhancement in skin cancer detection using image super resolution and convolutional neural network. Procedia Comput Sci. 2023;218(3):164–73. doi:10.1016/j.procs.2022.12.412. [Google Scholar] [CrossRef]
30. Sobhanan Warrier G, Amirthalakshmi TM, Nimala K, Thaj Mary Delsy T, Stella Rose Malar P, Ramkumar G, et al. Automated recognition of cancer tissues through deep learning framework from the photoacoustic specimen. Contrast Media Mol Imaging. 2022;2022(1):4356744. doi:10.1155/2022/4356744. [Google Scholar] [PubMed] [CrossRef]
31. Hao Y, Zhang L, Qiao S, Bai Y, Cheng R, Xue H, et al. Breast cancer histopathological images classification based on deep semantic features and gray level co-occurrence matrix. PLoS One. 2022;17(5):e0267955. doi:10.1371/journal.pone.0267955. [Google Scholar] [PubMed] [CrossRef]
32. Alyassin MA, Moon S, Keles HO, Manzur F, Lin RL, Hæggstrom E, et al. Rapid automated cell quantification on HIV microfluidic devices. Lab Chip. 2009;9(23):3364–9. doi:10.1039/b911882a. [Google Scholar] [PubMed] [CrossRef]
33. Dabeer S, Khan MM, Islam S. Cancer diagnosis in histopathological image: CNN based approach. Inform Med Unlocked. 2019;16(1):100231. doi:10.1016/j.imu.2019.100231. [Google Scholar] [CrossRef]
34. Huang X, Li Z, Zhang M, Gao S. Fusing hand-crafted and deep-learning features in a convolutional neural network model to identify prostate cancer in pathology images. Front Oncol. 2022;12:994950. doi:10.3389/fonc.2022.994950. [Google Scholar] [PubMed] [CrossRef]
35. Su HH, Pan HW, Lu CP, Chuang JJ, Yang T. Automatic detection method for cancer cell nucleus image based on deep-learning analysis and color layer signature analysis algorithm. Sensors. 2020;20(16):4409. doi:10.3390/s20164409. [Google Scholar] [PubMed] [CrossRef]
36. Reshma VK, Arya N, Ahmad SS, Wattar I, Mekala S, Joshi S, et al. Retracted detection of breast cancer using histopathological image classification dataset with deep learning techniques. BioMed Res Int. 2022;2022(1):8363850. doi:10.1155/2022/8363850. [Google Scholar] [PubMed] [CrossRef]
37. Sohail A, Khan A, Wahab N, Zameer A, Khan S. A multi-phase deep CNN based mitosis detection framework for breast cancer histopathological images. Sci Rep. 2021;11(1):6215. doi:10.1038/s41598-021-85652-1. [Google Scholar] [PubMed] [CrossRef]
38. Lu X, You Z, Sun M, Wu J, Zhang Z. Breast cancer mitotic cell detection using cascade convolutional neural network with U-Net. Math Biosci Eng. 2020;18(1):673–95. doi:10.3934/mbe.2021036. [Google Scholar] [PubMed] [CrossRef]
39. Wang X, Zhang J, Yang S, Xiang J, Luo F, Wang M, et al. A generalizable and robust deep learning algorithm for mitosis detection in multicenter breast histopathological images. Med Image Anal. 2023;84(3):102703. doi:10.1016/j.media.2022.102703. [Google Scholar] [PubMed] [CrossRef]
40. Sreekala K, Rajkumar N, Sugumar R, Daya Sagar KV, Shobarani R, Krishnamoorthy KP, et al. Skin diseases classification using hybrid AI based localization approach. Comput Intell Neurosci. 2022;2022(2):6138490. doi:10.1155/2022/6138490. [Google Scholar] [PubMed] [CrossRef]
41. Mercan C, Balkenhol M, Salgado R, Sherman M, Vielh P, Vreuls W, et al. Deep learning for fully-automated nuclear pleomorphism scoring in breast cancer. npj Breast Cancer. 2022;8(1):120. doi:10.1038/s41523-022-00488-w. [Google Scholar] [PubMed] [CrossRef]
42. Yu W, Liu Y, Zhao Y, Huang H, Liu J, Yao X, et al. Deep learning-based classification of cancer cell in leptomeningeal metastasis on cytomorphologic features of cerebrospinal fluid. Front Oncol. 2022;12:821594. doi:10.3389/fonc.2022.821594. [Google Scholar] [PubMed] [CrossRef]
43. Sreeraj M, Joy J. A machine learning based framework for assisting pathologists in grading and counting of breast cancer cells. ICT Express. 2021;7(4):440–4. doi:10.1016/j.icte.2021.02.005. [Google Scholar] [CrossRef]
44. Salvi M, Acharya UR, Molinari F, Meiburger KM. The impact of pre- and post-image processing techniques on deep learning frameworks: a comprehensive review for digital pathology image analysis. Comput Biol Med. 2021;128(3):104129. doi:10.1016/j.compbiomed.2020.104129. [Google Scholar] [PubMed] [CrossRef]
45. Ben Hamida A, Devanne M, Weber J, Truntzer C, Derangère V, Ghiringhelli F, et al. Deep learning for colon cancer histopathological images analysis. Comput Biol Med. 2021;136(7):104730. doi:10.1016/j.compbiomed.2021.104730. [Google Scholar] [PubMed] [CrossRef]
46. El-Ghany SA, Azad M, Elmogy M. Robustness fine-tuning deep learning model for cancers diagnosis based on histopathology image analysis. Diagnostics. 2023;13(4):699. doi:10.3390/diagnostics13040699. [Google Scholar] [PubMed] [CrossRef]
47. Sakthi Prabha R, Vadivel M. Brain tumor stages prediction using FMS-DLNN classifier and automatic RPO-RG segmentation. Int J Electr Electron Eng. 2023;10(2):110–21. doi:10.14445/23488379/ijeee-v10i2p111. [Google Scholar] [CrossRef]
48. Yu WH, Li CH, Wang RC, Yeh CY, Chuang SS. Machine learning based on morphological features enables classification of primary intestinal T-cell lymphomas. Cancers. 2021;13(21):5463. doi:10.3390/cancers13215463. [Google Scholar] [PubMed] [CrossRef]
49. Faridi P, Danyali H, Helfroush MS, Jahromi MA. An automatic system for cell nuclei pleomorphism segmentation in histopathological images of breast cancer. In: 2016 IEEE Signal Processing in Medicine and Biology Symposium (SPMB); 2016 Dec 3; Philadelphia, PA, USA; 2016. p. 1–5. doi:10.1109/SPMB.2016.7846861. [Google Scholar] [CrossRef]
50. Boroujeni AM, Yousefi E, Haseeb MA, Gupta R. Computer-assisted diagnosis of breast cancer by cell network matrix extraction and multilayer perceptron analysis. Ann Clin Lab Sci. 2020;50(2):175–81. [Google Scholar] [PubMed]
51. Rashmi R, Prasad K, Udupa CBK. Breast histopathological image analysis using image processing techniques for diagnostic puposes: a methodological review. J Med Syst. 2021;46(1):7. doi:10.1007/s10916-021-01786-9. [Google Scholar] [PubMed] [CrossRef]
52. Hu Y, Su F, Dong K, Wang X, Zhao X, Jiang Y, et al. Deep learning system for lymph node quantification and metastatic cancer identification from whole-slide pathology images. Gastric Cancer. 2021;24(4):868–77. doi:10.1007/s10120-021-01158-9. [Google Scholar] [PubMed] [CrossRef]
53. Jansen P, Baguer DO, Duschner N, Arrastia JL, Schmidt M, Landsberg J, et al. Deep learning detection of melanoma metastases in lymph nodes. Eur J Cancer. 2023;188(9):161–70. doi:10.1016/j.ejca.2023.04.023. [Google Scholar] [PubMed] [CrossRef]
54. Zhuang Q, Dai Z, Wu J. Deep active learning framework for lymph node metastasis prediction in medical support system. Comput Intell Neurosci. 2022;2022:4601696. doi:10.1155/2022/4601696. [Google Scholar] [PubMed] [CrossRef]
55. Dohopolski M, Chen L, Sher D, Wang J. Predicting lymph node metastasis in patients with oropharyngeal cancer by using a convolutional neural network with associated epistemic and aleatoric uncertainty. Phys Med Biol. 2020;65(22):225002. doi:10.1088/1361-6560/abb71c. [Google Scholar] [PubMed] [CrossRef]
56. Qian W, Li Z, Chen W, Yin H, Zhang J, Xu J, et al. RESOLVE-DWI-based deep learning nomogram for prediction of normal-sized lymph node metastasis in cervical cancer: a preliminary study. BMC Med Imaging. 2022;22(1):221. doi:10.1186/s12880-022-00948-6. [Google Scholar] [PubMed] [CrossRef]
57. Zhao Y, Zhang J, Hu D, Qu H, Tian Y, Cui X. Application of deep learning in histopathology images of breast cancer: a review. Micromachines. 2022;13(12):2197. doi:10.3390/mi13122197. [Google Scholar] [PubMed] [CrossRef]
58. Khan A, Brouwer N, Blank A, Müller F, Soldini D, Noske A, et al. Computer-assisted diagnosis of lymph node metastases in colorectal cancers using transfer learning with an ensemble model. Mod Pathol. 2023;36(5):100118. doi:10.1016/j.modpat.2023.100118. [Google Scholar] [PubMed] [CrossRef]
59. Abdollahi J, Davari N, Panahi Y, Gardaneh M. Detection of metastatic breast cancer from whole-slide pathology images using an ensemble deep-learning method. Arch Breast Cancer. 2022;9(3):364–76. doi:10.32768/abc.202293364-376. [Google Scholar] [CrossRef]
60. Jarkman S, Karlberg M, Pocevičiūtė M, Bodén A, Bándi P, Litjens G, et al. Generalization of deep learning in digital pathology: experience in breast cancer metastasis detection. Cancers. 2022;14(21):5424. doi:10.3390/cancers14215424. [Google Scholar] [PubMed] [CrossRef]
61. Khened M, Kori A, Rajkumar H, Krishnamurthi G, Srinivasan B. A generalized deep learning framework for whole-slide image segmentation and analysis. Sci Rep. 2021;11(1):11579. doi:10.1038/s41598-021-90444-8. [Google Scholar] [PubMed] [CrossRef]
62. Bejnordi BE, Linz J, Glass B, Mullooly M, Gierach GL, Sherman ME, et al. Deep learning-based assessment of tumor-associated stroma for diagnosing breast cancer in histopathology images. arXiv:1702.05803. 2017. [Google Scholar]
Cite This Article
 Copyright © 2025 The Author(s). Published by Tech Science Press.
This work is licensed under a Creative Commons Attribution 4.0 International License , which permits unrestricted use, distribution, and reproduction in any medium, provided the original work is properly cited.
 Downloads
 Citation Tools