
 Submit a Paper
 Propose a Special lssue
 Open Access
ARTICLE
A Pneumonia Recognition Model Based on Multiscale Attention Improved EfficientNetV2
1 School of Computer Science, Hunan University of Technology, Zhuzhou, 412007, China
2 Hubei Central China Technology Development of Electric Power Co., Ltd., Wuhan, 430000, China
* Corresponding Author: Qiang Liu. Email:
Computers, Materials & Continua 2025, 84(1), 513-536. https://doi.org/10.32604/cmc.2025.063257
Received 09 January 2025; Accepted 03 April 2025; Issue published 09 June 2025
 View Full Text
 Download PDF
Abstract
To solve the problems of complex lesion region morphology, blurred edges, and limited hardware resources for deploying the recognition model in pneumonia image recognition, an improved EfficientNetV2 pneumonia recognition model based on multiscale attention is proposed. First, the number of main module stacks of the model is reduced to avoid overfitting, while the dilated convolution is introduced in the first convolutional layer to expand the receptive field of the model; second, a redesigned improved mobile inverted bottleneck convolution (IMBConv) module is proposed, in which GSConv is introduced to enhance the model’s attention to inter-channel information, and a SimAM module is introduced to reduce the number of model parameters while guaranteeing the model’s recognition performance; finally, an improved multi-scale efficient local attention (MELA) module is proposed to ensure the model’s recognition ability for pneumonia images with complex lesion regions. The experimental results show that the improved model has a computational complexity of 1.96 GFLOPs, which is reduced by 32% relative to the baseline model, and the number of model parameters is also reduced, and achieves an accuracy of 86.67% on the triple classification task of the public dataset Chest X-ray, representing an improvement of 2.74% compared to the baseline model. The recognition accuracies of ResNet50, Inception-V4, and Swin Transformer V2 on this dataset are 84.36%, 85.98%, and 83.42%, respectively, and their computational complexities and model parameter counts are all higher than those of the proposed model. This indicates that the proposed model has very high feasibility for deployment in edge computing or mobile healthcare systems. In addition, the improved model achieved the highest accuracy of 90.98% on the four-classification public dataset compared to other models, indicating that the model has better recognition accuracy and generalization ability for pneumonia image recognition.Keywords
Pneumonia, a prevalent lung disease frequently caused by diverse pathogens, is typically classified into three etiological categories: bacterial, viral, and fungal infections. Viral pneumonia is often mild, whereas bacterial pneumonia is typically severe [1]. Each year, over 150 million individuals, primarily children under the age of five, are affected by pneumonia [2]. Pneumonia ranks among the top causes of hospitalization and mortality, with its potential to trigger severe complications that significantly elevate patient death rates. Therefore, early diagnosis of pneumonia is of great significance. Medical imaging technology plays a crucial role in pneumonia diagnosis. Among them, chest X-ray (CXR) is one of the preferred imaging methods because of its easy operation, relatively low cost and low radiation exposure. However, the presentation of pneumonia on chest X-ray images is generally unclear and easily confused with other diseases, which often affects the radiologist’s judgment and decision-making. Different types of pneumonia appear differently on X-rays, and conventional human-based diagnostic approaches frequently lack efficiency and carry risks of oversight and incorrect diagnosis, depending on the doctor’s personal experience or other objective factors. Therefore, the use of computer-aided diagnosis and the proposal of an efficient and accurate method for recognizing pneumonia under X-ray are essential.
Pneumonia image recognition methods have received a great deal of attention from researchers. Earlier recognition methods usually consisted of extracting image features using manual or shallow neural networks followed by a combination of machine learning methods for classification. Oliveira et al. [3] used eight wavelet transform coefficients to extract texture features followed by a weighted nearest neighbor method to identify pneumonia images. Yao et al. [4] proposed a computer-aided detection method that utilized texture analysis and support vector machine (SVM) classification. This method was evaluated on 40 chest computed tomography (CT) scans to differentiate normal and abnormal lung regions. Shi et al. [5] developed a lesion size-adaptive random forest framework for pneumonia classification. This approach automatically stratified patients based on infection severity levels, with group-specific random forest models demonstrating superior classification performance. Sousa et al. [6] extracted texture-based features from pneumonia images and applied sequential forward elimination to select relevant features, which were then classified using SVM, K-Nearest Neighbors (KNN), and Naive Bayes algorithms. However, the effectiveness of feature extraction in the above algorithms is often highly dependent on the experience and domain knowledge of the researcher, and due to human cognitive limitations and data complexity, some features that are crucial to model prediction may be omitted during feature extraction, leading to poor recognition results.
Recent advancements in computing power and the availability of large-scale datasets have facilitated the gradual rise of deep learning technology. Unlike conventional feature extraction approaches that rely heavily on expert heuristics, this method autonomously identifies data-driven patterns, thereby reducing human dependency while enhancing model adaptability and generalization. There have been many research methods for pneumonia recognition based on deep learning especially Convolutional Neural Networks (CNN). Khan et al. [7] used Xception based CNN model to detect pneumonia. They modified the Xception model by appending a dropout layer and two fully connected layers, both incorporating dropout functionality, at its conclusion. Wong et al. [8] introduced a novel deep learning approach called Multi-scale Attention Network (MSANet) for automatically classifying Corona Virus Disease 2019 (COVID-19), which effectively focuses on the distinguishing features and multi-scale information of pneumonia lesions. Li et al. [9] proposed a hybrid model that builds upon the InceptionV3 architecture. This model incorporates deep separable convolution following the Inception module and integrates the squeezing and excitation (SE) mechanism. By doing so, the model is able to capture more diverse features without a substantial increase in parameter count or computational burden, thereby significantly enhancing its capability in predicting and classifying lung diseases. Wang et al. [10] proposed an attention-based DenseNet pneumonia classification method to focus more on the pneumonia region and achieved 92.8% accuracy on the Chest X-ray [11] dataset. Singh et al. [12] introduced the Quadratic Channel Spatial Attention (QCSA) Network, integrating spatial and channel attention modules with Quadratic Residual Networks to enable pneumonia detection from chest X-ray imagery. Arun et al. [13] introduced a method to enhance images and developed a stacked classifier that integrates deep learning feature fusion. Subsequently, they applied this integrated stacked classifier for pneumonia classification.
Although there are numerous diagnostic algorithms for pneumonia classification and deep learning-based algorithms have achieved better results, the lesion areas in chest X-ray often have the problems of complex morphology and blurred edges of the lesion areas, and most of the pneumonia classifications are normal-abnormal classifications, which seldom involves the classification of multiple types of pneumonia, which makes it difficult to truly realize the automatic identification of pneumonia in clinical diagnosis. Moreover, the high accuracy of the aforementioned existing pneumonia recognition models often relies on deep network hierarchies or relatively complex network designs, and they often perform poorly in resource-constrained medical clinical environments.
Currently, numerous algorithms improved based on EfficientNetV2 [14] have been widely applied to the domain of medical imaging analysis due to their high efficiency and accuracy, and have shown remarkable results. Pacal et al. [15] developed a modified variant of the EfficientNetV2 architecture that integrates two distinct attention mechanisms to enhance the accuracy of brain tumor classification tasks. Through multiple experimental validations implemented on a large publicly available dataset, their proposed model demonstrated extremely high classification accuracy, setting a new benchmark for brain tumor classification. Huang et al. [16] developed a new lightweight CNN architecture named LightEfficientNetV2. The method first follows the first two convolutional layers of AlexNet, and then selects two convolutional modules, MBConv and Fused-MBConv, from EfficientNetV2 and adds two self-designed convolutional modules to construct the complete network. Their conclusions show that LightEfficientNetV2 exhibits excellent performance on different datasets of both chest X-ray and CT images. In addition, EfficientNetV2 has the following characteristics: first, EfficientNetV2 adopts a composite scaling method, which allows the model to scale in a balanced manner, and is able to effectively reduce the parameters and computation while maintaining the model’s accuracy; second, EfficientNetV2 excels in resource-constrained environments, which makes it ideal for many practical application scenarios.
The above analysis shows that the improved algorithm based on EfficientNetV2 has great potential for pneumonia recognition. Therefore, to solve the problem that most of the existing pneumonia recognition methods are binary classification, have low accuracy in recognizing pneumonia images with complex lesion areas and are difficult to operate in resource-constrained environments, and to design a multi-category pneumonia classification and recognition model that takes into account the efficiency and performance, an improved model is proposed in this study based on EfficientNetV2. The model is lighter than the baseline model and possesses better classification performance. The study’s major contributions are outlined below:
(1) The overall architecture of the model is adjusted to reduce the number of main modules to reduce the complexity of the model and avoid the overfitting phenomenon, based on which the dilated convolution is introduced into the initial convolution layer instead of the original ordinary convolution, which ensures that the receptive field is enlarged without increasing parameter count, and effectively improves the feature extraction capability of the network.
(2) The IMBConv module is proposed, which introduces the GSConv [17] instead of the depth-separable convolution of the original module, so that the model can effectively obtain the connection between the channels of each feature map; and the Squeeze-and-Excitation (SE) module [18] is replaced by the SimAM module [19], which reduces parameter count, and improves the computational efficiency of the model while maintaining a better performance.
(3) Combining the improved MELA module with EfficientNetV2, the MELA module will fuse the multi-scale features and attention to ensure the acquisition of the precise location information of the image region of interest, improving the performance of the model for pneumonia recognition.
(4) The improved model is applied to multi-class pneumonia recognition and achieves high classification performance in multiple experiments, while being more lightweight compared to the original model. In order to deeply confirm the ability of the improved network in pneumonia recognition, the input pneumonia images are visualized using Gradient-weighted Class Activation Mapping (Grad-CAM) [20] and SHapley Additive Explanation (SHAP) [21].
2 Proposed Research Methodology
2.1 Introduction to the EfficientNetV2 Model
EfficientNetV2 is an improved network based on EfficientNet [22]. This network is an efficient and fast deep learning model, suitable for various computer vision tasks. EfficientNetV2 employs a composite scaling method, which strikes a superior equilibrium between model accuracy and computational efficiency by introducing the fused mobile inverted bottleneck convolution (Fused-MBConv) layer, optimized Neural Architecture Search (NAS), and an incremental learning strategy. It surpasses its predecessor in both training velocity and parameter effectiveness, and achieves excellent performance on multiple benchmark datasets. This bodes well for its ability to cope with the task of classifying multiple types of pneumonia, thus overcoming the limitations of existing pneumonia classification algorithms that are mostly binary and have low recognition accuracy. More importantly, EfficientNetV2 achieves faster training speed and higher parameter efficiency compared to other deep learning models. This means that even in mobile devices or resource-constrained environments, EfficientNetV2 can maintain high performance without deployment difficulties due to the deep network structure. Therefore, combining these advantages, EfficientNetV2 is chosen as the improved baseline model.
MBConv and Fused-MBConv are the main building blocks of the EfficientNetV2 model. To expedite model training, Fused-MBConv modules are deployed in the initial layers, whereas MBConv modules are utilized in deeper sections of the network. The MBConv module is shown in Fig. 1a, which consists of two 1 × 1 convolutional kernels, one 3 × 3 depthwise convolutional kernel, an SE module, and a dropout layer. At the beginning of the module first use 1 × 1 convolution kernel to uplift the input feature map to increase the number of channels and lower the computational cost of the subsequent operations, after the depthwise convolution and SE module, use 1 × 1 convolution again for the downlift process to reduce the number of channels, so that the number of channels of the output feature map is the same as the input of the module, and finally the processed feature map is obtained through the dropout layer. Due to the limited acceleration support of current hardware for depthwise separable convolution (DSConv), a 3 × 3 convolution is used in the Fused-MBConv module to replace the 1 × 1 ascending convolution as well as the 3 × 3 depthwise convolution, as shown in Fig. 1b. This architecture enhances feature extraction across both shallow and deep layers, shortens training duration, and boosts overall model performance.
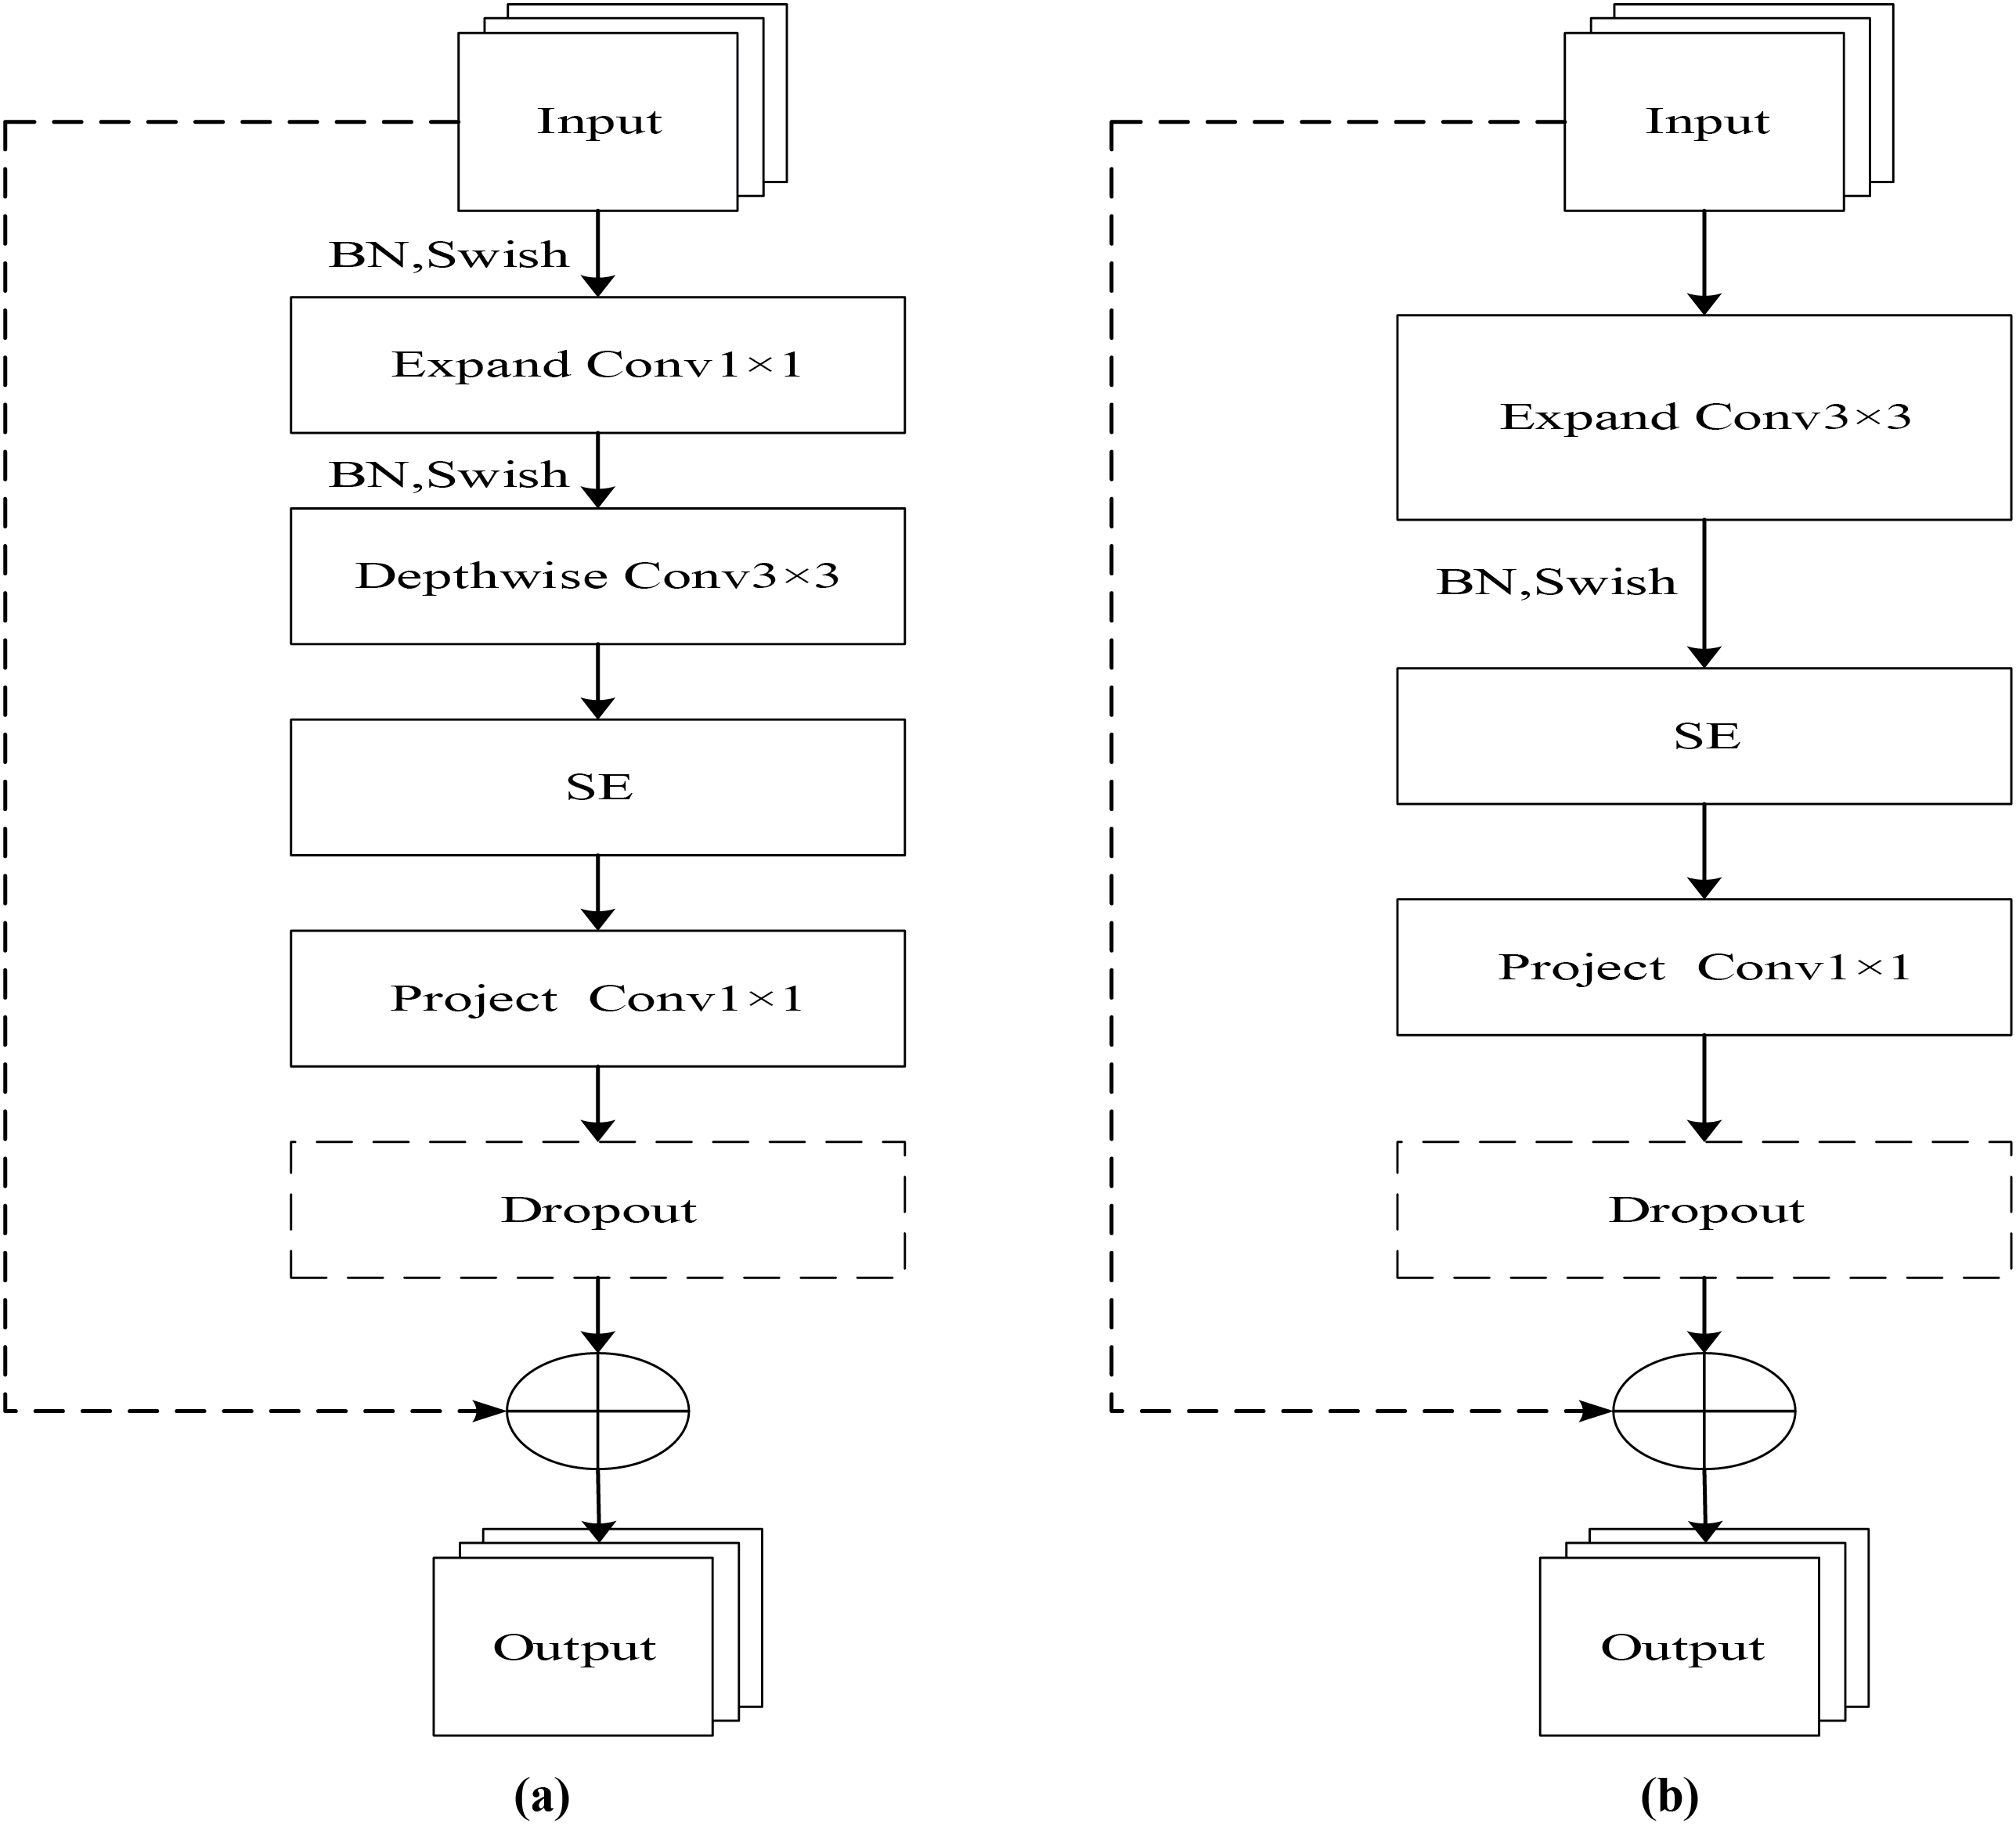
Figure 1: Structure of MBConv and Fuse-MBConv modules. (a) MBConv; (b) Fuse-MBConv
In this study, pneumonia is multicategorized, and there is often an imbalance in the number of datasets. EfficientNetV2 stacks a large number of MBConv modules as well as Fused-MBConv modules, which will lead to the model being prone to the phenomenon of overfitting. In addition, the original EfficientNetV2 uses a large number of depthwise separable convolutions, which results in the model not being able to effectively obtain the inter-channel connections in the process of feature extraction and thus losing some semantic information. Finally, the various pneumonia representations under X-ray are often very similar, requiring the model to be able to extract image features more accurately.
2.2 Introduction to the Improved EfficientNetV2 Model
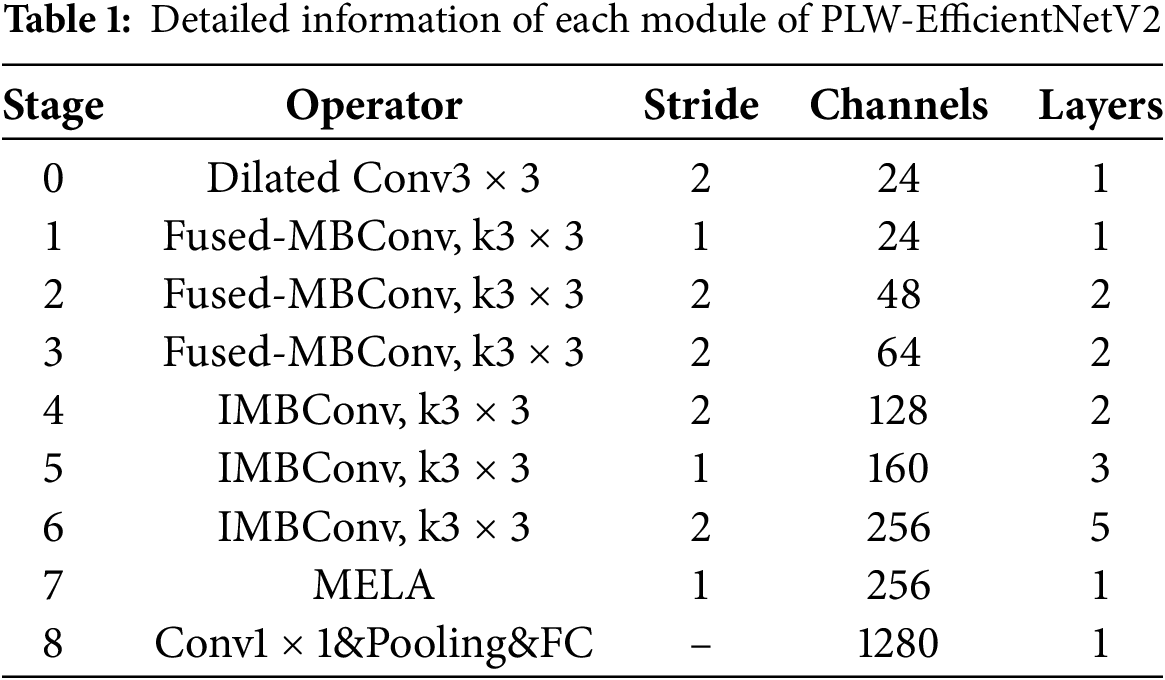
To address the above problems, this study further improves EfficientNetV2 and proposes a PLW-EfficientNetV2 that is lighter and more effective, and the overall structure is shown in Fig. 2. The detailed information of each module of PLW-EfficientNetV2 is shown in Table 1.
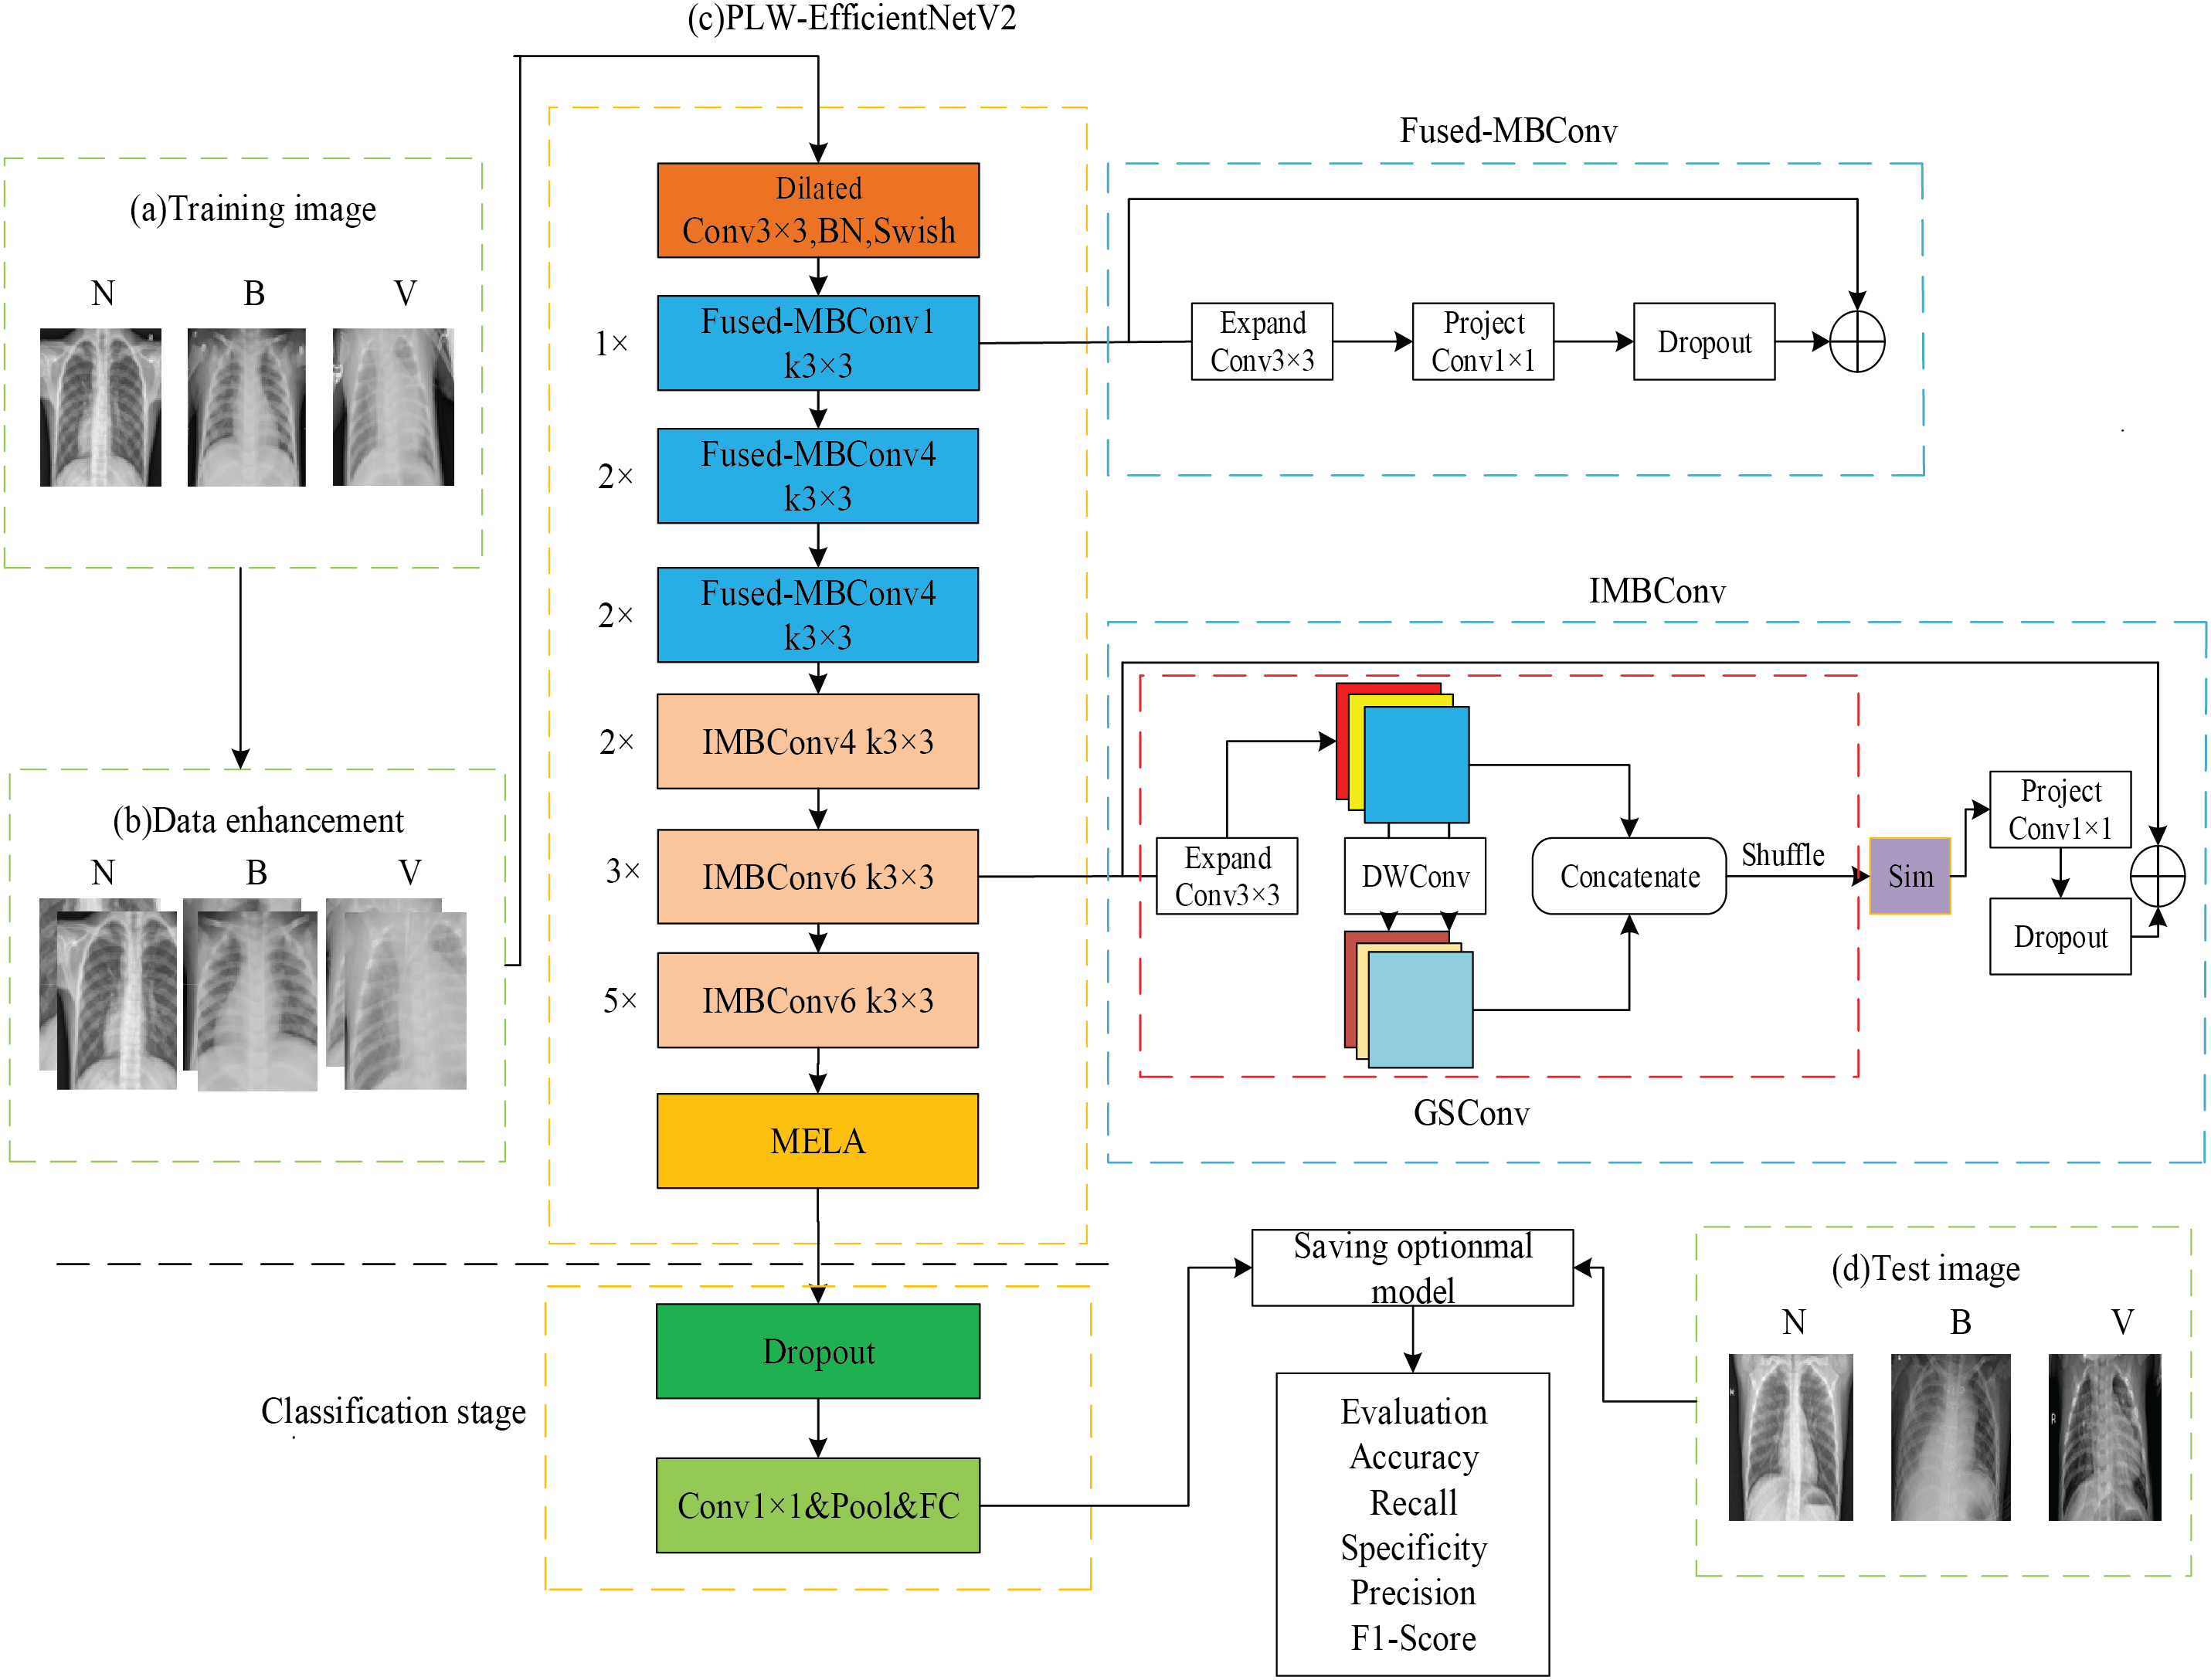
Figure 2: Overall structure of PLW-EfficientNetV2
In Fig. 2a, N refers to a normal image, B refers to a bacterial pneumonia image, and V refers to a viral pneumonia image, which serve as training samples for PLW-EfficientNetV2. In Fig. 2b, to increase the diversity of the training samples, PLW-EfficientNetV2 enhances the images by random cropping and horizontal flipping operations, followed by using image normalization techniques so that each pixel in the image is correlated with the global mean and standard deviation, thereby maintaining the global information and non-linear characteristics of the images.
In Fig. 2c, the improved model is trained using training images, which is the core stage of the entire recognition process. Initially comes the stage of feature extraction, the input image is pre-processed to be resized to 224 × 224. Dilated convolution enhances the model’s receptive field by spacing out the elements of a standard convolution kernel with a fixed gap, without incrementing the number of computational elements, thereby avoiding the introduction of extra parameters. The work by Yu et al. [23] demonstrates that dilated convolution can enable exponential growth of the receptive field while maintaining both resolution and coverage. Therefore, after entering the feature extraction network, it first undergoes a 3 × 3 dilated convolution, which enlarges the receptive field and enables the model to thoroughly capture the semantic information of pneumonia. Then, following the idea of the original EfficientNetV2, the extraction of low-level pneumonia features is enhanced by the Fused-MBConv module. Subsequently, the high-level features of pneumonia are further extracted by increasing the inter-channel linkage of the input image feature map through the IMBConv module in the deep network to obtain the pneumonia detail information. Then, after the last IMBConv module, a MELA module is added to obtain the multi-scale fusion pneumonia semantic information and enhance the model to extract important features. Finally, the classification stage is entered to classify the pneumonia images and save the best model weights by combining each evaluation metric.
In Fig. 2d, the test images also include three categories of images for evaluating the overall recognition performance of PLW-EfficientNetV2.
2.3.1 Introduction of the GSConv Module
In MBConv module, DSConv processes the feature map information, but DSConv does not acquire the link between the channels of each feature map, which results in the model not being able to recognize well for the pneumonia images with a high degree of similarity. Therefore, GSConv is introduced to replace DSConv in the MBConv module to further acquire the link between the channels. GSConv passes the information produced by the channel-dense convolution into the individual feature maps generated by the DSConv by using the shuffle operation, which enables the model to achieve high performance using the lowest possible complexity. The time complexity of DSConv and GSConv are shown in Eqs. (1) and (2), respectively:
It can be seen that compared with DSConv, the time complexity of GSConv is similar, and the use of the GSConv module can reduce the loss of inter-channel information during feature extraction, maintain the integrity of semantic information, and further improve the model performance, and its detailed structure is shown in Fig. 3.
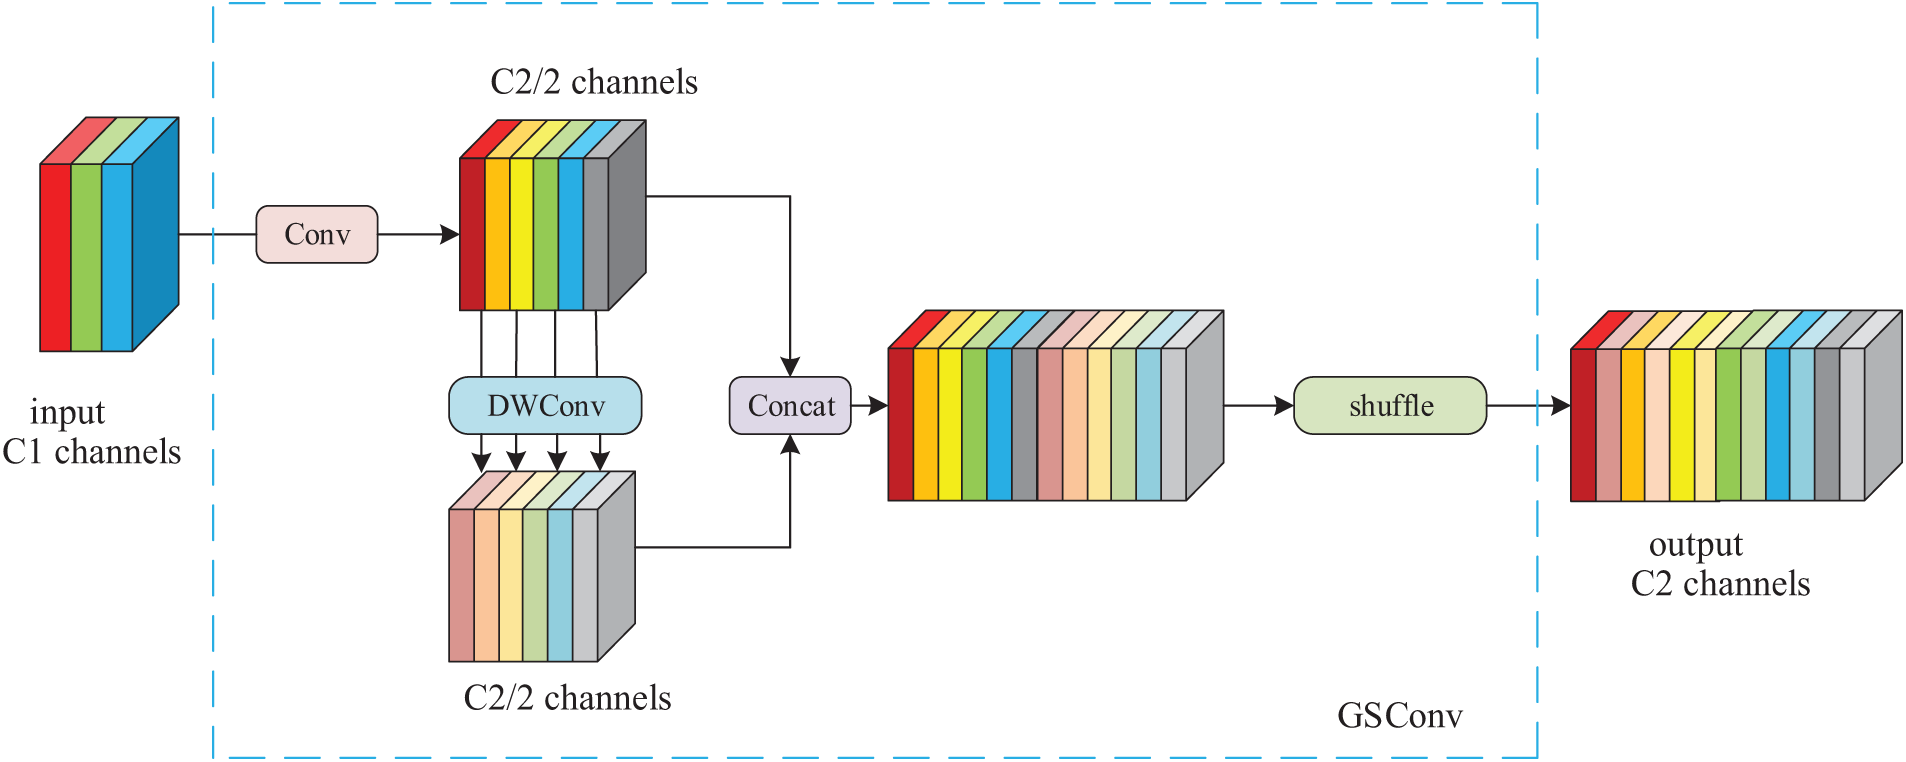
Figure 3: Structure of GSConv module
In Fig. 3, it can be found that GSConv first performs a standard convolution, dividing the processed feature map’s channels into two groups. One group remains unchanged, while the other group is further processed by depthwise convolution to reduce computational complexity while extracting features. The features output from these two branches are then concatenated channel-wise. Subsequently, a shuffle operation is performed to facilitate inter-channel information flow, integrating the inter-channel information obtained from the standard convolution into the final output feature map.
2.3.2 Introduction of the SimAM Module
Yang et al. [19] developed SimAM, a novel attention mechanism for convolutional neural networks, which is straightforward in design but demonstrates strong performance. They added various attention modules, including SE, CBAM [24] and ECA [25], to the ResNet [26] family of models and the MobileNetV2 [27] model for image classification experiments, respectively. Their experimental results demonstrate that incorporating the SimAM module yields superior performance across multiple benchmark datasets compared to models integrating other attention mechanisms, all while maintaining equivalent parameter counts. Therefore, in order to construct a lightweight model and ensure the recognition ability of the model, this study introduces the SimAM module to replace the SE module. The SE module improves the network performance by dynamically adjusting the channel weights of the feature maps and uses two fully connected layers to calculate the channel attention weights. However, the SE module operates globally in all the channels and neglects spatial data interaction, causing loss of certain spatial details and increasing computational load due to numerous fully connected layers, resulting in a redundant model and a proliferation of parameters. The SE module’s structure is illustrated in Fig. 4.
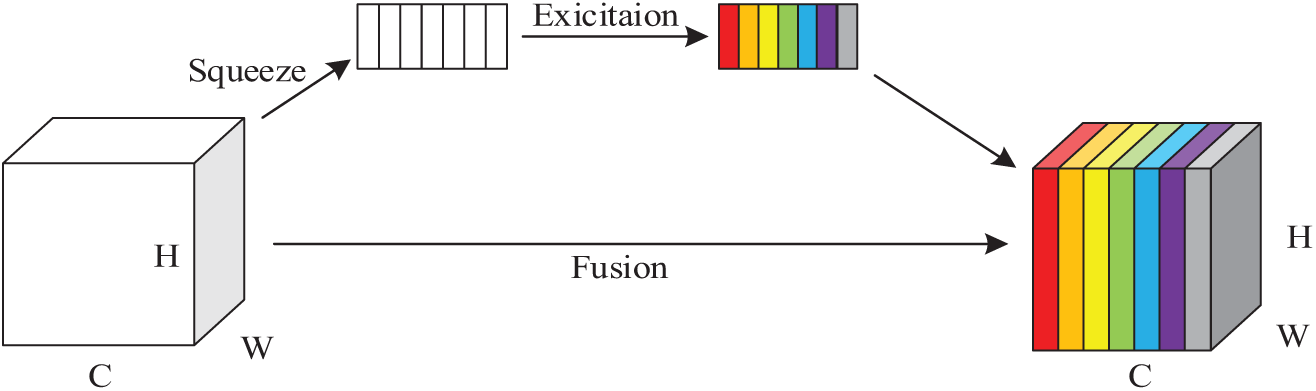
Figure 4: SE module structure
Different from the original channel-based weight assignment, which will miss some important information and has high computational complexity, the SimAM module can compute 3D attention weights for the intermediate feature maps without expanding the model’s parameter count, improve the expressive ability of the model features, and find the information-rich key features through the computation of the divisibility between the features to lower the complexity and enhance processing speed. The SimAM model structure is shown in Fig. 5. The feature map X(X ∈ RC × H × W) of the input image R has C channels, and there exists a neuron M composed of H × W feature maps in each channel, and since the neurons composed of the same channel have the same distribution, the mean and variance of the neurons can be computed first to get the attentional weights in the feature map, which are multiplied with the original input feature map to highlight important features while diminishing trivial ones, with the weighted feature map serving as the output of the attention module.
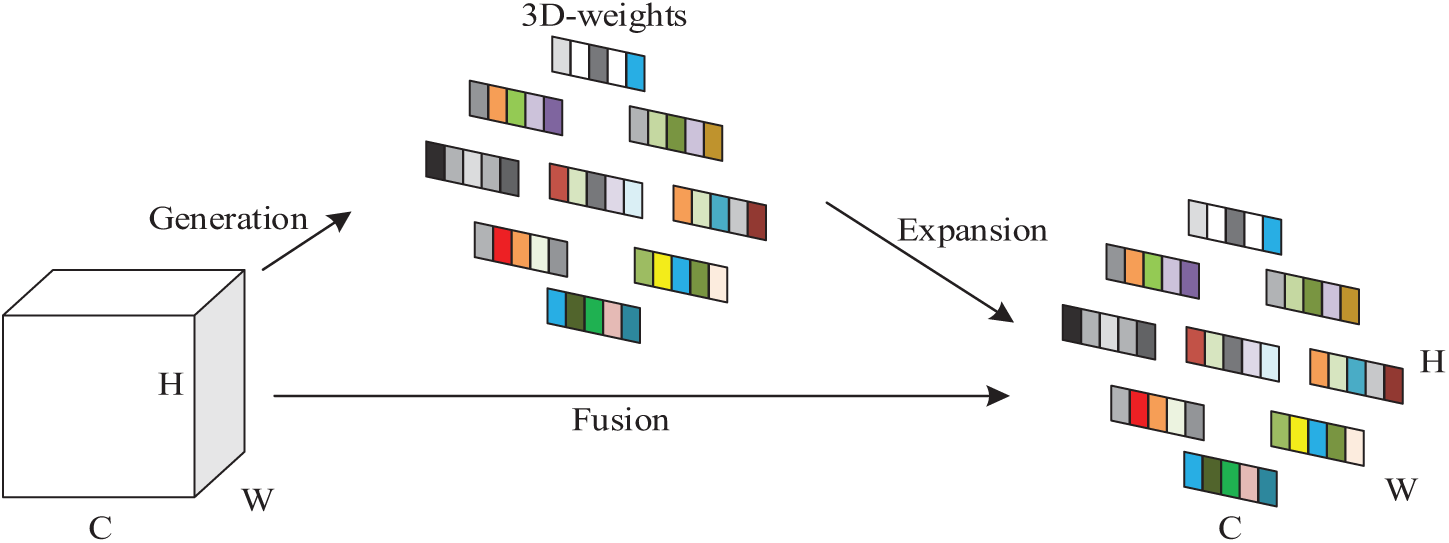
Figure 5: SimAM module structure
2.4 Improved Efficient Local Attention Module
To address the problem that lesion regions in pneumonia images often appear to have inconspicuous sizes and blurred edges that are difficult to distinguish, using only a single-scale module often fails to extract information effectively. Li et al. [28] proposed the Multiscale Attention Guided Deep Network, which extracts attention on feature maps of multiple sizes and estimates points of interest at various scales. Finally, it evaluates the prediction vector generated by the encoder through attention pooling to obtain classification results, achieving better classification performance on multiple pneumonia image datasets. Building upon the integration of a multi-scale dense network and a residual attention network with hierarchical scales, Fu et al. [29] developed a hybrid architecture designed to extract and enhance deep hierarchical features for the fusion of magnetic resonance and nuclear medicine imagery. Comparative experimental analyses demonstrate that this approach produces fusion outcomes with enhanced detail preservation and superior objective metric performance when benchmarked against contemporary medical image fusion methodologies. Combining the above work, it can be found that the multi-scale attention module can further fuse pneumonia image feature information, enabling the model to obtain richer pathological information. For this reason, the multi-scale efficient local attention (MELA) module is introduced after the last MBConv module. The Efficient Local Attention (ELA) module [30] computes feature vectors along horizontal and vertical axes using spatial band pooling, while preserving an elongated kernel structure to model long-range dependencies. Then the feature vectors in these two directions are processed independently for attention prediction and finally they are integrated by a product operation, which ensures the acquisition of information about important regions in the pneumonia image. However, the ELA module only integrates the local information, and to further integrate the deep feature information, the ELA module is partially improved in this study. As shown in Fig. 6, the improved MELA module uses convolution kernels with different receptive field sizes for input feature maps to obtain multi-scale semantic information, and in order to retain part of the information of the input feature maps and promote the flow of information, residual connections are further added, so that the input to the ELA module not only integrates the information of the original feature maps, but also contains the multi-scale fusion of semantic information, which improves the feature extraction performance of the ELA module.
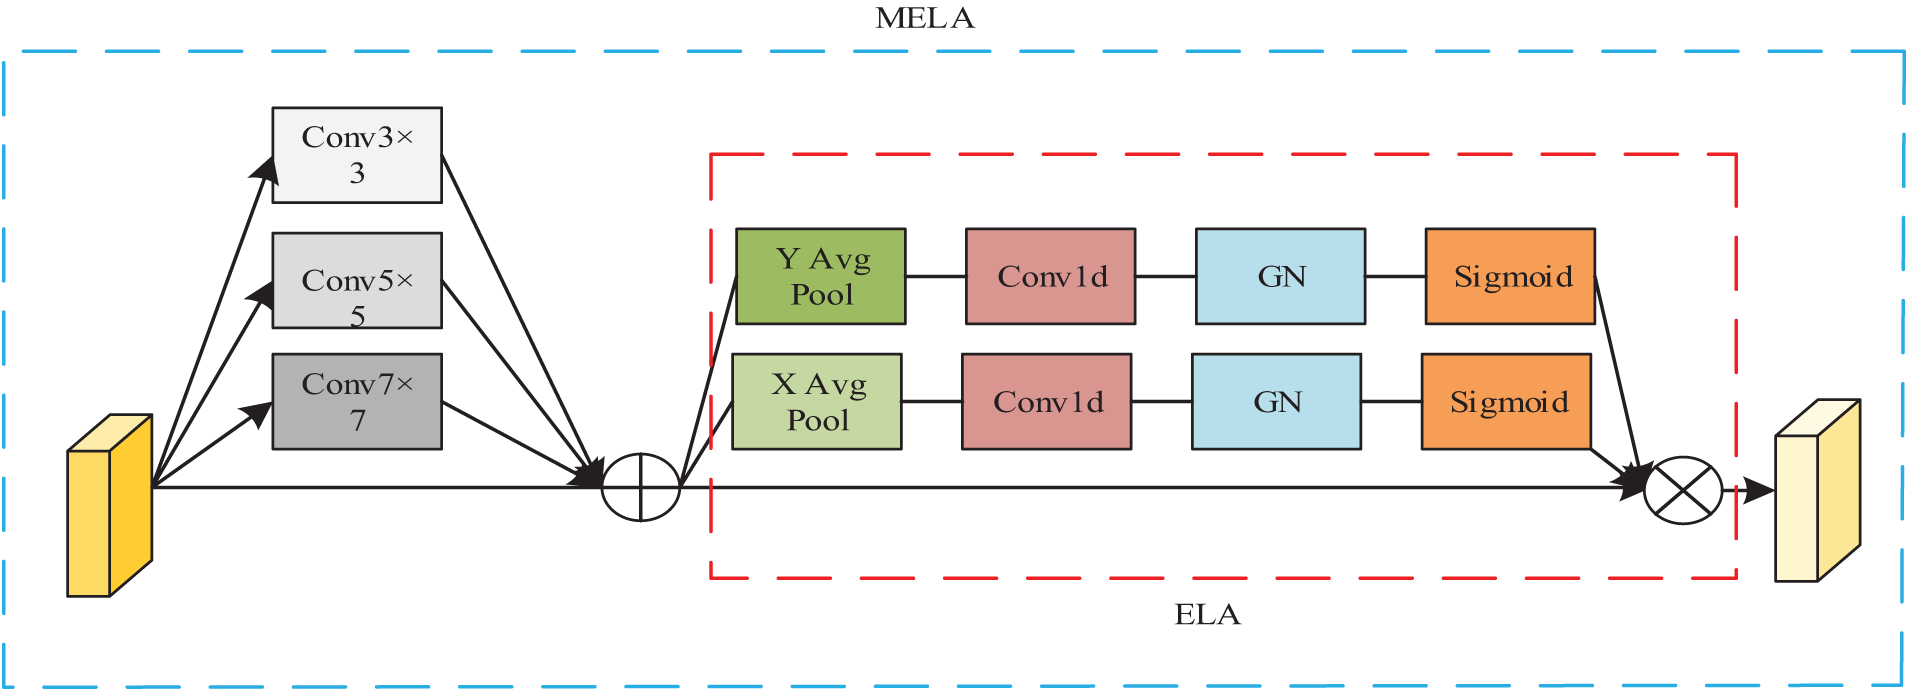
Figure 6: Structure of MELA module
3 Experimental Results and Analysis
The experimental data were sourced from the publicly available Chest X-ray dataset [11]. The dataset comprised a total of 5856 lung X-ray images, with 1583 normal images and 4273 pneumonia-labeled images. According to the labeling of pneumonia type in the dataset, it can be further subdivided into bacterial pneumonia and viral pneumonia, with the number of images being 2780 and 1493, respectively, and the data distribution are shown in Table 2. The image samples in the dataset are shown in Fig. 7.
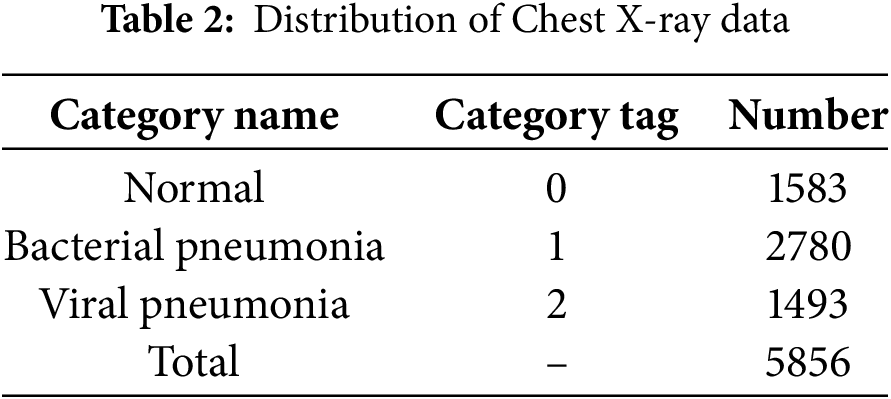
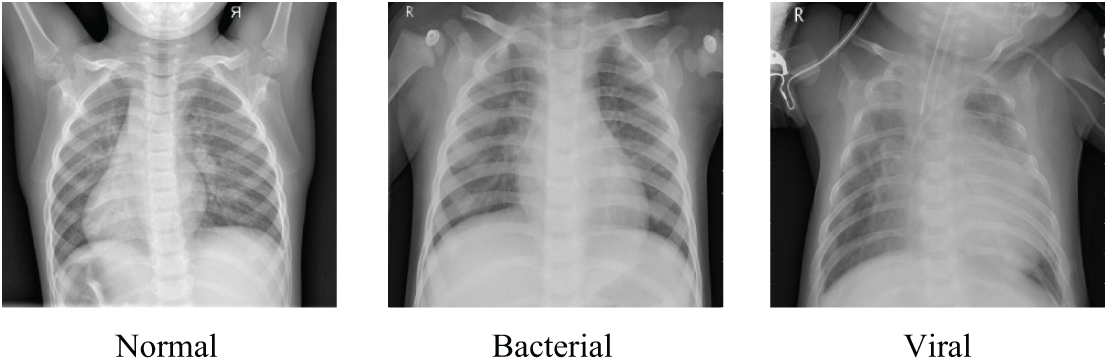
Figure 7: Samples from the Chest X-rays dataset
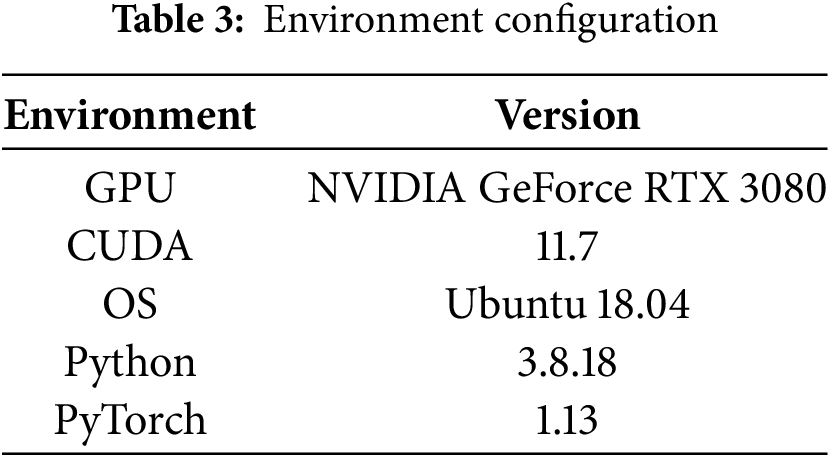
The experimental architecture is constructed using Python programming language and implemented within the PyTorch deep learning ecosystem, and the details of the required runtime environment configuration for the experiment are shown in Table 3.
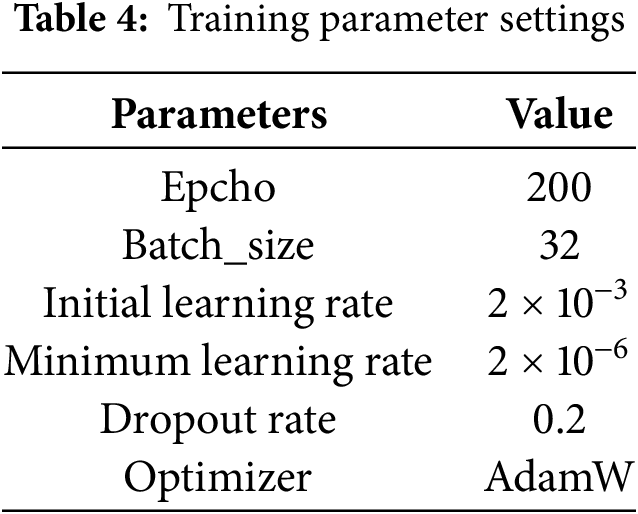
During the experiments, we utilized the AdamW optimizer, AdamW mitigates the overfitting issue inherent in the Adam optimizer by integrating L2 regularization into the loss function for the model parameters. This optimizer stands out as the fastest in terms of gradient descent speed and neural network training efficiency. Additionally, to enhance training stability and convergence rate, we implemented real-time decay for the learning rate. The details of the parameters during the experiment are shown in Table 4.
In order to accurately assess the performance of the pneumonia image recognition model proposed in this study, Accuracy (A), Precision (P), Recall (R), Specificity (S), and F1-Score (F1) are used as evaluation metrics, which are calculated as shown in Eqs. (3)–(7).
Furthermore, the experimental outcomes are displayed in a more intuitive manner through the use of a confusion matrix. In this matrix, rows indicate actual labels, columns indicate predicted labels, and diagonal elements show correct predictions per category. In addition, the size and complexity of the model are measured using the parametric quantity (Params) and the floating point operations (FLOPs).
The experimental procedures in this study are as follows:
(1) Randomly split the pneumonia image dataset samples into a training set and a test set at an 8:2 ratio, and use 10% of the training data as a validation set.
(2) For the training set, first randomly crop the images to 224 × 224 pixels, then perform horizontal flipping to enhance data diversity. Next, convert the images into tensors through data type conversion. Finally, to ensure the uniformity and comparability of pixel values across different channels, standardization processing is required.
(3) Use the processed images as input and output the corresponding labels. Additionally, train using PLW-EfficientNetV2. Monitor and save metrics. Select the weights that perform best in these metrics as the final weights to obtain the optimized model.
(4) Select test samples and resize the images to 256 × 256 pixels. Then, crop the images at the center to reduce the size to 224 × 224 pixels, preserving the central part to enhance model robustness. Next, convert the images into tensors through data type conversion. Finally, to achieve comparable ranges and distributions, perform standardization processing on the pixel values of each channel in the images.
(5) Use the processed images as input and utilize the optimized model obtained from the previous training process to determine the image labels based on the model’s output.
3.5.1 Performance Testing Experiments
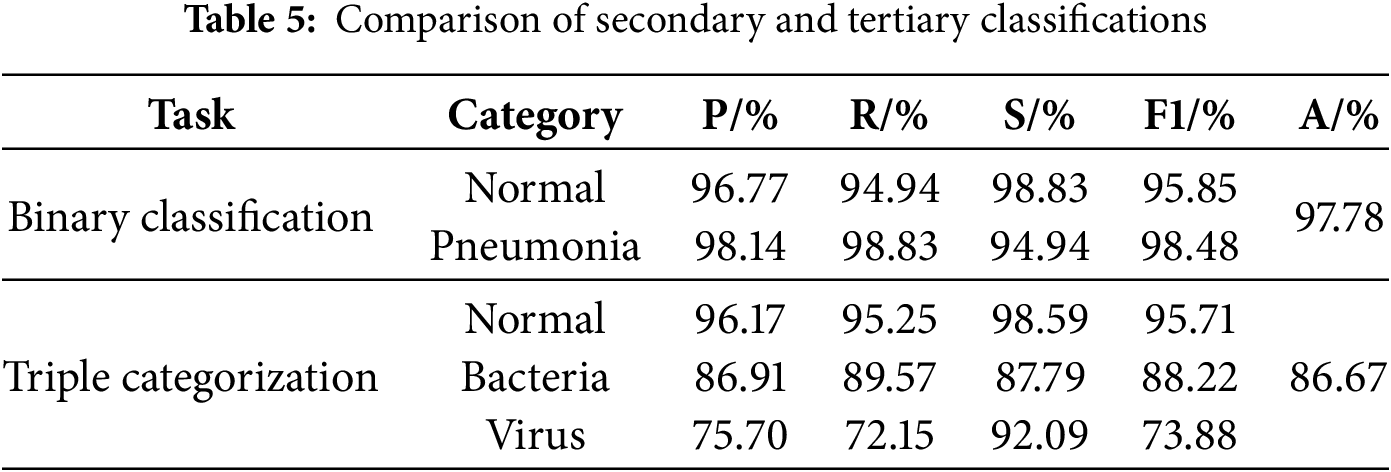
The results of binary and ternary classification of the improved model are visualized using the confusion matrix, which is obtained as shown in Fig. 8, and the Accuracy, Precision, Recall, Specificity, and F1-Scores of the binary and ternary classification of pneumonia are obtained by calculating, as shown in Table 5. From Fig. 8, the improved model achieves extremely good results in the two-classification task, the number of judged right images is 1144, and the number of judged wrong images is only 26; in the three-classification task, the improved model still achieves good results, and it can be found that the model is more effective in classifying normal images, and it is slightly less effective in the task of categorizing the bacterial pneumonia images and the viral pneumonia images, which is due to the severe imbalance in the number of bacterial pneumonia images and viral pneumonia images in the dataset and the fact that there is indeed a high degree of similarity between the two. In addition, from Table 5, it can be found that the various indicators of the improved model on both the two-classification and three-classification tasks have reached a high level with good classification performance.
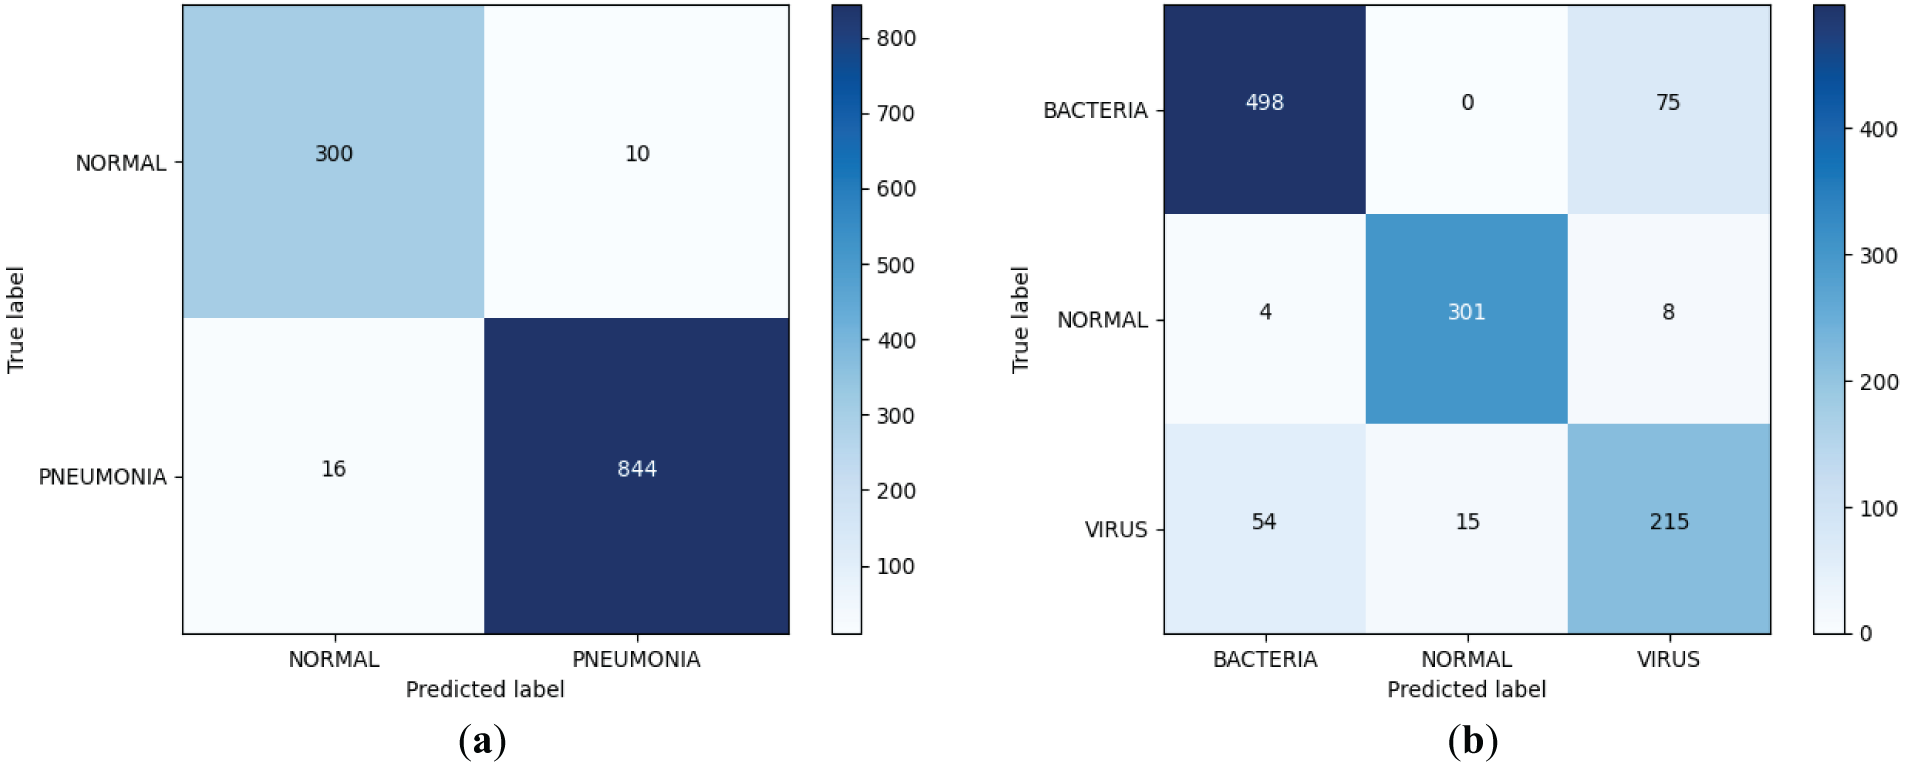
Figure 8: Improved dichotomous and trichotomous confusion matrices. (a) Binary classification confusion matrix; (b) Triple categorization confusion matrix
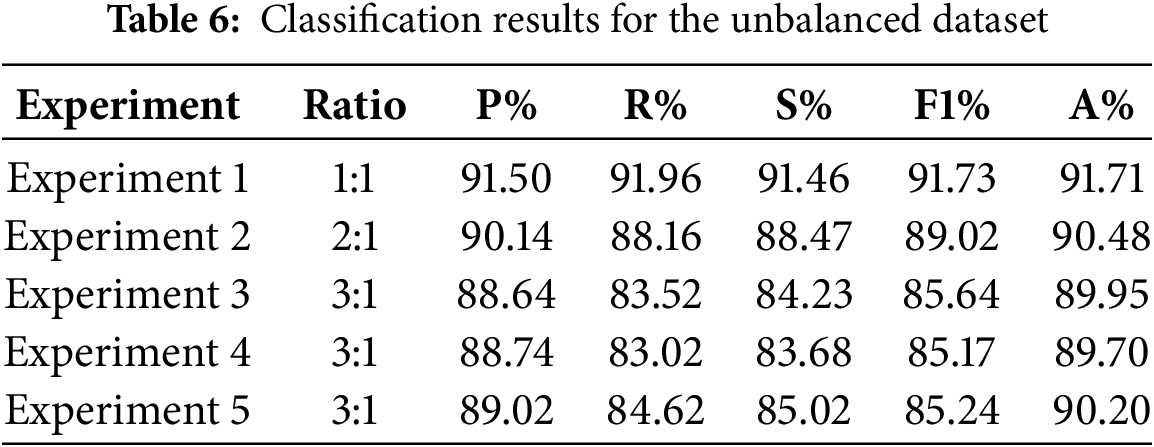
To further explore the impact of the extent of disparity between bacterial and viral pneumonia image counts within the dataset on the improved model’s performance, three sets of binary classification experiments were carried out in this study by randomly selecting bacterial pneumonia images and viral pneumonia images from the Chest X-ray dataset and keeping their number ratios as 1:1, 2:1, and 3:1, respectively, and they were labeled Experiments 1, 2, and 3. The results of the experiments are shown in Table 6. It can be found that the accuracy of the model does show a certain degree of degradation as the degree of imbalance of the dataset increases. Therefore, in order to address this issue, we designed two additional sets of experiments, based on the 3:1 ratio of bacterial pneumonia to viral pneumonia from Experiment. Experiment 4 is the enhancement of viral pneumonia samples using the random oversampling technique, specifically, the random replication of viral pneumonia images to increase their number to be comparable to the number of bacterial pneumonia images, and Experiment 5 further introduces a weighted loss function, Focal Loss [31]. It can be found that, after the introduction of the random oversampling, the performance of the model has not been enhanced or even has a slightly decreased, while after the introduction of Focal Loss, the model performance is slightly enhanced but the extent of this improvement remains very limited, we will continue to explore other strategies to alleviate the imbalance of the dataset to solve this problem in our future work.
We further plotted the Receiver Operating Characteristic (ROC) curve and Precision Recall (PR) curve of the model on the three-class task, and computed the Area Under Curve (AUC) values. As the ROC curve nears the upper left corner, the ROC-AUC value increases, demonstrating the model’s enhanced classification ability. The PR curve serves as a crucial metric for assessing a model’s classification capabilities, particularly in scenarios characterized by imbalanced data distributions. Different from the ROC curve, the PR curve focuses more on the performance of the positive class, and the closer the PR curve is to the upper right corner of the coordinate axis, the larger the PR-AUC value is, the better the model performance is. As can be seen from Fig. 9, the ROC curves under each category are very close to the upper left corner of the coordinate axis, and the ROC-AUC value under the bacterial pneumonia category reaches 0.93, which indicates that the model has high accuracy in distinguishing bacterial pneumonia samples from non-bacterial pneumonia samples; the ROC-AUC value under the normal category reaches 0.99, which indicates that the model recognizes normal samples with almost perfect performance; the ROC-AUC value under the viral pneumonia category reaches 0.89, which is slightly lower than the other two categories, but still indicates that the model has better performance in distinguishing viral pneumonia samples from non-viral pneumonia samples. The PR curve also closely approaches the top-right corner, with high PR-AUC values for each category. The combined results of the ROC curve and PR curve images show that the improved model has excellent classification performance for each category, especially for normal category images.
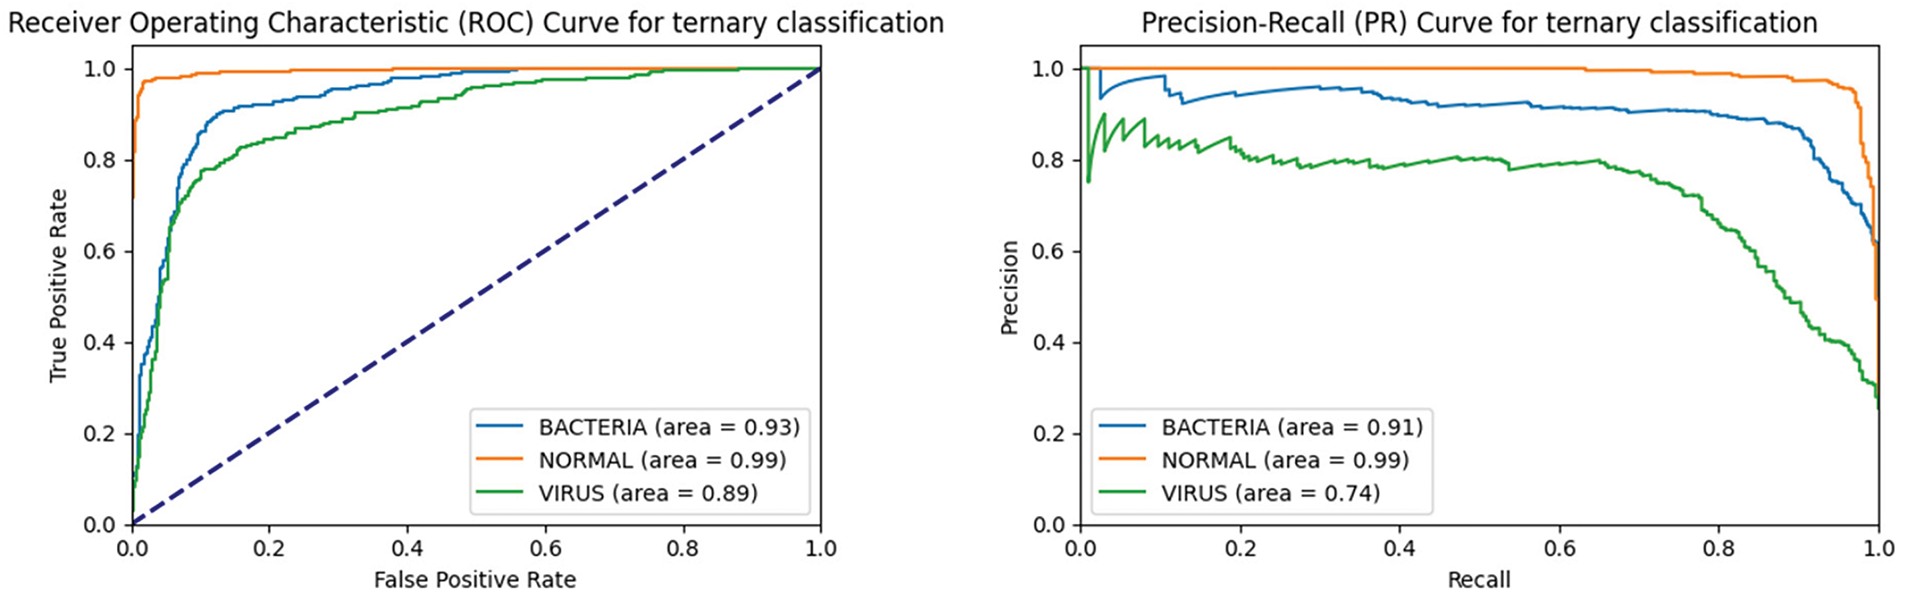
Figure 9: ROC curve and PR curve of the improved model on the triple classification task
3.5.2 Comparison and Analysis of Model Performance
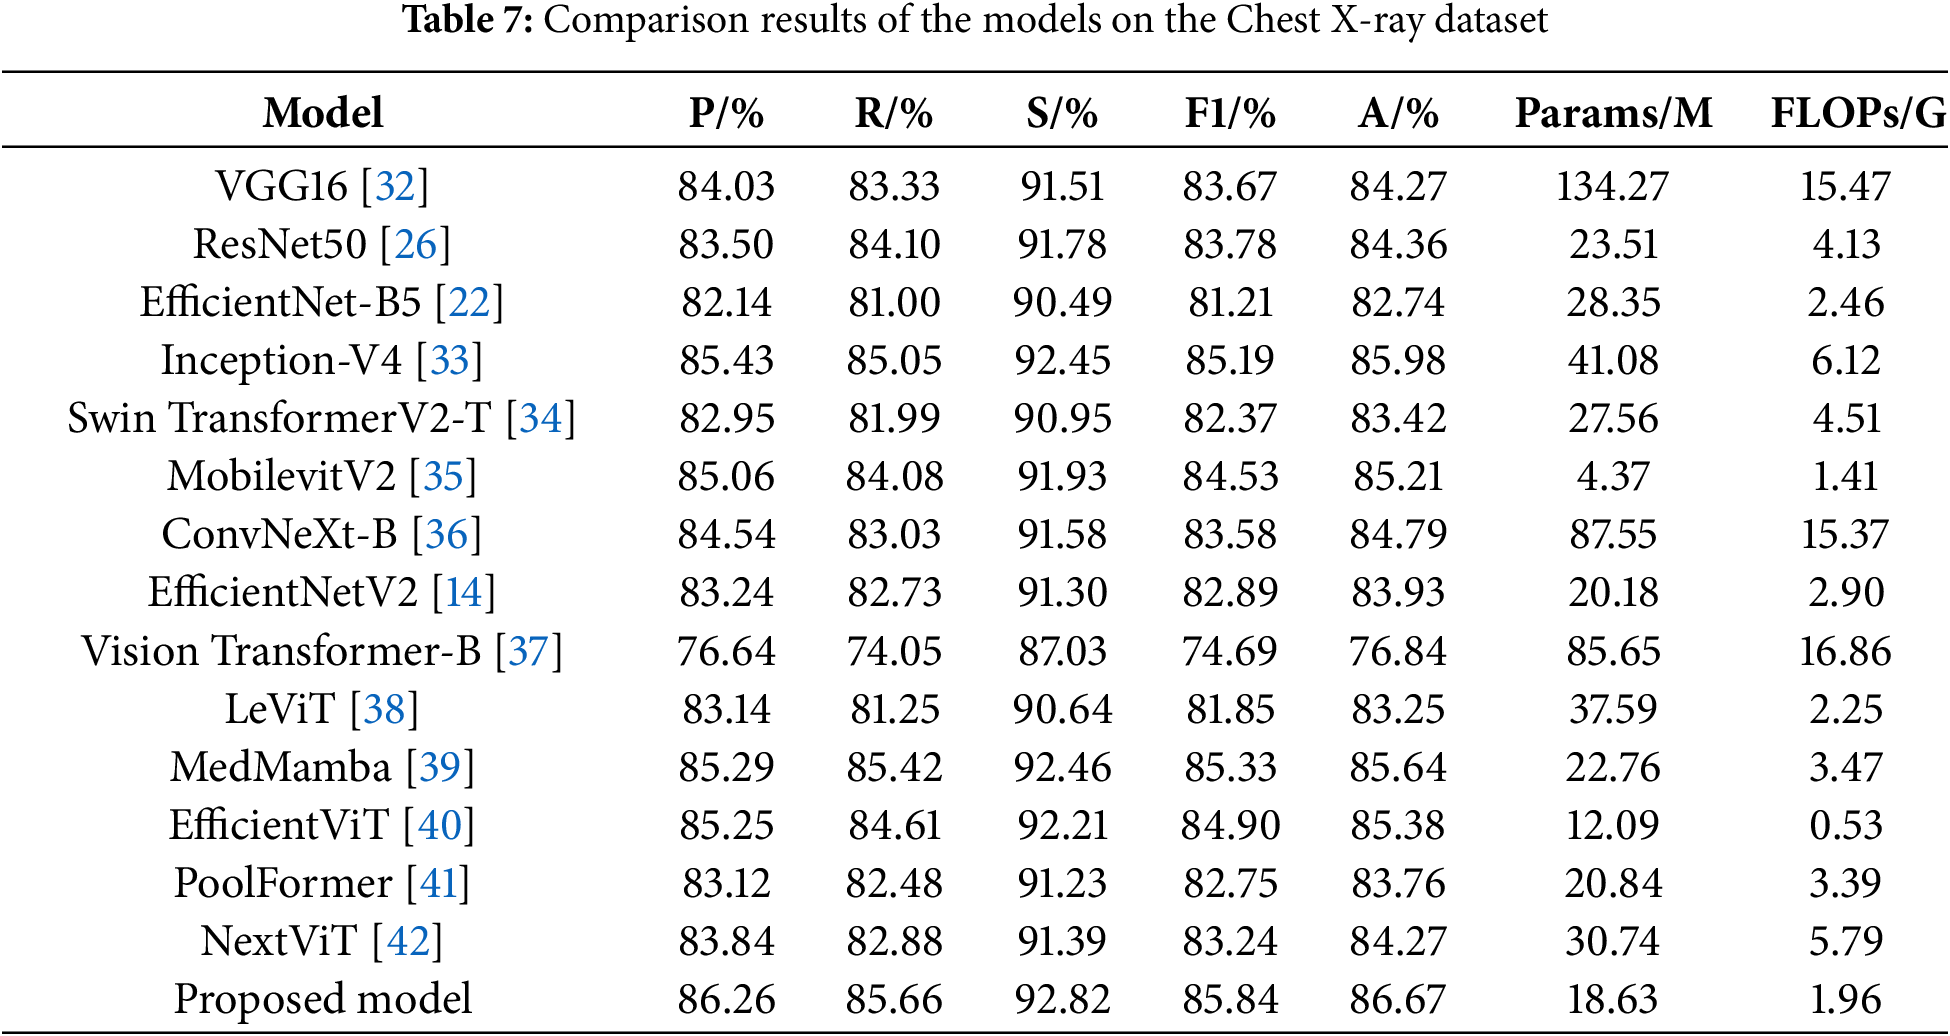
To validate the effectiveness of the proposed model, it is compared with a variety of mainstream models on a more challenging ternary classification task, namely VGG16 [32], ResNet50 [26], EfficientNet-B5 [22], Inception-V4 [33], Swin TransformerV2-T [34], MobilevitV2 [35], ConvNeXt-B [36], EfficientNetV2 [14], Vision Transformer-B [37], LeViT [38], MedMamba [39], EfficientViT [40], PoolFormer [41] and NextViT [42]. The experimental results are shown in Table 7.
ResNet50 achieves better results than VGG16 by mitigating gradient vanishing and redirecting network information flow through residual connections. EfficientNet-B5 uses smaller convolutional kernels and stacks more layers, which limits its feature extraction ability and loses more semantic information deeper in the model, resulting in poorer classification results. Inception-V4 employs parallel convolutional kernels of varying sizes to extract multi-scale image features, yielding strong performance but also resulting in a high parameter count and operational complexity. Swin TransformerV2-T and ConvNeXt-B incorporate self-attention mechanisms and large kernel convolutions respectively to enhance global feature extraction, but still perform poorly. MobilevitV2 greatly lowers the computational complexity through introducing a separable self-attention, but its ability to recognize pneumonia is limited. EfficientNetV2 has improved its performance compared to EfficientNet-B5, but it does not notice the connection between the channels of the feature map and does not have the ability to acquire multi-scale semantic information, which leads to poor classification results. Vision Transformer enhances its feature extraction capabilities through a global self-attention mechanism, which requires substantial computational resources, yet its classification performance remains poor. LeVit combines the advantages of CNNs and Transformers, adopting a multi-stage Transformer architecture and introducing a novel attention bias, resulting in improved classification performance compared to the Vision Transformer. MedMamba further elevates model performance by integrating convolutions that extract local features with state-space models that capture long-range dependencies, although it still has not achieved the best classification results. EfficientViT further optimizes its structure by designing a new cascaded group attention module, achieving good recognition results with lower FLOPs. PoolFormer adopts a more general architecture design, achieving a certain performance improvement compared to the Vision Transformer. NextViT, as a CNN-Transformer hybrid architecture designed for industrial deployment scenarios, further enhances its pneumonia classification performance, but its computational efficiency still needs improvement.
Finally, it can be found that the proposed model achieves an accuracy of 86.67%, precision of 86.26%, recall of 85.66%, specificity of 92.82%, and F1-score of 85.84%, with Params of 18.63 M and FLOPs of 1.96 G. Its classification performance surpasses that of other models, while keeping the parameter count and computational complexity relatively low. This demonstrates that the proposed model ensures high classification performance and possesses high computational efficiency, proving that it indeed further enhances pneumonia recognition ability while reducing complexity. In this study, the confusion matrix is used to visualize the test results of each model, and the results are shown in Fig. 10. The comparison of the confusion matrices reveals that each model can achieve certain results, but the proposed model achieves the optimal classification performance. Following a thorough examination of the experimental findings, the proposed model not only exhibits higher computational efficiency but also achieves higher accuracy compared to EfficientNetV2. Among these advanced architectures, models that achieve high accuracy, such as Inception-V4, have relatively high computational complexity, while models with lower computational complexity, such as MobilevitV2, sacrifice a certain degree of recognition accuracy. Only the proposed model ultimately achieves the best trade-off between efficiency and accuracy.
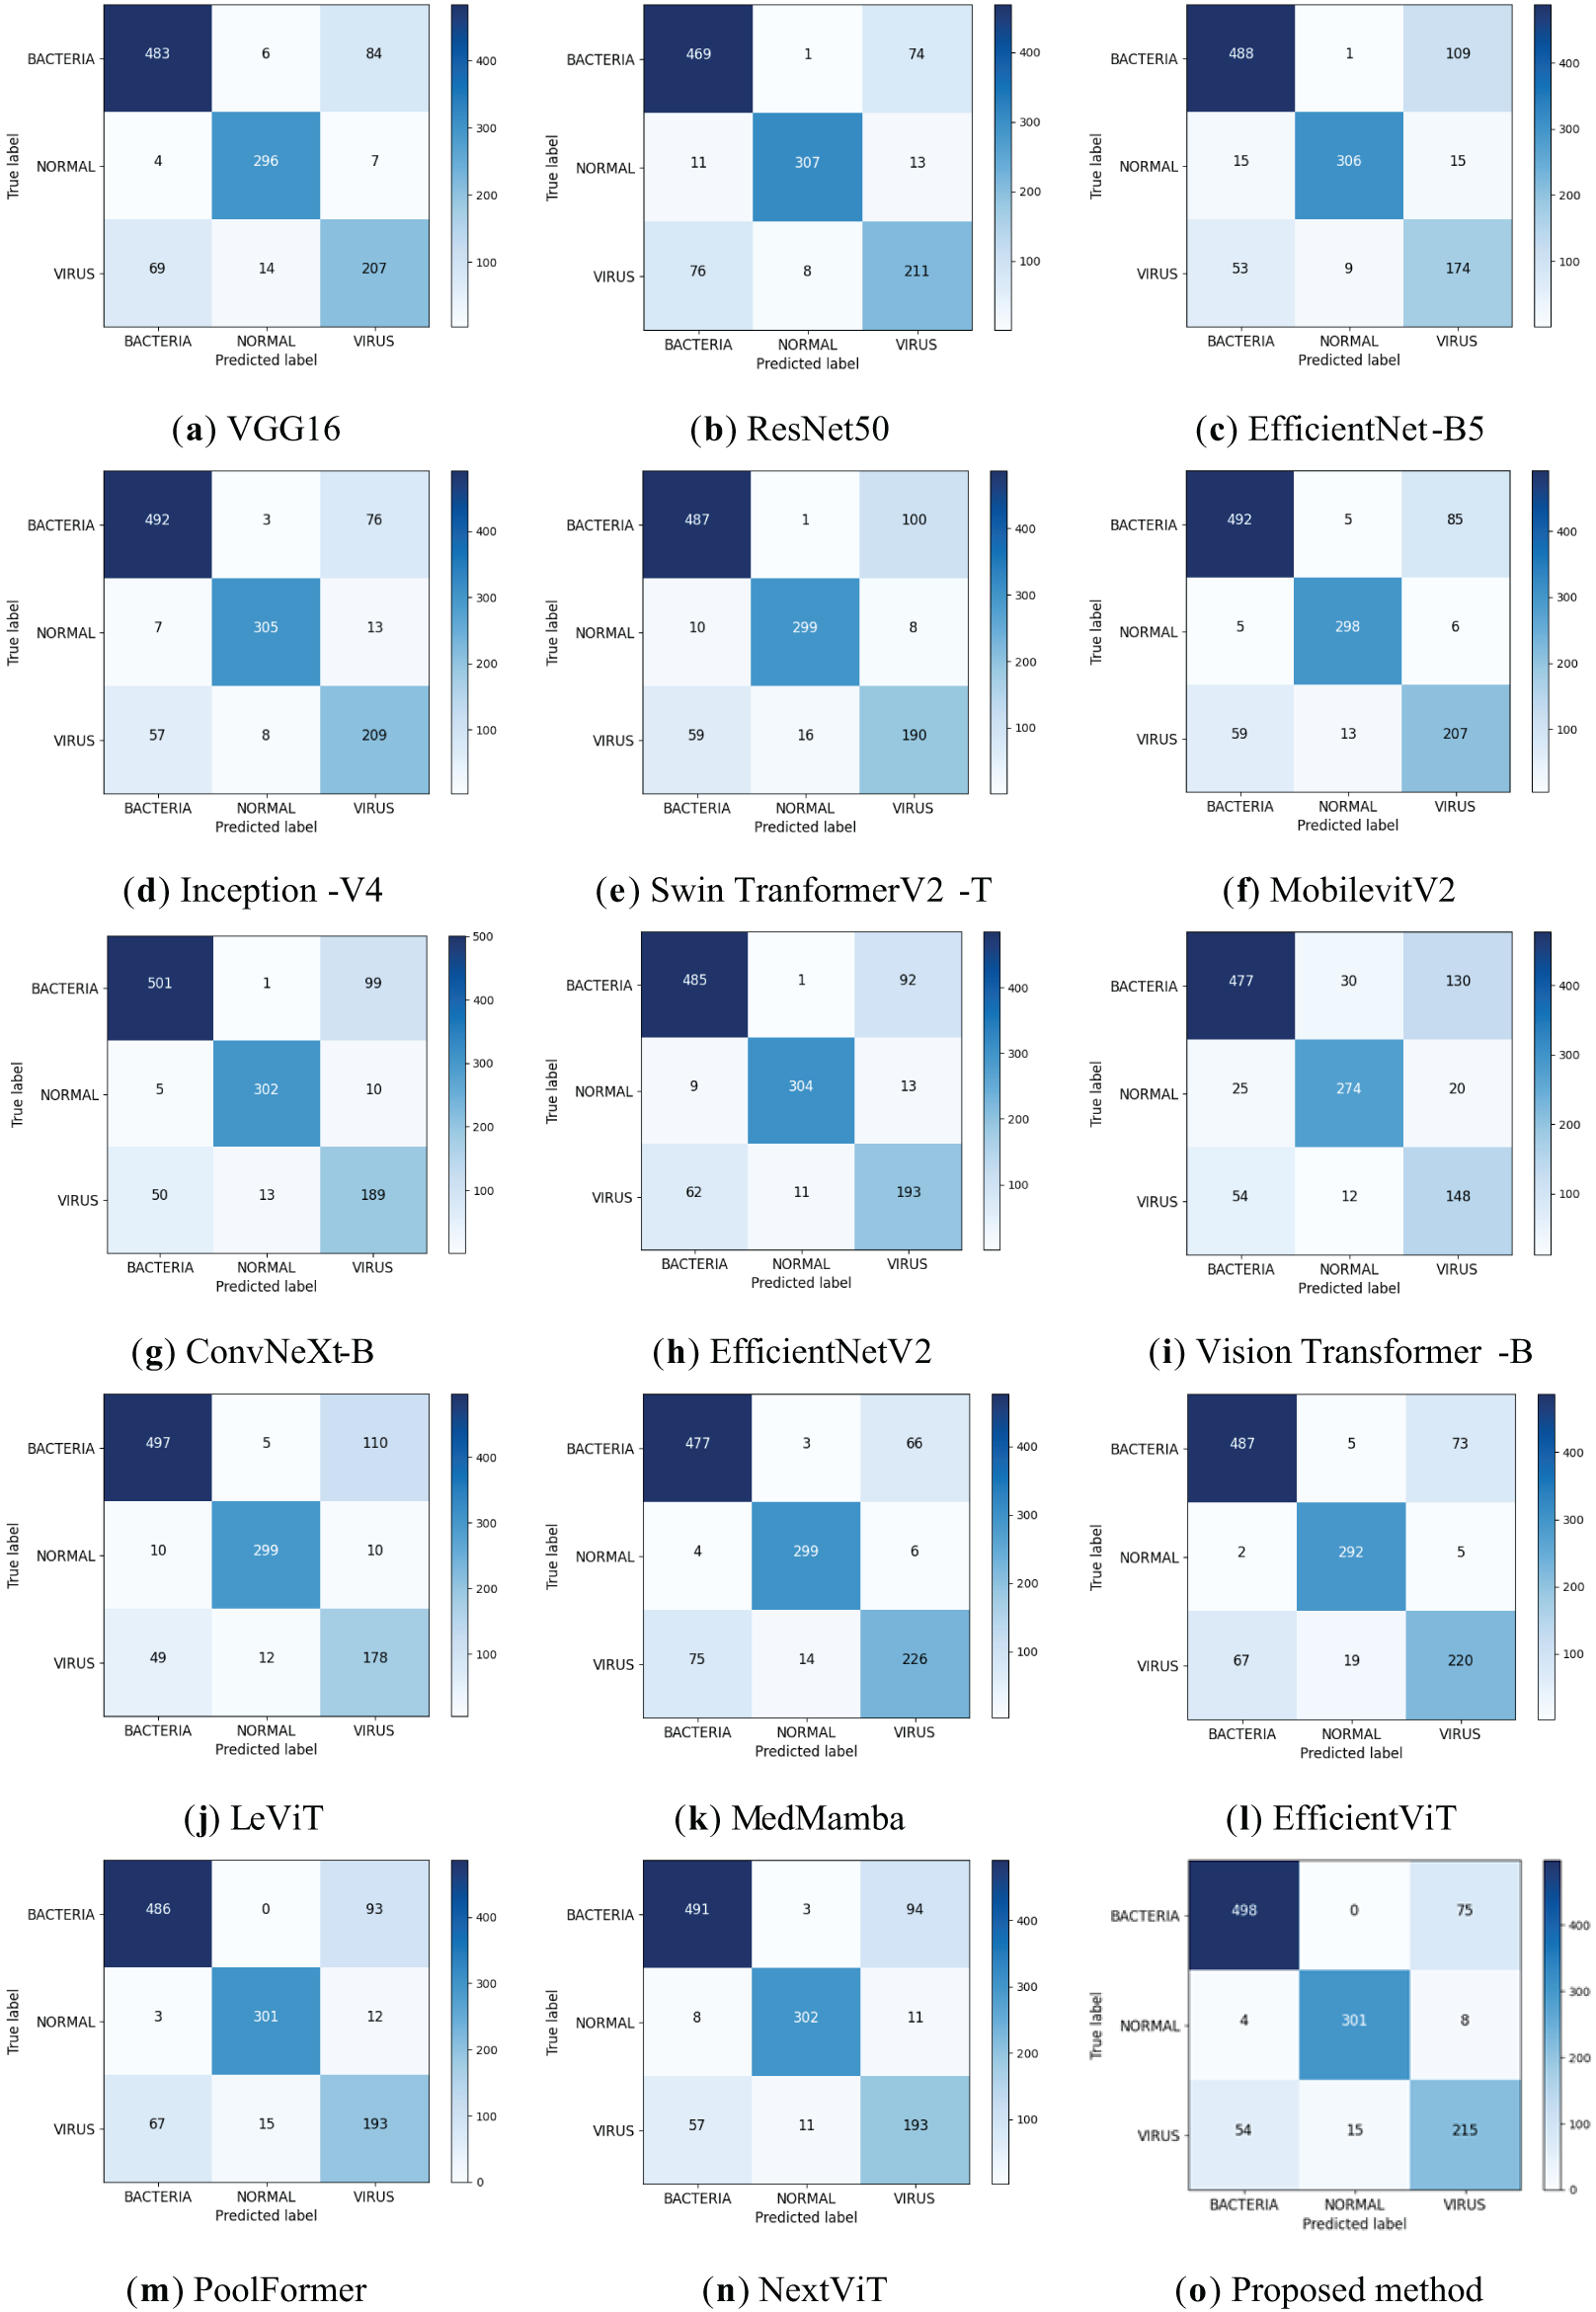
Figure 10: Confusion matrix of classification results for different models
EfficientNetV2 was used as the base model, on which improvements were made and ablation experiments were performed on the triple categorization task. Eight sets of experiments were performed based on the EfficientNetV2 network, where the original EfficientNetV2 is denoted as Model 1, the model that reduces the number of stacked MBConv, Fused-MBConv in the model alone is denoted as Model 2, the model that introduces dilated convolution in the first convolutional layer alone is denoted as Model 3, the model that introduces the IMBConv module alone is denoted as Model 4, the model that introduces the MELA module alone is denoted as Model 5, the model that reduces the number of stacked MBConv, Fused-MBConv in the model and introduces the dilated convolution in the first convolutional layer is denoted as Model 6, and the model that introduces the IMBConv module based on Model 6 is denoted as Model 7. The model that includes all optimization strategies is denoted as Model 8.
Table 8 shows the results, and the recognition accuracies of the models with the addition of each improvement point individually have been improved, which suggests that all the improvement points are effective. Model 2’s recognition accuracy has been improved by 0.34% in comparison to Model 1, which suggests that the reduction in model layers does avoid the risk of model overfitting to some extent. The accuracy of Model 3 is improved by 0.94% compared to Model 1, which indicates that the addition of dilated convolution does expand the receptive field of the model and improves the feature extraction ability of the model, and the accuracy of Model 4 is improved by 1.28% compared to Model 1, which indicates that the proposed IMBConv module strengthens inter-channel feature map links, which makes it easier for the model to focus on the detailed features of the pneumonia image. Model 5 has the most improved recognition accuracy of 2.05% compared to Model 1, which indicates that the introduction of the MELA module serves the best purpose and the addition of the MELA module indeed effectively promotes the extraction of multi-scale semantic information from the model, and enhances the model’s ability to classify pneumonia. In Model 6 and Model 7, when multiple improvement points are combined, it can be observed that their combined structure enhances the model’s feature learning capability, resulting in a significant increase in accuracy compared to Model 1.
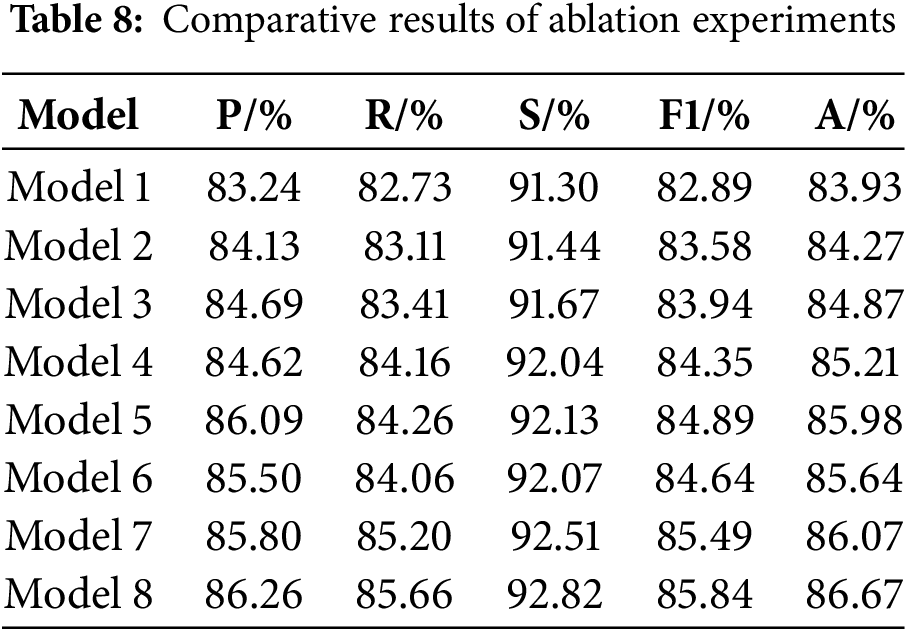
Finally, it can be found that Model 8 reaches the highest value in all the metrics, there is a significant enhancement in overall performance relative to the original model, demonstrating the effectiveness of the proposed improvement strategies.
3.5.4 Analysis of Visualization Results
To additionally validate the efficacy of the proposed model for pneumonia recognition, the input pneumonia images are visualized using Grad-CAM, as shown in Fig. 11. In Fig. 11, from left to right, the left column is the original image, the middle column is the Grad-CAM of EfficientNetV2, and the rightmost column is the Grad-CAM of PLW-EfficientNetV2. Through the comparison of Grad-CAM results, it can be observed that after integrating the MELA and IMBConv module, PLW-EfficientNetV2 primarily focuses on the thoracic region for images belonging to the normal category, which is the most influential area for classification decisions, while paying little attention to the background regions irrelevant to the prediction outcomes. For samples of the pneumonia category, the model focuses more on the location of the lesion areas and ignores other unimportant information. This enhances the model’s ability to capture crucial information for pneumonia recognition, thereby improving the model’s classification performance.
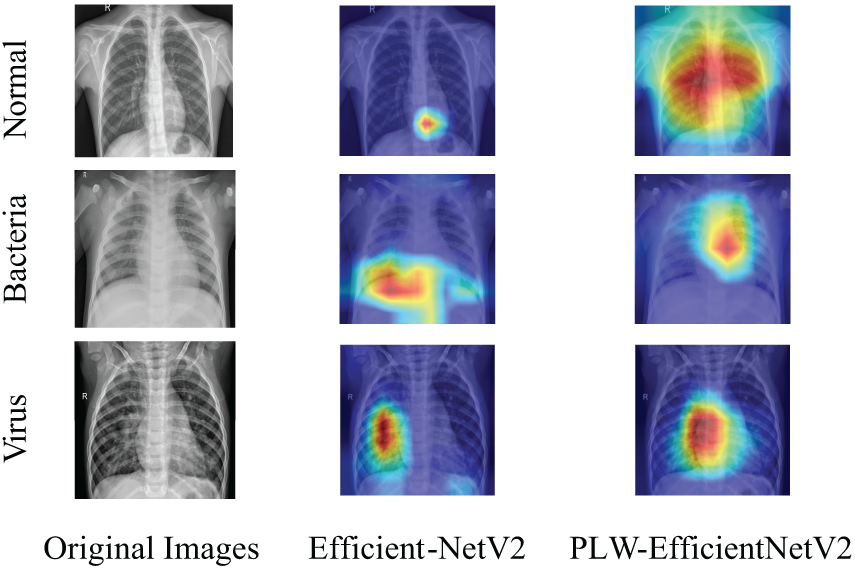
Figure 11: Comparison of Grad-CAM
In addition, to further explore the interpretability of PLW-EfficientNetV2, we draw the SHapley Additive Explanation (SHAP) plot of PLW-EfficientNetV2 for each category as shown in Fig. 12. The red areas in the SHAP plot represent the features that have a positive impact on the model’s predictions, while the blue areas are the opposite. Through the comparison of SHAP plots, it can be found that in the case of normal category images, the key regions influencing the proposed model’s predictions are mostly evenly distributed on both sides of the thorax; whereas in the case of pneumonia category samples, the key regions are more concentrated, indicating that the proposed model at this time pays more attention to areas where lesions may be present. Combining the Grad-CAM and SHAP plots, we can find the focus areas and decision-making characteristics of the proposed model for the input images, which further provides a theoretical basis for the interpretability of the model.
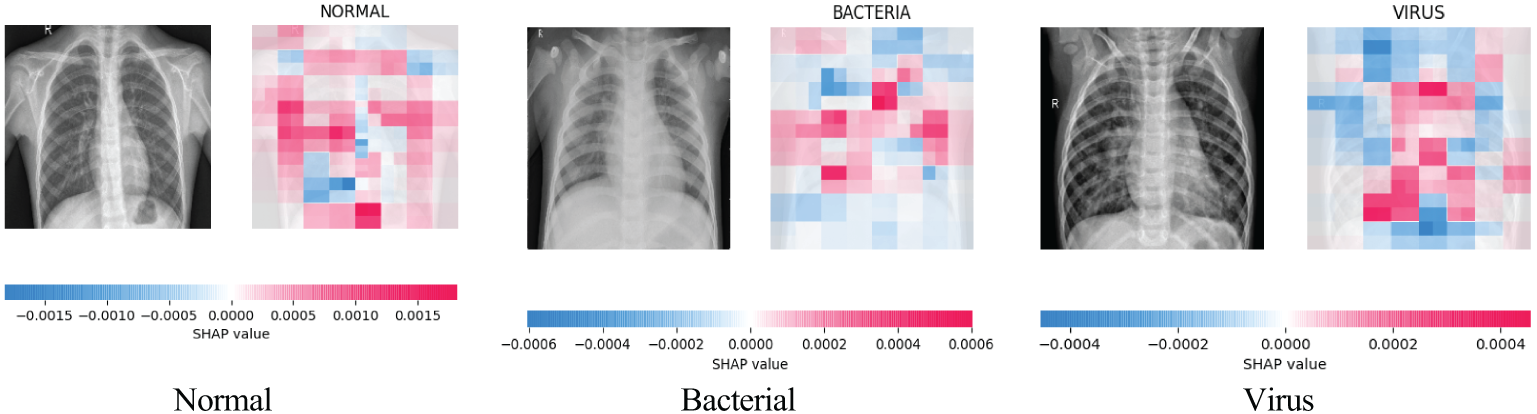
Figure 12: PLW-EfficientNetV2 SHAP charts in each category
3.5.5 Generalization Ability Test
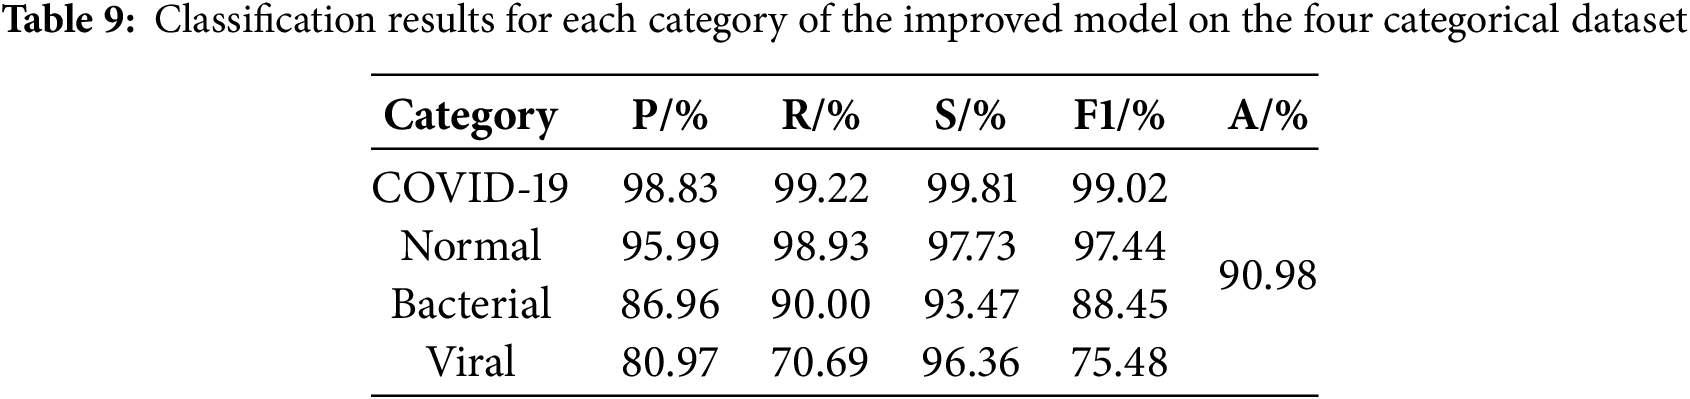
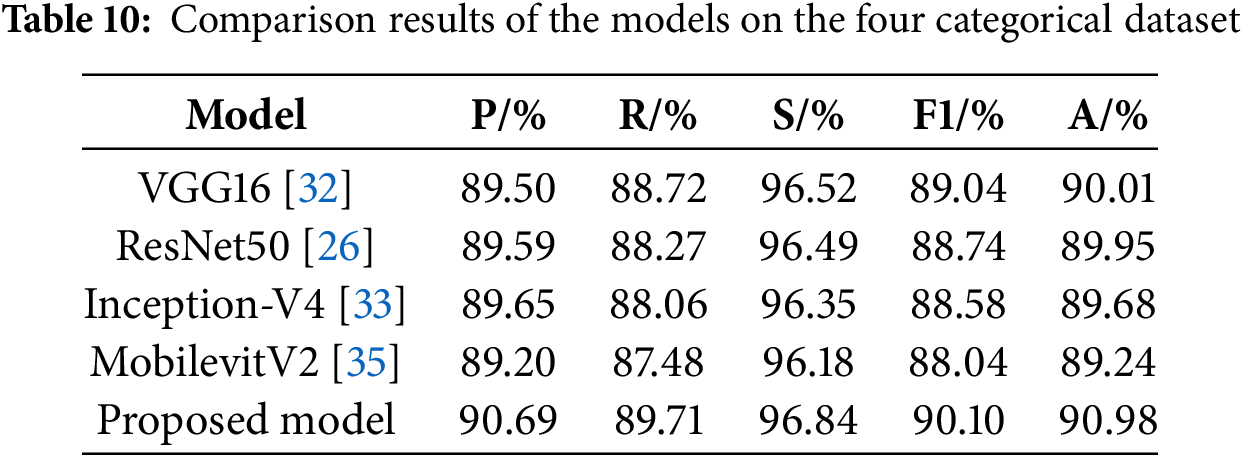
This study conducts experiments on a four-category pneumonia dataset from the Kaggle Challenge website under the same hardware environment and parameter settings, which comprises four image categories: 3270 normal images, 1281 COVID-19 images, 3001 bacterial pneumonia images, and 1656 viral pneumonia images, totaling 9208 images. Fig. 13 shows the confusion matrix for this dataset and it can be seen that PLW-EfficientNetV2 is able to accurately recognize the pneumonia images. Table 9 shows the detailed performance metrics of the improved model for each class in the four-classification task, and the model achieves high values for all metrics on COVID-19 samples and normal samples, which indicates that the model has a very good recognition ability for these two types of samples, and for bacterial pneumonia samples, the model also demonstrates a more excellent recognition ability. In addition, the model’s ability to recognize viral pneumonia samples is slightly weaker. Table 10 shows the results of multiple models on the four-classification dataset. From Table 10, analysis reveals that our proposed model achieves top performance across all evaluation metrics, suggesting strong generalization capabilities.
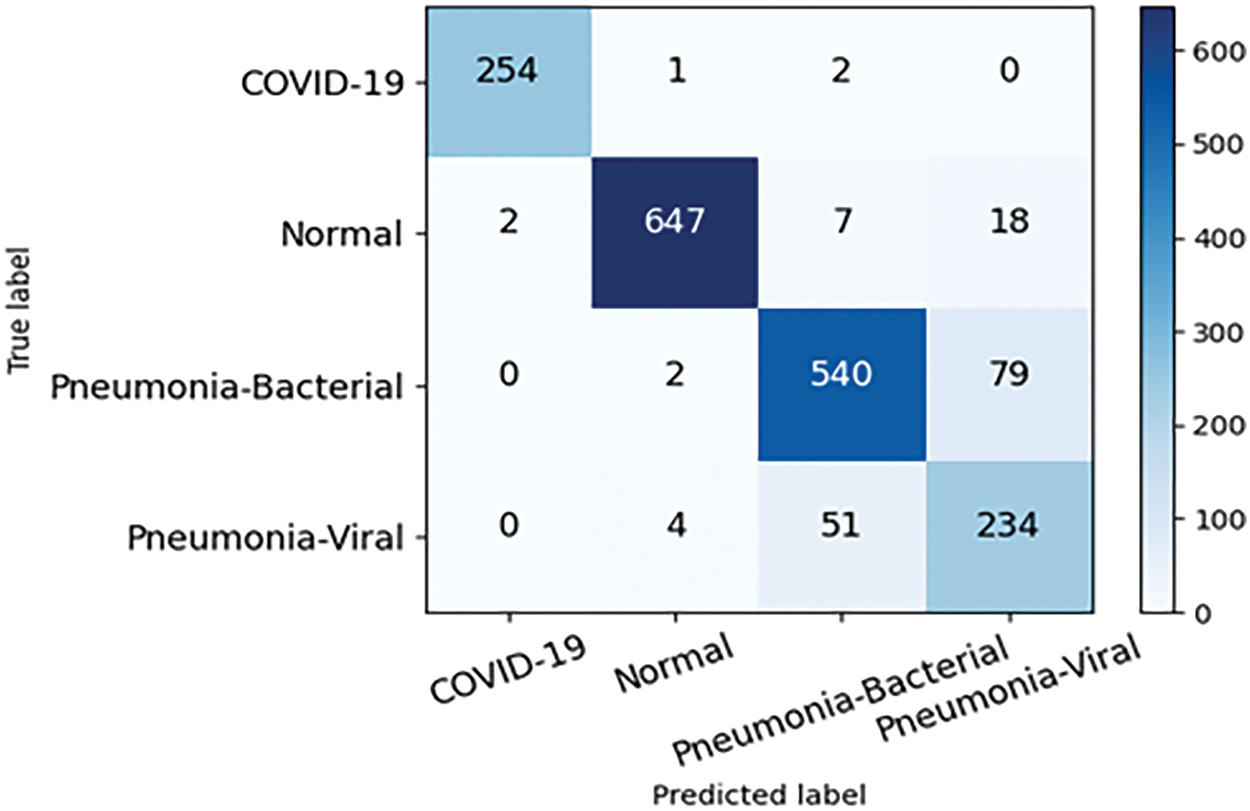
Figure 13: Confusion matrix of the proposed model on four categorical dataset
In addition, in order to verify the ability of the proposed model to recognize pneumonia images under other imaging modalities, we chose the public COVID-19 lung CT dataset [43] to evaluate the robustness. This dataset contains 1252 infected positive CT images and 1229 uninfected CT images. The confusion matrix of the proposed model on this dataset is shown in Fig. 14. From the confusion matrix, it can be found that even for pneumonia images under CT imaging modality, the proposed model still achieves high recognition accuracy, and the number of images classified correctly under COVID category and non-COVID category reaches 246 and 240, respectively, with only 9 images classified incorrectly, and the overall classification accuracy reaches 98.18%, which suggests the proposed model demonstrates strong generalizability and robust performance.
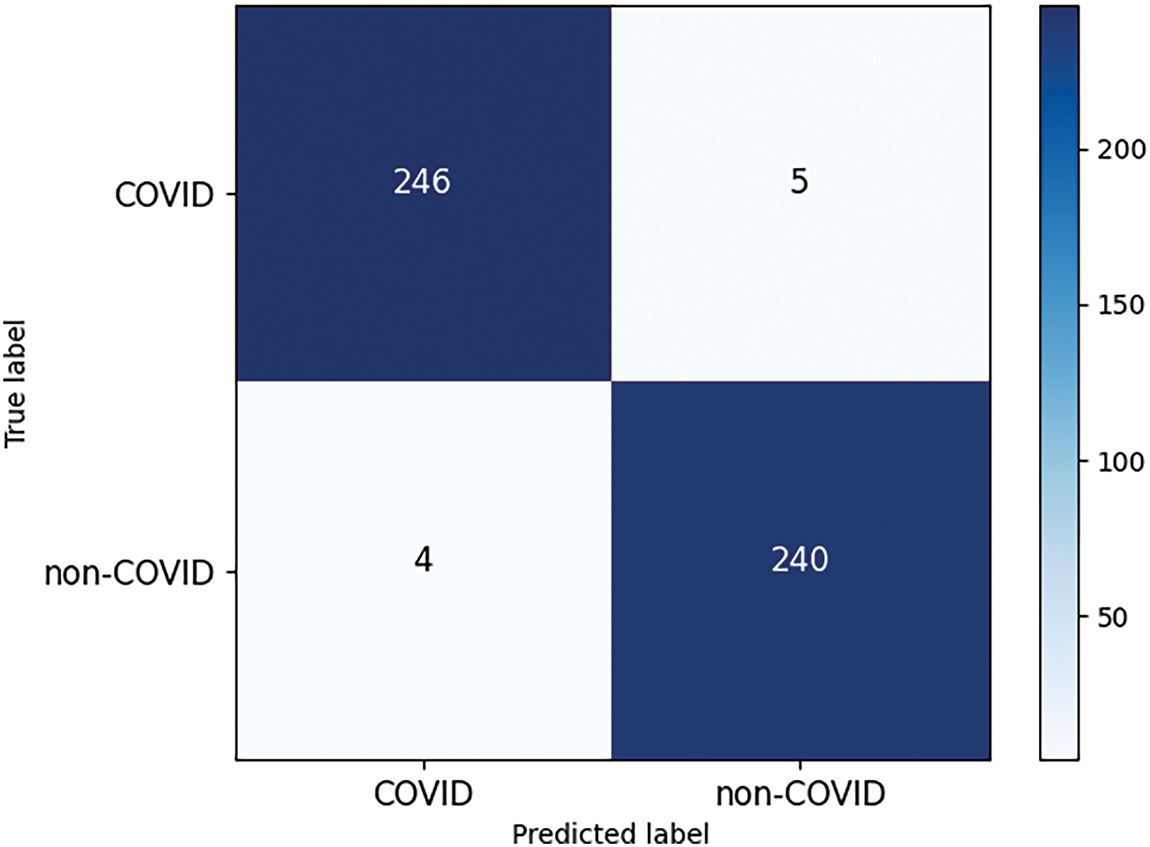
Figure 14: Confusion matrix of the proposed model on COVID-19 lung CT dataset
This study addresses the challenges of most existing pneumonia recognition methods being binary classification and low accuracy for pneumonia images with complex lesion areas, as well as the diagnostic challenges under resource-constrained conditions. We propose an improved EfficientNetV2 pneumonia recognition model based on multi-scale attention. Firstly, to tackle the issue of high computational complexity of the model, we simplify the model structure by reducing the number of main modules, on this basis, we apply dilated convolution within the first convolutional layer to expand the model’s receptive field, ensuring feature extraction capability. Secondly, to guarantee the model’s detection capability on multi-class tasks, we propose the IMBConv module, which can attend to the relationships between various feature maps, strengthen the model’s ability to identify highly similar pneumonia images, and improve the model’s classification performance. Finally, to address the challenge of pneumonia images with lesion regions of diverse shapes and sizes and blurred edges, the MELA module is proposed, which fuses multi-scale information and attention prediction to enhance the extraction of features from pneumonia images, further enhancing the overall performance of the proposed model.
The proposed model is evaluated on the three-classification dataset and four-classification dataset, respectively, and the experimental results show that compared with other mainstream classification models, the proposed model in this study has the highest accuracy, precision, recall, specificity, and F1-Score in the two datasets, and the number of parameters and the computational complexity are both lower, which suggests that the proposed model indeed achieves a better balance between the recognition performance and complexity, and realizing the unity of accuracy and efficiency. The model holds promise for deployment on resource-constrained medical devices, where it can further enhance real-time diagnostic systems in hospitals and assist doctors in making rapid and accurate diagnoses of pneumonia patients, thereby providing timely and appropriate treatment to them.
However, if the proposed model is to be integrated into existing hospital systems or telemedicine platforms, there are still some potential challenges and limitations in this study, including data heterogeneity, cross-hospital generalization, and potential biases in medical datasets. In addition, although the model performance was validated in the experiments, the effect of practical application in real clinical settings still needs to be further investigated. To address the above issues, we plan to enhance data preprocessing and standardization, conduct cross-hospital data validation studies, and leverage advanced techniques such as transfer learning and domain adaptation to improve the model’s generalization capability. Simultaneously, we will perform more application validations in real clinical environments to ensure the model’s effectiveness and reliability.
Future studies will primarily focus on the following directions:
(1) Working on validating the utility of the model in a real clinical setting and further exploring the model’s extended application in other imaging modalities.
(2) Extending the research to video-based analysis or integrating the model with other diagnostic tools such as clinical data or patient history.
(3) Enhancing the interpretability and robustness of the model so that physicians and patients can more clearly understand the diagnostic basis of the model.
(4) Research on improving methods for handling class imbalance and utilizing self-supervised learning to tackle limited datasets.
(5) Research on combining CNNs with Transformers to enhance feature extraction in pneumonia classification.
(6) Studying the feasibility of deploying the model in real-time mobile X-ray scanning applications and evaluating how multi-objective optimization techniques can improve the accuracy-latency trade-offs in pneumonia detection.
These efforts will help further improve the accuracy and efficiency of pneumonia diagnosis and bring greater benefits to patients.
Acknowledgement: The authors express their gratitude to the anonymous reviewers and editor whose constructive feedback significantly enhanced the article’s quality.
Funding Statement: This work is supported by the Scientific Research Fund of Hunan Provincial Education Department, China (Grant Nos. 21C0439, 22A0408).
Author Contributions: The authors confirm contribution to the paper as follows: study conception and design: Zhigao Zeng, Jun Liu, Qiang Liu; data collection: Jun Liu, Qiang Liu, Bing Zheng; analysis and interpretation of results: Zhigao Zeng, Jun Liu, Bing Zheng; draft manuscript preparation: Jun Liu, Shengqiu Yi, Xinpan Yuan. All authors reviewed the results and approved the final version of the manuscript.
Availability of Data and Materials: The data for this study is derived from open-source datasets.
Ethics Approval: Not applicable.
Conflicts of Interest: The authors declare no conflicts of interest to report regarding the present study.
References
1. Siddiqi R. Automated pneumonia diagnosis using a customized sequential convolutional neural network. In: Proceedings of the 2019 3rd International Conference on Deep Learning Technologies; 2019 Jul 5–7; Xiamen, China. New York, NY, USA: Association for Computing Machinery; 2019. p. 64–70. [Google Scholar]
2. Stephen O, Sain M, Maduh UJ, Jeong DU. An efficient deep learning approach to pneumonia classification in healthcare. J Healthc Eng. 2019;2019(107):4180949. doi:10.1155/2019/4180949. [Google Scholar] [PubMed] [CrossRef]
3. Oliveira LLG, Silva SA, Ribeiro LHV, de Oliveira RM, Coelho CJ, Andrade S, et al. Computer-aided diagnosis in chest radiography for detection of childhood pneumonia. Int J Med Inform. 2008;77(8):555–64. doi:10.1016/j.ijmedinf.2007.10.010. [Google Scholar] [PubMed] [CrossRef]
4. Yao J, Dwyer A, Summers RM, Mollura DJ. Computer-aided diagnosis of pulmonary infections using texture analysis and support vector machine classification. Acad Radiol. 2011;18(3):306–14. doi:10.1016/j.acra.2010.11.013. [Google Scholar] [PubMed] [CrossRef]
5. Shi F, Xia L, Shan F, Song B, Wu D, Wei Y, et al. Large-scale screening to distinguish between COVID-19 and community-acquired pneumonia using infection size-aware classification. Phys Med Biol. 2021;66(6):065031. doi:10.1088/1361-6560/abe838. [Google Scholar] [PubMed] [CrossRef]
6. Sousa RT, Marques O, Soares FAAMN, Sene IIG, de Oliveira LLG, Spoto ES. Comparative performance analysis of machine learning classifiers in detection of childhood pneumonia using chest radiographs. Procedia Comput Sci. 2013;18(8):2579–82. doi:10.1016/j.procs.2013.05.444. [Google Scholar] [CrossRef]
7. Khan AI, Shah JL, Bhat MM. CoroNet: a deep neural network for detection and diagnosis of COVID-19 from chest X-ray images. Comput Methods Programs Biomed. 2020;196(18):105581. doi:10.1016/j.cmpb.2020.105581. [Google Scholar] [PubMed] [CrossRef]
8. Wong PK, Yan T, Wang H, Chan IN, Wang J, Li Y, et al. Automatic detection of multiple types of pneumonia: open dataset and a multi-scale attention network. Biomed Signal Process Control. 2022;73(3):103415. doi:10.1016/j.bspc.2021.103415. [Google Scholar] [PubMed] [CrossRef]
9. Li S, Hu Y, Yang L, Lv B, Kong X, Qiang G. DSEception: a noval neural networks architecture for enhancing pneumonia and tuberculosis diagnosis. Front Bioeng Biotechnol. 2024;12:1454652. doi:10.3389/fbioe.2024.1454652. [Google Scholar] [PubMed] [CrossRef]
10. Wang K, Jiang P, Meng J, Jiang X. Attention-based DenseNet for pneumonia classification. IRBM. 2022;43(5):479–85. doi:10.1016/j.irbm.2021.12.004. [Google Scholar] [CrossRef]
11. Kermany DS, Goldbaum M, Cai W, Valentim CCS, Liang H, Baxter SL, et al. Identifying medical diagnoses and treatable diseases by image-based deep learning. Cell. 2018;172(5):1122–31.e9. doi:10.1016/j.cell.2018.02.010. [Google Scholar] [PubMed] [CrossRef]
12. Singh S, Kumar M, Kumar A, Verma BK, Shitharth S. Pneumonia detection with QCSA network on chest X-ray. Sci Rep. 2023;13(1):9025. doi:10.1038/s41598-023-35922-x. [Google Scholar] [PubMed] [CrossRef]
13. Prakash JA, Asswin CR, Ravi V, Sowmya V, Soman KP. Pediatric pneumonia diagnosis using stacked ensemble learning on multi-model deep CNN architectures. Multimed Tools Appl. 2023;82(14):21311–51. doi:10.1007/s11042-022-13844-6. [Google Scholar] [PubMed] [CrossRef]
14. Tan M, Le Q. EfficientNetv2: Smaller models and faster training. In: International Conference on Machine Learning; 2021; PMLR. p. 10096–106. [Google Scholar]
15. Pacal I, Celik O, Bayram B, Cunha A. Enhancing EfficientNetv2 with global and efficient channel attention mechanisms for accurate MRI-Based brain tumor classification. Clust Comput. 2024;27(8):11187–212. doi:10.1007/s10586-024-04532-1. [Google Scholar] [CrossRef]
16. Huang ML, Liao YC. A lightweight CNN-based network on COVID-19 detection using X-ray and CT images. Comput Biol Med. 2022;146:105604. doi:10.1016/j.compbiomed.2022.105604. [Google Scholar] [PubMed] [CrossRef]
17. Li H, Li J, Wei H, Liu Z, Zhan Z, Ren Q. Slim-neck by GSConv: a lightweight-design for real-time detector architectures. J Real Time Image Process. 2024;21(3):62. doi:10.1007/s11554-024-01436-6. [Google Scholar] [CrossRef]
18. Hu J, Shen L, Sun G. Squeeze-and-excitation networks. In: Proceedings of the IEEE/CVF Conference on Computer Vision and Pattern Recognition; 2018 Jun 18–23; Salt Lake City, UT, USA. p. 7132–41. doi:10.1109/CVPR.2018.00745. [Google Scholar] [CrossRef]
19. Yang L, Zhang RY, Li L, Xie X. SimAM: A simple, parameter-free attention module for convolutional neural networks. In: International Conference on Machine Learning; 2021; PMLR. p. 11863–74. [Google Scholar]
20. Selvaraju RR, Cogswell M, Das A, Vedantam R, Parikh D, Batra D. Grad-CAM: visual explanations from deep networks via gradient-based localization. In: Proceedings of the IEEE International Conference on Computer Vision (ICCV); 2017 Oct 22–29; Venice, Italy. p. 618–26. doi:10.1109/ICCV.2017.74. [Google Scholar] [CrossRef]
21. Lundberg S, Lee SI. A unified approach to interpreting model predictions. arXiv:1705.07874. 2017. [Google Scholar]
22. Tan M, Le Q. EfficientNet: rethinking model scaling for convolutional neural networks. In: Kamalika C, Ruslan S, editors. Proceedings of the 36th International Conference on Machine Learning; 2019 Jun 9–15; Long Beach, CA, USA. p. 6105–14. [Google Scholar]
23. Yu F, Koltun V. Multi-scale context aggregation by dilated convolutions. arXiv:1511.07122. 2015. [Google Scholar]
24. Woo S, Park J, Lee JY, Kweon IS. CBAM: convolutional block attention module. In: Proceedings of the European Conference on Computer Vision (ECCV); 2018 Sep 8–14; Munich, Germany. p. 3–19. [Google Scholar]
25. Wang Q, Wu B, Zhu P, Li P, Zuo W, Hu Q. ECA-net: efficient channel attention for deep convolutional neural networks. In: Proceedings of the IEEE/CVF Conference on Computer Vision and Pattern Recognition (CVPR); 2020 Jun 13–19; Seattle, WA, USA. p. 11531–9. doi:10.1109/cvpr42600.2020.01155. [Google Scholar] [CrossRef]
26. He K, Zhang X, Ren S, Sun J. Deep residual learning for image recognition. In: Proceedings of the IEEE Conference on Computer Vision and Pattern Recognition (CVPR); 2016 Jun 27–30; Las Vegas, NV, USA. p. 770–8. doi:10.1109/CVPR.2016.90. [Google Scholar] [CrossRef]
27. Sandler M, Howard A, Zhu M, Zhmoginov A, Chen LC. MobileNetV2: inverted residuals and linear bottlenecks. In: Proceedings of the IEEE/CVF Conference on Computer Vision and Pattern Recognition; 2018 Jun 18–23; Salt Lake City, UT, USA. p. 4510–20. doi:10.1109/CVPR.2018.00474. [Google Scholar] [CrossRef]
28. Li J, Wang Y, Wang S, Wang J, Liu J, Jin Q, et al. Multiscale attention guided network for COVID-19 diagnosis using chest X-ray images. IEEE J Biomed Health Inform. 2021;25(5):1336–46. doi:10.1109/JBHI.2021.3058293. [Google Scholar] [PubMed] [CrossRef]
29. Fu J, Li W, Peng X, Du J, Ouyang A, Wang Q, et al. MDRANet: a multiscale dense residual attention network for magnetic resonance and nuclear medicine image fusion. Biomed Signal Process Control. 2023;80(3):104382. doi:10.1016/j.bspc.2022.104382. [Google Scholar] [CrossRef]
30. Xu W, Wan Y. ELA: efficient local attention for deep convolutional neural networks. arXiv:2403.01123. 2024. [Google Scholar]
31. Lin T. Focal loss for dense object detection. arXiv:1708.02002. 2017. [Google Scholar]
32. Simonyan K, Zisserman A. Very deep convolutional networks for large-scale image recognition. arXiv:1409.1556. 2014. [Google Scholar]
33. Szegedy C, Ioffe S, Vanhoucke V, Alemi A. Inception-v4, inception-ResNet and the impact of residual connections on learning. In: Proceedings of the AAAI Conference on Artificial Intelligence; 2017 Feb 4–9; San Francisco, CA, USA. [Google Scholar]
34. Liu Z, Hu H, Lin Y, Yao Z, Xie Z, Wei Y, et al. Swin transformer V2: scaling up capacity and resolution. In: Proceedings of the IEEE/CVF Conference on Computer Vision and Pattern Recognition (CVPR); 2022 Jun 18–24; New Orleans, LA, USA. p. 11999–2009. doi:10.1109/CVPR52688.2022.01170. [Google Scholar] [CrossRef]
35. Mehta S, Rastegari M. Separable self-attention for mobile vision transformers. arXiv:2206.02680. 2022. [Google Scholar]
36. Liu Z, Mao H, Wu CY, Feichtenhofer C, Darrell T, Xie S. A ConvNet for the 2020s. In: Proceedings of the IEEE/CVF Conference on Computer Vision and Pattern Recognition (CVPR); 2022 Jun 18–24; New Orleans, LA, USA. p. 11966–76. doi:10.1109/CVPR52688.2022.01167. [Google Scholar] [CrossRef]
37. Dosovitskiy A, Beyer L, Kolesnikov A, Weissenborn D, Zhai X, Unterthiner T, et al. An image is worth 16 × 16 words: transformers for image recognition at scale. arXiv:2010.11929. 2020. [Google Scholar]
38. Graham B, El-Nouby A, Touvron H, Stock P, Joulin A, Jegou H, et al. LeViT: a vision transformer in ConvNet’s clothing for faster inference. In: Proceedings of the IEEE/CVF International Conference on Computer Vision (ICCV); 2021 Oct 10–17; Montreal, QC, Canada. p. 12239–49. doi:10.1109/iccv48922.2021.01204. [Google Scholar] [CrossRef]
39. Yue Y, Li Z. MedMamba: vision mamba for medical image classification. arXiv:2403.03849. 2024. [Google Scholar]
40. Liu X, Peng H, Zheng N, Yang Y, Hu H, Yuan Y. EfficientViT: memory efficient vision transformer with cascaded group attention. In: Proceedings of the IEEE/CVF Conference on Computer Vision and Pattern Recognition (CVPR); 2023 Jun 17–24; Vancouver, BC, Canada. p. 14420–30. doi:10.1109/CVPR52729.2023.01386. [Google Scholar] [CrossRef]
41. Yu W, Luo M, Zhou P, Si C, Zhou Y, Wang X, et al. MetaFormer is actually what you need for vision. In: Proceedings of the IEEE/CVF Conference on Computer Vision and Pattern Recognition (CVPR); 2022 Jun 18–24; New Orleans, LA, USA. p. 10809–19. doi:10.1109/CVPR52688.2022.01055. [Google Scholar] [CrossRef]
42. Li J, Xia X, Li W, Li H, Wang X, Xiao X, et al. Next-ViT: next generation vision transformer for efficient deployment in realistic industrial scenarios. arXiv:2207.05501. 2022. [Google Scholar]
43. Soares E, Angelov P, Biaso S, Froes MH, Abe DK. SARS-CoV-2 CT-scan dataset: a large dataset of real patients CT scans for SARS-CoV-2 identification. arXiv:2020.04.24.20078584. 2020. [Google Scholar]
Cite This Article
 Copyright © 2025 The Author(s). Published by Tech Science Press.
This work is licensed under a Creative Commons Attribution 4.0 International License , which permits unrestricted use, distribution, and reproduction in any medium, provided the original work is properly cited.
 Downloads
 Citation Tools