
 Submit a Paper
 Propose a Special lssue
 Open Access
ARTICLE
Advanced ECG Signal Analysis for Cardiovascular Disease Diagnosis Using AVOA Optimized Ensembled Deep Transfer Learning Approaches
1 Department of CSE, Siksha ‘O’ Anusandhan (Deemed to be University), Bhubaneswar, 751030, India
2 Department of IT, Vardhaman College of Engineering (Autonomous), Hyderabad, 501218, India
3 Centre for Data Science, Siksha ‘O’ Anusandhan (Deemed to be University), Bhubaneswar, 751030, India
4 Department of Computer Science Engineering (AI & ML), SITAMS (A), Chittoor, 517127, India
5 Department of Computer Engineering, College of Computer and Information Sciences, King Saud University, Riyadh, 11543, Saudi Arabia
6ComSens Lab, International Graduate School of Artificial Intelligence, National Yunlin University of Science and Technology, Yunlin, 64002, Taiwan
7 Department of Computer Science, CTL Eurocollege, Limassol, 3077, Cyprus
* Corresponding Authors: Khursheed Aurangzeb. Email: ; Sheraz Aslam. Email:
Computers, Materials & Continua 2025, 84(1), 1633-1657. https://doi.org/10.32604/cmc.2025.063562
Received 17 January 2025; Accepted 24 April 2025; Issue published 09 June 2025
 View Full Text
 Download PDF
Abstract
The integration of IoT and Deep Learning (DL) has significantly advanced real-time health monitoring and predictive maintenance in prognostic and health management (PHM). Electrocardiograms (ECGs) are widely used for cardiovascular disease (CVD) diagnosis, but fluctuating signal patterns make classification challenging. Computer-assisted automated diagnostic tools that enhance ECG signal categorization using sophisticated algorithms and machine learning are helping healthcare practitioners manage greater patient populations. With this motivation, the study proposes a DL framework leveraging the PTB-XL ECG dataset to improve CVD diagnosis. Deep Transfer Learning (DTL) techniques extract features, followed by feature fusion to eliminate redundancy and retain the most informative features. Utilizing the African Vulture Optimization Algorithm (AVOA) for feature selection is more effective than the standard methods, as it offers an ideal balance between exploration and exploitation that results in an optimal set of features, improving classification performance while reducing redundancy. Various machine learning classifiers, including Support Vector Machine (SVM), eXtreme Gradient Boosting (XGBoost), Adaptive Boosting (AdaBoost), and Extreme Learning Machine (ELM), are used for further classification. Additionally, an ensemble model is developed to further improve accuracy. Experimental results demonstrate that the proposed model achieves the highest accuracy of 96.31%, highlighting its effectiveness in enhancing CVD diagnosis.Keywords
AI, IoT, and mobile technologies have caused a major shift in the delivery and practice of medicine. The advent of wearable technology, sensor networks for mobile communications, and other mobile technologies have transformed the model of healthcare delivery from a hospital-focused to a patient-centric paradigm [1,2]. These improvements allow for early diagnosis, better accessibility, and less cost. Leading causes of mortality, CVDs, are the burden of modern society [3]. Healthcare systems globally have a huge financial burden with CVDs like coronary artery disease, heart failure, arrhythmias, and strokes [4,5]. These diseases need to be detected and monitored before and after positive health outcomes are achieved to ensure the reversal of the illness [6].
The WHO has already identified CVDs as a health threat for all people that cuts across boundaries, which demonstrates the urgent need for efficient monitoring techniques as well as their anticipated real-time preventive measures [7]. ECGs offer non-invasive, fast, and dependable information on cardiac activity, making them useful in diagnosing CVD. Nonetheless, conventional ECGs must be interpreted by specialists, which is always manual, expert-based, and, therefore, slow, expensive, and often impossible in areas with poor physician access [8]. IoT-enabled ECG devices powered by mobile and wireless networks and edge microprocessors are scalable solutions for cardiac health monitoring at a distance or inside the patient’s home, even in low-resource settings [9,10].
Deep learning (DL) has developed as a promising approach for analyzing sophisticated biological data, from which the ECG signals and the accompanying complex tendencies are processed. Federated learning is also used to detect abnormal heart sound detection [11]. Significant achievements related to transfer learning and using pre-trained models like VGG16, ResNet, Inception, and EfficientNet have been reported for feature extraction from ECG spectrograms and other large dimensional data [12]. These models are mainly known for their fine-tuning and ability to be used as “feature extractors” for most patients, which solve the problems associated with the variability of ECG signals over time and from person to person [13,14]. The complexity and variability of signals still pose difficulties in feature extraction, selection, and classification accuracy, even with automated ECG classification. An IoT and DL framework is proposed in this study to improve accuracy and scalability in ECG-based CVD diagnoses.
This research aims to develop a transfer learning-based model for extracting the features from the ECG dataset and to combine the extracted features from different DTL phases. Various machine learning (ML) classifiers are applied to the combined features to make the initial prediction. Then, the various ensemble-based classifiers are applied for the final prediction. The objectives of the current work can be summarized as follows:
• To design and develop a DTL-based model using EfficientNet and DesnseNet to extract the features from the ECG signals.
• To implement a feature fusion method, Weighted Feature Averaging Fusion and Variance Thresholding, to combine the features extracted from both DTL models.
• To optimize the feature selection process by applying the African Vulture Optimization algorithm (AVOA) as a feature selection algorithm to select features from the combined features.
• To develop and evaluate ML classification algorithms and ensemble models for the classification phase.
This study seeks to improve CVD diagnostics with DTL, feature selection using the AVOA, and ensemble classification using a systemic approach. The following research questions are devised to steer the study in the right direction.
RQ1: How can DTL models improve feature extraction from ECG signals for more accurate CVD diagnosis?
RQ2: How does the AVOA contribute to selecting the most relevant ECG signal features for effective classification?
RQ3: Can an ensemble-based ML approach enhance the accuracy and robustness of ECG signal classification?
RQ4: How effectively is an IoT-integrated DL framework enabling real-time and scalable ECG-based CVD diagnosis?
Recent studies have highlighted the growing significance of physiological and cardiovascular markers in understanding disease progression and treatment outcomes [15–17], further emphasizing the need for advanced, data-driven approaches in cardiovascular disease diagnosis. Cardiovascular diseases, also known as CVDs, have recently been of interest among medical professionals and researchers for their diagnosis. The tremendous advancements in DL and ML techniques aimed at exploiting valuable data from electrocardiograms, more commonly called ECG data, are of great interest in cardiovascular health. Recent advances in both ML techniques and DL techniques show a lot of promise towards significantly improving the accuracy with which heart disease can be diagnosed, and this mainly occurs through the detailed analysis of ECG data.
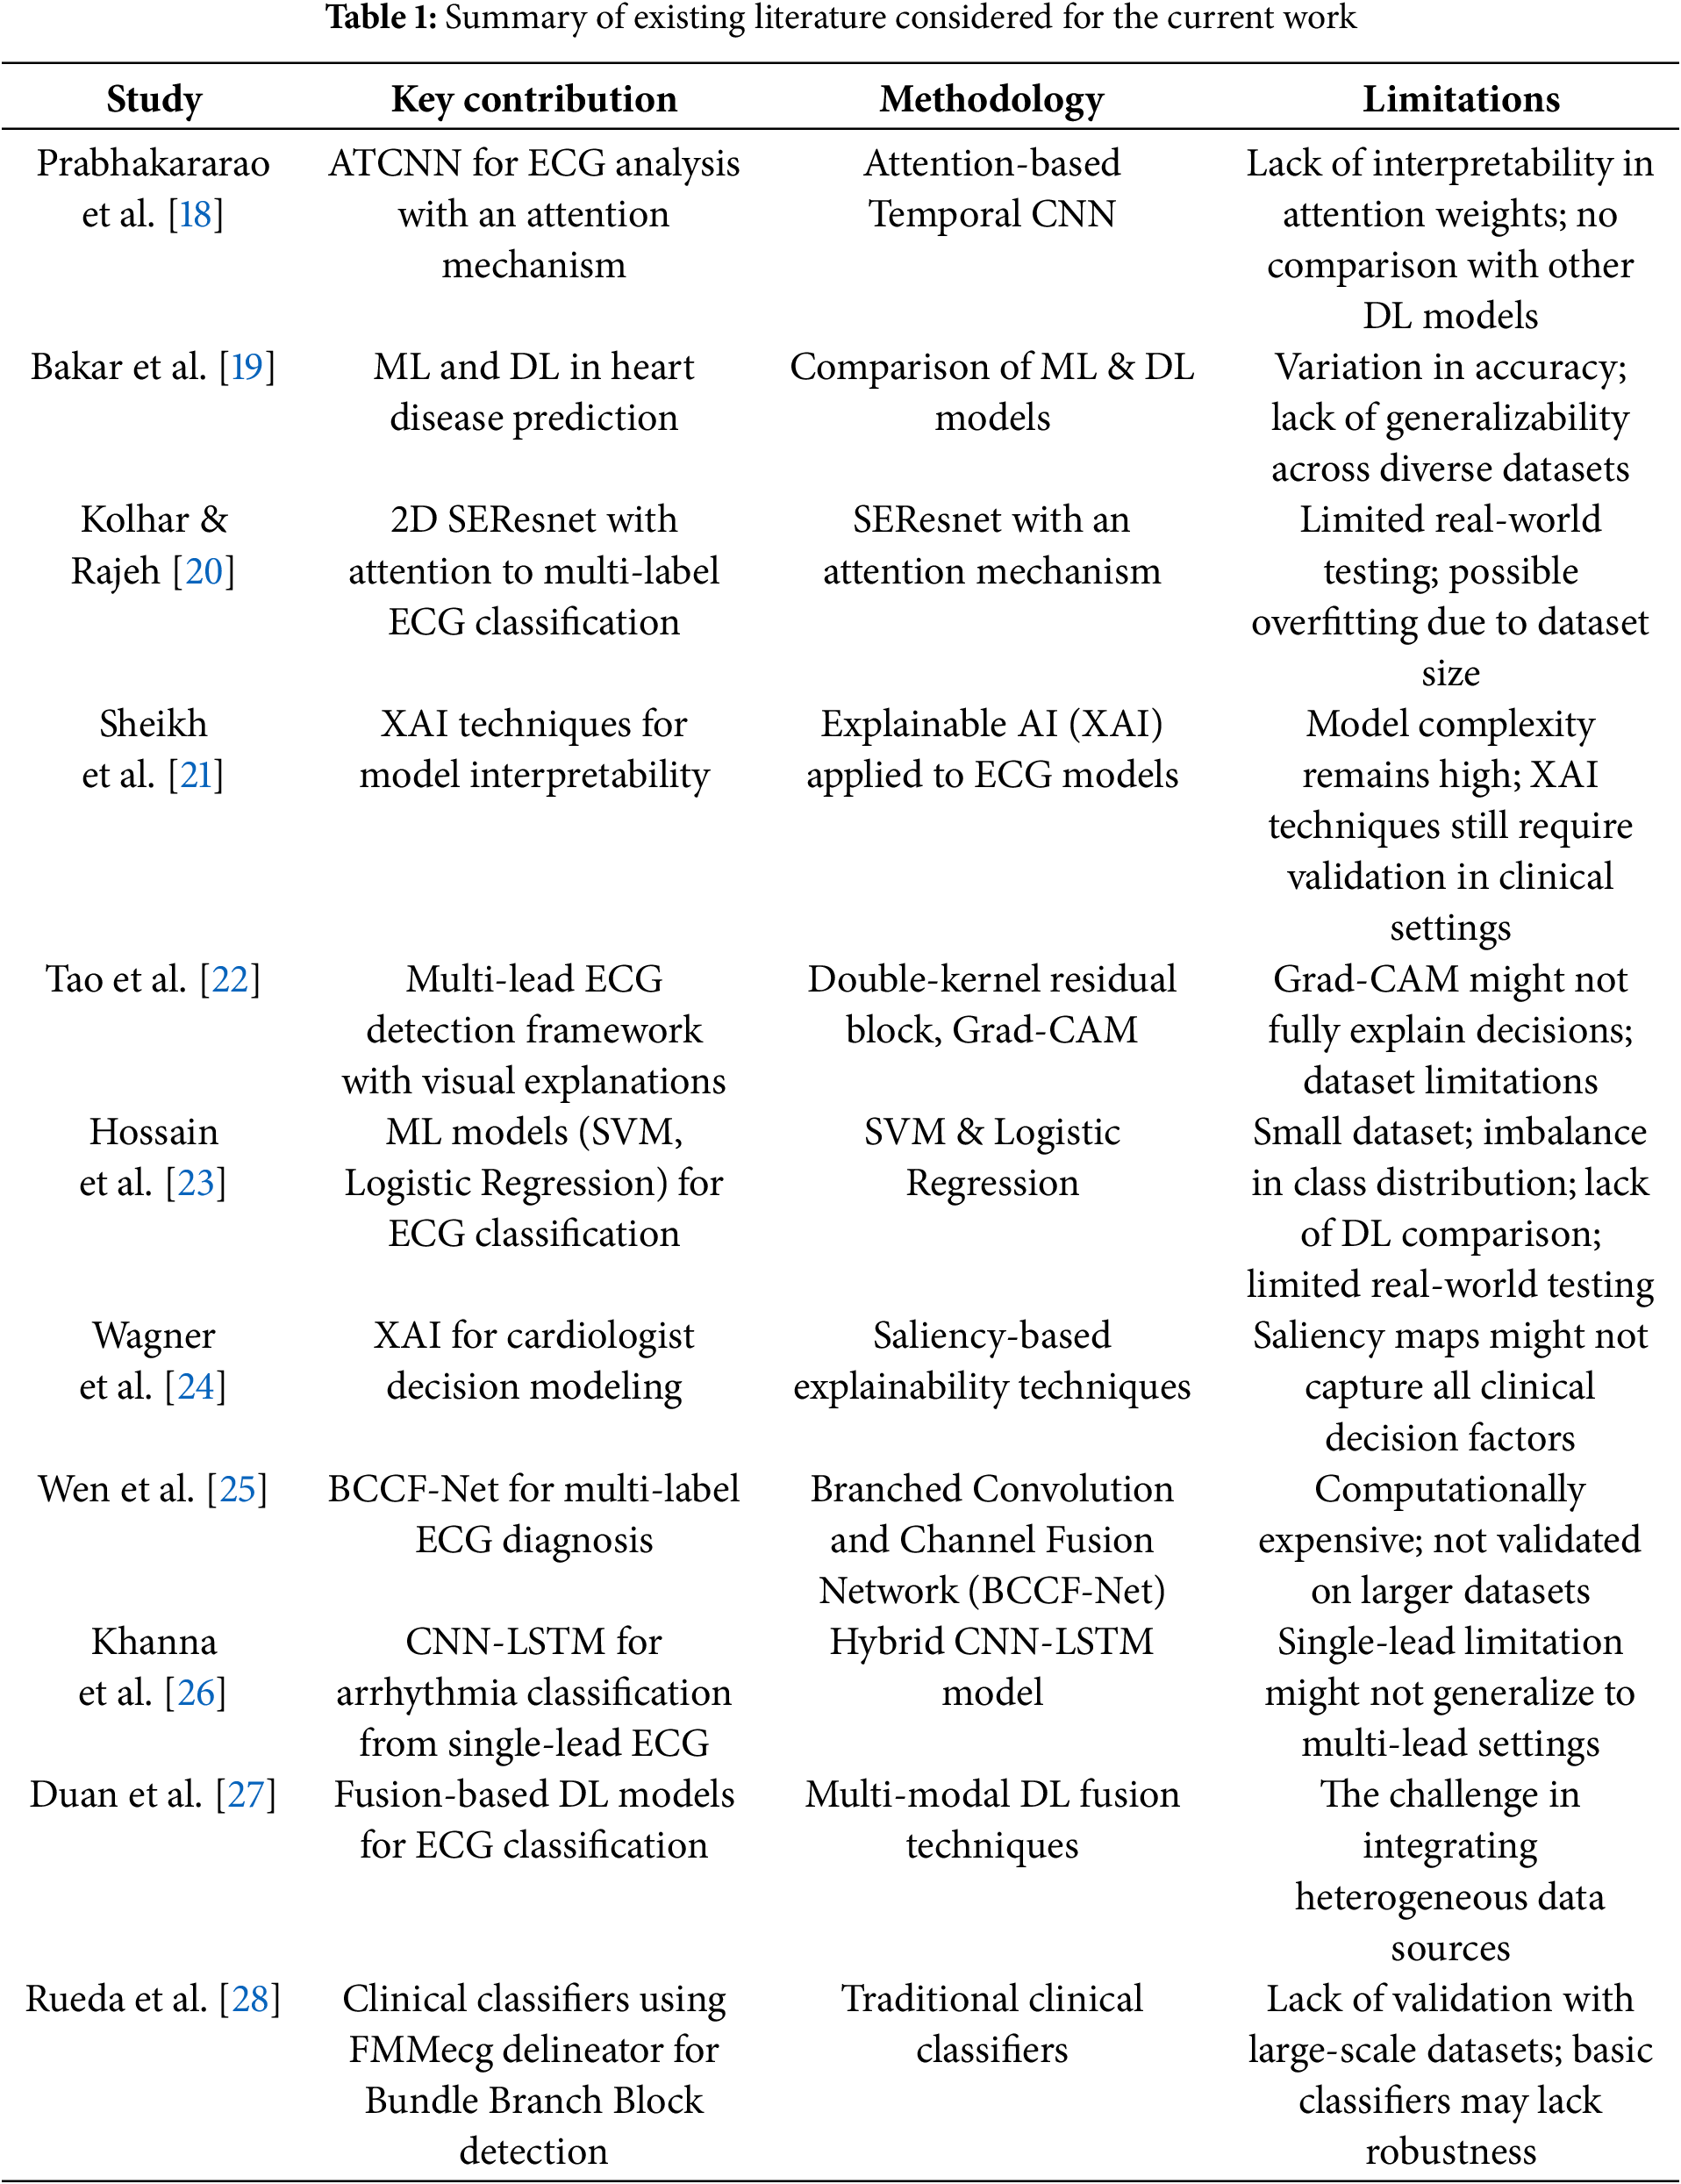
Prabhakararao and Dandapt [18] proposed an innovative ensemble of attention-based temporal convolutional neural network (ATCNN) models. Medical professionals may be able to use these attention weights to make better, more timely treatment decisions for their patients. The need to find and implement novel solutions to enhance diagnostic precision and patient outcomes is growing in response to the rising incidence of cardiac illnesses. Bakar et al. [19] have also pointed out that ML and DL technologies play a vital role in predicting and detecting heart diseases, although there is considerable variation with regard to accuracy among various algorithms that are being developed in this particular area of research. Overall, according to their research findings, DL models showed a persistent dominance over classical ML models, with precision ratings up to 84% and as high as 99%. Thus, this critical point indicates the considerable potential for developing this technology further, as this can make tremendous differences within the national health sector through proper, early diagnosis based on the usage of higher technology and techniques. The presence of several CVDs in one patient with complex ECG signals adds significant challenges to accurate classification. Kolhar and Rajeh [20] present a new approach using a 2D Squeeze-and-Excitation ResNet (SEResNet) architecture combined with an attention mechanism for reduced lead ECG multi-label classification. The model achieved high accuracy and F1 scores when evaluated on a dataset of more than 88,000 ECG records. The model significantly boosts its ability to generalize between contexts by thoughtfully incorporating various demographic features into its framework. This makes it a very promising tool for practical, real-world applications where there may be a need to work with limited lead configurations. Although there has been a lot of progress in DL, particularly in ECG analysis, there remain a few challenges, especially those related to the interpretability of complex models. Sheikh et al. [21] take a proactive approach by using explainable AI (XAI) methods that provide valuable insights into the underlying behavior of the model, thereby leading to a better understanding of how it works. Their exhaustive and detailed study forms a solid foundation for a sound set of sanity checks that successfully establish saliency as a valid and credible attribution method. Their groundbreaking work aligns the behavior demonstrated in the model with decision rules in place by cardiologists and significantly enhances the overall transparency of DL models in support of clinical decision-making processes, as well as the discovery of knowledge within the field itself, for example, to identify subtypes of myocardial infarction. Additionally, Tao et al. [22] also echo and underscore the critical need for interpretive models in ECG analysis when they present an innovative, interpretable multi-lead ECG detection framework to augment the understanding and clarity in the study area. Their novel approach uses an advanced double-kernel residual block, which is devised to extract inter-lead and intra-lead features. In addition, it employs a visualization technique based on gradient-weighted class activation mapping, which offers deeper insights into how the model makes decisions. Hence, the model has excellent performance metrics in achieving an AUC macro score of 0.929 when tested against the PTB-XL dataset.
Hossain et al. [23] have reviewed several ML algorithms in detail; more precisely, the main approaches, such as Support Vector Machine and Logistic Regression, were reviewed. The experiment was performed on a dataset consisting of 1190 individual records. The dataset was taken from the UCI repository. It is a well-known repository that maintains a long list of datasets suitable for empirical research. The results showed that the accuracy rate achieved using the Support Vector Machine algorithm is as high as 85.49%. An excellent result of this sort indicates the enormous possibility of using ML technologies within this crucial domain of high-risk patient identification, thereby allowing early diagnosis to be performed with timeliness and effectiveness. Wagner et al. [24] moved significantly toward addressing this issue. They utilized state-of-the-art XAI methodologies to conduct a thorough analysis of the complex model behavior of cardiologists’ decision-making processes. Extensive detailed analysis was performed successfully to establish a concrete set of sanity checks that reliably identified saliency as a trustworthy and reliable means of attribution. This present study offers compelling quantitative evidence to demonstrate in great detail a strong correspondence between model predictions and clinical expertise. Besides this, Wen et al. [25] made a great contribution in this regard by proposing a novel architecture called Branched Convolution and Channel Fusion Network, which was specifically tailored for the complex task of multi-label diagnosis of ECG signals. BCCF-Net proved to be outstandingly capable of identifying multiple cardiac conditions simultaneously and thus became practical in clinical settings for refined and precise diagnosis of different kinds of cardiac arrhythmias. Different studies conducted in the area bring out vividly the remarkable and transformational potential approaches to DL and ML with regard to the diagnosis of heart disease, especially through ECG data. Khanna et al. [26] proposed a model based on a hybrid DL framework that incorporates CNNs and LSTM networks for severe arrhythmia classification from single-lead ECG signals. The model increased accuracy by adequately exploiting the spatial and temporal characteristics of the problem, which resulted in the ability to generalize in the presence of different ECG morphologies for different patients. Duan et al. [27] state the importance of adopting different types of data to improve the stability of diagnostic models. Their extensive literature review lists different types of DL-based fusion techniques, which can be helpful for researchers looking to develop better methods of ECG classification. By using multimodal data, researchers can overcome the challenges that come with studying single-modal data. This may improve classification accuracy and, as a result, aid in better clinical decision-making. Additionally, Rueda et al. [28] have defined a few simple clinical classifiers to diagnose Bundle Branch Blocks based on markers derived from the FMM ECG delineator. Their research demonstrates that the best performance in electrodes’ diagnostic tools can be achieved, irrespective of the ECG signals’ complexity. This perspective is particularly important for researchers in the clinical engineering field who try to design effective and practical diagnostic tools under the challenging ECG data environment. All of these works provide important algorithms and methods for the next steps in DL-based ECG classification that can be performed satisfactorily, though perhaps not at the 93% threshold. Table 1 shows the summary of the considered literature.
Although DL and ML for ECG classification have made great progress, numerous important issues remain unresolved. Currently, research is conducted mostly on standard CNN architectures. Research on DTL using sophisticated architectures, including EfficientNet and DenseNet, for strong ECG feature extraction is lacking. Although several fusion methods have been applied in ECG classification, most fail to efficiently combine Weighted Feature Averaging Fusion and Variance Thresholding to improve the quality of obtained features. A hybrid fusion approach has not yet been developed to balance feature relevance and variability. In ECG classification, high-dimensional feature spaces can cause overfitting and more computational difficulty. Current feature selection techniques might not be able to efficiently maintain the most pertinent characteristics while removing duplicate ones, therefore affecting the classification performance. Although DL and ML models have shown encouraging outcomes, highly accurate, interpretable, and generalizable models that perform well across several ECG datasets and clinical circumstances are still lacking development.
Although IoT-based ECG classification and DL have been widely investigated, there is a clear void in addressing why ensemble models outperform solo classifiers in ECG classification. Although current studies mostly investigate individual designs such as ATCNN, SEResnet, and CNN-LSTM, as well as conventional models like SVM and Logistic Regression, they lack a comparison of ensemble approaches. By lowering overfitting, ensemble models often attain higher generalization and are more resilient to noise and changes in ECG data. They use the advantages of many models, including LSTMs for temporal dependencies and CNNs for spatial feature extraction, thereby producing enhanced accuracy and stability. Furthermore, computationally costly DL models such as BCCF-Net may be averaged across many models to reduce instability. Furthermore, while explainability methods such as XAI have been investigated, ensemble approaches might improve interpretability by lowering individual model biases and raising confidence in clinical decision-making. To close this discrepancy, future research should look at the relative efficiency of ensemble models vs. single DL classifiers in ECG analysis, especially in real-world clinical environments.
Through the research, there will be an increased accuracy in the cardiology diagnosis and outcomes of the patients because researchers are designing algorithms in more advanced ways that consider interpretability and multi-label classification challenges. In other words, applying DL techniques to ML algorithms about ECG is one major development in diagnosing heart diseases. The PTBXL dataset becomes an essential and precious source for researchers in the healthcare and medical technology domains, allowing advanced models to be developed to achieve high accuracy and critical interpretability in the decision-making process. Further research should be focused on addressing the vast challenges that the applicability of real-world data poses and also working toward improving transparency within these models to foster and build confidence among healthcare professionals who utilize these tools to treat patients. Contributions by the current work in the field pave the way toward even more effective and accessible means for diagnosing cardiovascular diseases and, hence, better patient care.
The proposed model includes EfficientNet and DenseNet, which serve as feature extractors due to their deep structures, which effectively extract intricate features from ECG signals. For Weighted Feature Averaging Fusion and Variance Thresholding Fusion, the features to be fused are first extracted from different sources to keep redundancy at an acceptable level and compact the information. The chosen features are then tuned using the AVOA. For the first prediction, support vector machine (SVM), eXtreme gradient boosting (XGBoost), adaptive boosting (AdaBoost), and extreme learning machine (ELM) are used. These classifiers assist in producing varied and robust outcomes during the classification. To achieve better overall prediction accuracy and reliability, ensemble classifiers, such as hard voting, soft voting, and weighted averaging, are incorporated, which combine the outputs of several individual classifiers to provide a singular, more accurate cardiac illness diagnosis.
EfficientNet is a family of convolutional neural networks that exhibits unparalleled optimizations and increases in computational efficiency regarding the task of image classification. The network’s depth, breadth relative to its efficiency, and feature resolution are all scaled uniformly using a new compound scaling approach [29]. It starts with a standard 3 × 3 convolutional layer for basic feature extraction and then goes to many optimized MBConv blocks for mobile and low-resource devices. They are depth-wise separable convolutions with linear bottlenecks. The MBConv blocks, such as MBConv1 and MBConv6, enable the network and its feature representation to have alternative kernel sizes (3 × 3 and 5 × 5) and expansion ratios. It has been possible to successfully capture the hierarchical features by gradually growing the number of channels and reducing the spatial sizes over the network’s progression. Each segment in the network employs SE modules on channel-wise attention while repeating MBConv layers to improve the feature extraction rate. The network runs a 1 × 1 convolution, global average pooling, and a fully connected (FC) layer to generate a concise feature map that is good for classification tasks. With fewer parameters and lower computing costs, EfficientNet outperforms bigger models due to its well-balanced architecture. EfficientNet is selected as the transfer learning technique due to its superior efficiency in balancing accuracy and computational complexity. It presents a compound scaling approach that consistently scales depth, breadth, and network resolution, thereby optimizing performance without a parameter increase that is too strong. The EfficientNet model especially achieves state-of-the-art accuracy with far fewer parameters than conventional architectures like ResNet and VGG. This qualifies well for ECG classification jobs where computing performance is vital, particularly for implementation in real-time or resource-limited contexts. Fig. 1 shows the architecture of the adopted EfficientNet in the reported work.
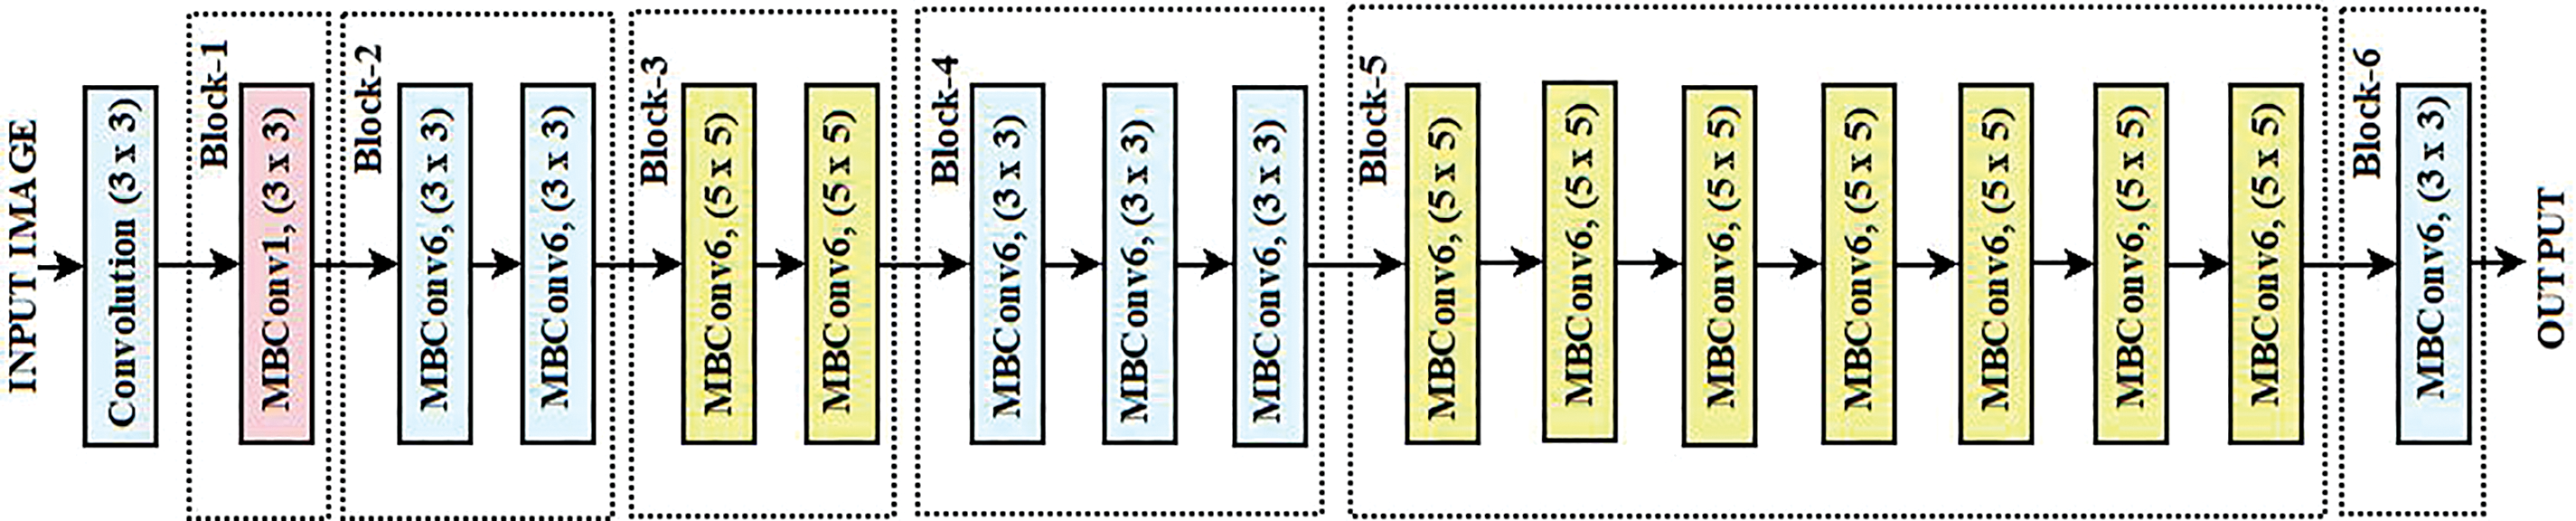
Figure 1: Architecture of EfficientNet
DenseNet-201 is a deep convolutional neural network architecture that connects the layers in dense blocks so that the flow of information is maximized while redundancy is minimized [30]. To begin with the architecture, there is an Initial Convolution layer that utilizes a 7 × 7 kernel with a stride of 2. Afterward, a max-pooling operation had the same diagonal stride to shrink the spatial dimensions while simple features were being extracted. There are four Dense Blocks: the uppermost one possesses six layers, the second one has twelve layers, the third dense block has forty-eight layers, and the final one has thirty-two layers, and they all incorporate a growth rate of k = 32. Each block contains a specific number of layers that are interconnected to all the layers in that block, so the feature maps of an earlier layer are used in a later layer by every layer. The parameters are greatly minimized due to the introduction of high feature propagation. In between the dense blocks are Transition Layers, which take advantage of a 1 × 1 DENSE layer to reduce the dimensions of the feature maps and utilize 2 × 2 average pooling to shrink the spatial dimensions. These controls of transitions help in model complexity, preventing overfitting. DenseNet-201 embodies an improved construction that includes in its last piece a 1 × 1 overlay to amalgamate the features, a Fully Connected Layer with global average pooling, which aids in decreasing the spatial data. A Global Average Pooling layer takes in the feature vector while a Fully Connected layer outputs the predictions. DenseNet is a preferred transfer learning technique due to its densely connected architecture. This architecture guarantees improved feature propagation, reduces the vanishing gradient issue, and advances parameter efficiency. DenseNet is very helpful for ECG signal classification, where minute morphological changes in waveforms are crucial as it uses fewer parameters by reusing features across layers while obtaining competitive performance. Its feature concatenation method also improves gradient flow, enhancing generalization and learning efficiency. Fig. 2 shows the architecture of the adopted DenseNet for extracting the features from the input images.
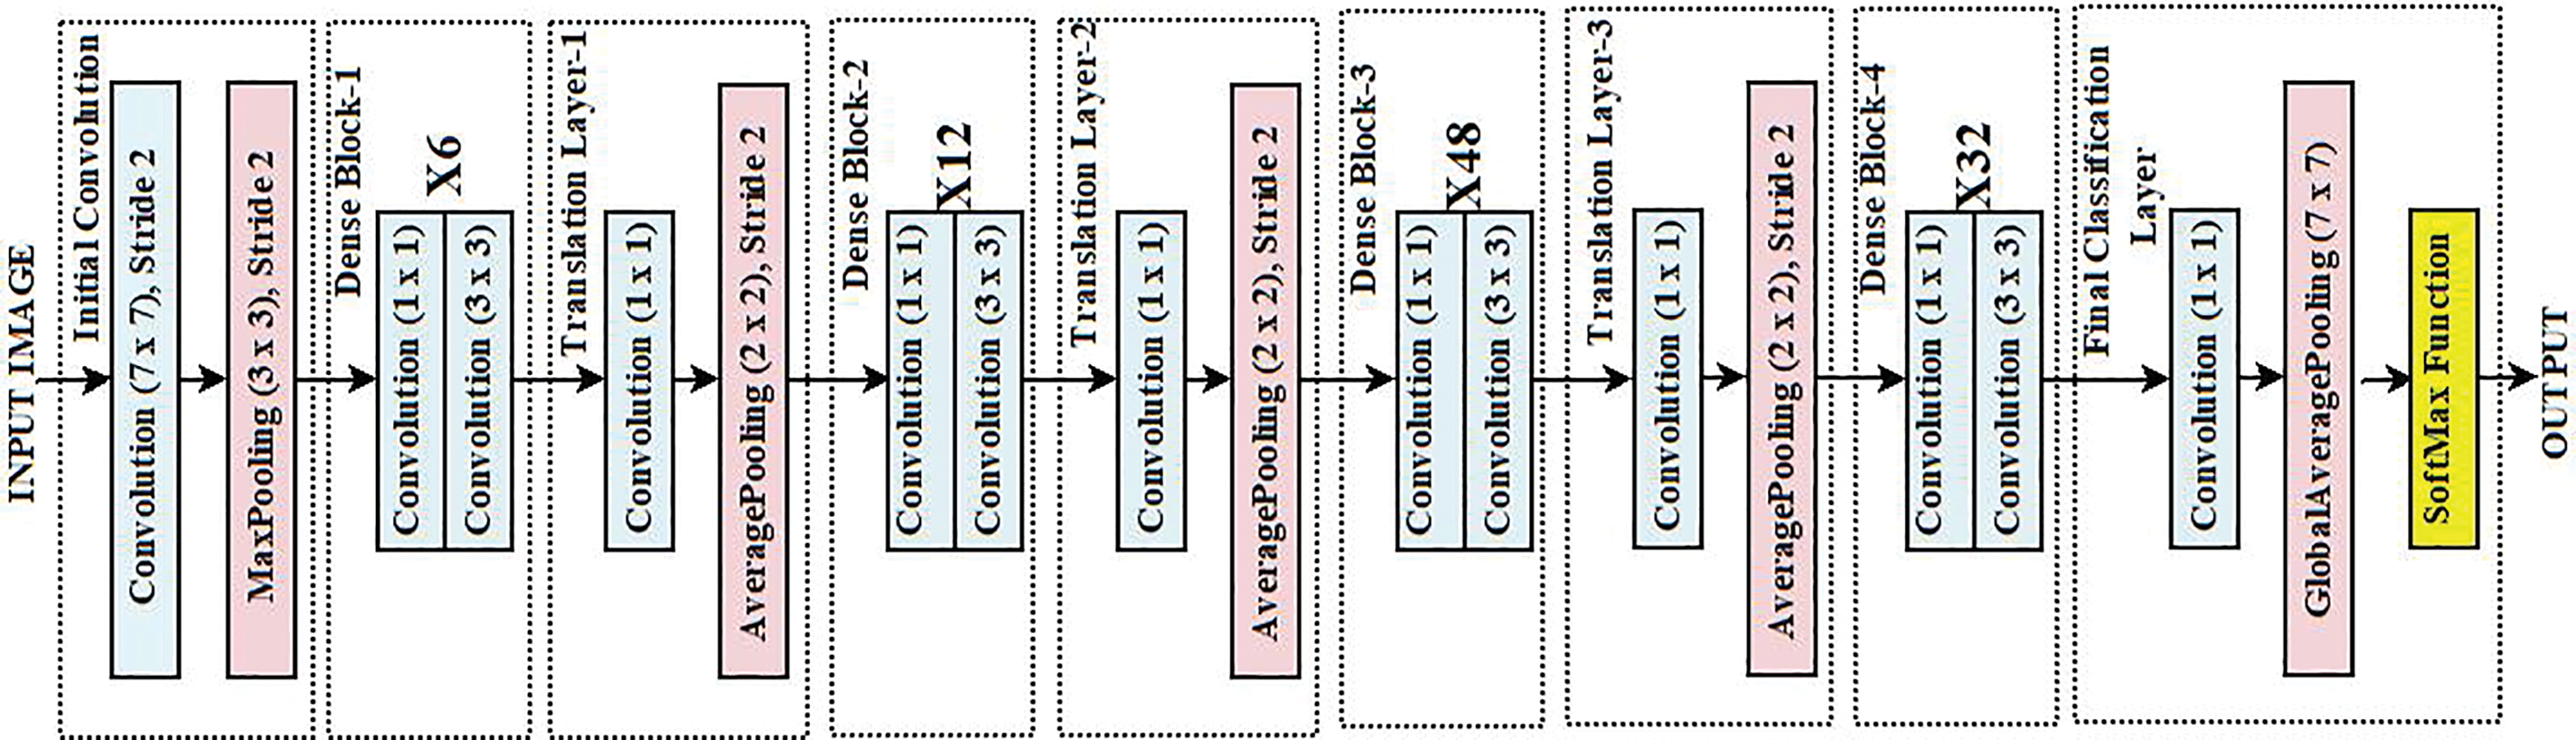
Figure 2: Architecture of DenseNet
Weighted Feature Averaging Fusion and Variance Thresholding is an approach for feature fusion combining DenseNet and EfficientNet models that can be used, for instance, in ECG signal classification. In weighted feature averaged fusion, feature vectors from the DenseNet and EfficientNet are fused using a weighted average method using Eq. (1), with w1 and w2 as the weight factors associated with feature extracted using EfficientNet (FE) and feature extracted using DenseNet (FD).
Eq. (2) originates from the convex combination principle in ML. The idea is that when combining the features from different transfer learning techniques, their contribution towards the final feature set should be 1 to maintain interpretability and consistency. The weights in Eq. (2) can be adjusted by using Adaptive Weighting, Softmax-based automatic weight assignment, or the Data-Driven Feature Ration approach. For the current work, equal priority has been given to EfficientNet and DenseNet. Hence, the w1 and w2 are set to 0.5 each for Eq. (2).
In order to refine the extracted feature vectors, Variance Thresholding is applied to eliminate the redundant features or low-variance features from
where Fij is the value of jth features of ith sample of
Based on their respective contribution to classification, Weighted Feature Averaging Fusion is used to allocate the best significance to the feature maps obtained by EfficientNet and DenseNet. A basic concatenation might cause duplication or an imbalance in feature relevance when both networks learn distinct facets of the ECG data. Using weighted averaging guarantees that, in proportionate terms, the most relevant characteristics from both models contribute to the final representation, therefore improving classification accuracy. Then, a feature selection method, variance thresholding, removes low-variance elements that little affect model prediction. Variance Thresholding guarantees that only the most discriminative and high-variance characteristics are kept, as feature fusion might add redundant or less informative elements. This stage reduces dimensionality, optimizing computer efficiency while preserving necessary information for strong classification.
3.4 African Vulture Optimization Algorithm
The AVOA takes into consideration African vultures. These magnificent birds are known to possess special social and behavioral patterns and sharing of skills that help in the locating and utilization of food in difficult places. According to this algorithm, their capabilities in searching for food include soaring and soaring in circles. This algorithm cites their skills of long-range soaring and circular movements in searching for food as their strengths. South African vultures adopt a two-pronged approach: They scout a region to find food and then converge on those targets or newly scouted areas to maximize their use. These characteristics fit perfectly into optimization issues where there is a need to search previously unexplored areas (exploration) and enhance the precision of those areas (exploitation). AVOA has emerged as an efficient, robust, and adaptable optimization algorithm because of a specific niche in complex and multifaceted high-dimensional problems. Inspired by the collaborative decision-making and precision of the African vultures, AVOA, like bio-inspired computing, offers the chance to solve real-world engineering, optimization, and ML problems natively. Furthermore, it suggests that natural phenomena can be studied in parallel to constructing effective computational methods [31–33].
Initialize the population of the vultures (V) within the defined search space. Each vulture present in the population presents a potential solution. Eq. (5) shows the potential solution of each vulture.
where r is the random number between [0, 1], Vmin and Vmax are the lower and upper bounds of the search space, respectively. The fitness of each vulture V is defined by using the objective function f(V) using Eq. (6).
In the vulture group, the leader vulture (VLeader) is defined using Eq. (7). The leader vulture guides the rest of the vultures present in the group, with VLeader as the leader vulture position and agrmin is a function to calculate the min fitness function.
In the AVOA, the exploration and exploitation strategies focus on ensuring that global search (the ability to explore a new region of the search space) and local search (improving on the best-known solution) are balanced. A dynamic control mechanism that utilizes variables such as the number of iterations or a probability threshold is incorporated into the algorithm for successful switching between these two phases. The most common strategy is to use a control parameter (α) to dynamically switch between the exploration and exploitation phases. In the exploration phase, vultures search the search space globally, away from their current positions, to discover new regions. In the exploitation phase, the vultures focus on the VLeader and refine their positions to obtain the best solution. The balance factor (α) is typically preferred as a higher value which can be defined by using Eq. (8) to support the exploration phase and gradually decreases as the algorithm progresses to favour exploitation.
where
For the exploitation phase, the vulture position can be updated using Eq. (10) with r2 as the random number between [0, 1]. The control parameter α balances between the exploration and exploitation using Eq. (11).
The spiral pattern flight of the vulture is controlled by using Eq. (12). The objective of controlling the spiral pattern flight is to enhance the degree of exploration.
where A is the constant between [1, 2] defining the spiral size, b is the constant between [−1, 1] for shaping the spiral, and θ is the random angle. A and b can be defined using Eqs. (13) and (14), respectively, with A0 as the starting value (1.5) and b0 as the starting value (0.5).
Eq. (15) introduces the random perturbations to escape the local optima to obtain the best optimal solution with β as the small random factor and
β0 as the initial value (0.9). To balance the exploration and exploitation, the high β is considered in the early iterations to encourage exploration by allowing the larger movements, and β is kept low in later iterations to focus on the exploitation stage for convergence. To ensure the solution always remains in the boundary of the search space, Eq. (17) is defined.
Strong exploration-exploitation balance, flexible search strategy, and better convergence properties define the AVOA for feature selection above existing metaheuristic algorithms. Unlike conventional metaheuristic algorithms such as Genetic Algorithm (GA), Particle Swarm Optimization (PSO), or Ant Colony Optimization (ACO), which may suffer from premature convergence or slow optimization speed, AVOA mimics the scavenging behavior of African vultures, dynamically switching between exploration (searching for diverse feature subsets) and exploitation (refining the best-selected features). This balance guarantees the choice of the most relevant and non-redundant characteristics, avoiding local optima and ensuring the improvement of classification performance. AVOA also uses sophisticated leader-following systems and adaptive weight management to negotiate high-dimensional feature spaces effectively. This makes AVOA especially fit for ECG signal classification, where improving model performance while lowering computational cost depends on choosing the most discriminative characteristics.
3.5 Machine Learning Classifiers
The reported model employs four strong classifiers known as SVM, XGBoost, AdaBoost, and ELM. The basic idea of SVM is more applicable for data with high dimensions since it facilitates the identification of the ideal hyperplane for separating the classes with the maximum margin. XGB is best utilized on complex datasets such as the one above, where it uses gradient boosting to build numerous decision trees, where each subsequent tree improves the errors of its predecessor, leading to highly accurate predictions. AdaBoost enhances the accuracy of a classifier by merging several weaker classifiers and giving emphasis on the greater number of errors, which replaces the normal sample weights with more robust weights that are needed to alleviate bias and variance in a classification process. Because of its reduced training time and complexity, ELM is also appended to the model. It involves a single-layer feed-forward neural network in which the hidden neurons’ weights are assigned randomly while the output weights’ estimators are obtained through a closed form, which provides faster and better learning. Incorporating these different classifier models, the reported model enables the boosting of each nature’s strengths, thus providing models that are strong, accurate, and highly efficient for a wide variety of tasks throughout the entire process [34].
Hard voting, soft voting, and weighted averaging are ensemble methods intended to aggregate the predictions of multiple classifiers in order to produce a more accurate classification than any one classifier alone. In hard voting, all classifiers are plugged in to make a class prediction, where the class with the most votes wins. In soft voting, the predicted probabilities from all classifiers are taken for averaging class prediction, depending on the maximum probability. In simplified terms, weighted averaging is almost the same as soft voting, but it makes use of the probability assigned to each classifier based on its relevance or result for a better prediction. These techniques increase prediction accuracy by combining the outputs from several classifiers.
Hard voting (HV) is an ensemble-based ML model where each base classifier votes for a particular class, and the class having majority votes is selected as the final prediction. The final prediction (FP) can be represented using Eq. (18), where the mode selects the most frequently predicted class.
where
Soft voting (SV) is one of the al-flag models that omits votes for the probability scores assigned by specific classifiers instead of the class output. For the case of linguistic ensembles, every classifier gives a probability distribution across the classes, and then the probabilities are simply averaged, and the appropriate class is concluded. The final prediction FP can be represented using Eq. (19), with argmax as the method to select the class with the highest probability and m number of total classes present in the dataset.
Weighted Averaging (WA) is the weighted version of the SV where every classifier’s prediction is weighted based on the performance. Using the argmax, the class with the highest probability is selected as the final prediction, which can be defined using Eq. (20).
Image pre-processing serves the purpose of increasing the quality of the ECG data, which is significant while dealing with the PTB-XL ECG dataset, as it helps in converting raw signals into more meaningful and organized formats that can be used with ML models. Due to the raw ECG signals being noisy and complicated, the first step taken to maximize the quality of the signals while retaining important features and minimizing irrelevant noise is filtering, normalizing, and transforming the signal into frequency domain representations using spectrograms or wavelets. This results in a more accurate and robust classification and prediction performance in the diagnosis of heart diseases, as features that have been extracted using these pre-processed images and filtering are more precise [35].
Wavelet Transform is a more efficient technique for analyzing ECG signals, particularly with extensive datasets such as the PTB-XL. This is different from the Short-Time Fourier Transform (STFT) method, which remains less flexible as it only allows the use of pseudo-frequency bins. For a multi-scale analysis to be deployed, Wavelet Transforms allows the use of Wavelets of varying sizes, thereby making it more suitable for nonstationary ECG Signals. The continuous wavelet transform (CWT) of a signal X(t) at a scale ρ and shift s can be defined using Eq. (21).
where
where k is the imaginary unit,
The PTB-XL ECG dataset is a vast database of electrocardiogram (ECG) recordings available for free and can be utilized for heart disease classification and detection. It has 21,837 12 lead ECG signals with a frequency of 1 kHz recorded from 2109 patients. There are 12 different labels in the dataset for various types of heart disease diagnoses, including normal and arrhythmic diseases, which can aid in multi-class classification problems. With each ECG signal, the dataset contains additional patient data such as age, gender, and diagnosis. The dataset is represented in 12 ECG signal leads, each a separate channel for recording different aspects of the heart. The PTB-XL dataset is further enabled with features containing long-term and short-term ECG data classification [36]. The dataset contains five different diagnosis labels, and Fig. 3 shows the class distribution of the PTB-XL dataset.
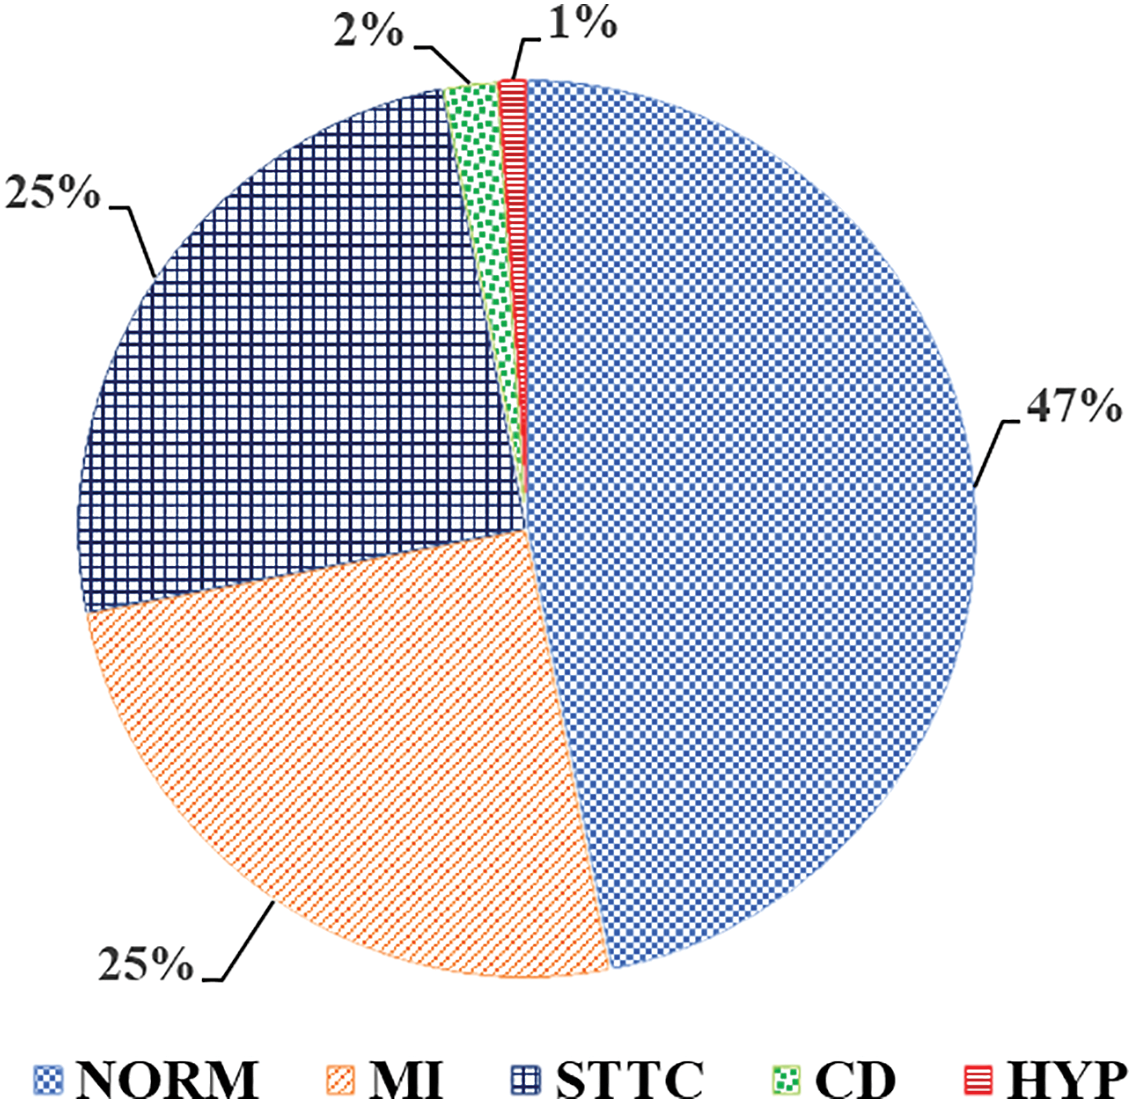
Figure 3: Class Distribution of PTB-XL dataset
4 Workflow of the Proposed Model
With DL in mind, the algorithm processes the dataset in several stages to classify the signals and predictive cardiac events from the ECG data. First, the samples of the ECG signals undergo pre-processing using wavelet transform. This method splits each ECG signal into parts by the frequency components, which helps improve the signal of interest while also capturing information on the time frame as well as the frequency. It also performs noise-cancelling processes, making the signals more adequate for feature extraction. This step makes it possible to construct a set of wavelet-transformed samples that capture the basic characteristics of the original ECG signals.
After performing pre-processing techniques, feature extraction uses two DL models: EfficientNet and DenseNet. EfficientNet is known to have higher accuracy without raising the parameters, and DenseNet is known for connectivity, as it connects each layer to every other layer. Both models are implemented on wavelet-transformed ECG signals. Furthermore, the extracted features underwent segregation and storage for each model. These feature sets encapsulate differing attributes of the signals, thereby providing supplementary information.
Once the features have been diligently extracted, they are averaged and fused. In this stage, the EfficientNet and DenseNet features are weighted differently to reflect their importance to the classification. Furthermore, variance thresholding is conducted post-fusion to remove almost everything that added little value to the classification task. The few remaining features will be used in the algorithm. Using the AVOA, feature selection is now conducted. As scavenging vultures do, AVOA is a probabilistic technique where a set of selected features is optimized iteratively. For every iteration, sets are measured with a fitness function, Balanced Accuracy. After all iterations are performed, the best one is kept. It is ensured that the best features are converged towards. After completing all iterations, the best feature set is ready for classification. Equipped with selected features, the algorithm now creates and trains several classifiers—SVM, XGBoost, AdaBoost, and ELM. The ensemble model is created from three approaches: Hard Voting, Soft Voting, and Weighted Averaging. Algorithm 1 and Fig. 4 represent the working of the proposed model for CVD diagnosis.
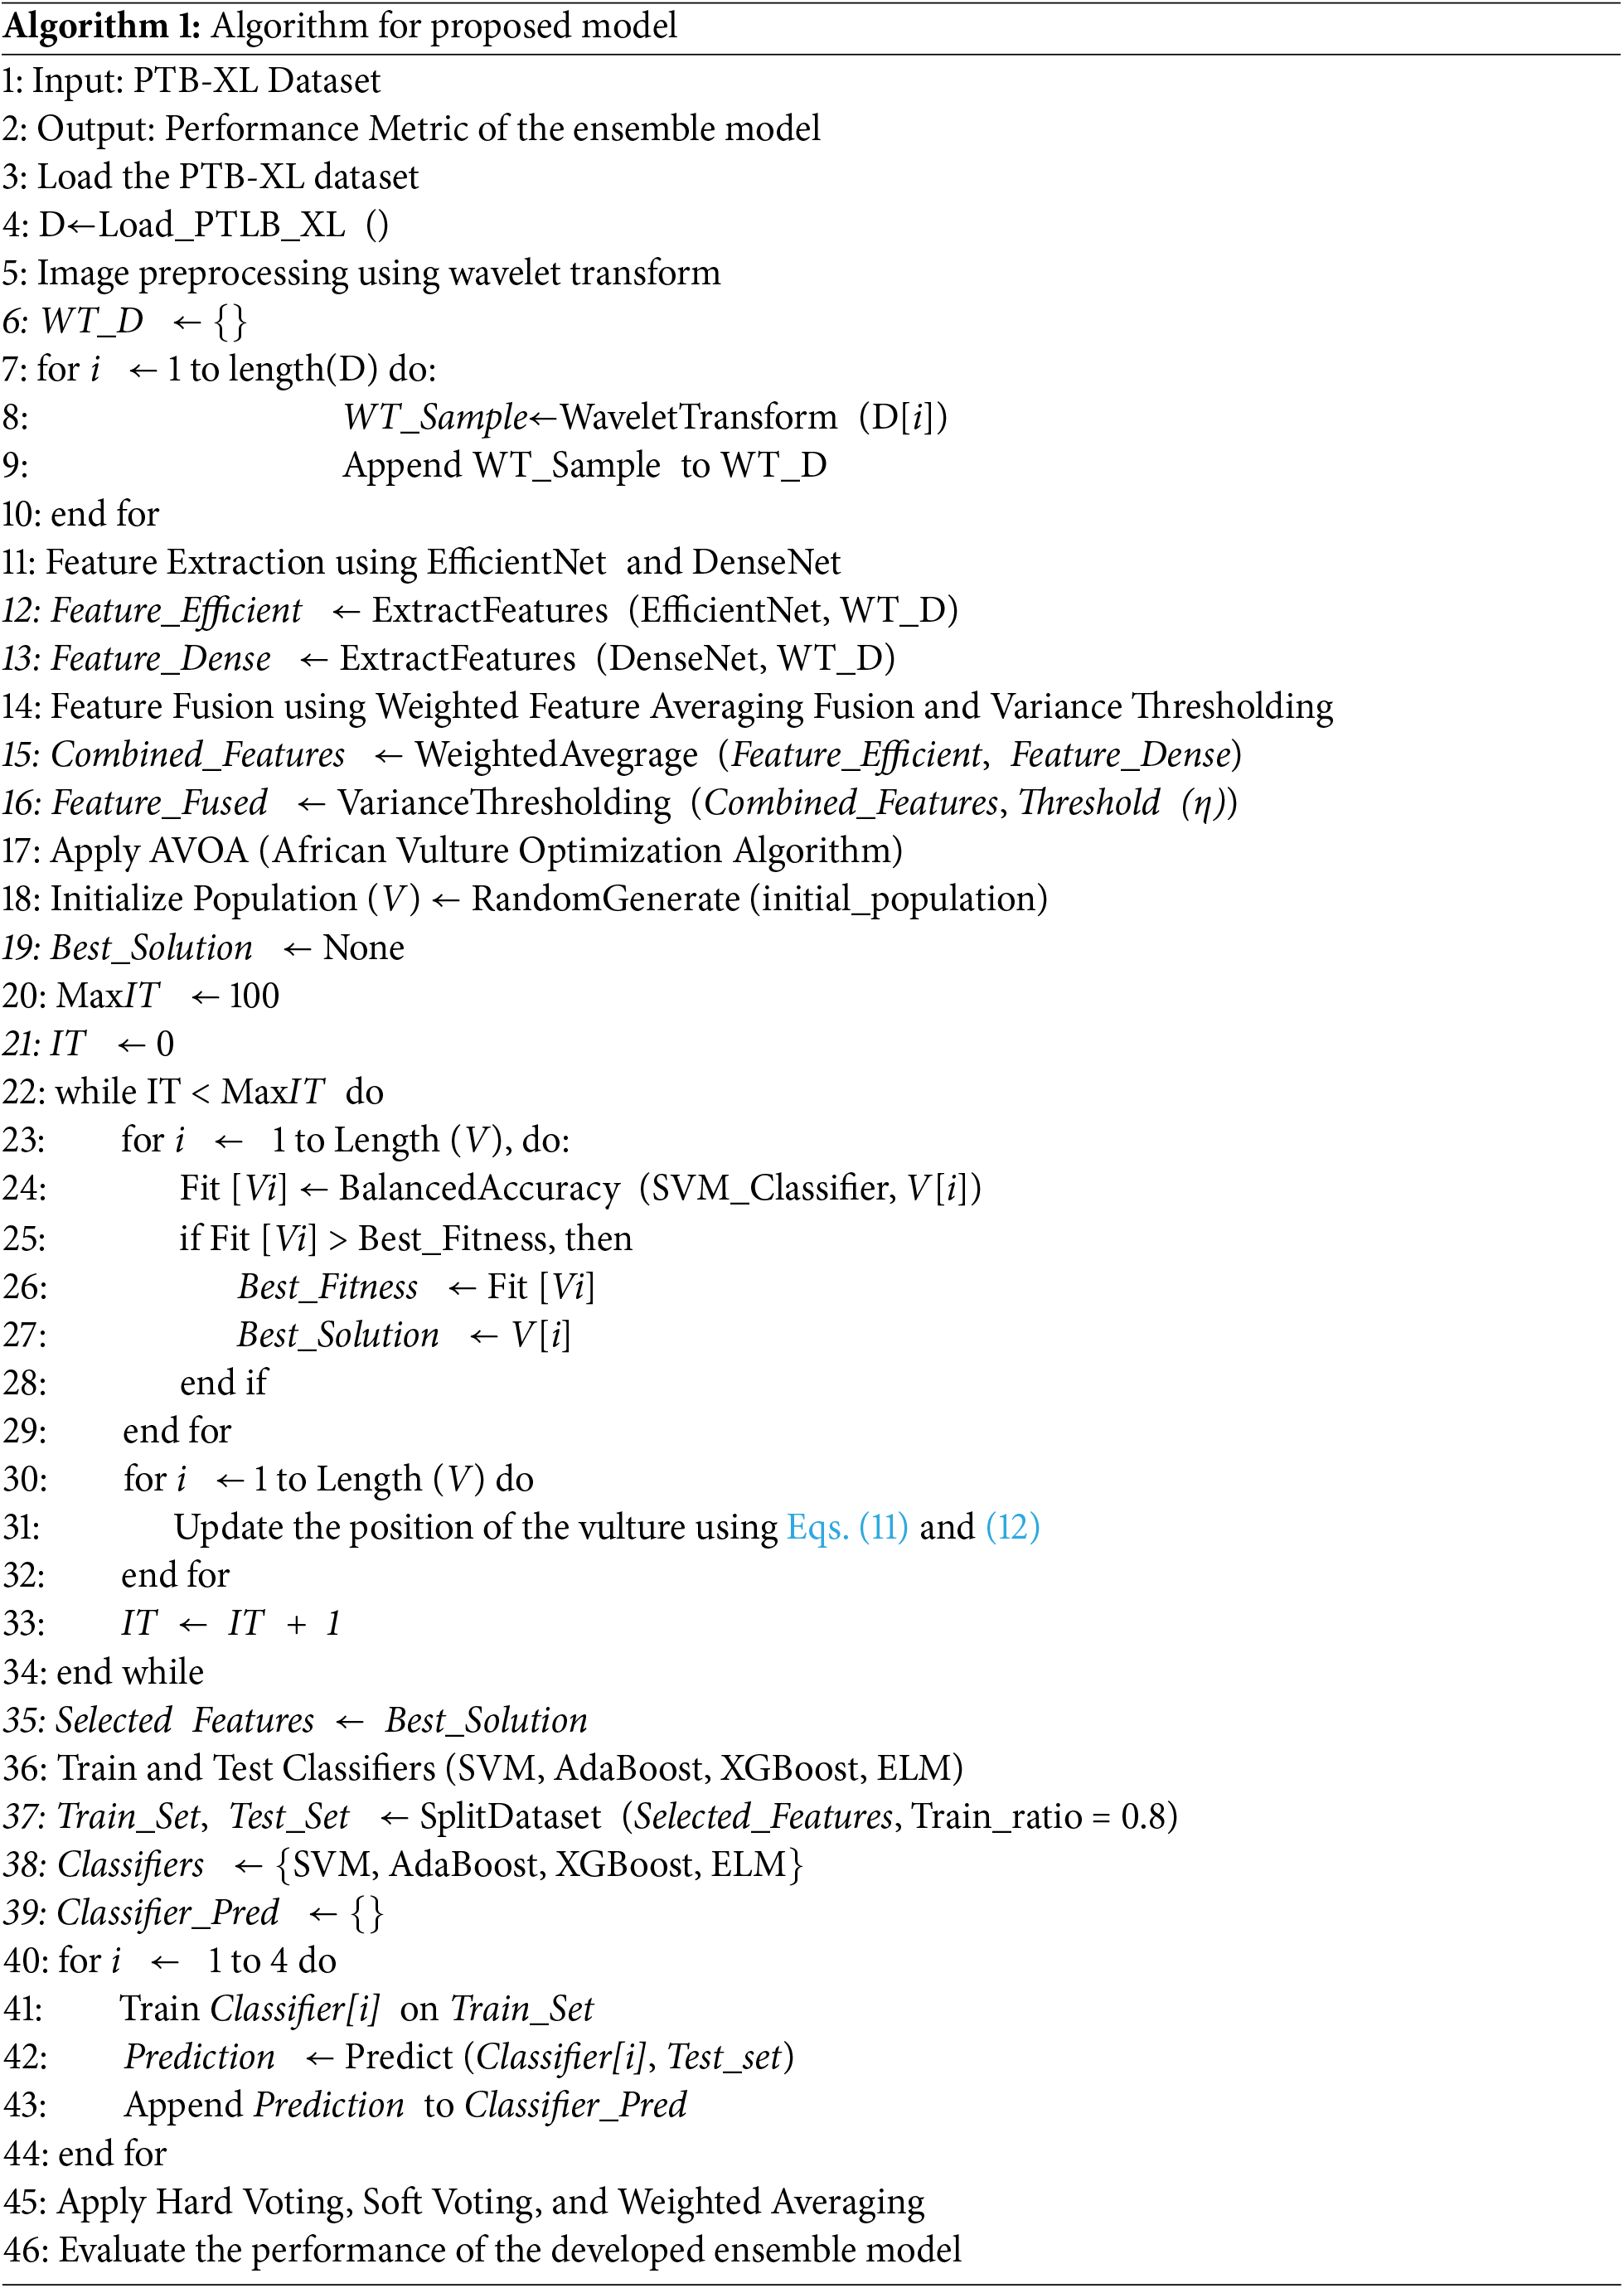
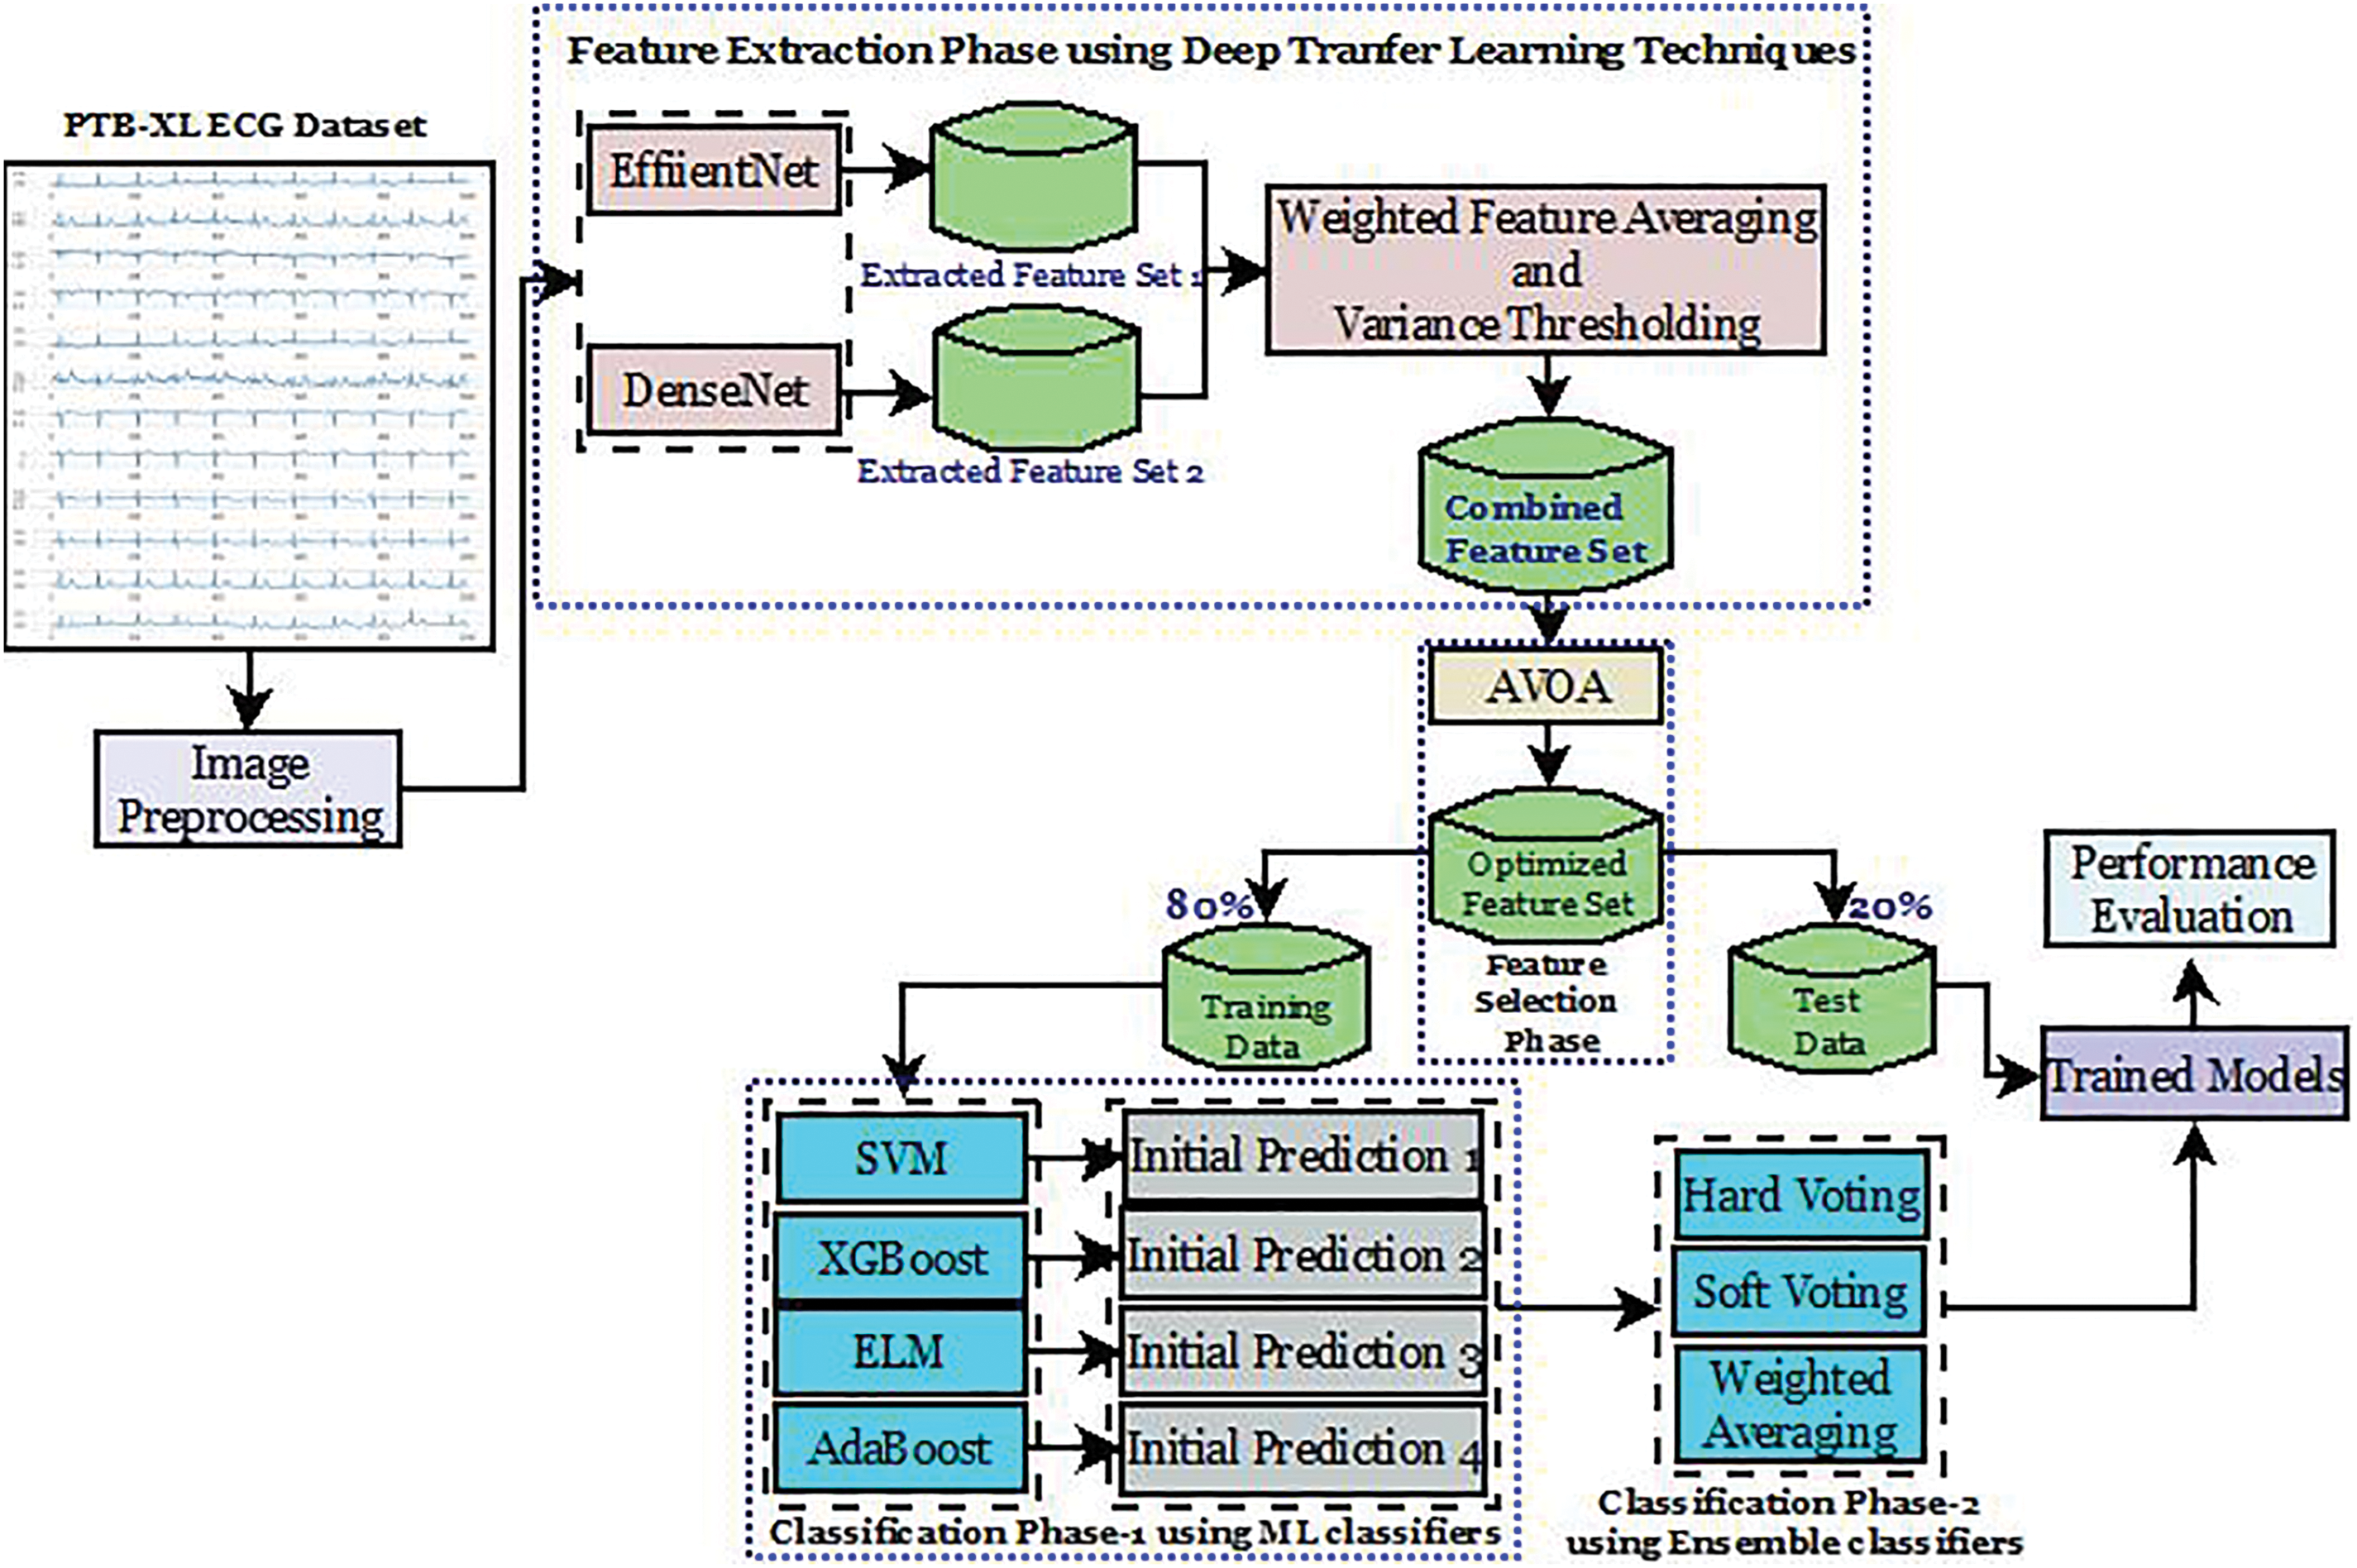
Figure 4: Workflow of the proposed model
Experiments are conducted on a high-performance PC comprising of an intel core i7 CPU operating at 4.6 GHz, 16 GB of Random Access Memory, and a 1 TB SSD, alongside a 1 TB HDD, while running Windows 11. These results have been systematically captured and reported in four distinct phases which provides an in-depth review of the methods and the efficacy of the methodologies and their execution. The first phase evaluates the performance of the features obtained through the EfficientNet model together with various classifiers. In phase two, an assessment of DenseNet’s performance as a feature extractor with various classifiers is investigated. The third phase works on the combined features of EfficientNet and DenseNet to use multiple classifiers to strengthen the collective efficiency of the two models. The last phase instead provides an in-depth analysis of the ensemble techniques of hard voting, soft voting, and weighted averaging but instead applies to the combined features obtained from EfficientNet and DenseNet. This approach of progressive evaluation draws attention to the changes in performance within the phases, making it easier to understand how the models functioned. The performance is evaluated over several parameters, including accuracy (AY), precision (PN), recall (RL), specificity (SY), F-1 Score (F1 S), F-2 Score (F2 S), False Negative Rate (FNR), False Positive Rate (FPR) and the Mathews Correlation Coefficient (MCC). These parameters can be defined using Eqs. (23)–(31) with t11, t12 as true positive and true negative, and f11, f12 as false positive and false negative, respectively.
• As for the SVM classifier, it achieved an accuracy of 80.75% in data classification, which is satisfactory. The classifier is quite dependable, with its precision at 78.91% predicting the negative class. The recall for the positive cases is at 81.95%, so it captures a good part of the actual positive cases. The F1 score is 80.40%, demonstrating the modest level of precision and recall balance achieved. On the other hand, there is a false-negative rate of 18.05%, which shows a reasonable number of positive cases missed, as well as a false-positive rate of 20.37%. The predicted value correlates fairly well with the actual value, as indicated by Matthews’ correlation coefficient, which is 61.54%.
• Noting that AdaBoost has a slightly better accuracy of 82.21% compared to SVM, its robust classification strength is clearly demonstrated. Its precision for the negative class is 83.12%, which is also a highly precise measurement for negative instances. The positive recall is at an average of 81.74%, meaning that most positive cases are detected. AdaBoost has F1 and F2 scores of 82.42 and 82.01 percent, respectively, which indicates that while AdaBoost does not score extremely well in precision, he most certainly scores high in recall. The rate of false negatives is 18.26%, while the rate of false positives is 17.30%. Both are at relatively lower rates. Marked improvement was categorical and quantifiable by the Matthews correlation coefficient of 64.43%, meaning the classifier performed well overall.
• Maintaining parallel accuracy with XGBoost, which achieved a score of 82.37%, is AdaBoost’s achievement as well. Reaching a high-flying F1 score of 82.52%, he has maintained 82.75% normal precision alongside an 82.30% positive class recall. These high benchmarks have awarded him the explosive F2 score of 82.39%. A strong focus on the proper detection of positive cases reflects this high F2 score, too. Detecting positive instances at an 82.45% sensitivity makes the model efficient. With false negatives at 17.70% and false positives at 17.55%, both rates can be deemed tremendously low. A reasonable correlation between predicted and actual labels suggests with deep confidence that XGBoost is performing incredibly well at 64.74%, bearing the Matthews correlation coefficient.
• ELM scores an accuracy of 80.22%, which is lower than both AdaBoost and XGBoost. The model has a precision of 81.24% for the negative class predictions and a recall of 79.86% for the positives. This yields an F1 score of 80.54%, reflecting an acceptable tradeoff between precision and recall. The estimate for F2 shows an even smaller score at 80.13%, meaning that the model may indeed care elaborately for recall, but most importantly, it cares for precision the most. ELM’s sensitivity of 80.60% indicates a fairly good performance on positive case captures. The false negative rate is at 20.14%, which is higher in comparison to the other models. Hence, more positive values have been missed. The Matthews correlation coefficient is at 60.44%, which indicates a relatively lesser degree of correlation between the predicted values and actual values. Table 2 shows the performance analysis of EfficientNet with different classifiers. Fig. 5 shows the ROC analysis of different classifiers with EfficientNet as the feature extractor.
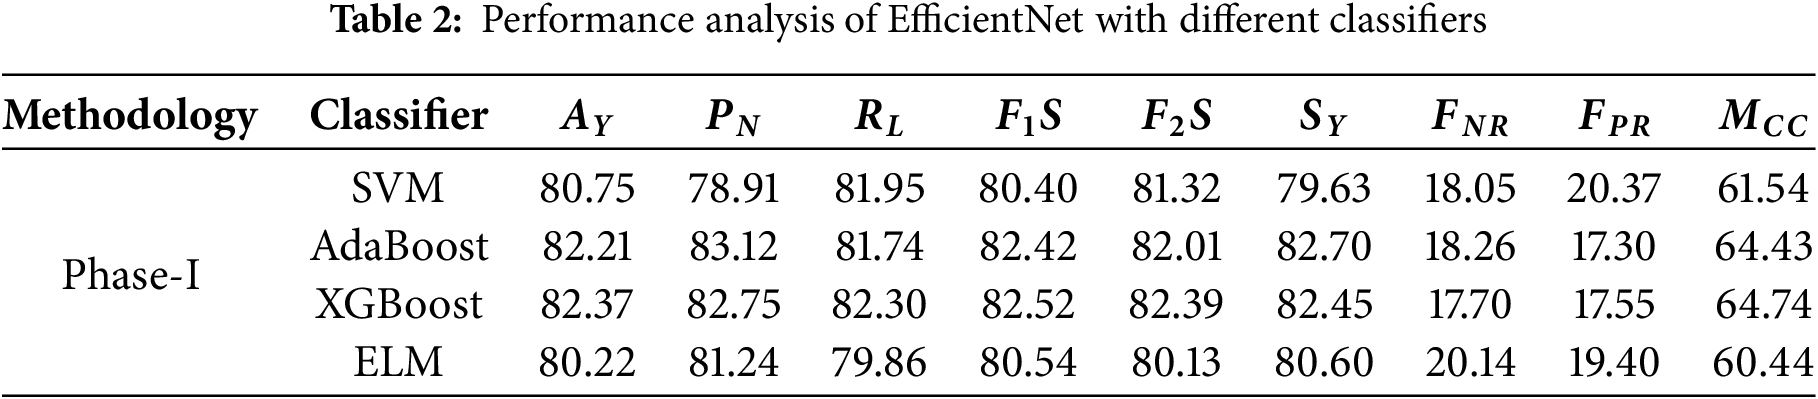
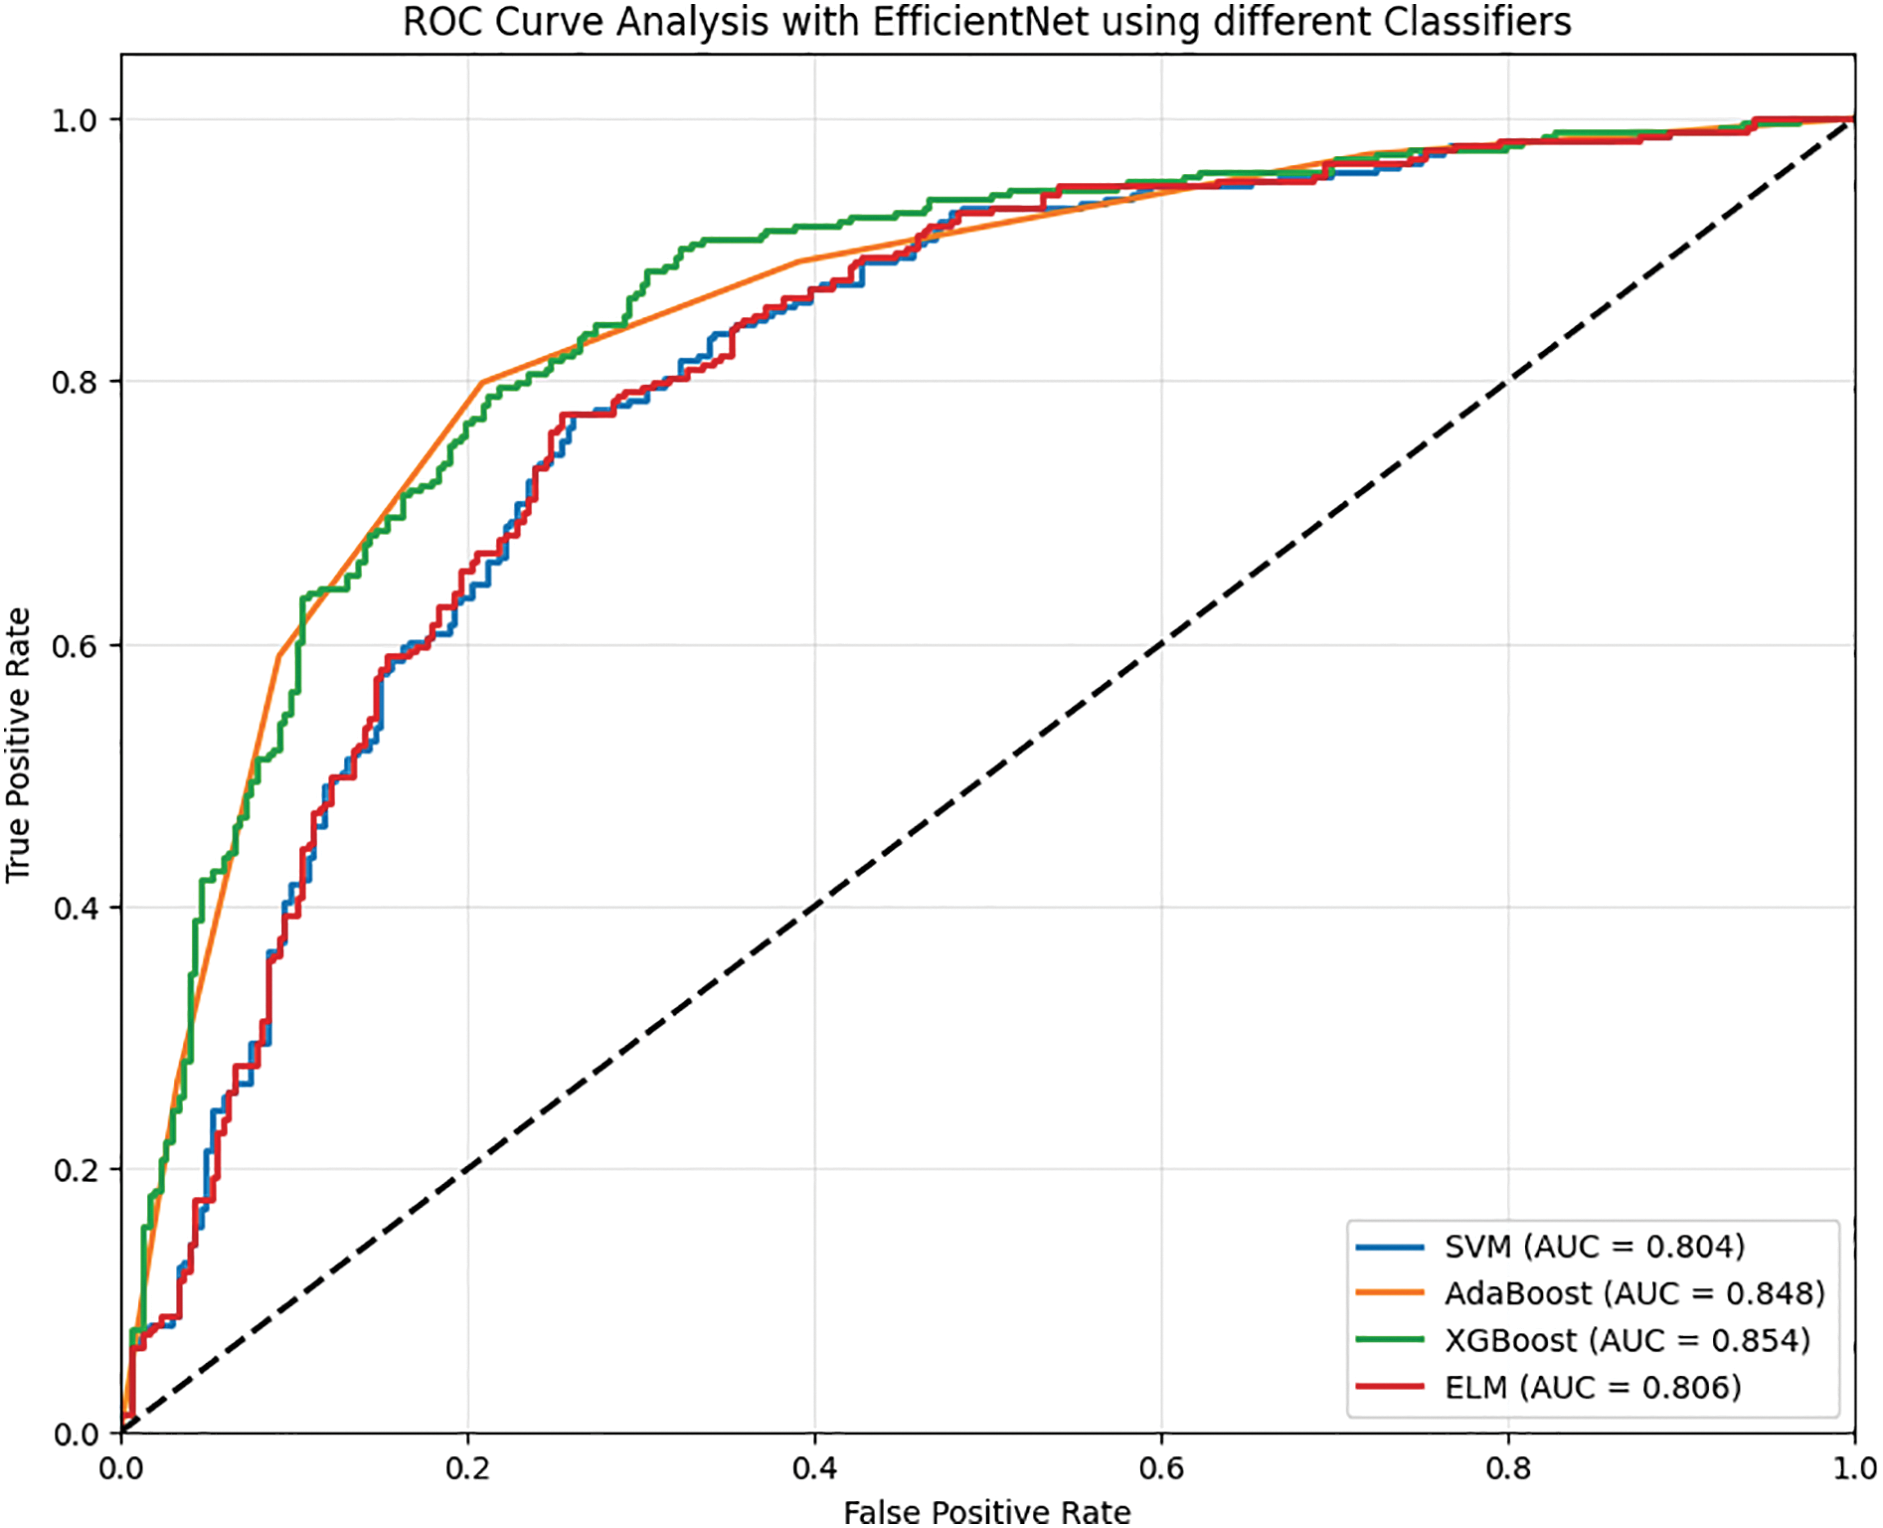
Figure 5: ROC analysis of EfficientNet with different classifiers
• The performance within classification tasks was characterized as dependable for the SVM classifier, achieving an accuracy of 79.81%. This was showcased with a precision of 79.68% for negative cases and a slightly superior 80.41% for recall on positive cases, leading the model to achieve an F1 score of 80.05%, signifying a balance between precision and recall. There is a 19.59% false negative rate for the model, showing moderate amounts of undetected positive cases, with a 20.80% false positive rate, indicating other cases of negative misclassification. The SVM makes predictions with moderate positive associations towards actual outcomes, as shown by its 59.61% Matthews correlation coefficient.
• In contrast to SVM, AdaBoost achieves a lower accuracy, at 79.67%. The model shows a recall of 79.65% for positives and a lower precision of 78.76%, leading to an F1 score of 79.20%. The slightly higher F2 score of 79.47% emphasizes the focus on recall rather than precision. Furthermore, SVM false negative rates of 20.35% and false positive rates of 20.31% are significantly higher. The model was able to make predictions with moderate sufficiency, as displayed with a Matthews correlation coefficient of 59.32%, which is slightly less than the SVM.
• XGBoost outperforms the other models with the utmost accuracy of 80.70%. The classifier displays an impressive precision of 80.92% for negative predictions and a recall of 80.37% for positive ones. The F1 score is 80.64% and indicates a good balance between positive factors and negative ones. The F2 score is more positive and indicates the ability of the XGBoost classifier to predict cases of positive class, confirming its value at 80.48%. With rates of 19.63% false negatives and 18.96% false positives, XGBoost indeed makes fewer errors than the rest. The Matthews correlation coefficient of 61.40% indicates that the classification effectiveness of XGBoost gives better results for the Matthews correlation.
• Coming close to XGBoost is the ELM classifier that does not fall behind in performance and obtains an accuracy score of 80.59%. Negative prediction precision is at 80.51% while recall is at 80.29%, and positive recognition gives results of 80.40% F1 Score, indicating a balance between compromise of precision and recall. The F2 score also goes down to 80.33%, which means there is a shift in focus towards poor recall rates. The increase of 19.71% and 19.12% for false negatives and positives, respectively, means the ELM model is a bit less efficient than the XGBoost. There is a strong alignment between predictions and actual values, making the Matthews correlation coefficient of 61.17% performance near the XGBoost model.
• Table 3 shows the performance analysis of Phase-II. Fig. 6 shows the ROC analysis of different classifiers of Phase-II of the evaluation.
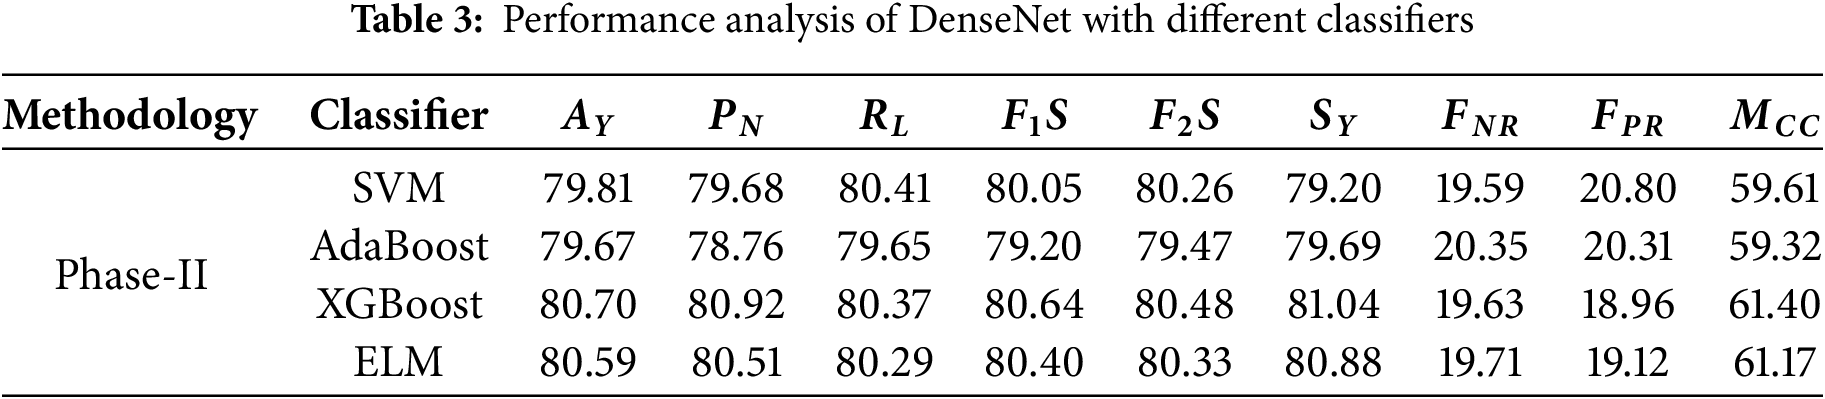
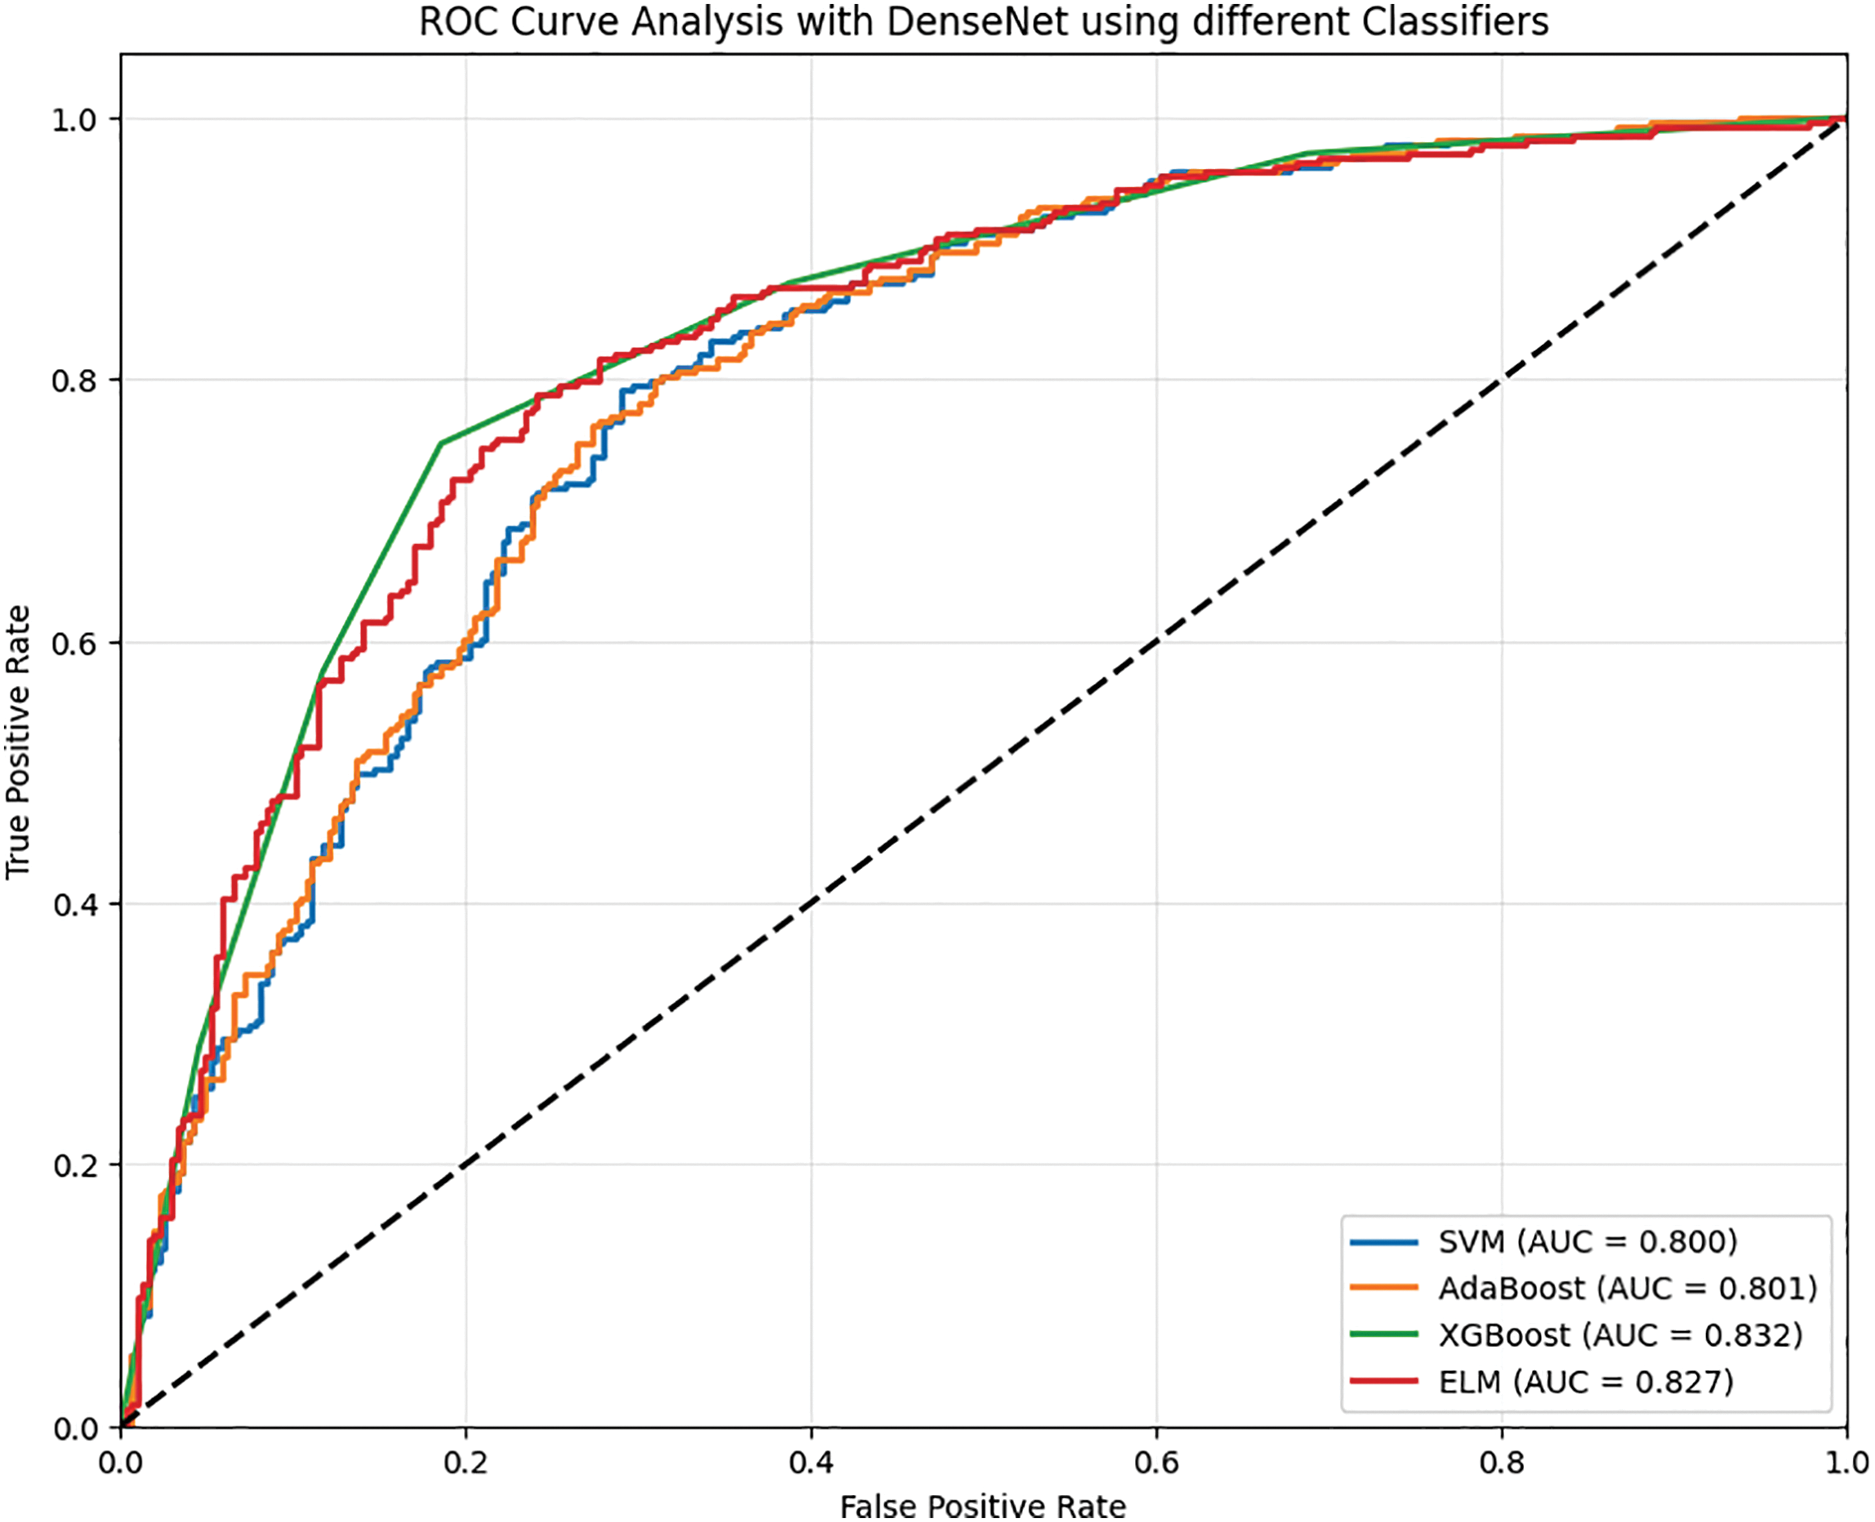
Figure 6: ROC analysis of dense with different classifiers
The performance of various classifiers highlighted in Phase-III is more advanced than that of previous phases. Table 4 shows the performance analysis in Phase-III.
• SVM classifier prediction is confirmed by the accuracy of 84.64%. In negative cases where the model predicts SVM was 85.04 percent precision. Its recall for positive cases is lower at 83.82 percent. Here, indeed, an F1 actuator’s metered effectiveness value is at an accuracy of 84.43. In addition, the determination met the F2 Score value of 84.07, bringing into the measure strengthens the validation. 16.18% false negative rate, and The Matthews Correlation Coefficient, 69.28%, tries to indicate high negative figures the classifier is achieving experience alongside an alarming 14.56% false positive rate.
• AdaBoost classifier training exceeds SVM’s limits with an accuracy of 86.52%. This is an illustration of improvement along the measuring, and so the communication increases. It achieves 87.00% of the predicted negative precision domain and 85.67% of the positive recall proposition. That balance gives way to an F1 result of 86.33 while an F2 rewarding 85.94 explanation due to ensuring his focus on the recall paradigm. This model has lower error rates where false negative is 14.33% and 12.65% for false positive. Further, a Matthews correlation coefficient of 73.04% confirms that it has indeed passed the test.
• XGBoost remains the best-performing classifier with an impressive rate of 12.69% false negatives and 11.88% false positives and accuracy at 87.71%. Furthermore, XGBoost’s strongest attribute is the F2 score, which stands at 87.51%, emphasizing the classifier’s precision and minimization of positive case misses. The Matthews accuracy correlation of 75.42% shows the classifier’s superiority in aligning predicted outcomes alongside actual ones. In contrast, the negative precision and positive recall stand at 88.31% and 87.31%, respectively, with an F1 score of 87.80%.
• ELM scores relatively competitive yet lower with a cumulative score of 72.66%, landing effectiveness slightly behind XGBoost and AdaBoost. Its competing accuracy is measured at 86.31%, making it stand slightly below XGBoost and AdaBoost. The F1 score, 86.27%, is also led by overall negative precision at 87.56% and positive recall at 85.02%. ELM maintains balancing negative approximation and positive recall, as its F2 score is marked at 85.52%. The classifier also records a significantly higher false negative rate than positive, measured at 14.98%, while only having 12.37% false positivity. Fig. 7 shows the ROC analysis of Phase-III evaluation.
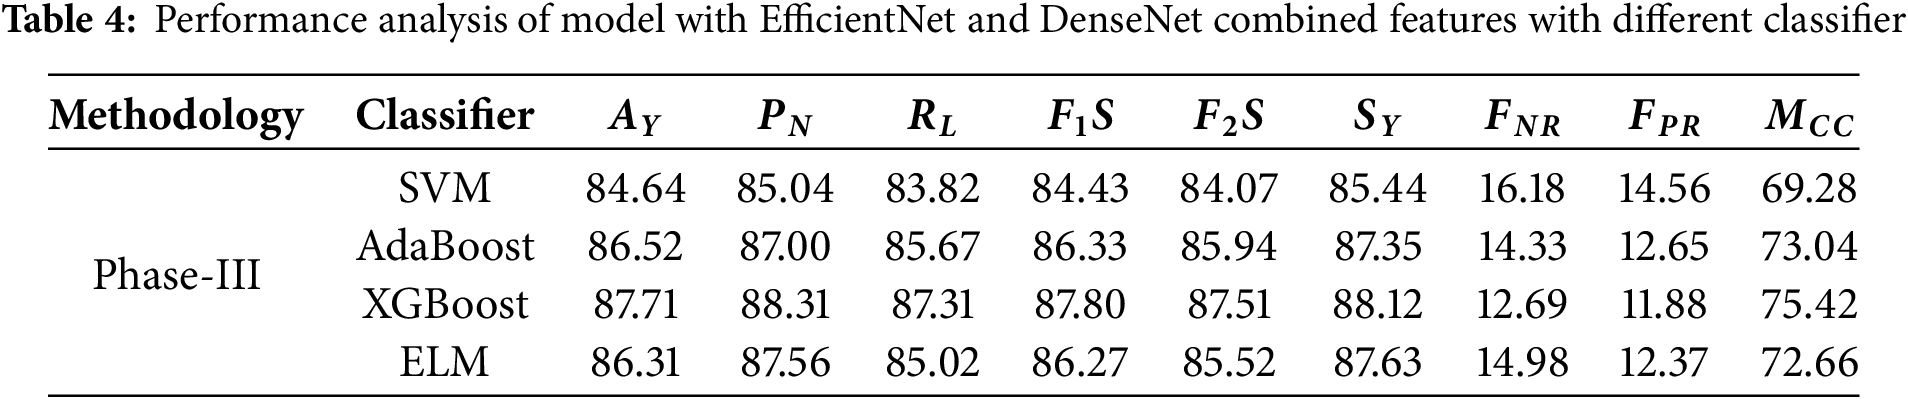
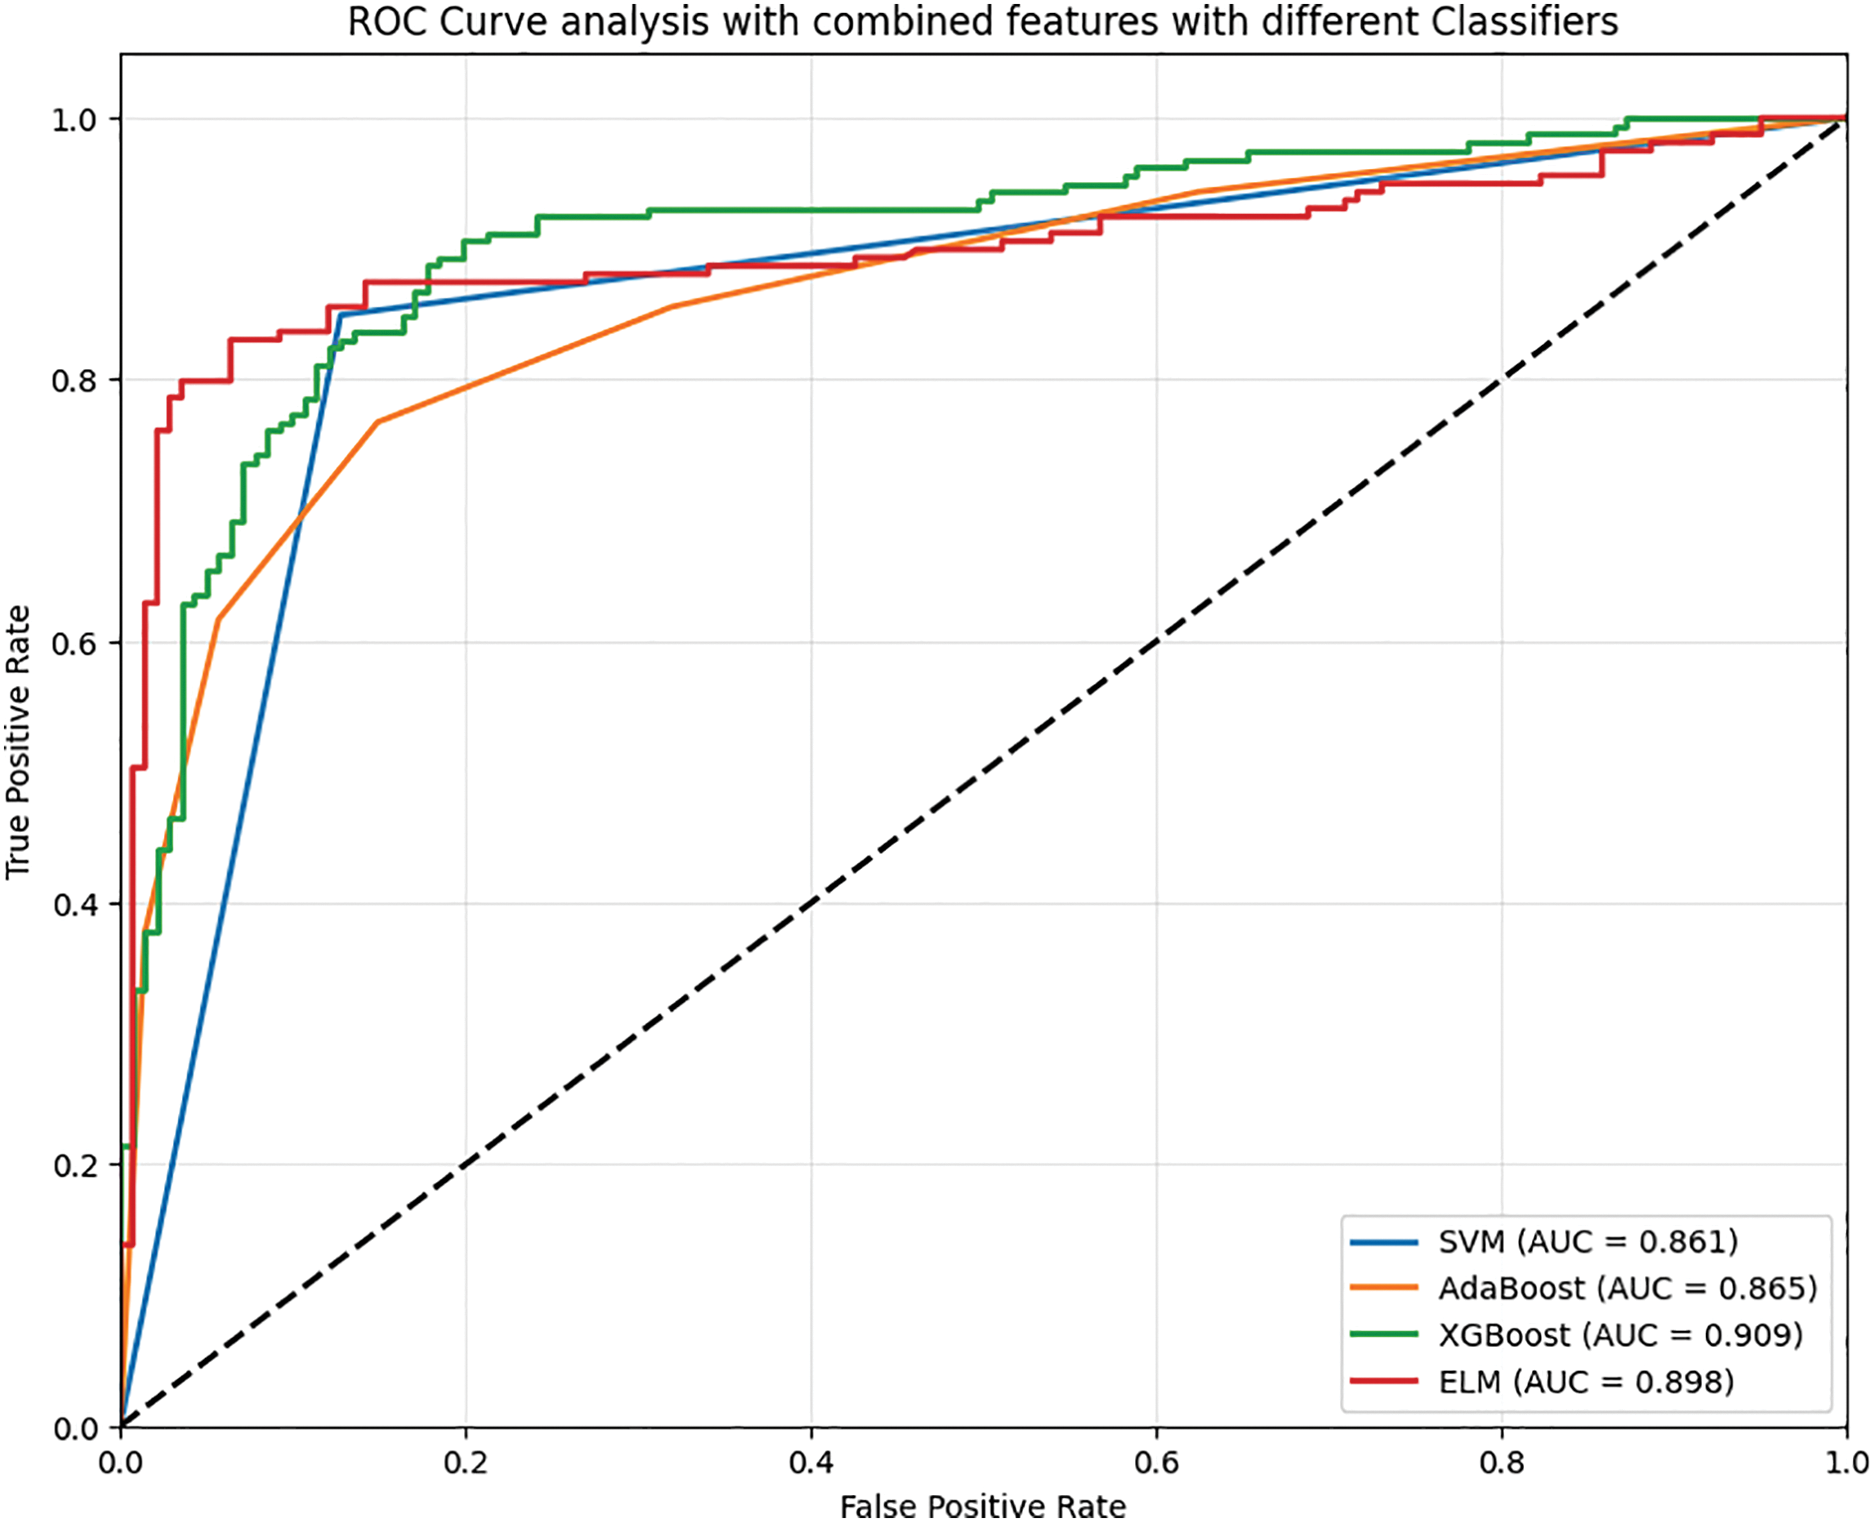
Figure 7: ROC analysis of EfficientNet and DenseNet combined features with different classifiers
Contrary to the previous phases, the results in phase four seem to bolster all classifiers towards better performance on a remarkable scale. Table 5 shows the performance analysis of the proposed model.
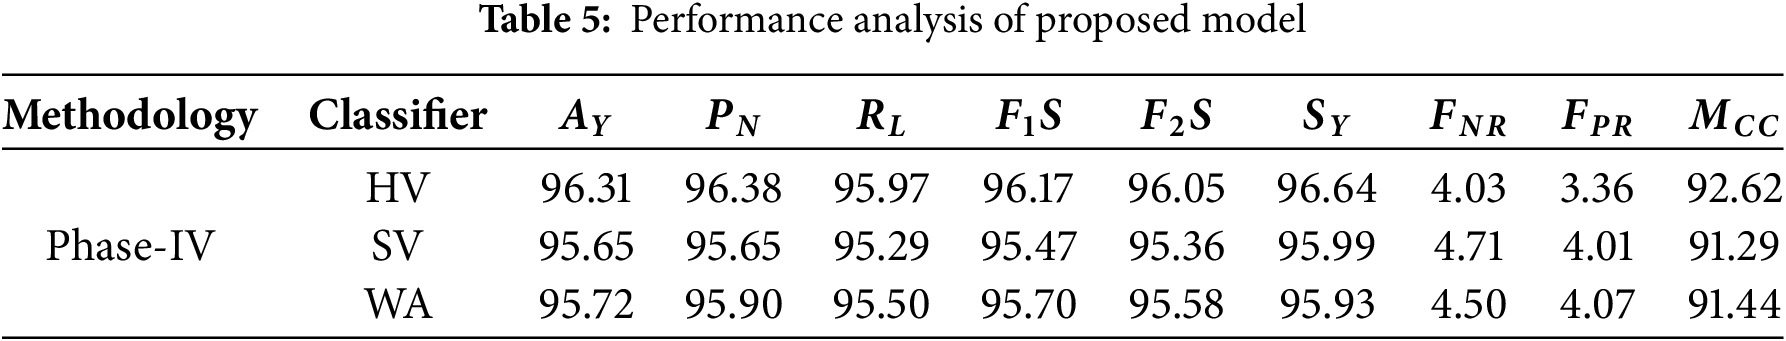
Hard Voting (HV) outperforms all other classifiers with an impressive 96.31% accuracy, which represents a 19.89% improvement over the best Phase-II accuracy (80.70%) and a 9.83% increase over Phase-III’s best performance (87.71%). While maintaining a precision of 96.38% for negative predictions, HV recalls 95.97% of the positive cases. The F1 score of 96.17% and F2 F0.5 score of 96.05% reveal a remarkable balance between precision and recall. A negative 4.03% and 3.36% false rate of WH said have very low levels, and the Matthews correlation coefficient of 92.62% illustrates the remarkable correlation between expectations and results.
Soft Voting (SV) achieved a lesser but still high accuracy score of 95.65%, representing an 18.52% improvement from Phase-II and a 9.08% improvement from Phase-III. CU claimed that with SV, precision, and recall are both expected to average out to the same number. The precision score of 95.65% beats Soft Votes F1 score of 95.47%. The false negative and positive rates of 4.71% and 4.01%, respectively, are not of concern, and Matthews’ correlation coefficient of 91.29% demonstrates a reliable predictor.
• Weighted Averaging (WA) yields highly competitive results with overall accuracy rates of 95.72%. This result is 18.62% better than in Phase-II and 9.12% better than in Phase-III. It also achieved a precision of 95.90% and a recall of 95.50%, leading to F1 and F2 scores of 95.70% and 95.58%, respectively. Now, the Matthews correlation coefficient (91.44%) confirms the high correlation predictive ability of the model. Fig. 8 shows the performance analysis of the proposed model.
• The ROC analysis shows that the HV obtains an AUC value of 0.972, SV shows an AUC value of 0.933, and WA shows an AUC value of 0.969. Fig. 9 shows the ROC analysis of the proposed model.
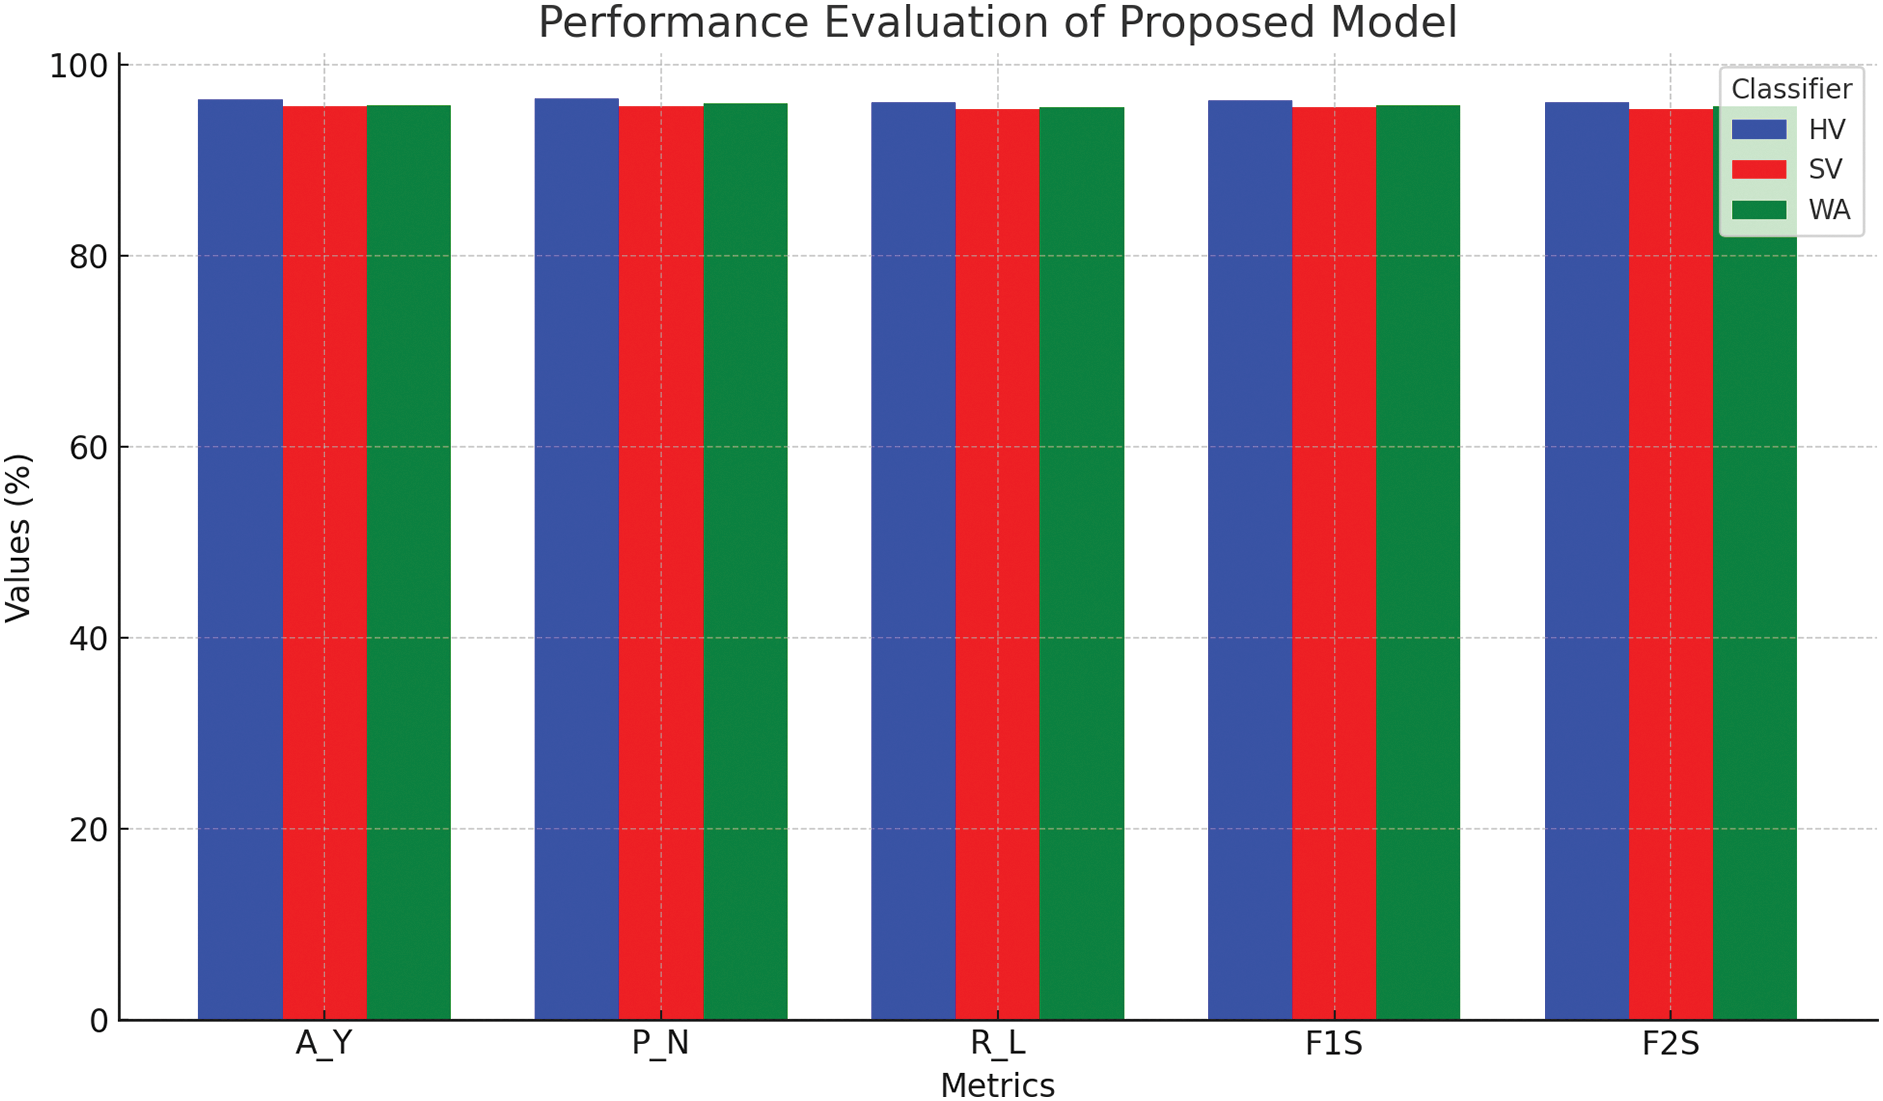
Figure 8: Performance evaluation of proposed model
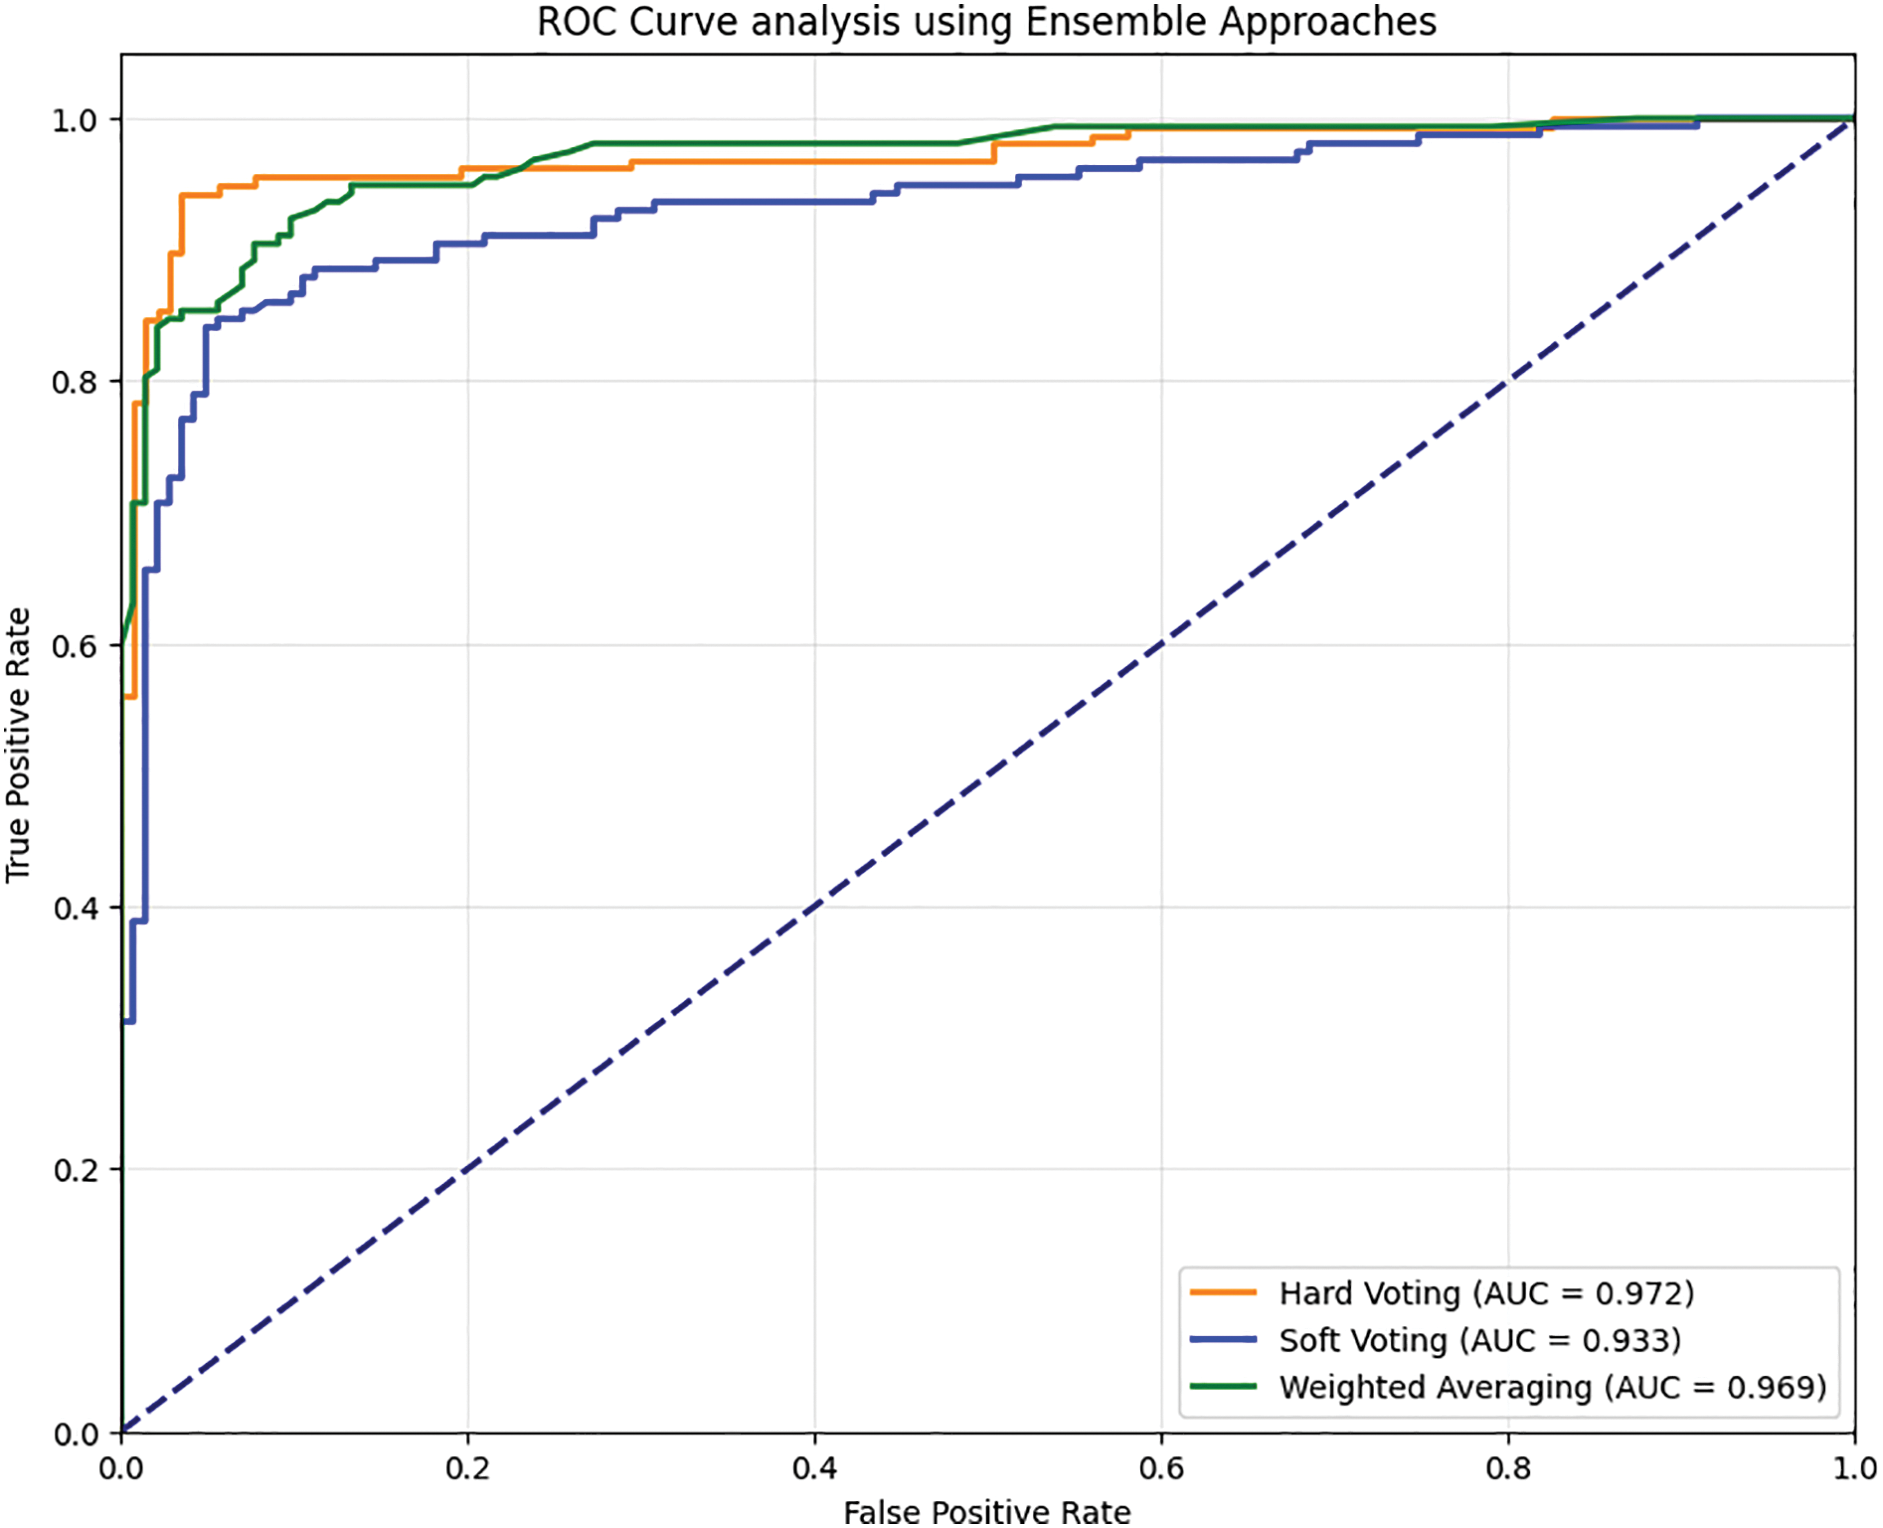
Figure 9: ROC analysis of the proposed ensembled model with the combined feature set
The proposed model has enhanced ECG signal classification accuracy tremendously compared to the existing methods in the literature. In comparison to the developed model, Prabahakararao et al. [20] diagnosed with an accuracy of 88.05%, which is 9.36 lower than the developing model. In a similar fashion, when comparing results with Tao et al. [24], an accuracy of 89.2 was demonstrated, which obliged a 7.97 improvement in the presented approach. Wager et al. [26] reported an accuracy of 75%, whereas the developed model achieved an enhancement of 28.41%, illustrating its robustness and diathesis. When analyzing their results with Ksanna et al. [28], who demonstrated a high accuracy of 93.452% (good result), the Prabakararao model exceeded it by 2.85%. This illustrates the great efficacy of feature extraction and classification optimization. All these affirm the evidence of the framework being far superior when addressing ECG signal variability and, indeed, outperforming the established methods in enhancing cardiovascular disease diagnostics. Fig. 10 shows the comparative analysis of the proposed model with some existing works of literature.

Figure 10: Comparative analysis of the proposed model with existing works of literature [18,22,24,26]
The proposed model aims to provide a DL-based model for effective CVD diagnosis using the PTB-XL ECG dataset. Multiple DTL techniques are applied for feature extraction, which is further optimized with a feature fusion strategy for efficiency and to achieve robust, non-redundant compact feature sets. To improve the separation of the features, scarcer feature sets are employed, tuning the features utilizing the AVOA. This is done to provide improved classification accuracy. The signals, categorized as ECG, are automatically classified with a variety of ML classifiers such as SVM, XGBoost, AdaBoost, and ELM. The best result was shown by the ensemble Hard Voting Classifier, with a 96.31% accuracy concerning the classification of the signals. The use of DL supple with feature optimization techniques within a CVD diagnostic framework overcomes issues like the growing variances of the ECG signals and the increasing number of patients.
The fencing of class imbalance in the PTB-XL dataset using algorithms such as SMOTE can increase the robustness and variability of the methods used to create the framework. A notable limitation stems from the substantial computational resource requirements associated with the integration of deep transfer learning (DTL) models, feature fusion techniques, and optimization algorithms. The adoption of model quantization and pruning strategies offers a viable pathway to enhance computational efficiency while preserving classification accuracy. Additionally, exploring emerging deep learning (DL) architectures holds the potential for further improvements in the efficacy of the classification framework. These features will be covered together with possible future improvements to the current work.
Acknowledgement: The authors want to acknowledge Siksha ‘O’ Anusandhan (Deemed to be University) for providing the environments for conducting the research.
Funding Statement: This Research is funded by Researchers Supporting Project Number (RSPD2025R947), King Saud University, Riyadh, Saudi Arabia.
Author Contributions: Study conception and design: Amrutanshu Panigrahi, Abhilash Pati, Bibhuprasad Sahu; data collection: Amrutanshu Panigrahi, Bibhuprasad Sahu; analysis and interpretation of results: Ashis Kumar Pati, Subrata Chowdhury, Amrutanshu Panigrahi; draft manuscript preparation: Amrutanshu Panigrahi, Abhilash Pati, Khursheed Aurangzeb, Nadeem Javaid, Sheraz Alam. All authors reviewed the results and approved the final version of the manuscript.
Availability of Data and Materials: The data that support the findings of this study are openly available in PhysioNet at https://physionet.org/content/ptb-xl/1.0.1/ (accessed on 10 January 2025).
Ethics Approval: Not applicable.
Conflicts of Interest: The authors declare no conflicts of interest to report regarding the present study.
References
1. Rathy GA, Sivasankar P, Fadhil TZ. An efficient IOT based biomedical health monitoring and diagnosing system using myRIO. TELKOMNIKA Telecommun Comput Electron Control. 2020;18(6):3050–7. doi:10.12928/telkomnika.v18i6.14375. [Google Scholar] [CrossRef]
2. Li C, Bian Y, Zhao Z, Liu Y, Guo Y. Advances in biointegrated wearable and implantable optoelectronic devices for cardiac healthcare. Cyborg Bionic Syst. 2024;5(33):0172. doi:10.34133/cbsystems.0172. [Google Scholar] [PubMed] [CrossRef]
3. Chen Z, Li W, Tang Y, Zhou P, He Q, Deng Z. The neutrophil-lymphocyte ratio predicts all-cause and cardiovascular mortality among United States adults with COPD: results from NHANES 1999–2018. Front Med. 2024;11:1443749. doi:10.3389/fmed.2024.1443749. [Google Scholar] [PubMed] [CrossRef]
4. Zhao Y, Xiong W, Li C, Zhao R, Lu H, Song S, et al. Hypoxia-induced signaling in the cardiovascular system: pathogenesis and therapeutic targets. Signal Transduct Target Ther. 2023;8(1):431. doi:10.1038/s41392-023-01652-9. [Google Scholar] [PubMed] [CrossRef]
5. Bing P, Liu W, Zhai Z, Li J, Guo Z, Xiang Y, et al. A novel approach for denoising electrocardiogram signals to detect cardiovascular diseases using an efficient hybrid scheme. Front Cardiovasc Med. 2024;11:1277123. doi:10.3389/fcvm.2024.1277123. [Google Scholar] [PubMed] [CrossRef]
6. Saikumar K, Ravindra PS, Sravanthi MD, Mehbodniya A, Webber JL, Bostani A. Heart disease prediction using machine learning and deep learning approaches: a systematic survey. Heart Dis. 2025;35(2s):2398. doi:10.52783/pmj.v35.i2s.2398. [Google Scholar] [CrossRef]
7. Ekundayo F, Nyavor H. AI-driven predictive analytics in cardiovascular diseases: integrating big data and machine learning for early diagnosis and risk prediction. Int J Res Publ Rev. 2024;5(12):1240–56. doi:10.55248/gengpi.5.1224.3437. [Google Scholar] [CrossRef]
8. Ribeiro P, Sá J, Paiva D, Rodrigues PM. Cardiovascular diseases diagnosis using an ECG multi-band non-linear machine learning framework analysis. Bioengineering. 2024;11(1):58. doi:10.3390/bioengineering11010058. [Google Scholar] [PubMed] [CrossRef]
9. Zhu J, Liu H, Liu X, Chen C, Shu M. Cardiovascular disease detection based on deep learning and multi-modal data fusion. Biomed Signal Process Control. 2025;99(1):106882. doi:10.1016/j.bspc.2024.106882. [Google Scholar] [CrossRef]
10. Pandey V, Lilhore UK, Walia R. A systematic review on cardiovascular disease detection and classification. Biomed Signal Process Control. 2025;102(9):107329. doi:10.1016/j.bspc.2024.107329. [Google Scholar] [CrossRef]
11. Qiu W, Quan C, Yu Y, Kara E, Qian K, Hu B, et al. Federated abnormal heart sound detection with weak to no labels. Cyborg Bionic Syst. 2024;5(25):0152. doi:10.34133/cbsystems.0152. [Google Scholar] [PubMed] [CrossRef]
12. Pati A, Pattanayak SR, Agrawal UK, Panigrahi A, Parhi M, Pati AK. An ensembled hybrid machine and deep learning approach for heart diseases prediction. In: Proceedings of the 2024 3rd Odisha International Conference on Electrical Power Engineering, Communication and Computing Technology (ODICON); 2024 Nov 8−9; Bhubaneswar, India. doi:10.1109/ODICON62106.2024.10797624. [Google Scholar] [CrossRef]
13. Pati A, Panigrahi A, Parhi M, Panda N, Agrawal UK, Pattanayak SR. Enhancing the heart diseases prediction based on a novel hybrid model. In: Proceedings of the 2023 2nd International Conference on Ambient Intelligence in Health Care (ICAIHC); 2023 Nov 17–18; Bhubaneswar, India. doi:10.1109/ICAIHC59020.2023.10431464. [Google Scholar] [CrossRef]
14. Sadr H, Salari A, Ashoobi MT, Nazari M. Cardiovascular disease diagnosis: a holistic approach using the integration of machine learning and deep learning models. Eur J Med Res. 2024;29(1):455. doi:10.1186/s40001-024-02044-7. [Google Scholar] [PubMed] [CrossRef]
15. Zhao Y, Hu J, Sun X, Yang K, Yang L, Kong L, et al. Loss of m6A demethylase ALKBH5 promotes post-ischemic angiogenesis via post-transcriptional stabilization of WNT5A. Clin Transl Med. 2021;11(5):e402. doi:10.1002/ctm2.402. [Google Scholar] [PubMed] [CrossRef]
16. Fang W, Sun W, Fang W, Zhao S, Wang C. Clinical features, treatment, and outcomes of patients with carfilzomib induced thrombotic microangiopathy. Int Immunopharmacol. 2024;134(7):112178. doi:10.1016/j.intimp.2024.112178. [Google Scholar] [PubMed] [CrossRef]
17. Liu Q, Li C, Yang L, Gong Z, Zhao M, Bovet P, et al. Weight status change during four years and left ventricular hypertrophy in Chinese children. Front Pediatr. 2024;12:1371286. doi:10.3389/fped.2024.1371286. [Google Scholar] [PubMed] [CrossRef]
18. Prabhakararao E, Dandapt S. Multi-label ECG classification using temporal convolutional neural network. arXiv: 2306.03844v1. 2023. [Google Scholar]
19. Bakar WAWA, Josdi NLNB, Man MB, Zuhairi MAB. A review: heart disease prediction in machine learning deep learning. In: Proceedings of the 2023 19th IEEE International Colloquium on Signal Processing & Its Applications (CSPA); 2023 Mar 3–4; Kedah, Malaysia. doi:10.1109/CSPA57446.2023.10087837. [Google Scholar] [CrossRef]
20. Kolhar M, Al Rajeh A. Deep learning hybrid model ECG classification using AlexNet and parallel dual branch fusion network model. Sci Rep. 2024;14(1):26919. doi:10.1038/s41598-024-78028-8. [Google Scholar] [PubMed] [CrossRef]
21. Sheikh D, Verma H, Chauhan N. Reduced lead ECG multi-label classification with higher generalization using 2D SEResnets with self attention. Multimed Tools Appl. 2024;83(24):65315–39. doi:10.1007/s11042-024-18116-z. [Google Scholar] [CrossRef]
22. Tao R, Wang L, Xiong Y, Zeng YR. IM-ECG: an interpretable framework for arrhythmia detection using multi-lead ECG. Expert Syst Appl. 2024;237(8):121497. doi:10.1016/j.eswa.2023.121497. [Google Scholar] [CrossRef]
23. Hossain AI, Sikder S, Das A, Dey A. Applying machine learning classifiers on ECG dataset for predicting heart disease. In: Proceedings of the 2021 International Conference on Automation, Control and Mechatronics for Industry 4.0 (ACMI); 2021 Jul 8–9; Rajshahi, Bangladesh. doi:10.1109/ACMI53878.2021.9528169. [Google Scholar] [CrossRef]
24. Wagner P, Mehari T, Haverkamp W, Strodthoff N. Explaining deep learning for ECG analysis: building blocks for auditing and knowledge discovery. Comput Biol Med. 2024;176(9):108525. doi:10.1016/j.compbiomed.2024.108525. [Google Scholar] [PubMed] [CrossRef]
25. Wen W, Zhang H, Wang Z, Gao X, Wu P, Lin J, et al. Enhanced multi-label cardiology diagnosis with channel-wise recurrent fusion. Comput Biol Med. 2024;171(25):108210. doi:10.1016/j.compbiomed.2024.108210. [Google Scholar] [PubMed] [CrossRef]
26. Khanna A, Selvaraj P, Gupta D, Sheikh TH, Pareek PK, Shankar V. Internet of things and deep learning enabled healthcare disease diagnosis using biomedical electrocardiogram signals. Expert Syst. 2023;40(4):e12864. doi:10.1111/exsy.12864. [Google Scholar] [CrossRef]
27. Duan J, Xiong J, Li Y, Ding W. Deep learning based multimodal biomedical data fusion: an overview and comparative review. Inf Fusion. 2024;112(9):102536. doi:10.1016/j.inffus.2024.102536. [Google Scholar] [CrossRef]
28. Rueda C, Fernández I, Larriba Y, Rodríguez-Collado A, Canedo C. Compelling new electrocardiographic markers for automatic diagnosis. Comput Methods Programs Biomed. 2022;221:106807. doi:10.1016/j.cmpb.2022.106807. [Google Scholar] [PubMed] [CrossRef]
29. Wan J, Yang L, Huo Z, He W, Luo J. Multi-label classification of fundus images with efficientnet. IEEE Access. 2020;8:212499–508. doi:10.1109/ACCESS.2020.3040275. [Google Scholar] [CrossRef]
30. Zhang K, Guo Y, Wang X, Yuan J, Ding Q. Multiple feature reweight densenet for image classification. IEEE Access. 2019;7:9872–80. doi:10.1109/ACCESS.2018.2890127. [Google Scholar] [CrossRef]
31. Abdollahzadeh B, Gharehchopogh FS, Mirjalili S. African vultures optimization algorithm: a new nature-inspired metaheuristic algorithm for global optimization problems. Comput Ind Eng. 2021;158(4):107408. doi:10.1016/j.cie.2021.107408. [Google Scholar] [CrossRef]
32. Sasmal B, Das A, Dhal KG, Saha R. A comprehensive survey on African vulture optimization algorithm. Arch Comput Methods Eng. 2024;31(3):1659–700. doi:10.1007/s11831-023-10034-x. [Google Scholar] [CrossRef]
33. Hussien AG, Gharehchopogh FS, Bouaouda A, Kumar S, Hu G. Recent applications and advances of African vultures optimization algorithm. Artif Intell Rev. 2024;57(12):1–51. doi:10.1007/s10462-024-10981-2. [Google Scholar] [CrossRef]
34. Sahu B, Panigrahi A, Dash B, Sharma PK, Pati A. A hybrid wrapper spider monkey optimization-simulated annealing model for optimal feature selection. Int J Reconfig Embed Syst. 2023;2089(4864):361. doi:10.11591/ijres.v12.i3.pp360-375. [Google Scholar] [CrossRef]
35. Zhang D. Fundamentals of image data mining: analysis, features, classification and retrieval. Berlin/Heidelberg, Germany: Springer; 2021. 363 p. [Google Scholar]
36. Wagner P, Strodthoff N, Bousseljot RD, Kreiseler D, Lunze FI, Samek W, et al. PTB-XL, a large publicly available electrocardiography dataset. Sci Data. 2020;7(1):1–15. doi:10.1038/s41597-020-0495-6. [Google Scholar] [PubMed] [CrossRef]
Cite This Article
 Copyright © 2025 The Author(s). Published by Tech Science Press.
This work is licensed under a Creative Commons Attribution 4.0 International License , which permits unrestricted use, distribution, and reproduction in any medium, provided the original work is properly cited.
 Downloads
 Citation Tools