
 Submit a Paper
 Propose a Special lssue
 Open Access
ARTICLE
Diabetes Prediction Using ADASYN-Based Data Augmentation and CNN-BiGRU Deep Learning Model
1 School of Electronics and Information Engineering, Hebei University of Technology, Tianjin, 300401, China
2 School of Electronics and Communication Engineering, Guangzhou University, Guangzhou, 510006, China
* Corresponding Author: Kewen Xia. Email:
Computers, Materials & Continua 2025, 84(1), 811-826. https://doi.org/10.32604/cmc.2025.063686
Received 21 January 2025; Accepted 13 March 2025; Issue published 09 June 2025
 View Full Text
 Download PDF
Abstract
The rising prevalence of diabetes in modern society underscores the urgent need for precise and efficient diagnostic tools to support early intervention and treatment. However, the inherent limitations of existing datasets, including significant class imbalances and inadequate sample diversity, pose challenges to the accurate prediction and classification of diabetes. Addressing these issues, this study proposes an innovative diabetes prediction framework that integrates a hybrid Convolutional Neural Network-Bidirectional Gated Recurrent Unit (CNN-BiGRU) model for classification with Adaptive Synthetic Sampling (ADASYN) for data augmentation. ADASYN was employed to generate synthetic yet representative data samples, effectively mitigating class imbalance and enhancing the diversity and representativeness of the dataset. This augmentation process is critical for ensuring the robustness and generalizability of the predictive model, particularly in scenarios where minority class samples are underrepresented. The CNN-BiGRU architecture was designed to leverage the complementary strengths of CNN in extracting spatial features and BiGRU in capturing sequential dependencies, making it well-suited for the complex patterns inherent in medical data. The proposed framework demonstrated exceptional performance, achieving a training accuracy of 98.74% and a test accuracy of 97.78% on the augmented dataset. These results validate the efficacy of the integrated approach in addressing the challenges of class imbalance and dataset heterogeneity, while significantly enhancing the diagnostic precision for diabetes prediction. This study provides a scalable and reliable methodology with promising implications for advancing diagnostic accuracy in medical applications, particularly in resource-constrained and data-limited environments.Keywords
Over the past decade, the literature on diabetes has expanded substantially, reflecting the growing recognition of diabetes as a critical public health issue. An initial exploration by highlights the alarming rise in diabetes prevalence, particularly in low- and middle-income countries, attributing this increase to urban migration, unhealthy diets, and the erosion of traditional family support systems. The authors emphasize the urgent need for improved patient self-management and enhanced social support mechanisms to address the growing healthcare burden posed by diabetes. On 7 April 2016, World Health Day, which was devoted to diabetes, the first WHO Global Report on Diabetes was released. Although diabetes is acknowledged as a serious ailment and has been mentioned in ancient texts, doctors and healers do not seem to have met it often. Over the past few decades, the growing number of persons with this ailment has had an increasing impact on human health and development.
Diabetes is a chronic medical disorder marked by high blood glucose levels and abnormal protein and fat metabolism [1]. When the pancreas is unable to create enough insulin or the cells are unable to utilize the insulin that is produced efficiently, blood glucose levels rise because the glucose cannot be digested in the cells [2]. Type 1 diabetes is characterized by the pancreas’s inability to produce insulin [3]; type 2 diabetes is characterized by body cells’ resistance to the action of insulin, which causes the production of insulin to decline over time gradually; and gestational diabetes, which develops during pregnancy and can result in complications during pregnancy and at birth, as well as an increased risk of type 2 diabetes in the mother and obesity in the offspring.
Deep learning is helpful in the research and treatment of diabetes [4] and can analyze complex genetic [5], lifestyle, and medical data, uncover subtle patterns and enhance risk assessment, personalized treatment recommendations, and early diagnosis. Algorithms for deep learning attempt to replicate the way the human brain learns and thinks. One benefit is that deep learning algorithms have several built-in features, such as the ability to extract and select features [6]. Furthermore, it aids in the evaluation of medical pictures, such as retinal scans that reveal diabetic retinopathy, and the extraction of data from textual materials, including electronic health records [7]. Deep learning algorithms look at a variety of traits, such as genetics, lifestyle decisions, and medical history, to generate prediction models [8]. With enough precision, these models can forecast an individual’s chance of developing diabetes, enabling early intervention, tailored treatment plans, and proactive management strategies to lower risks and improve patient outcomes.
The study is conducted to enhance diabetes prediction by leveraging machine learning and ensemble learning techniques [9]. It explores various models, including Logistic Regression, SVM, Naïve Bayes, and Random Forest, alongside advanced ensemble methods such as XGBoost, LightGBM, CatBoost, and Adaboost. The proposed approach aims to improve predictive accuracy and robustness, addressing the challenges of early diagnosis and effective disease management through data-driven methodologies. By using a patient’s past data to forecast future blood glucose levels, the study seeks to address diabetes management. It offers a thorough analysis of current blood glucose level prediction research, classifying studies according to input characteristics, clinical applications, and modeling methodologies, such as physiological, data-driven, and hybrid methods. It also identifies important research issues and potential paths forward, making it a useful tool for creating data-driven models for the management and prediction of diabetes [10].
Another study has been conducted to enhance diabetes prediction by addressing accuracy and data imbalance challenges in existing machine learning models. The research introduces a novel deep learning mechanism, the Convolutional Gated Recurrent Unit (CGRU), which integrates spatial and temporal feature extraction to improve classification efficiency. The proposed framework involves data preparation, model training, and evaluation, utilizing the BRFSS dataset for diabetes prediction. By leveraging clustering algorithms for severity classification, the study demonstrates the superiority of CGRU over conventional models, highlighting its potential for early diabetes detection and improved healthcare outcomes [11].
Moreover, a study has been conducted to explore quantum information processing for diabetes classification using variational quantum classifiers (VQC). The research analyzes the impact of qubit count, feature maps, optimizers, circuit layers, and learnable parameters on VQC performance. A total of 76 VQC variants are evaluated using the PIMA Indian Diabetes Dataset and compared with six classical machine learning models. The study finds that a VQC model with a ZZ feature map, COBYLA optimizer, and six-layer architecture achieves optimal accuracy, outperforming traditional models like SVM, Random Forest, and Decision Tree in diabetes prediction [12]. Continuous glucose monitoring (CGM) has been used in another study to enhance long-term blood glucose prediction for middle-aged and older people. Conventional approaches use patient-reported activities, which are subject to inaccuracy. The study looks into a number of prediction models to handle this, such as Support Vector Machine (SVM), Binary Decision Tree (BDT), Linear Regression (LR), and Artificial Neural Networks (ANN). The outcomes show the potential of CGM-based machine learning models for autonomous and precise glucose level prediction, highlighting the efficacy of BDT and Boosting Regression Tree Ensemble (BRTE) in reaching high classification accuracy [13].
A recent study highlighted the application of the Generalized Boosting Regression classifier, achieving a 90.91% accuracy rate for Type 2 diabetes detection. Using k-fold cross-validation, another study reported that Linear Regression achieved 77% accuracy on the PI dataset [14]. Another research effort, published in July 2021, emphasized advancements in healthcare through IoT and AI. Weighted Voting LRRFs achieved the highest accuracy of 88% using the ELSA dataset [15]. Research conducted in the USA, using data from over 700 healthcare facilities spanning 2007–2020, focused on identifying complications among Type 2 diabetes patients. Algorithms such as XGB and RF were employed, achieving comparable results [16]. Another study, published on 12 January 2023, analyzed data from 9000 adults to explore the association between Type 2 diabetes and complications such as cancer and vascular diseases. The Balanced Focused (BF) model achieved the highest accuracy of 83% [17]. A study conducted in Saudi Arabia employed a cross-sectional approach and a questionnaire to assess diabetes risk factors. Using a Decision Tree classifier, the study achieved an accuracy rate of 82% [2]. This study proposes a diabetes prediction model combining BiGRU with GAN-based data augmentation, enhancing dataset quality and training robustness. The model achieves a validation accuracy of 96.74% and a test accuracy of 97.62%, demonstrating superior performance in diabetes prediction [18].
To outperform earlier models, we have improved the deep-learning model in this study. Because there aren’t enough datasets available, we’ve used Adaptive Synthetic Sampling (ADASYN) to balance the imbalance class of the original dataset by creating artificial samples to improve our prediction model’s training. We enhanced the Bidirectional Gated Recurrent Unit (BiGRU) by adding the Convolutional Neural Networks (CNNs) layer and trained the enhanced model CNN-BiGRU for prediction purposes, concentrating on binary classification for diabetes (0 for negative instances, 1 for positive ones). Comparing our study to previous studies, we have found considerable advances.
1. Imbalanced Diabetes Dataset: Chinese Diabetes Dataset with 18 features composed of Participants in the 1304 samples of individuals who tested positive for diabetes ranging in age from 21 to 99. The class distribution of the original dataset for class 0: 1489 and for class 1: 662. Therefore, the imbalanced classes affect the accuracy of the prediction model. It can cause biased prediction.
2. Prediction Model Problem: Predicting diabetes using machine learning or deep learning techniques still presents significant hurdles. It is essential to make sure the model can correctly categorize invisible data from various demographics. It is difficult to find pertinent characteristics from a big pool, which could have impacted the model’s performance.
2.2.1 Data Augmentation Strategy with Adaptive Synthetic Sampling (ADASYN)
The Adaptive Synthetic Sampling (ADASYN) technique was chosen for data augmentation due to its targeted approach to addressing class imbalance. Unlike SMOTE, which applies uniform oversampling, ADASYN focuses on generating synthetic samples for hard-to-classify minority instances near decision boundaries. This dynamic sampling strategy enhances the model’s ability to classify challenging cases more accurately. Additionally, ADASYN preserves the overall data distribution while ensuring a balanced dataset, which is crucial for improving model robustness and generalizability during training. The mathematical formulation of Adaptive Synthetic Sampling (ADAYSN), see Eq. (1):
where
The Difficulty Coefficient, see Eq. (2):
where for each minority sample
To generate synthetic samples, it linearly interpolates between a minority sample
For each sample
where
Weighted Sampling,
2.2.2 Enhancing Prediction Model Strategy with CNN-BiGRU
CNNs consist of convolutional and pooling layers, where convolutional layers extract nonlinear local features from power load data, and pooling layers compress these features to enhance generalization. This structure improves the model’s ability to capture important information and generalize effectively. Bidirectional Gated Recurrent Units (BiGRU) are an advanced variant of GRUs, designed to process sequential data in both forward and backward directions. They represent significant advancements in Recurrent Neural Networks (RNNs), enhancing their applicability across various domains.
In this research, we developed a hybrid model by integrating Convolutional Neural Network (CNN) and Bidirectional Gated Recurrent Unit (BiGRU) components, referred to as the CNN-BiGRU model. The input data is first processed by the CNN layers, which then extract pertinent spatial characteristics. These features are then combined and reduced to a lower-dimensional representation. The BiGRU layer receives this condensed representation as input and uses its capacity to capture sequential dependencies in both forward and backward directions to enhance the retrieved features. In order to maintain the semantic links between data pieces, the features are normalized and converted into numerical embeddings during preprocessing. These embeddings are then used as input to the CNN-BiGRU architecture, which improves the prediction performance for diabetes categorization by using the CNN component to identify intricate spatial patterns and the BiGRU component to improve the model’s recognition of sequential trends. See Fig. 1 below.
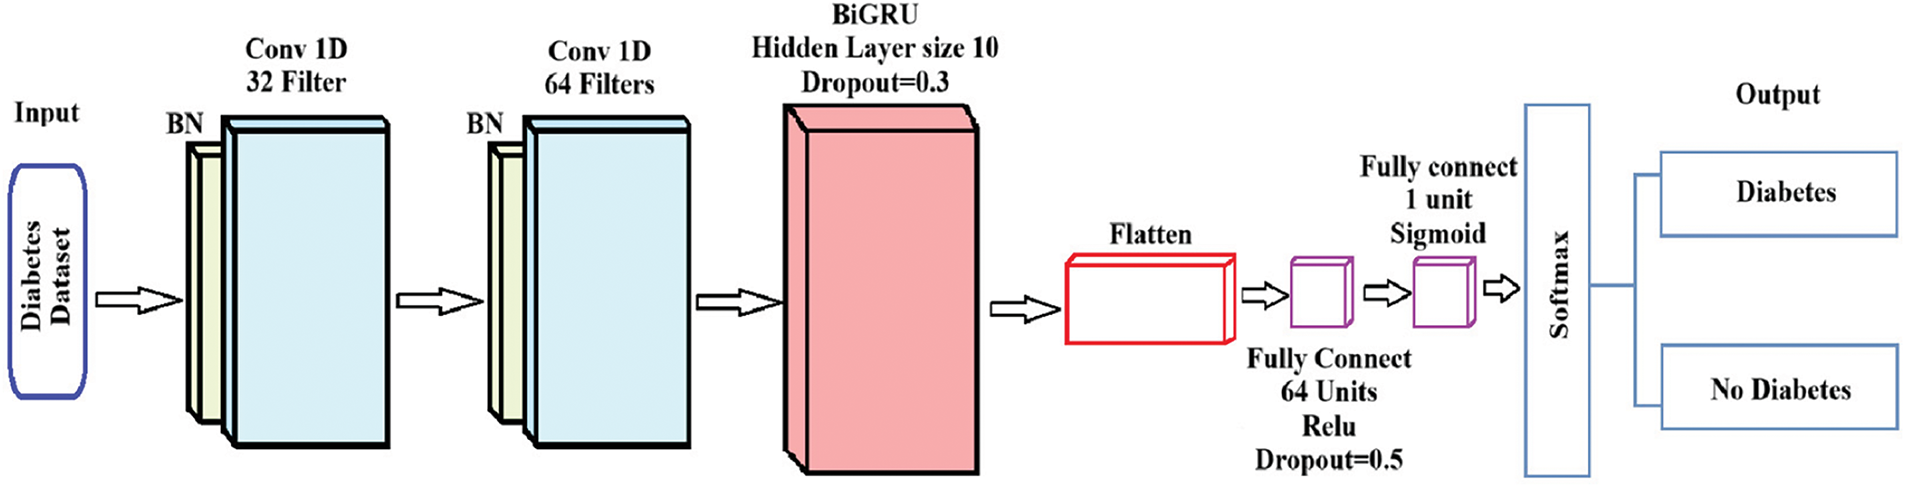
Figure 1: A structure of CNN-BiGRU
Fig. 1 depicts the CNN-BiGRU architecture for diabetes prediction, consisting of sequential convolutional layers, a BiGRU layer for temporal feature extraction, and a fully connected layer with dropout to prevent overfitting. The model outputs a probabilistic classification of “Diabetes” or “No Diabetes” using a sigmoid-activated layer.
Convolutional neural networks (CNN) and bidirectional gated recurrent units (BiGRU) are used in the CNN-BiGRU model to handle the input diabetes dataset for binary classification. Each step’s mathematical formulation is as follows:
(1) Input Layer: Let the input diabetes dataset be represented as a matrix
(2) Convolutional Layers: Two 1D convolutional layers are applied sequentially to extract spatial features from the input. For first Convolutional layer, Input:
where
where
Each convolutional layer output undergoes batch normalization to stabilize training, see Eq. (7):
where
Bidirectional GRU Layer: The output from the convolutional layers,
where
The Bidirectional Output combined hidden state is given as:
where [
(3) Fully Connected Layer: The output from the BiGRU layer is flattened, see Eq. (11):
Then a fully connected layer maps the features to higher-dimensional space, see Eq. (12):
where
Then in the last fully connected layer outputs a single unit, see Eq. (14):
where
(4) Output Layer: The sigmoid activation outputs a probability
For multiclass extensions, a Softmax activation could replace the sigmoid function, see Eq. (16):
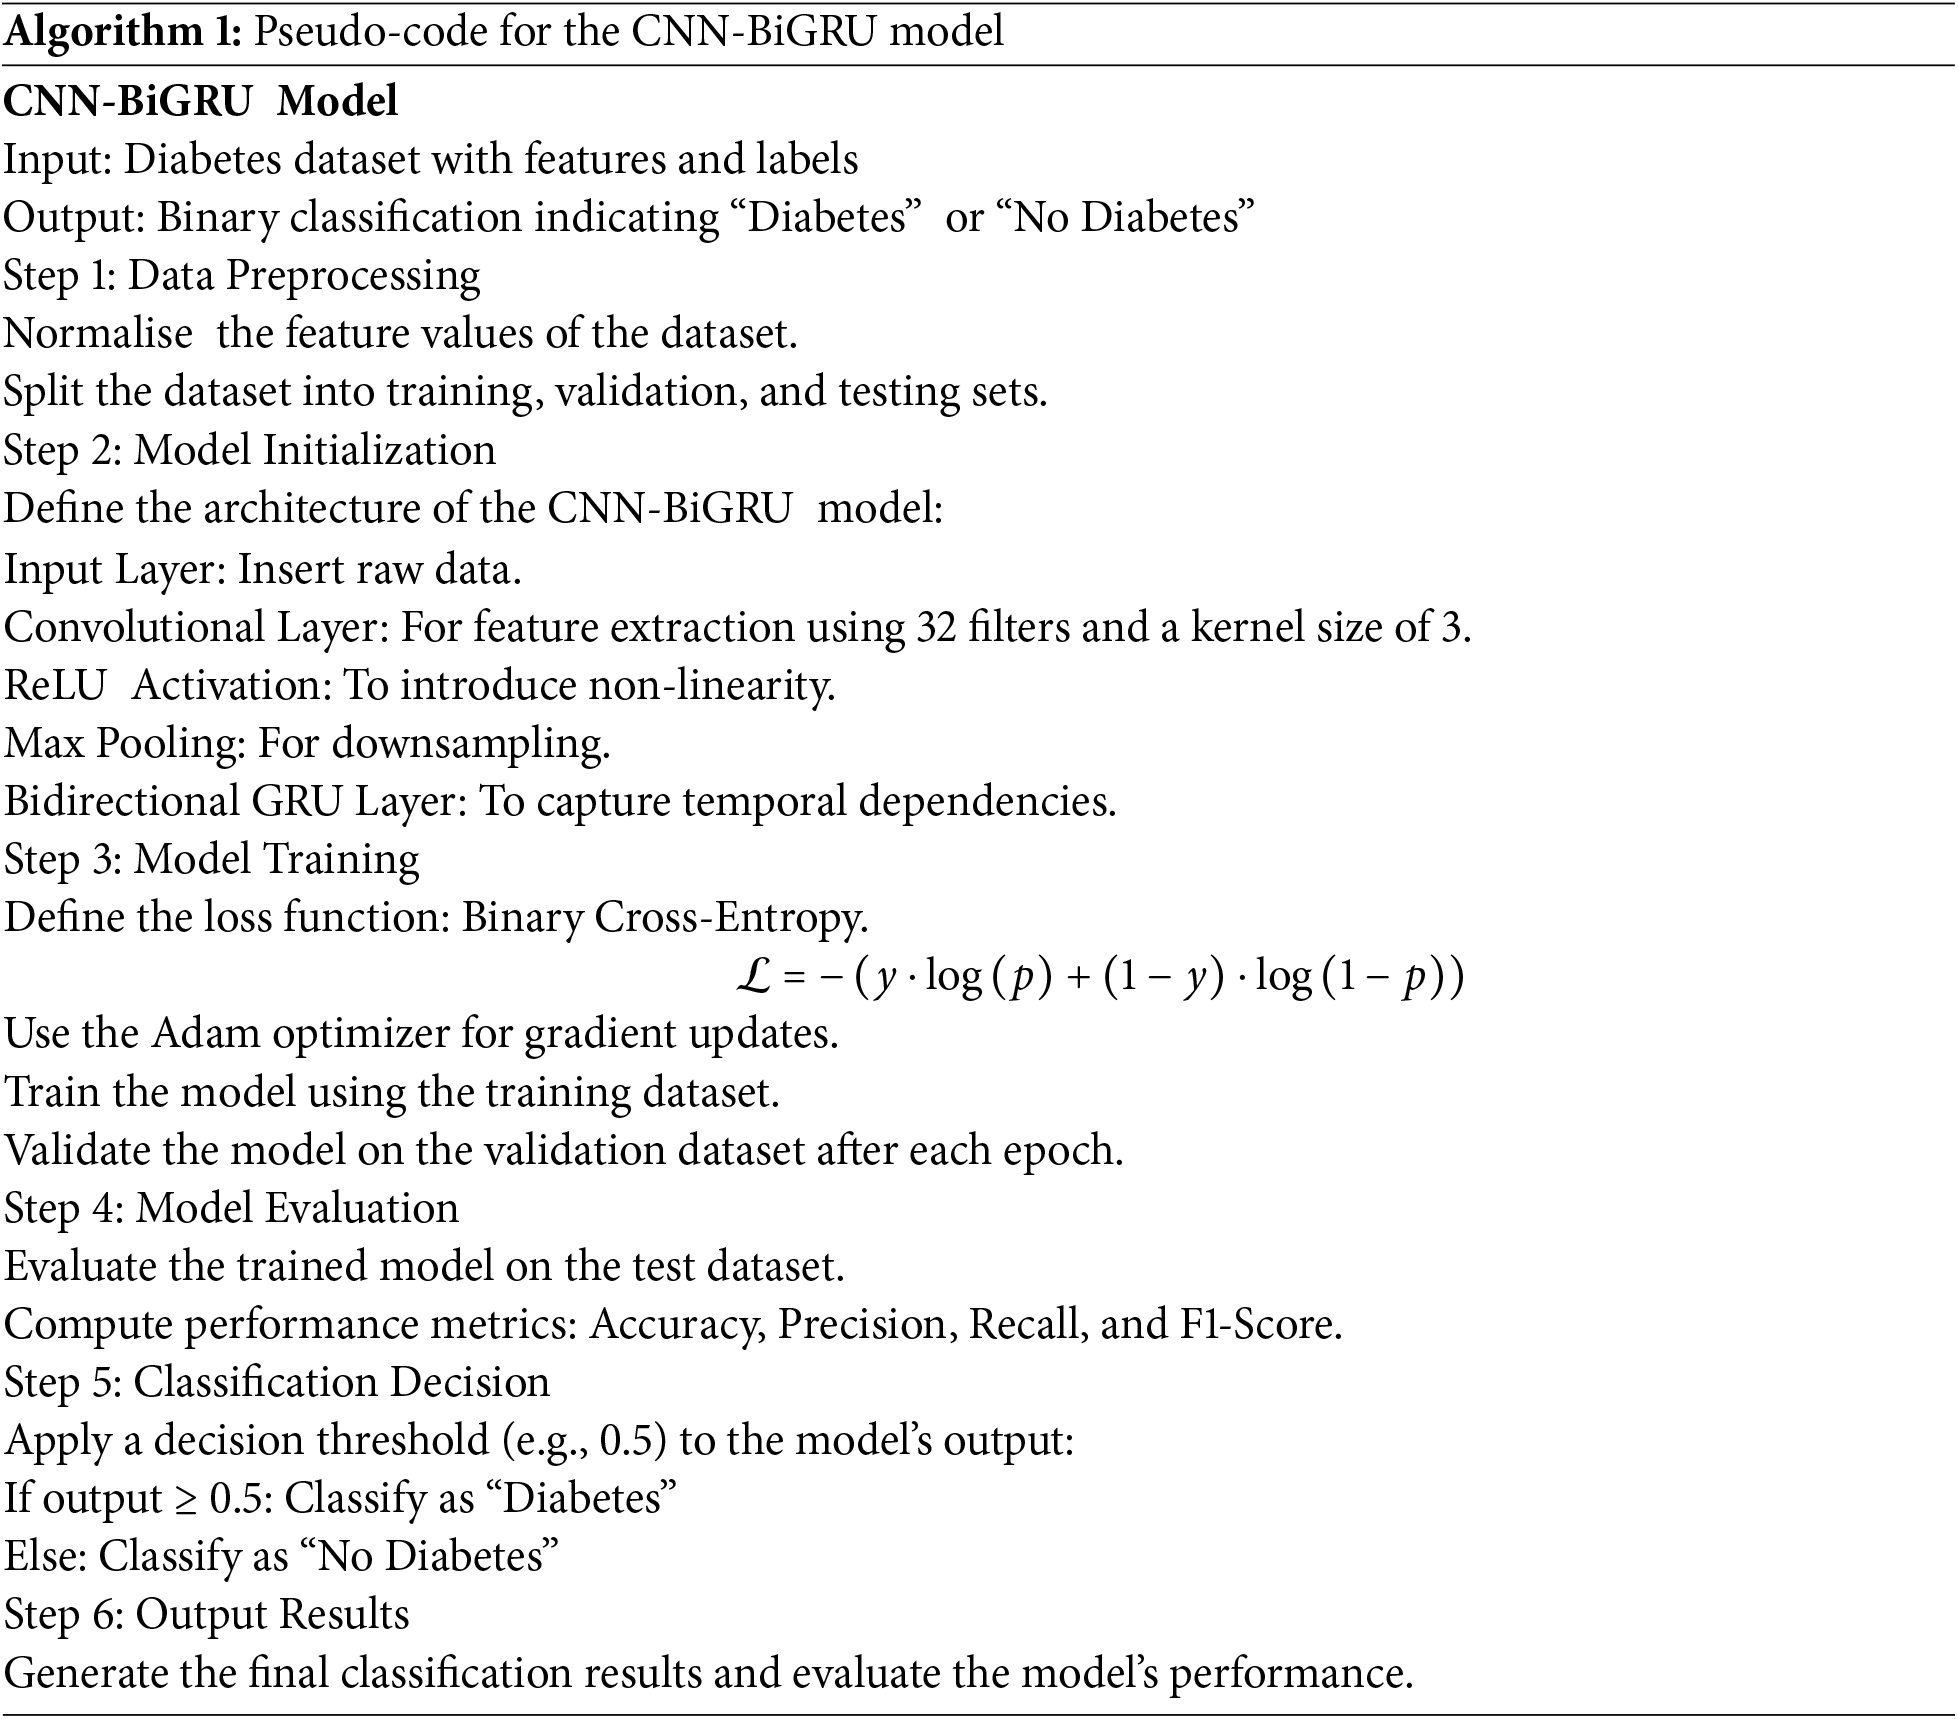
High prediction accuracy for diabetes classification is achieved by this architecture’s efficient combination of CNN’s spatial feature extraction, BiGRU’s temporal dependencies, and fully linked layers’ resilient classification. The pseudocode for the CNN-BiGRU implementation is provided for further reference, see Algorithm 1.
3 Experiments and Result Analysis
3.1 Experimental Data Set Description
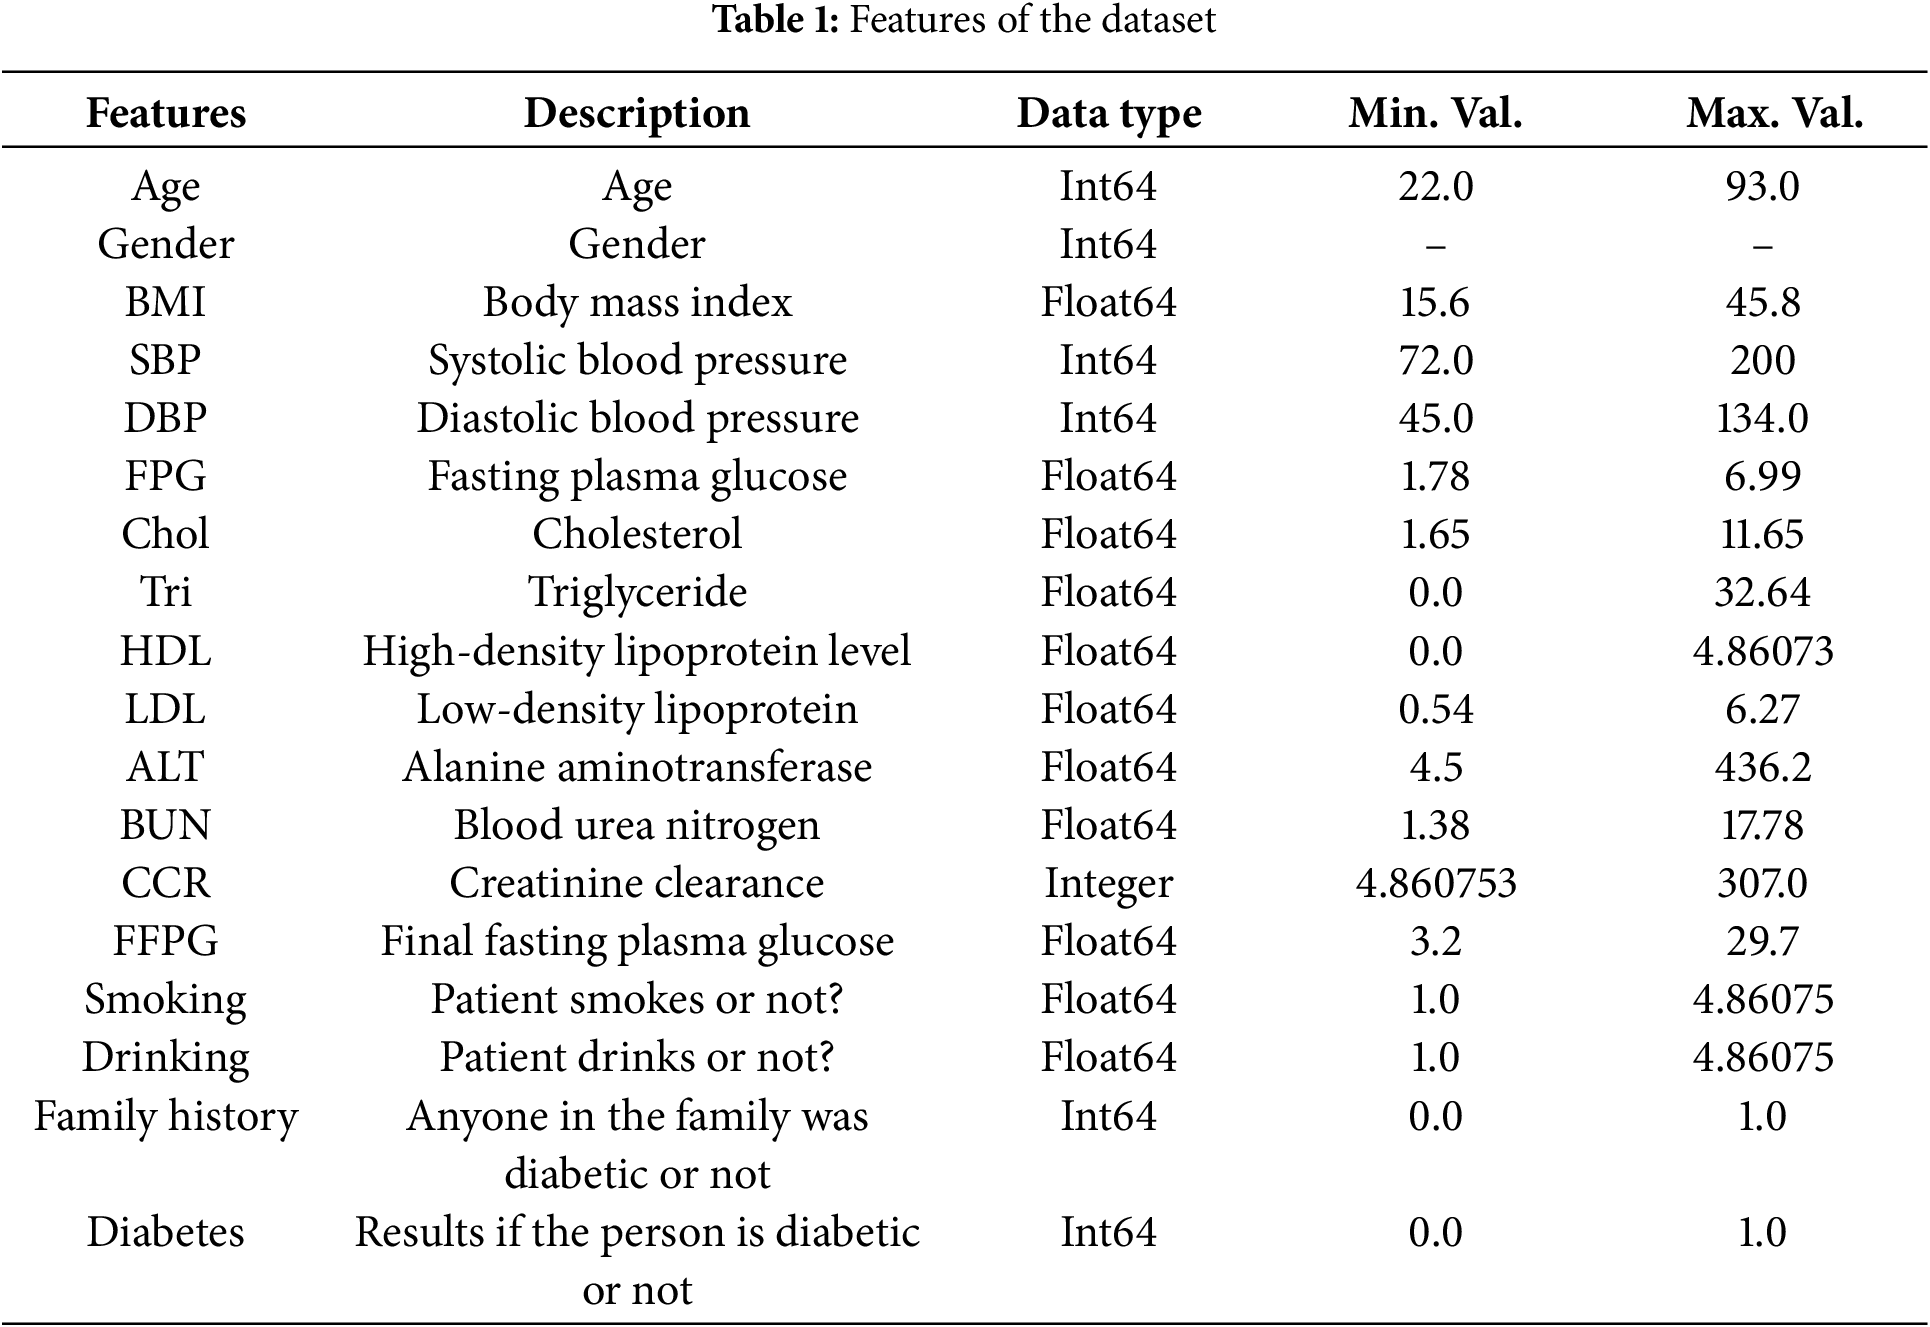
All the work in this research is based on the publicly available “Diabetes_Dataset_With_18_Features” (https://www.kaggle.com/datasets/pkdarabi/diabetes-dataset-with-18-features (accessed on 1 January 2025)). The dataset originates from a Chinese research study conducted in 2016 and comprises 1304 samples of individuals diagnosed with diabetes. The participants’ ages range from 21 to 99 years. Collected in adherence to the indicators and standards established by the World Health Organization (WHO), this dataset serves as a reliable foundation for developing models aimed at diagnosing diabetes. It provides valuable data for researchers and healthcare professionals to train and evaluate machine learning models for diabetes prediction and diagnosis. Table 1 shows the details of all the features in the Chinese Diabetes Dataset.
This study implemented the experimental environment using Python and Google Colab, utilizing libraries such as NumPy, PyTorch, and ADASYN for data processing, augmentation, and model training. The model, a hybrid CNN-BiGRU architecture, was trained with GPU acceleration, and k-fold cross-validation, and evaluated using metrics like accuracy, precision, and recall.
3.3 Deep Learning Network Structure and Parameter Settings
This study’s deep learning model is a hybrid CNN-BiGRU architecture, which combines bidirectional gated recurrent units (BiGRU) with convolutional neural networks (CNNs). Two convolutional layers make up the CNN component. The first layer employs 32 filters with a kernel size of 3 and padding, while the second layer utilizes 64 filters. The kernel size was optimized through hyperparameter tuning, where multiple values (3, 5, and 7) were tested. A kernel size of 3 was selected based on its superior performance in validation accuracy and its ability to effectively capture local dependencies. The incoming data is transformed into a 1D sequence format for further processing, and these layers seek to extract spatial information from it. In order for the model to comprehend both past and future contextual information, the output of the second convolutional layer is sent through a bidirectional GRU layer, which extracts temporal relationships from the sequence data. The sequence may be processed in both ways thanks to the bidirectional nature of the 128 units that make up the GRU layer. After passing through fully connected layers, the output from the GRU layer is transmitted via a sigmoid activation function for binary classification as the last layer.
With a learning rate of 0.001 and L2 regularization (weight decay set to 1 × 10⁻⁴) to avoid overfitting, the model was trained using the Adam optimizer. Because the task is binary classification (predicting diabetes or not), binary cross-entropy (BCELoss) was the loss function utilized for training. The training was carried out using a batch size of 64 across 100 epochs. In order to avoid needless computation and overfitting, early stopping was included with a 20-epoch patience to terminate training when validation loss no longer improves. K-fold cross-validation (5 folds) was used to assess the model’s generalizability and make sure that its performance is consistent across various training data subsets. Accuracy was used to test the model, and each fold’s findings were kept. To further reduce overfitting, dropout (set to 0.5) was used after the completely linked layers.
3.4 Analysis of Experimental Results
The Chinese Diabetes dataset comprises 18 features. To address this issue of class imbalance, the ADASYN algorithm was employed to balance the dataset. Following data preprocessing, the ADASYN algorithm was applied to the training subset of the dataset to generate synthetic samples for the minority class, effectively mitigating the class imbalance and enhancing the dataset’s suitability for model training. The result of the ADASYN, the class distribution can be seen in Fig. 2.
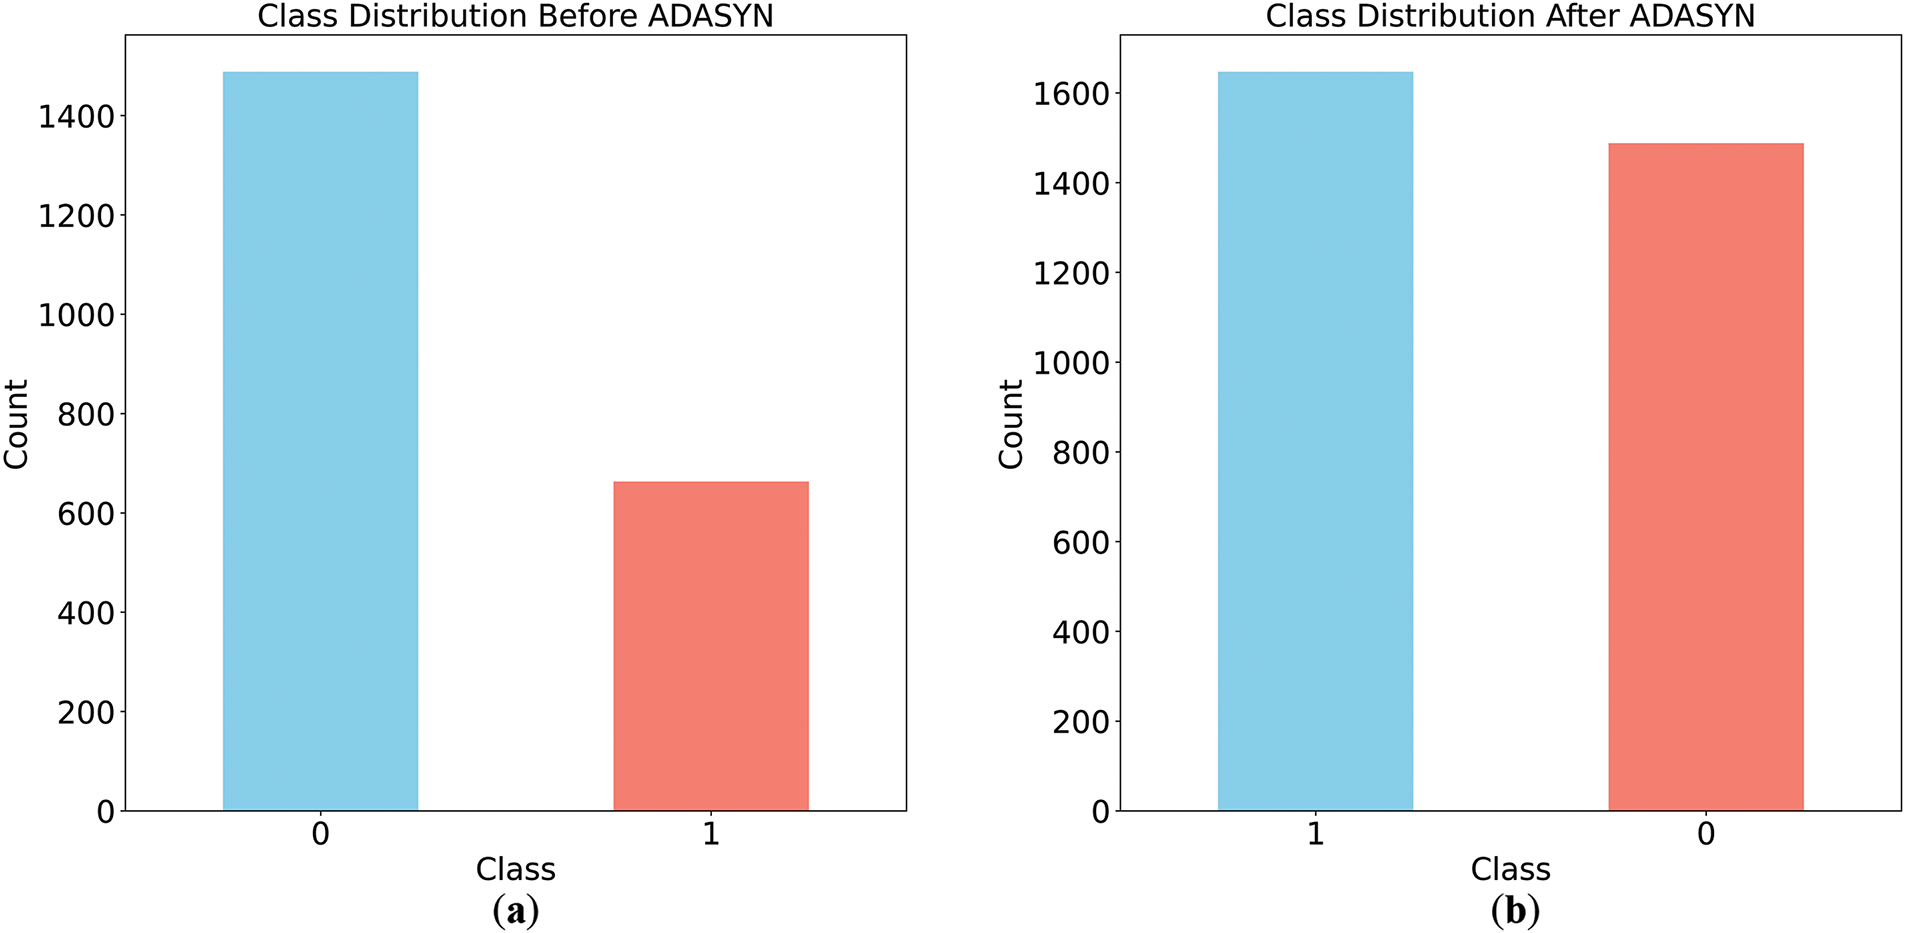
Figure 2: Class Distribution before and after applying ADASYN. (a) class distribution before applying ADASYN; (b) class distribution after applying ADASYN
Fig. 2a depicts the dataset’s initial class imbalance, with the majority class (label 0) containing approximately 1400 samples and the minority class (label 1) having fewer than 800 samples. After applying Adaptive Synthetic Sampling (ADASYN), Fig. 2b shows a balanced class distribution, with the minority class matching the majority. This demonstrates ADASYN’s effectiveness in addressing class imbalance, a critical step for mitigating biased predictions and enhancing machine learning model performance.
To show the effectiveness of the ADASYN data augmentation technique the Correlation Matrix of the Original and Augmented dataset with all 18 features because they all contribute meaningful information that is required for diabetes prediction, is given in Fig. 3. The correlation coefficients are calculated using Pearson’s correlation equation, which evaluates the linear relationship between two variables, as in Eq. (17):
where
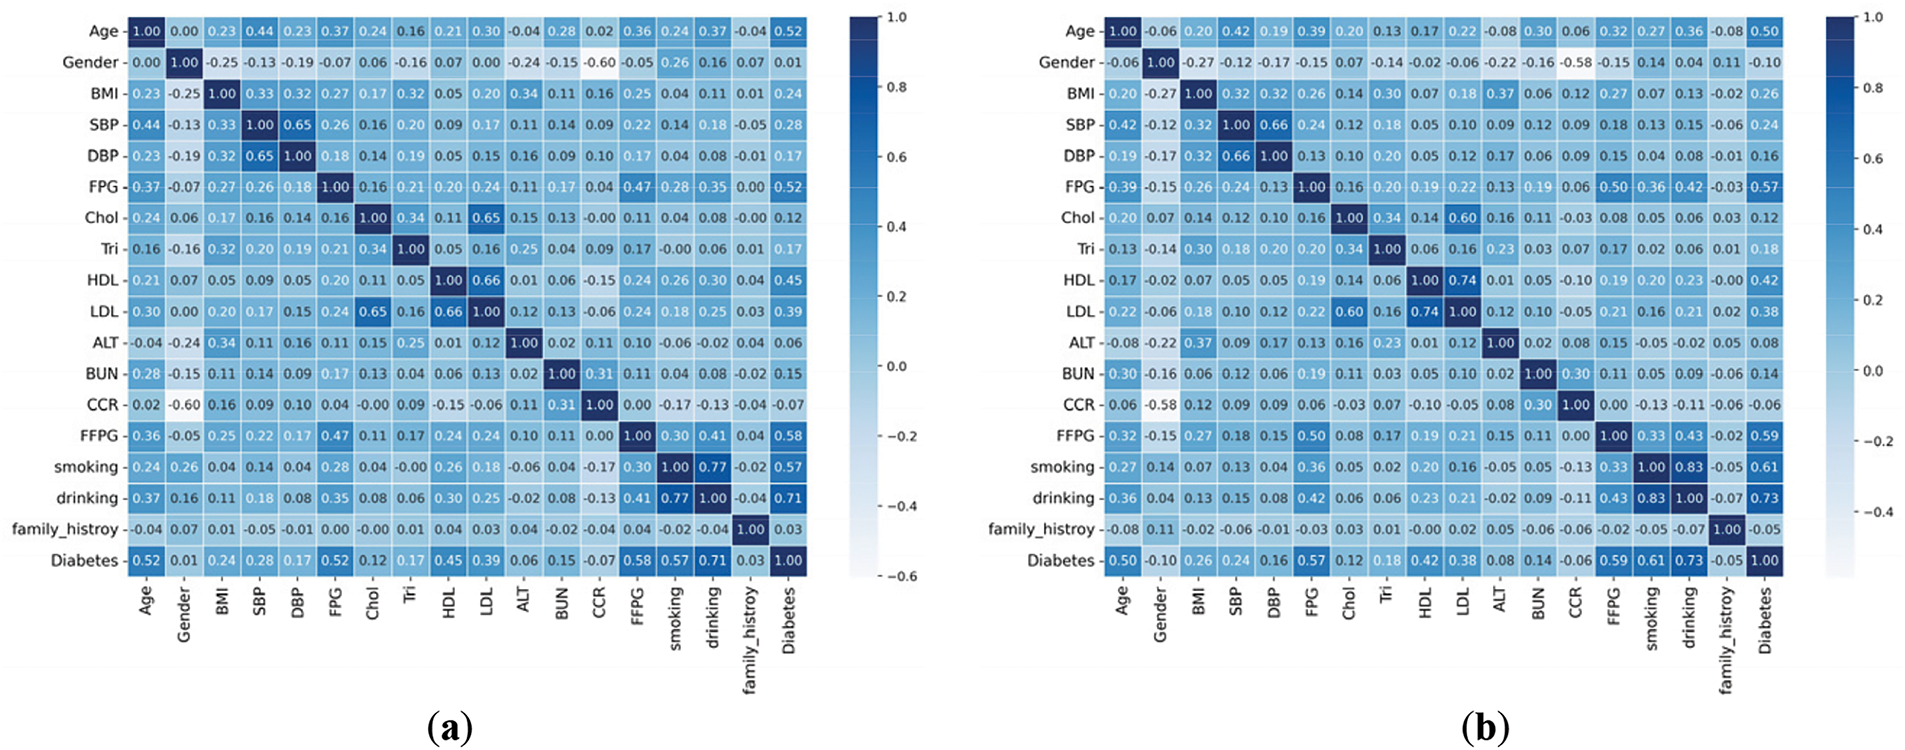
Figure 3: Features correlation matrix of original and augmented dataset. (a) correlation matrix of original dataset; (b) correlation matrix of augmented dataset
Fig. 3a shows the confusion matrix’s correlation with original dataset features and Fig. 3b shows the confusion matrix’s correlation of Augmented dataset. It concurrently calculates the output result for outlier rejection values and fills in missing data. Using a box plot to summarize statistical data, the +e correlation attribute with the target variable shows that the correlation coefficient has significantly improved.
The enhanced CNN-BiGRU model was trained using the augmented training set, validated using k-fold cross-validation, and tested on unseen data for binary classification of classes “0” (negative) and “1” (positive). Fluctuations in accuracy were observed during cross-validation, with an average training accuracy of 98.74%. We chose all 18 features of the original dataset as input for the CNN-BiGRU model because they all contribute meaningful clinical, biochemical, and lifestyle-related information that is required for diabetes prediction. The final evaluation of the test dataset ensured the model’s generalizability and helped assess overfitting, a critical consideration in health sciences for reliable performance on new data.
To understand the behavior of the model by showing the number of correct and incorrect predictions for each class we visualized the confusion matrix, shown in Fig. 4. The confusion matrix is a foundational tool for calculating various evaluation metrics such as: Accuracy, Precision, Recall and F1-score. The structure of the confusion matrix is given in Table 2.
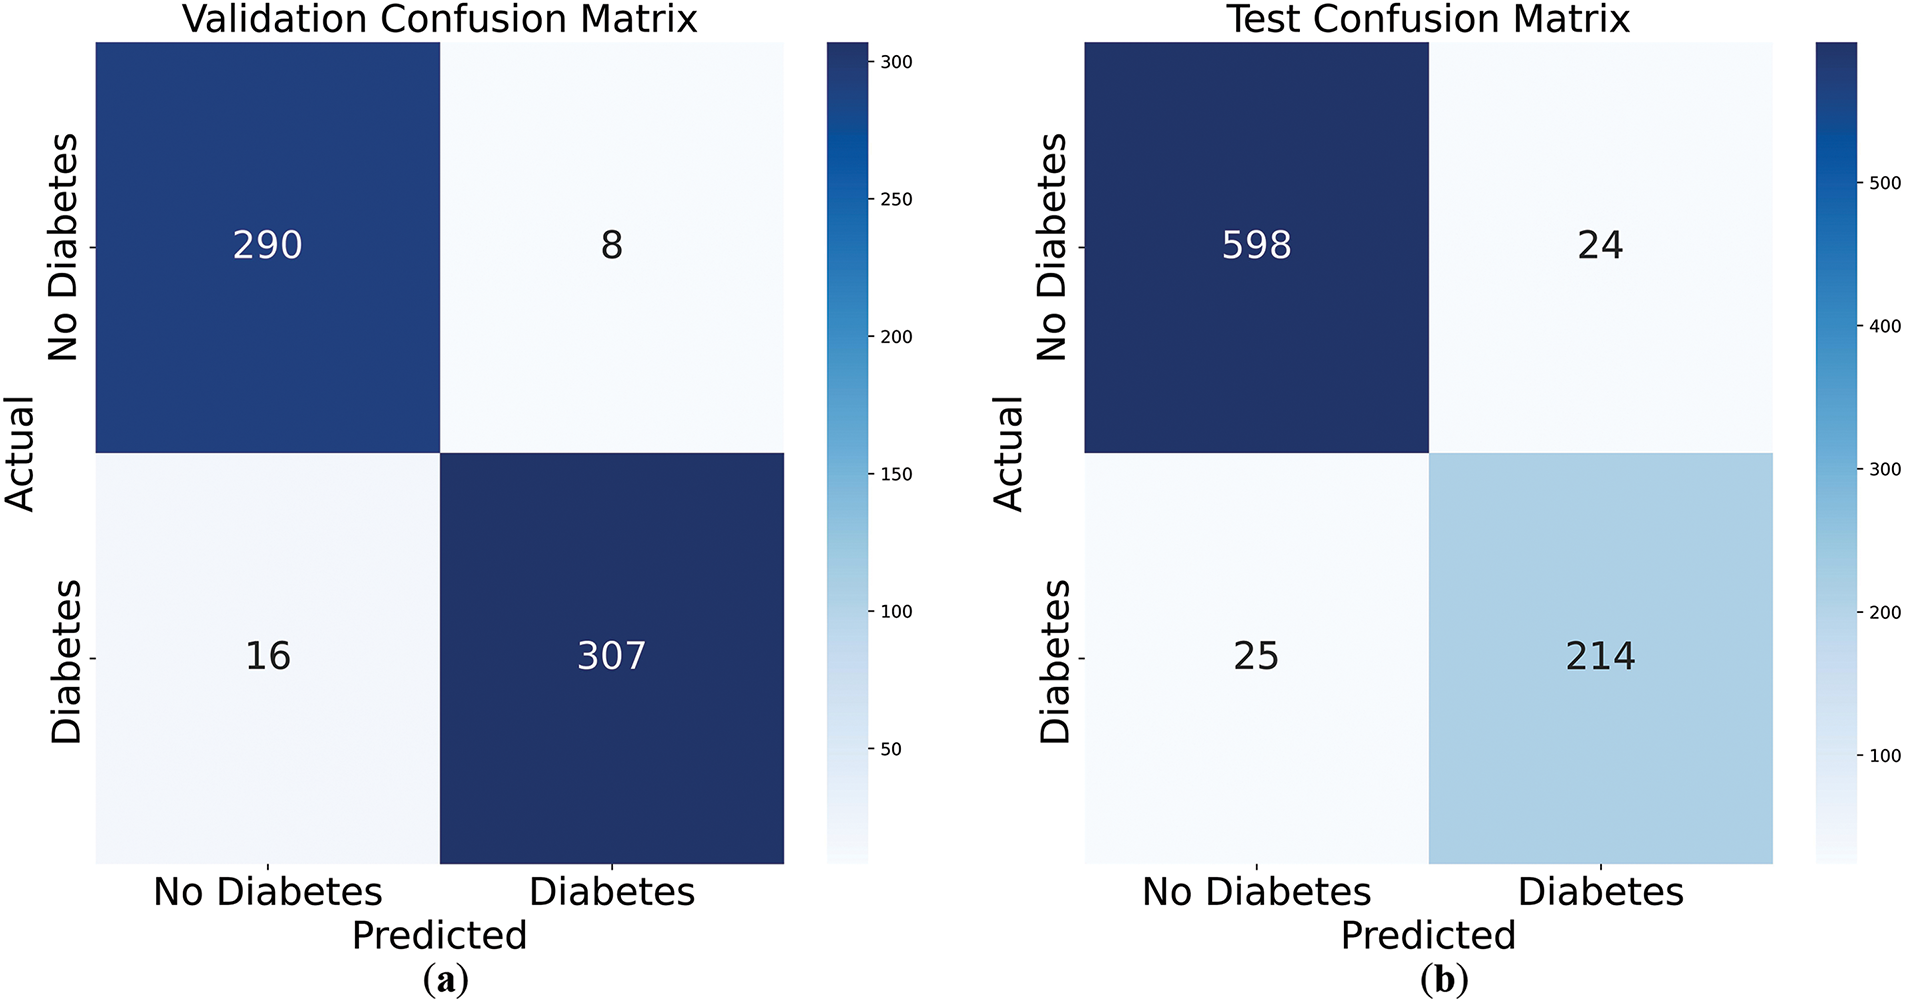
Figure 4: Confusion matrices of validation and test set. (a) validation confusion matrix; (b) test confusion matrix
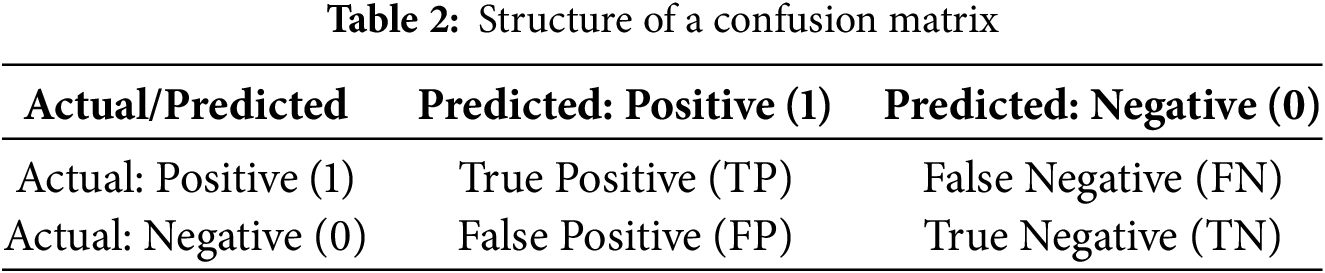
In Table 3, the definitions of the terms are following:
(1) True Positive (TP): The model correctly predicted the positive class.
(2) False Positive (FP): The model incorrectly predicted the positive class (Type I error).
(3) True Negative (TN): The model correctly predicted the negative class.
(4) False Negative (FN): The model incorrectly predicted the negative class (Type II error).
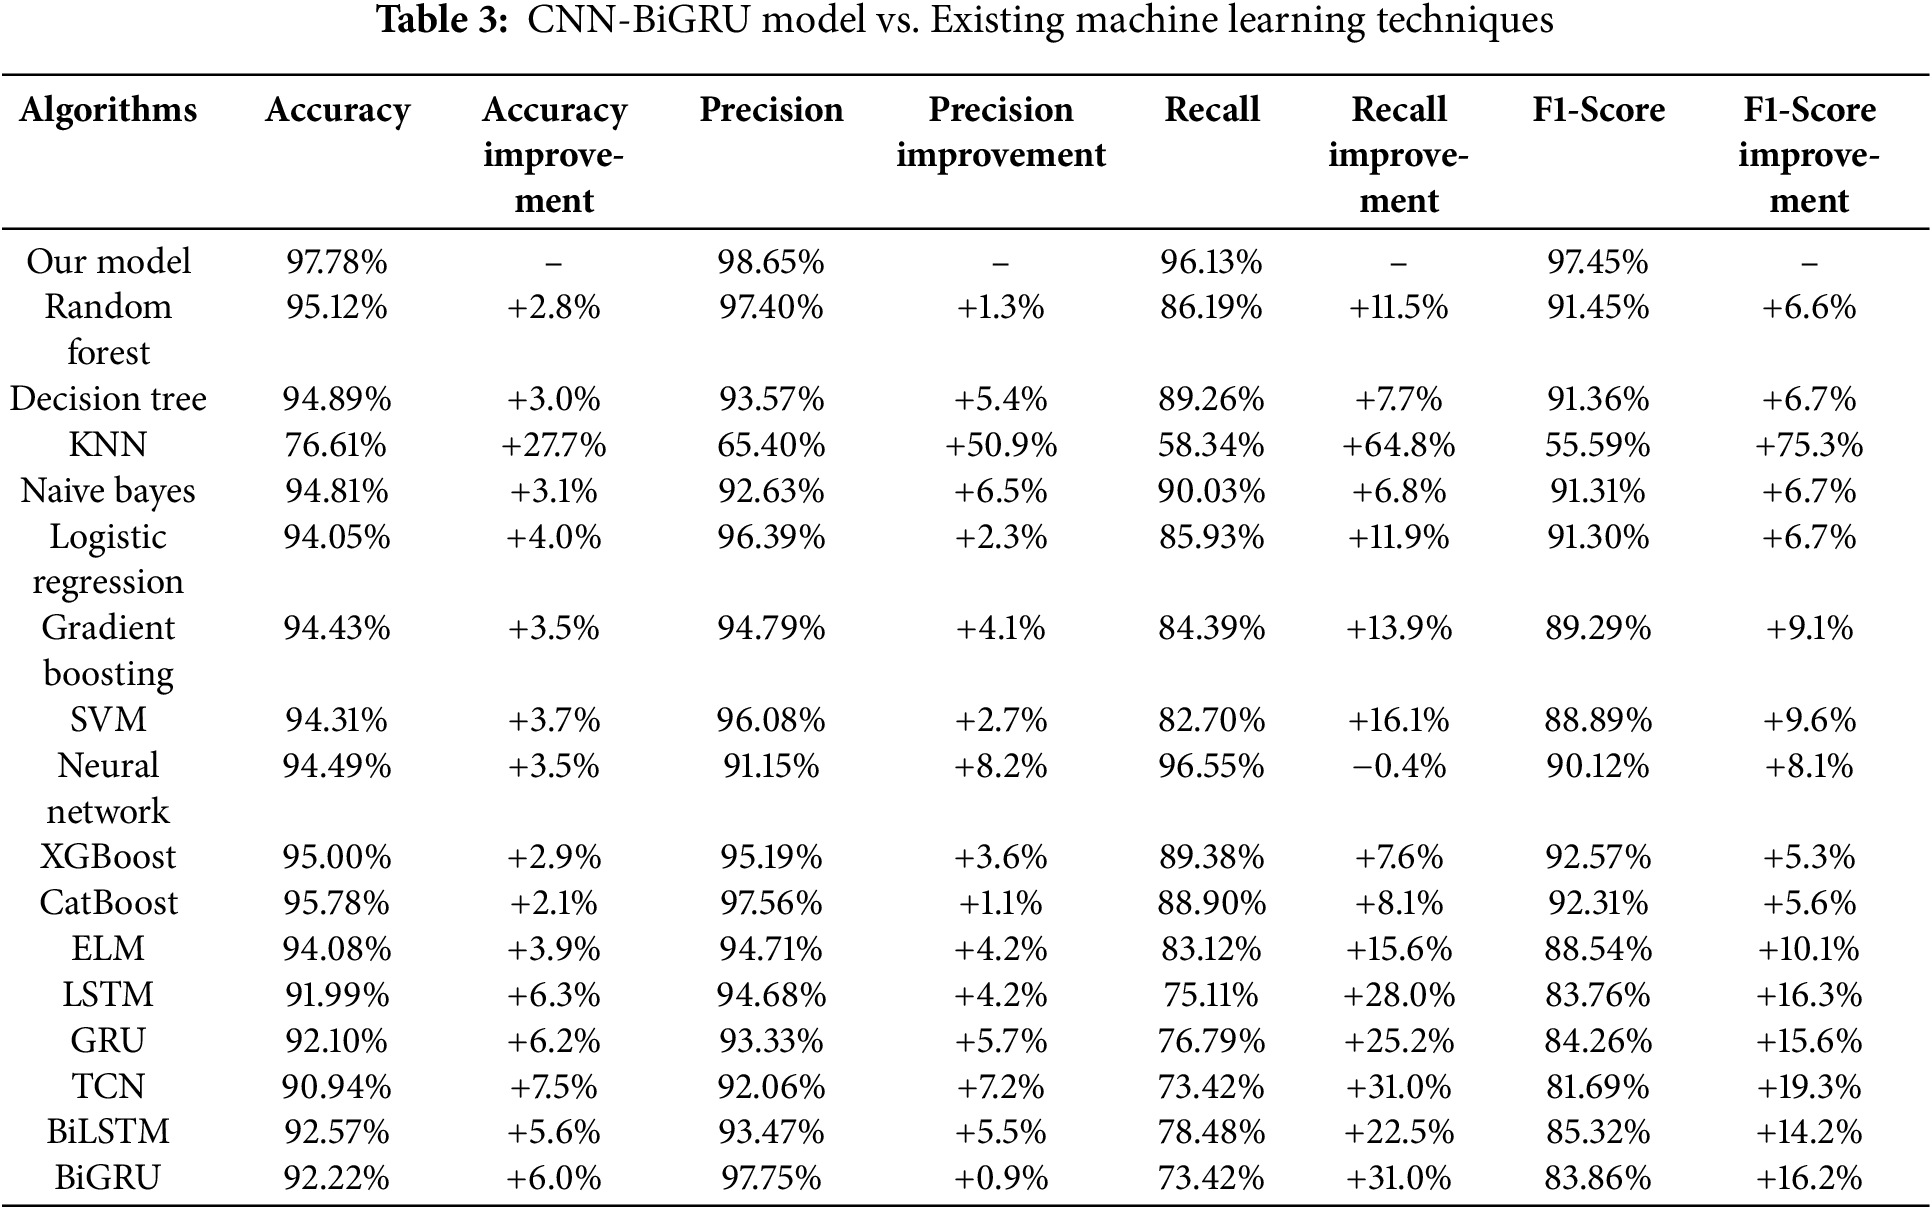
Fig. 4a presents the confusion matrix for the validation dataset, with 290 true negatives, 307 true positives, 8 false positives, and 16 false negatives, indicating strong predictive accuracy. Fig. 4b shows the test dataset results, achieving 598 true negatives, 214 true positives, 24 false positives, and 25 false negatives, indicating strong predictive performance. The model demonstrates balanced performance across both datasets, with a slight drop on the test set suggesting minimal overfitting. These results highlight the model’s robustness and generalizability to unseen data.
To ensure transparency and reproducibility, the evaluation metrics used in this study are calculated as follows:
(1) Accuracy measures the overall correctness of the model, as Eq. (18):
(2) Precision reflects how many of the predicted diabetic cases were actually correct, as Eq. (19):
(3) Recall or Sensitivity indicates how well the model identifies actual diabetic cases, as Eq. (20):
(4) F1-score provides a balance between precision and recall, as Eq. (21):
Furthermore, by using the above equation we calculated the accuracy, precision, recall and f1 scores and compared the results of our model with those of various machine learning algorithms to evaluate its performance. The comparison our proposed model with existing machine learning techniques along with the calculated relative improvement is presented in Table 3. We calculate the relative improvement of our model over each baseline model using the Eq. (22):
Table 3 shows a comparative analysis of the proposed CNN-BiGRU model against various machine learning algorithms. The findings show that our model outperforms all baseline approaches in important assessment criteria, such as precision (98.65%), recall (96.13%), and F1-score (97.45%), and obtains the best accuracy (97.78%). Furthermore, the table shows the relative improvement (%) of our methodology over each baseline technique, allowing for a quantitative assessment of its effectiveness. The findings show that the CNN-BiGRU architecture efficiently integrates spatial feature extraction (CNN) and sequential learning (BiGRU), leading to significant performance advantages over traditional machine learning models and alternative deep learning architectures.
Table 4 notably shows, without ADASYN data augmentation, the CNN-BiGRU model demonstrates comparatively reduced recall and F1-score, indicating the adverse effects of class imbalance. By employing ADASYN to synthesize new minority-class samples, our approach ensures a more balanced dataset and substantially improves the model’s overall predictive performance.
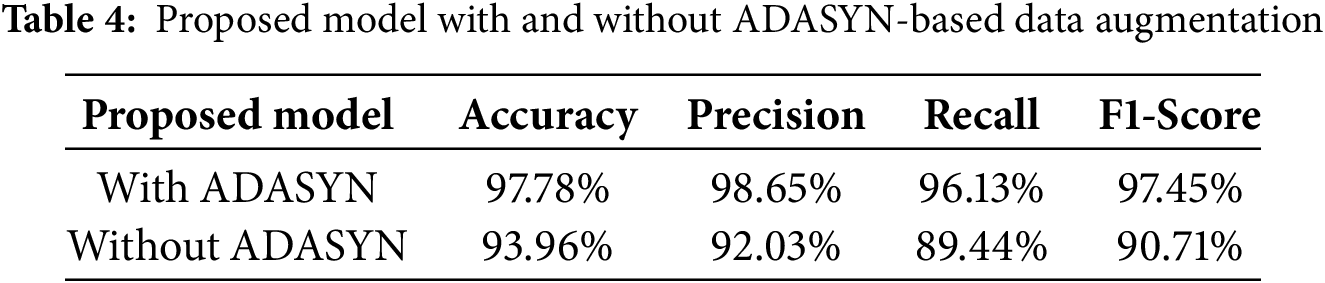
The hybrid CNN-BiGRU architecture, which successfully blends CNN’s capacity to extract spatial features with BiGRU’s prowess in identifying sequential dependencies, is responsible for this better performance. The CNN-BiGRU model combines spatial and sequential learning, which helps it better capture intricate patterns in medical data than traditional deep learning models like LSTM (91.99% accuracy) and GRU (92.10% accuracy), which mainly concentrate on temporal correlations.
The ROC AUC curve is displayed in the Fig. 5, to assess a classification model’s effectiveness by displaying the trade-off between the true positive rate (sensitivity) and the false positive rate across different thresholds in Fig. 6. The ROC curve is defined by two key components mathematically:
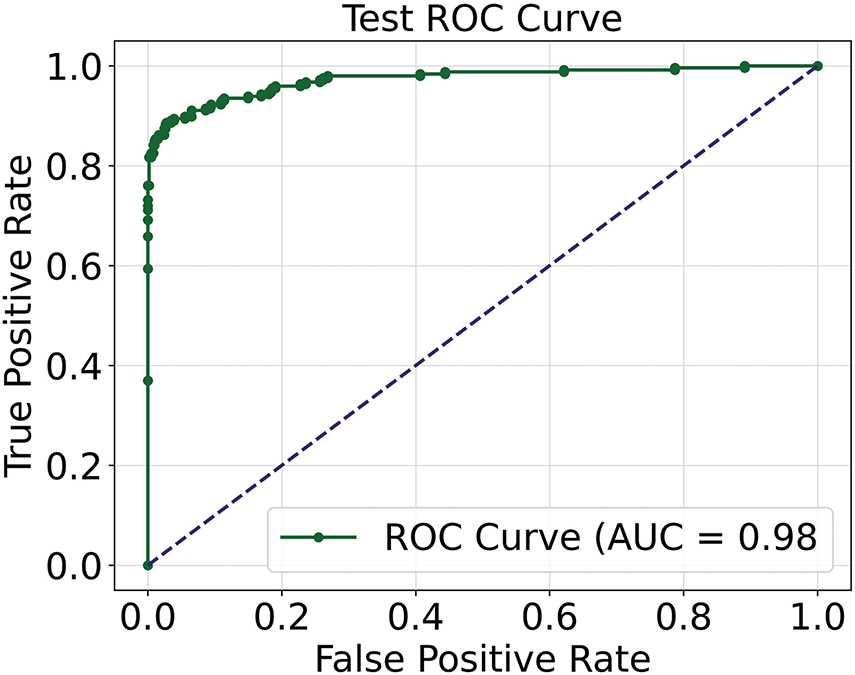
Figure 5: ROC AUC curve of the model
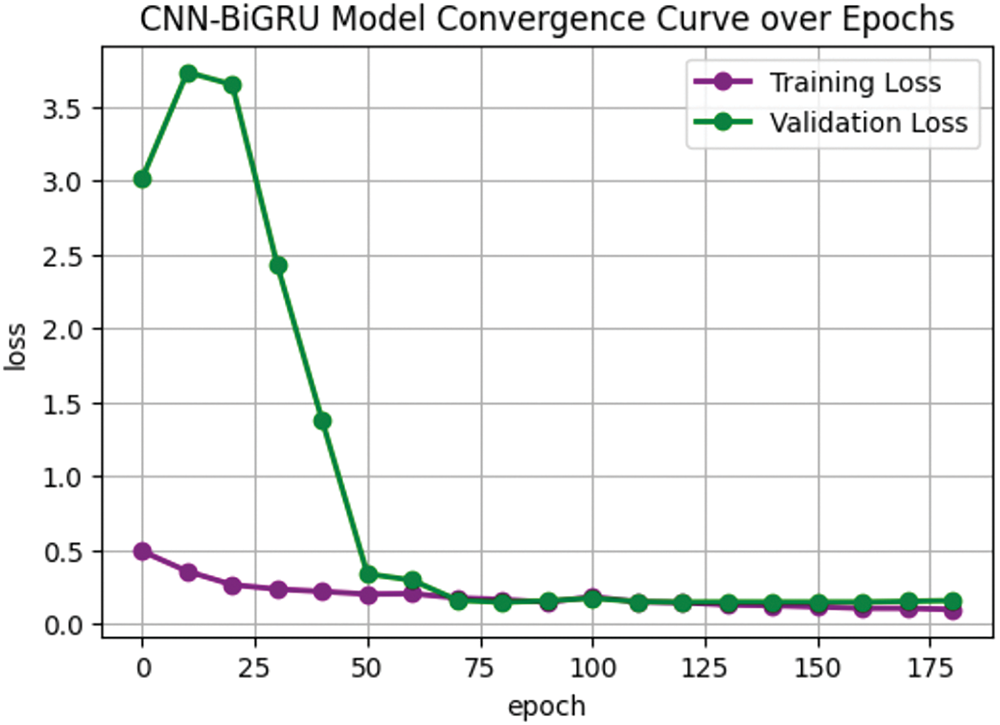
Figure 6: Convergence curve over the epochs of proposed model
(1) True Positive Rate (TRP) or Sensitivity as Eq. (23):
where
(2) False Positive Rate (FPR) or 1-Specificity as Eq. (24):
where
The AUC score is the area under the ROC curve, which can be calculated by Eq. (25):
Fig. 6 plots the true positive rate against the false positive rate, the ROC curve shows how well the model performs. Excellent discriminatory capacity is indicated by the high AUC value of 0.98%, which validates the model’s efficacy in differentiating between positive and negative classes.
To assess the training stability and generalization ability of the proposed CNN-BiGRU model, a convergence analysis is performed by plotting the training loss and validation loss over multiple epochs. Shown in Fig. 6.
Fig. 6 illustrates the loss behavior during the training process. As the model gradually picks up significant patterns from the training data, the training loss (purple) gradually drops. As the model optimizes its weights, it is typical for the validation loss (green) to fluctuate at first before stabilizing. The rapid drop in validation loss after the initial epochs suggests successful training, while its eventual stabilization indicates convergence. The model’s robust generalization and avoidance of overfitting are confirmed by the close overlap of training and validation losses in subsequent epochs.
The proposed CNN-BiGRU model shows strong performance in predicting diabetes, but several limitations exist. The dataset used is small, which may limit the model’s applicability to bigger, more diverse populations. Future research could assess the model using larger datasets with diverse demographics. Although ADASYN was utilized for data augmentation, managing highly unbalanced datasets with complex patterns remains difficult. Future work could include more complex techniques for synthetic data generation, such as GANs. The model’s usefulness in real-time clinical settings was not explored, and future studies should study its incorporation into clinical workflows for real-time monitoring. Furthermore, improving model interpretability using strategies such as attention processes or SHAP values may increase its medical usefulness. Finally, developing the model to accommodate multi-class classification or regression tasks.
Finally, developing the model to deal with multi-class classification or regression tasks would provide insights into disease progression and risk stratification, broadening its potential use in healthcare.
This study presents an innovative and effective approach for diabetes prediction by integrating a CNN-BiGRU hybrid architecture with ADASYN-based data augmentation, addressing the critical challenge of class imbalance in medical datasets. ADASYN significantly enriched the dataset by generating synthetic yet representative samples, thereby improving model generalizability and ensuring a balanced representation of minority classes. The proposed CNN-BiGRU framework demonstrated exceptional predictive performance, achieving a training accuracy of 98.74% and a test accuracy of 97.78%, by leveraging the complementary strengths of CNNs in feature extraction and BiGRUs in capturing sequential dependencies.
These results underscore the model’s robustness and effectiveness in overcoming the inherent limitations of unbalanced medical datasets, marking a substantial advancement in the accuracy and reliability of diabetes prediction. Furthermore, this work emphasizes the pivotal role of integrating advanced data augmentation techniques with cutting-edge hybrid architectures to enhance diagnostic precision in medical applications. By establishing a scalable and reliable methodology, this study not only addresses pressing challenges in diabetes diagnostics but also lays a solid foundation for future research aimed at improving predictive capabilities in other medical domains.
Acknowledgement: The authors are grateful to all the editors and anonymous reviewers for their comments and suggestions.
Funding Statement: This work was supported by the National Natural Science Foundation of China (No. 42075129), Hebei Province Natural Science Foundation (No. E2021202179) and Key Research and Development Project from Hebei Province (No. 21351803D).
Author Contributions: The authors confirm contribution to the paper as follows: Study conception, design and draft manuscript preparation: Tehreem Fatima; Funding acquisition and supervision: Kewen Xia; Review: Wenbiao Yang, Qurat Ul Ain, Poornima Lankani Perera. All authors reviewed the results and approved the final version of the manuscript.
Availability of Data and Materials: Not applicable.
Ethics Approval: Not applicable.
Conflicts of Interest: The authors declare no conflicts of interest to report regarding the present study.
References
1. Chen Y, Lee K, Ni Z, He JC. Diabetic kidney disease: challenges, advances, and opportunities. Kidney Dis. 2020;6(4):215–25. doi:10.1159/000506634. [Google Scholar] [PubMed] [CrossRef]
2. Allen A, Iqbal Z, Green-Saxena A, Hurtado M, Hoffman J, Mao Q, et al. Prediction of diabetic kidney disease with machine learning algorithms, upon the initial diagnosis of type 2 diabetes mellitus. BMJ Open Diabetes Res Care. 2022;10(1):e002560. doi:10.1136/bmjdrc-2021-002560. [Google Scholar] [PubMed] [CrossRef]
3. Boddu SK, Aurangabadkar G, Kuchay MS. New onset diabetes, type 1 diabetes and COVID-19. Diabetes Metab Syndr Clin Res Rev. 2020;14(6):2211–7. doi:10.1016/j.dsx.2020.11.012. [Google Scholar] [PubMed] [CrossRef]
4. Zhu T, Li K, Herrero P, Georgiou P. Deep learning for diabetes: a systematic review. IEEE J Biomed Health Inform. 2021;25(7):2744–57. doi:10.1109/JBHI.2020.3040225. [Google Scholar] [PubMed] [CrossRef]
5. Shrestha A, Mahmood A. Review of deep learning algorithms and architectures. IEEE Access. 2019;7:53040–65. doi:10.1109/ACCESS.2019.2912200. [Google Scholar] [CrossRef]
6. García-Ordás MT, Benavides C, Benítez-Andrades JA, Alaiz-Moretón H, García-Rodríguez I. Diabetes detection using deep learning techniques with oversampling and feature augmentation. Comput Methods Programs Biomed. 2021;202:105968. doi:10.1016/j.cmpb.2021.105968. [Google Scholar] [PubMed] [CrossRef]
7. Wee BF, Sivakumar S, Lim KH, Wong WK, Juwono FH. Diabetes detection based on machine learning and deep learning approaches. Multimed Tools Appl. 2024;83(8):24153–85. doi:10.1007/s11042-023-16407-5. [Google Scholar] [CrossRef]
8. Vidhya K, Shanmugalakshmi R. Deep learning based big medical data analytic model for diabetes complication prediction. J Ambient Intell Humaniz Comput. 2020;11:5691–702. doi:10.1007/s12652-020-01930-2. [Google Scholar] [CrossRef]
9. Modak SKS, Jha VK. Diabetes prediction model using machine learning techniques. Multimed Tools Appl. 2024;83(13):38523–49. doi:10.1007/s11042-023-16745-4. [Google Scholar] [CrossRef]
10. Ahmed BM, Ali ME, Masud MM, Naznin M. Recent trends and techniques of blood glucose level prediction for diabetes control. Smart Health. 2024;32:100457. doi:10.1016/j.smhl.2024.100457. [Google Scholar] [CrossRef]
11. Alsayed AO, Ismail NA, Hasan L, Binsawad M, Embarak F. Leveraging a hybrid convolutional gated recursive diabetes prediction and severity grading model through a mobile app. PeerJ Comput Sci. 2025;11:e2642. doi:10.7717/peerj-cs.2642. [Google Scholar] [PubMed] [CrossRef]
12. Khan WR, Ahmad Kamran M, Khan MU, Ibrahim MM, Kim KS, Ali MU. Diabetes prediction using an optimized variational quantum classifier. Int J Intell Syst. 2025;2025(1):1351522. doi:10.1155/int/1351522. [Google Scholar] [CrossRef]
13. Alkalifah B, Shaheen MT, Alotibi J, Alsubait T, Alhakami H. Evaluation of machine learning-based regression techniques for prediction of diabetes levels fluctuations. Heliyon. 2024;11(1):e41199. doi:10.1016/j.heliyon.2024.e41199. [Google Scholar] [PubMed] [CrossRef]
14. Battineni G, Sagaro GG, Nalini C, Amenta F, Tayebati SK. Comparative machine-learning approach: a follow-up study on type 2 diabetes predictions by cross-validation methods. Machines. 2019;7(4):74. doi:10.3390/machines7040074. [Google Scholar] [CrossRef]
15. Fazakis N, Kocsis O, Dritsas E, Alexiou S, Fakotakis N, Moustakas K. Machine learning tools for long-term type 2 diabetes risk prediction. IEEE Access. 2021;9:103737–57. doi:10.1109/ACCESS.2021.3098691. [Google Scholar] [CrossRef]
16. Mansoori A, Sahranavard T, Hosseini ZS, Soflaei SS, Emrani N, Nazar E, et al. Prediction of type 2 diabetes mellitus using hematological factors based on machine learning approaches: a cohort study analysis. Sci Rep. 2023;13(1):663. doi:10.1038/s41598-022-27340-2. [Google Scholar] [PubMed] [CrossRef]
17. Syed AH, Khan T. Machine learning-based application for predicting risk of type 2 diabetes mellitus (T2DM) in Saudi Arabia: a retrospective cross-sectional study. IEEE Access. 2020;8:199539–61. doi:10.1109/ACCESS.2020.3035026. [Google Scholar] [CrossRef]
18. Fatima T, Yang W, Xia K, Zia SM. Deep learning approach combining GAN and BiGRU for diabetes prediction. In: 2024 3rd International Conference on Robotics, Artificial Intelligence and Intelligent Control (RAIIC); 2024 Jul 5–7; Mianyang, China. p. 346–9. doi:10.1109/RAIIC61787.2024.10670966. [Google Scholar] [CrossRef]
Cite This Article
 Copyright © 2025 The Author(s). Published by Tech Science Press.
This work is licensed under a Creative Commons Attribution 4.0 International License , which permits unrestricted use, distribution, and reproduction in any medium, provided the original work is properly cited.
 Downloads
 Citation Tools