
 Submit a Paper
 Propose a Special lssue
 Open Access
ARTICLE
Bird Species Classification Using Image Background Removal for Data Augmentation
Department of Computer Science and Information Engineering, National Quemoy University, Kinmen, 892009, Taiwan
* Corresponding Author: Yu-Xiang Zhao. Email:
(This article belongs to the Special Issue: Computer Vision and Image Processing: Feature Selection, Image Enhancement and Recognition)
Computers, Materials & Continua 2025, 84(1), 791-810. https://doi.org/10.32604/cmc.2025.065048
Received 02 March 2025; Accepted 13 May 2025; Issue published 09 June 2025
 View Full Text
 Download PDF
Abstract
Bird species classification is not only a challenging topic in artificial intelligence but also a domain closely related to environmental protection and ecological research. Additionally, performing edge computing on low-level devices using small neural networks can be an important research direction. In this paper, we use the EfficientNetV2B0 model for bird species classification, applying transfer learning on a dataset of 525 bird species. We also employ the BiRefNet model to remove backgrounds from images in the training set. The generated background-removed images are mixed with the original training set as a form of data augmentation. We aim for these background-removed images to help the model focus on key features, and by combining data augmentation with transfer learning, we trained a highly accurate and efficient bird species classification model. The training process is divided into a transfer learning stage and a fine-tuning stage. In the transfer learning stage, only the newly added custom layers are trained; while in the fine-tuning stage, all pre-trained layers except for the batch normalization layers are fine-tuned. According to the experimental results, the proposed model not only has an advantage in size compared to other models but also outperforms them in various metrics. The training results show that the proposed model achieved an accuracy of 99.54% and a precision of 99.62%, demonstrating that it achieves both lightweight design and high accuracy. To confirm the credibility of the results, we use heatmaps to interpret the model. The heatmaps show that our model can clearly highlight the image feature area. In addition, we also perform the 10-fold cross-validation on the model to verify its credibility. Finally, this paper proposes a model with low training cost and high accuracy, making it suitable for deployment on edge computing devices to provide lighter and more convenient services.Keywords
Bird species classification is an important problem in the domain of computer science. With the rapid development of artificial intelligence in pattern recognition, numerous models and algorithms have been developed. Among various datasets, bird species datasets are often considered important benchmarks for evaluating model performance due to their unique variety, rich backgrounds, and diverse classes. These datasets typically cover a wide range of bird species, uneven lighting conditions, varying observation angles, and interference from natural backgrounds. Such characteristics not only increase the challenge of the recognition task but also provide an excellent testing environment for assessing model generalization. In addition, accurate bird species classification plays a crucial role in ecological research. With precise classification, we can effectively monitor and analyze the ecological behaviors of birds, including migration routes, feeding habits, mating behaviors, and more. This information is essential not only for conserving biodiversity but also for understanding the dynamic balance of ecosystems. For example, migration patterns can reveal the impacts of climate change, while feeding behaviors can shed light on the distribution of plant and insect populations. In agriculture, bird species classification also has direct applications. By identifying bird species that pose threats to crops, we can develop effective management strategies to reduce agricultural losses. Meanwhile, recognizing beneficial bird species that help control pests can also promote natural agricultural processes and support ecological farming practices.
In addition to basic bird species classification, how to perform edge computing on low-level devices through small network models is also an important research direction. With the continuous advancement of hardware devices, more and more models tend to increase gradually. Although this is not too much of a problem with the support of existing computing power, it also makes it difficult to use many low-level devices such as handheld devices and personal computers. To solve this problem, we can use smaller, lighter networks as the backbone of the model, and further reduce their capacity by reducing accuracy, optimizing the network, etc., to increase the feasibility of edge computing. Through edge computing, we can combine handheld device applications for local identification services, which greatly improves the usability of the model and maintains privacy without consuming network traffic. This approach can even go one step further to achieve real-time computing, which can meet the requirements of low power consumption while ensuring its performance. This is ideal for outdoor biometrics such as birds, and can also be combined with relevant agricultural facilities for efficient responses. This approach not only increases the application of Artificial Intelligence (AI) in a single domain but also meets the market’s expectation to reduce costs.
In summary, bird species classification is not only a challenging topic in artificial intelligence, but also a domain related to environmental protection, ecological research, and agricultural management. Through the small network model, we will be able to train the relevant model in a low-cost way, and further integrate edge computing to realize handheld device applications and local identification services. How to improve the accuracy and efficiency of the model will play a key role in helping us better understand and improve the environment. This is not only a technological advancement, but also a contribution to sustainable development.
In recent years, Convolutional Neural Network (CNN) models have become an indispensable part of image classification. The earliest concept of CNN can be traced back to a paper published by Yann LeCun in 1989. This paper describes a receptive field model and applies it to handwritten postal code recognition, demonstrating its effectiveness. Then in 1998, the LeNet-5 architecture [1], also published by Yann LeCun, further improved the concept of CNN. Compared to previous research, this paper defines the basic architecture of convolutional layers, pooling layers, and fully connected layers for the first time, and demonstrates it in handwritten digit recognition. Although this architecture was only capable of handling simple datasets at the time, in 2012, AlexNet, developed by Hinton as a mentor, brought about a historic breakthrough in the application of artificial intelligence in this domain [2]. This new architecture uses ReLU as the activation function to avoid gradient vanishing and improve convergence speed. Also, dropout and local response normalization layers are used to reduce the overfitting of the model and improve generalization. Meanwhile, the maximum pooling layer is used to improve feature variety, data augmentation is used to increase data volume, and Graphics Processing Unit (GPU) acceleration is used to increase training speed. This architecture performed well on large datasets, bringing explosive growth to CNN-related research and laying the foundation for the basic architecture workflow for future image classification models. Most current CNN image classification research is based on this, but replacing the local response normalization layer with a batch normalization layer instead [3]. The batch normalization layer is currently the mainstream approach to prevent overfitting. Compared to the local response normalization layer used by AlexNet, it has better performance but a higher training cost. It has become a key block in many newer models such as VGG [4], ResNet [5], and Inception [6].
Among many new models derived from this architecture workflow, the EfficientNet series, released by Google in 2019, is the most well-known [7]. The basic architecture of this model was generated by Neural Architecture Search (NAS) [8], which can automatically find the optimal neural network configuration within a defined search space and validate it using the ImageNet dataset. The resulting architecture is mainly based on the MBConv block and its embedded SE block [9]. The MBConv block serves as the core computational unit of the architecture, responsible for extracting image features, and it inherits the inverted bottleneck design from MobileNetV2 [10]. Meanwhile, the embedded SE block functions as a channel attention mechanism. For example, if the initial image input is in RGB format, the initial number of channels is three. After multiple rounds of feature extraction through the convolutional layers, additional channels are created, each representing different features such as edges, textures, colors, etc. The SE block can weigh these features according to the importance of their channels, thereby enhancing the key features extracted by the MBConv block. In addition, this architecture employs compound scaling as a global strategy to extend the series from B0 to B7. While the EfficientNet series is primarily an extension of the MobileNet series, which was designed for extremely resource-constrained environments, EfficientNet offers a better balance between efficiency and performance. It achieves higher accuracy under similar constraints, making it highly suitable for research and use by individual scholars or home users.
In 2021, EfficientNetV2 [11], also proposed by Google, became an upgraded version of EfficientNet. The model architecture in this version was also generated through NAS, but with a changed optimization goal and a reduced search space to introduce the Fused-MBConv block, which reduces computational complexity and improves training efficiency. Additionally, a progressive learning strategy is employed to dynamically adjust regularization, enhancing training efficiency while also increasing accuracy. Specifically, the models in this series offer faster training speeds, fewer parameters, and better accuracy compared to previous versions. This also makes them easier to apply to different datasets through transfer learning [12]. Transfer learning is currently the mainstream approach in neural network training. This method allows a model trained on one task or dataset to be adapted for another related task or dataset. It not only addresses the lack of data for new tasks but also significantly reduces training costs while maintaining model accuracy. Furthermore, the transfer learning approach can be divided into fixed feature extraction and fine-tuning. With fixed feature extraction, the new model acts as a classifier, receiving the extracted features and achieving good results after some training. To more comprehensively adapt to the dataset and achieve higher accuracy, some of the pre-trained layers can be unfrozen and further trained through fine-tuning.
In this research, we are going to use these two methods to perform transfer learning on the EfficientNetV2B0 model on the BIRDS 525 SPECIES dataset [13]. This dataset is one of the most comprehensive datasets on birds, and many researchers have built their image classification models based on this dataset. Mochurad et al. also used this dataset to perform transfer learning on the EfficientNetB5 model and achieving an accuracy of 98.86% [14]. It is better than the hybrid model architecture of YOLOv5 and EfficientNetB3 proposed by Vo et al. [15], who also compared EfficientNetB3, VGG19, and Inception V3 [16]. The EfficientNetB3 achieved the highest accuracy of 98%, but it is still slightly worse than the model built solely on EfficientNetB5. The reason for this is not only that the number of parameters of B5 is higher than that of B3, but also the training steps. The researcher who uses the B5 model added three additional fully connected layers, three batch normalization layers, and three dropout layers as new custom layers. They use data augmentation to rotate, scale, and shift the image to a certain extent. Then, with transfer learning, they first train the newly added custom layer with a high learning rate and then train the last 92 layers of the pre-trained model with a low learning rate. This approach not only allows for more comprehensive model training but also enhances the original feature extraction capabilities by adding new layers.
In addition to simply customizing the number of layers and models, the optimizer and metrics used in the training process are also crucial. The bird species classification research mentioned in the previous paragraph mainly used the Adam optimizer to train the model [17]. The Adam optimizer is an optimization algorithm that combines the momentum method with RMSProp. It adjusts the learning rate by calculating the gradient’s first-order and second-order momentum. This makes the Adam optimizer have better stability and convergence speed when dealing with high-dimensional data and sparse gradient problems, and is particularly suitable for deep learning tasks. By introducing the Adam optimizer, this research can quickly find the optimal solution for the model parameters and further improve the accuracy of bird species classification. Besides that, to avoid overfitting, this research also uses validation loss as a metric for storing models. During the training process, the validation loss is calculated after each epoch, and the model with the lowest loss is stored as the best model. To further enhance the robustness of training, the research set up an early stopping mechanism, which determines whether training should stop early based on the patience value. Specifically, if the validation loss does not decrease in multiple epochs and the patience value is exhausted, the training process will be stopped. This method not only prevents overfitting but also ensures that the model performs optimally on the validation set, thereby improving its generalization in practical applications.
In addition to the various model training methods mentioned above, data augmentation is also indispensable. Traditional data augmentation involves rotating, scaling, shifting, and other transformations on training set to increase the overall data volume. This allows the model to adapt to more variations and improves its generalization to unknown testing set. Besides that, there are other data augmentation such as adjusting image contrast and brightness, and using Generative Adversarial Network (GAN) to generate new images [18]. Perez and Wang compared the effects of various data augmentation and concluded that data augmentation can indeed improve model accuracy [19]. In addition to data augmentation, attention mechanism is also one of the current trends in image classification. In addition to the SE block’s channel attention mechanism mentioned in the previous paragraph, more and more models refer to the self-attention mechanism of the Transformer to assist image classification [20]. One of the pioneering models that introduced the Transformer architecture to computer vision tasks is the Vision Transformer (ViT) [21], Proposed by Dosovitskiy et al. in 2020. ViT treats an image as a sequence of patches and processes them in the same way as tokens in natural language processing. Each patch is linearly embedded, and positional embeddings are added before feeding them into standard Transformer encoders. ViT demonstrated that pure Transformer models can outperform convolutional networks on large-scale image classification tasks when trained on sufficient data. Besides that, the Swin Transformer developed by Microsoft in 2021 is also a computer vision model based on the Transformer architecture [22]. Its core principle is to efficiently capture local and global features through a sliding window attention mechanism. The model divides the image into multiple patches and applies window self-attention within these patches, which can reduce computational costs. At the same time, the information interaction across windows is achieved using shifted-window. Swin Transformer adopts a hierarchical design, gradually building high-level feature representations from low resolution and supporting multi-scale output. This design enables it to perform well in tasks such as image classification, object detection, and semantic segmentation, combining both efficiency and accuracy. The research proposed by Chou et al. is based on the Swin Transformer model developed by Microsoft [23], using its attention mechanism as the backbone, with a high-temperature refinement module to adjust the temperature of the feature map to learn diverse and detailed features. Combined with the background suppression module, the features are divided into foreground and background using classification confidence. Then transfer learning was performed on the CUB-200-2011 dataset, achieving the highest accuracy of 93.1%. This approach does not include traditional convolution layers but only borrows ideas from the hierarchical structure and feature pyramid network of CNN, and relies on the attention mechanism to recognize images. Another similar approach proposed by Wang et al. also uses the attention mechanism to enhance the discrimination of objects in both local and global aspects [24]. Their research developed an internal graph combined with a discriminative parts mining strategy, which can effectively embed the pixel-level information within each part to extract more compact features of those irregular parts. The graph-in-graph discriminative feature enhancement network (G2DFE-Net) they proposed has achieved over 90% accuracy on the CUB-200-2011 dataset within different backbones. This gives us a good insight into how important it is to let the model pay attention to key features. Their another research which proposed an Adversarial-Aware Fine-Grained Visual Classification Network (A2-Net) [25], also has the similarity of letting the model focus on small details.
Inspired by these approaches, our research decided to use background removal for data augmentation on the CNN model. We hope this can provide the model with attention to the key features. However according to the conclusions of research proposed by Liang et al. [26], the performance of training the model on background-removed images is not better than the traditional method, especially for deep and complex neural networks. But here we will mix the background-removed images with the original training set to increase the overall data volume instead of just removing the background information. We hope to improve the model’s ability to capture key features in this way. To achieve this goal, our research initially attempted to use a model called U2-Net for background removal [27]. This model was published in 2020 and is a deep learning-based fully convolutional neural network that focuses on accurate object boundary detection and segmentation. The architecture adopts an encoder-decoder design, with the core innovation being the combination of a U-shaped structure and dual U-shaped networks. It utilizes multi-layer residual blocks to extract features at different scales, enhancing the capability to capture boundaries and details. However, during the experiment, we found that U2-Net cannot fully capture subtle structures, which will greatly affect the background removal effect for birds with rich backgrounds. Therefore, we turned to the BiRefNet model [28], which was published in 2024 and is a deep-learning model for high-resolution dichotomous image segmentation (DIS). The core design of BiRefNet is a bilateral reference framework, including inward reference and outward reference, which consists of a localization module and a reconstruction module. The model extracts multi-scale features through the transformer encoder and combines it with efficient loss function design to achieve higher-precision image segmentation. Experimental results show that BiRefNet performs well in processing subtle structures and boundary details, so it became the main choice for our research. In this research, we will use BiRefNet for background removal. The generated background-removed image is mixed with the original training set as data augmentation. Then, we will combine it with transfer learning, hoping to train a bird species classification model with high accuracy and efficiency.
This research mainly uses the BIRDS 525 SPECIES dataset from the Kaggle dataset. This dataset has 525 classes, including training, validation, and testing sets. The training set has 84,635 images, the validation set has 2625 images, and the testing set has 2625 images, for a total of 89,885 images. The resolution of each image is 224 × 224, and there are more than 130 training images for each class. Fig. 1 shows the class distribution in the training set. Fig. 2a is the sample taken from the training set. As can be seen from these figures, the dataset contains only high-quality images and maintains a balanced distribution of classes across the 525 species. This dataset has more classes and richer images than the NABirds dataset [29]. Although these images do not have noise such as Gaussian blur and motion blur to increase the robustness of the model, their complex background has provided us with a good testing environment.
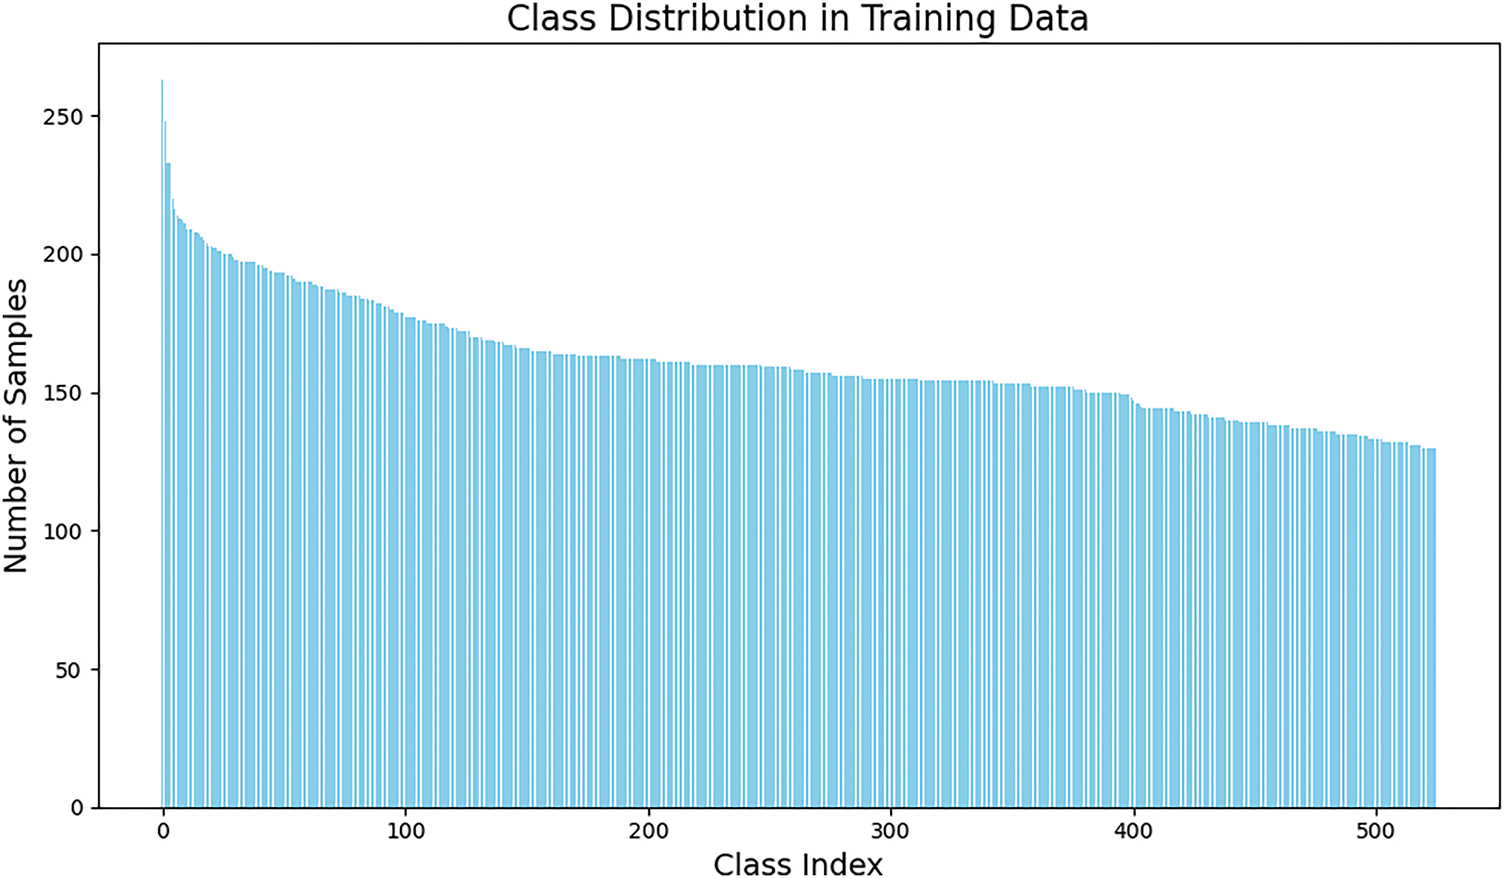
Figure 1: The class distribution in the training set of the BIRDS 525 SPECIES dataset
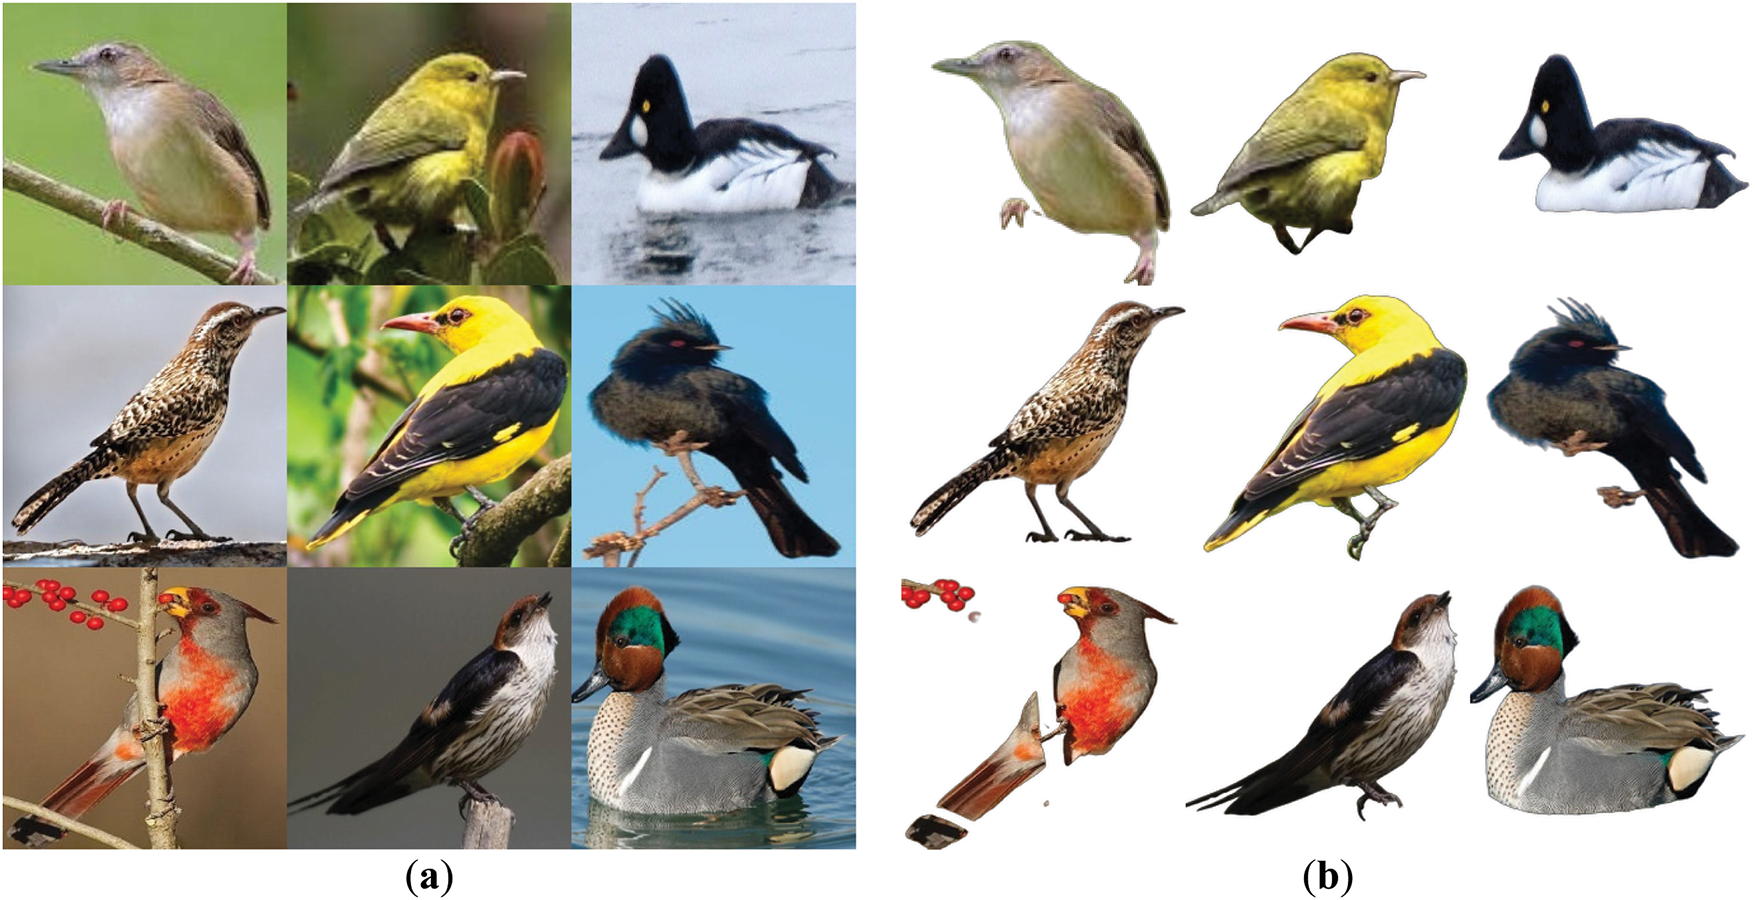
Figure 2: The samples of the training set: (a) original images; (b) images after background removal
To train the model more effectively, this research will also use image background removal as a method for data augmentation and employ the BiRefNet model to perform background removal on training images. Fig. 2b shows images that removed the background with this model. The images after background removal will be put back into the training set together with the original images. This approach is similar to traditional data augmentation, except that we do not use methods such as rotation and scaling to increase the amount of data. To better verify the effectiveness of this method, we will use traditional data augmentation to train other models independently. Thus, we can know whether using image background removal for data augmentation is better than traditional data augmentation. This study will compare the following four different data augmentation methods and explore their impact on model training effectiveness.
1. No data augmentation: only the original images are used for training.
2. Traditional data augmentation: including horizontal flipping, 5% random shifting, 5 degrees random rotation, and 5% random scaling.
3. Using image background removal for data augmentation: use the BiRefNet model to remove images’ backgrounds and put them together with the original images.
4. Hybrid data augmentation: Use the above two methods at the same time.
After processing the training set, this research will use it for transfer learning of the EfficientNetV2B0 model. This model has been trained on the ImageNet dataset. When loading it, we will keep the weights from its previous training process, so that we can directly use its feature extraction to help us do image classification. We will remove the original output layer of the pre-trained model and add different custom layers as the decision layer after the model extracts features, and finally connect to the output layer that can represent 525 different classes. The specific architecture is shown in Fig. 3. As can be seen from the architecture, after removing the original output layer of the pre-trained model, we connect it to the fully connected layer using ReLU as the activation function, as well as the batch normalization layer and Dropout layer for regularization. We will repeat these three layers of connections, each time with different neurons or parameters. The features are converted into logits through the final output layer, and then the Softmax function is used to output the probability distribution and select the highest probability one as the final output of the model. During the training process, we will also use categorical cross entropy as the loss function. The loss is calculated at the end of each forward pass, and the model performs backpropagation and gradient descent through the loss to help it update its weights.
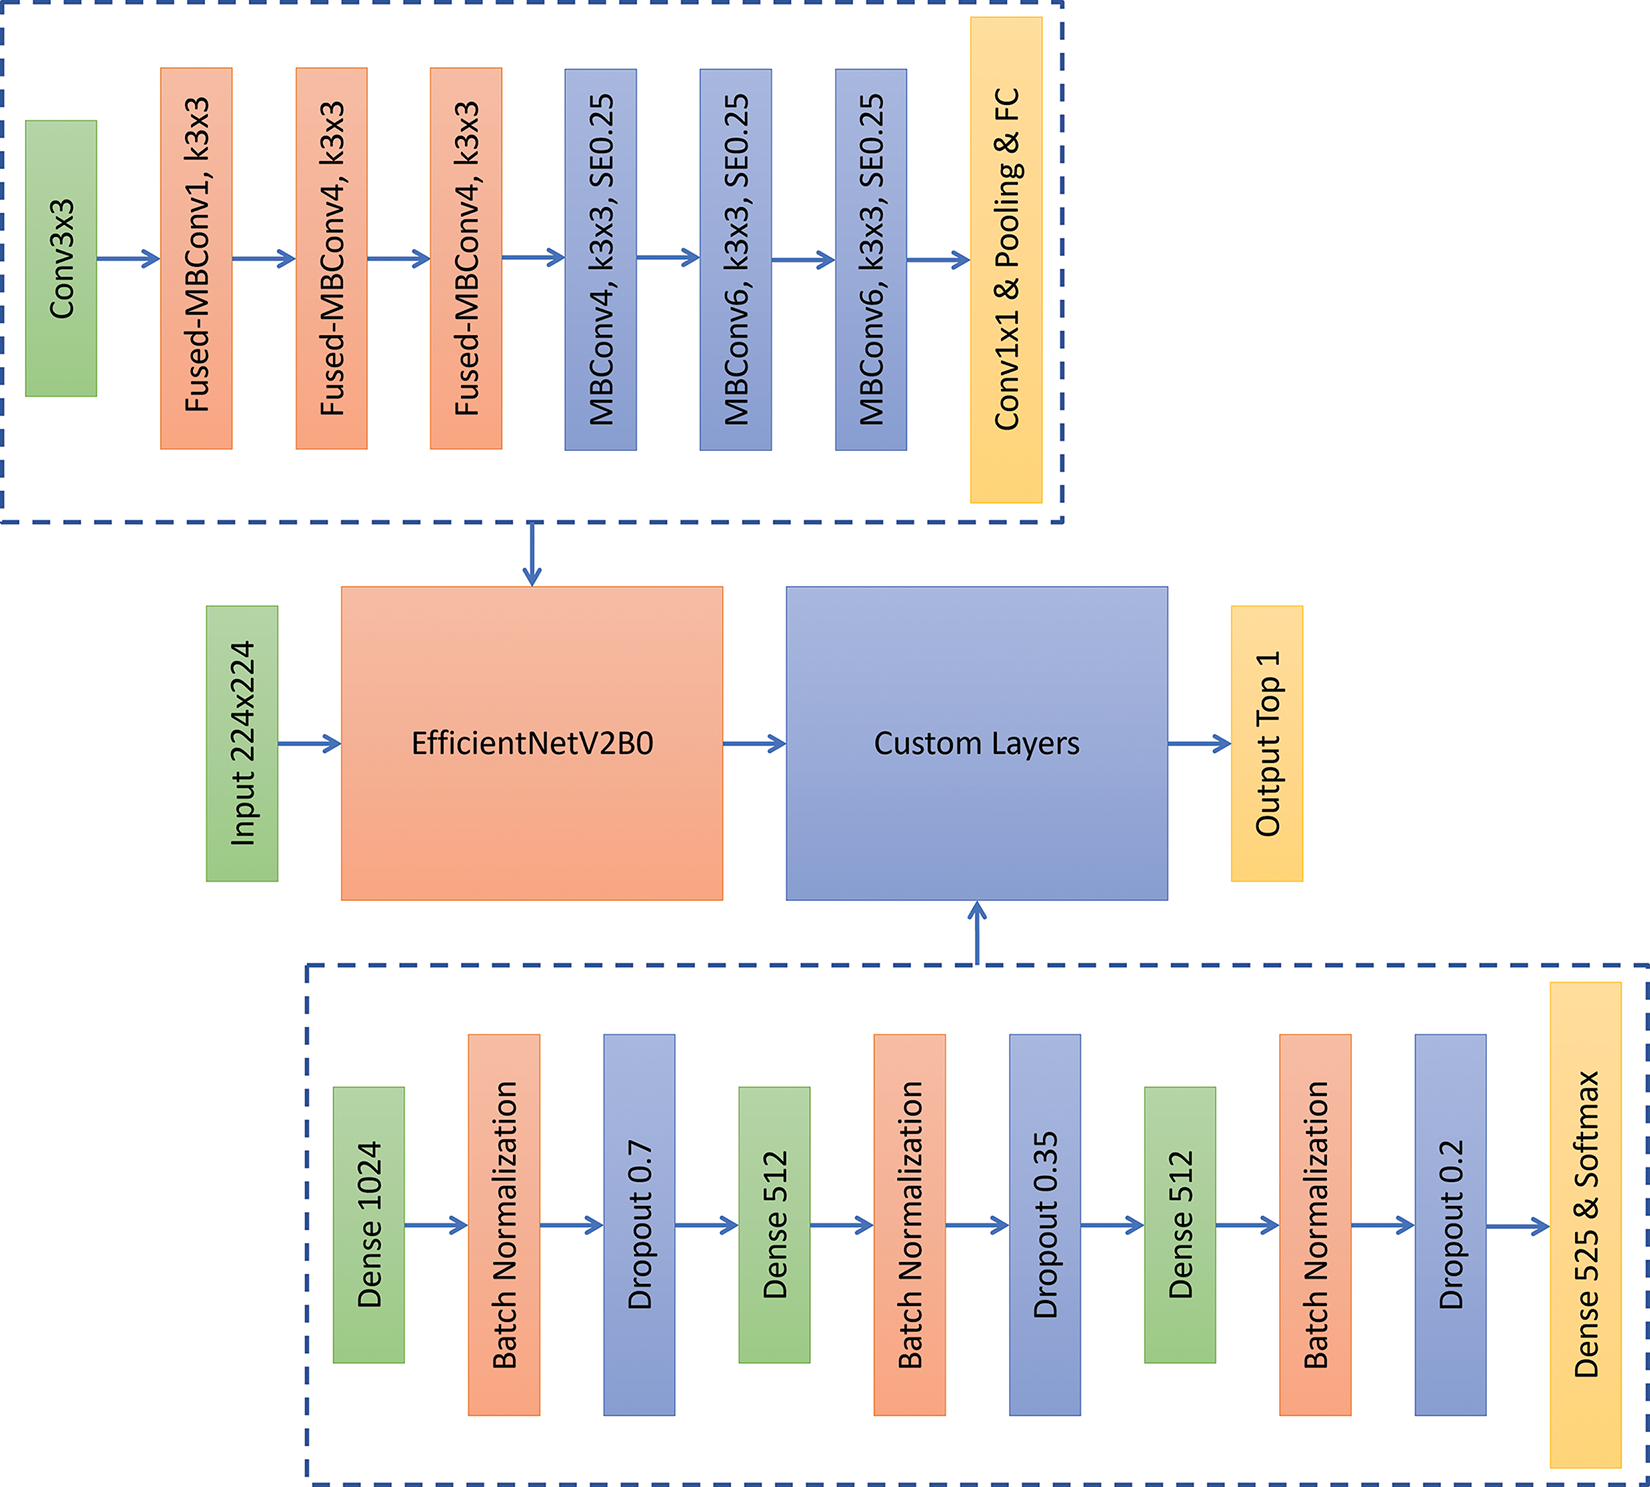
Figure 3: The proposed model architecture
The training of this research will be divided into a transfer learning stage and a fine-tuning stage, as shown in Fig. 4. In the transfer learning stage, we will freeze all pre-trained layers and only the newly added custom layers will be trained. Here we will use the Adam optimizer, set the learning rate to 0.0001, and train the model for 30 epochs. To avoid overfitting during training, we will use early stopping to end training when the model makes no progress and store the best-performing model during training. We need to choose a metric to determine whether the model is best-performing. Here we will use the validation loss as the metric. The images in the validation set don’t have any data augmentation, and the model will run the validation set once after each epoch to measure performance. The reason why the validation loss is chosen as the metric to store and early stop the model is that this metric can effectively measure whether the model is overfitting with the training set and preserve the model generalization on unknown testing set.
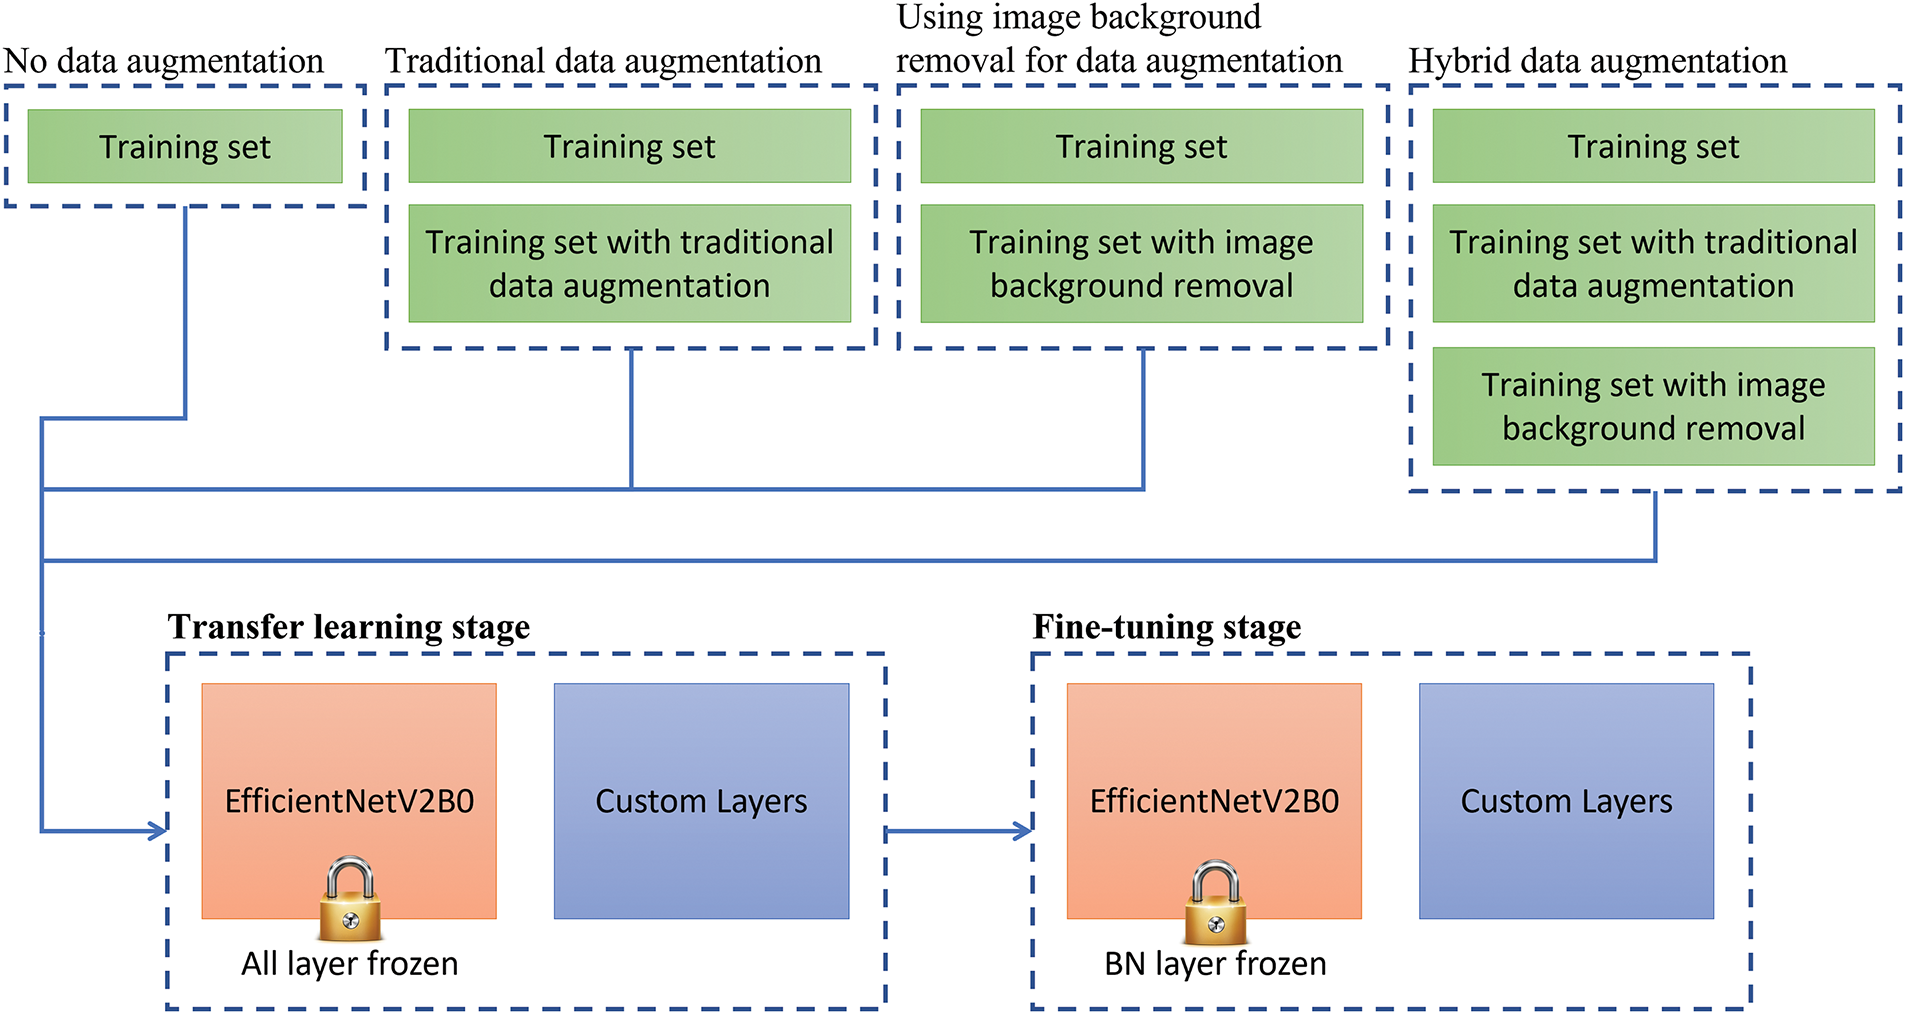
Figure 4: The proposed two-stage training flowchart
After the transfer learning stage is done, we unfreeze all pre-trained layers except the batch normalization layer and start fine-tuning the model by reducing the learning rate to 0.00001. The reason for not unfreezing the batch normalization layer is not only to effectively utilize the feature extraction capabilities of the pre-trained model but also to avoid various instability problems that may occur during the fine-tuning stage. Here, the model is also trained for 30 epochs, and the validation loss is used as the metric for model storage and early stopping. Once the model is trained in the fine-tuning stage, we evaluate its performance on an unknown testing set. The images in the testing set don’t have any data augmentation and have the same class distribution as the validation set, with only 5 images per class. To fairly compare the effects of four different data augmentations on model training, this research will use the same training process as above and train the models independently on the same computer. The experimental environment used in this research is as follows: 1 CPU as AMD Ryzen™ 9 5900X, 1 GPU as NVIDIA GeForce RTX 3090, and our computer mainly processes calculations on the GPU through CUDA.
This research divides the training process into two stages: the transfer learning stage and the fine-tuning stage, and trains different models using four different data augmentation methods from Section 3. The training results of the four data augmentation methods in the transfer learning stage are shown in Table 1. From the results, it can be seen that there are no significant differences in the results under different data augmentation methods. Figs. 5 and 6 show the changes in loss of four data augmentation methods during the transfer learning stage. It can be seen from the graph that all of these four models have reached convergence near the 30th epoch. Here, we use the validation loss as the metric for early stopping. If the loss does not decrease for three epochs, early stopping will be triggered. The reason why we don’t give the model more patience or more epochs is to avoid overfitting at this stage, which will make the model enter a suboptimal solution, affecting the follow-up fine-tuning stage performance. Fortunately, in the transfer learning stage, we can see that the trends in the validation and training are roughly parallel, which means that the model does not suffer from overfitting. Figs. 7 and 8 show the accuracy changes of these four models during the transfer learning stage. It can be seen that this change corresponds well to the loss decrease, and there is not much difference in the performance of these four models. After these four models in this stage are trained, we can fine-tune them independently.
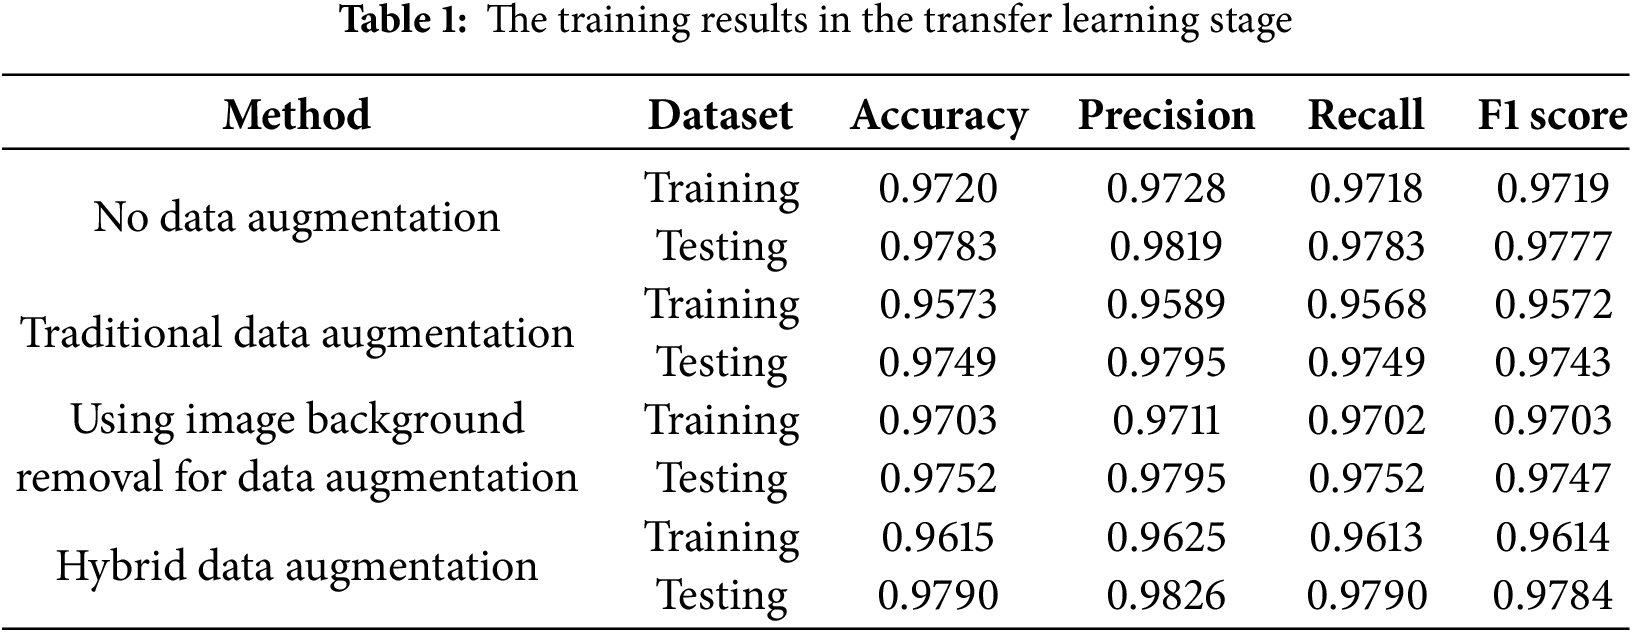
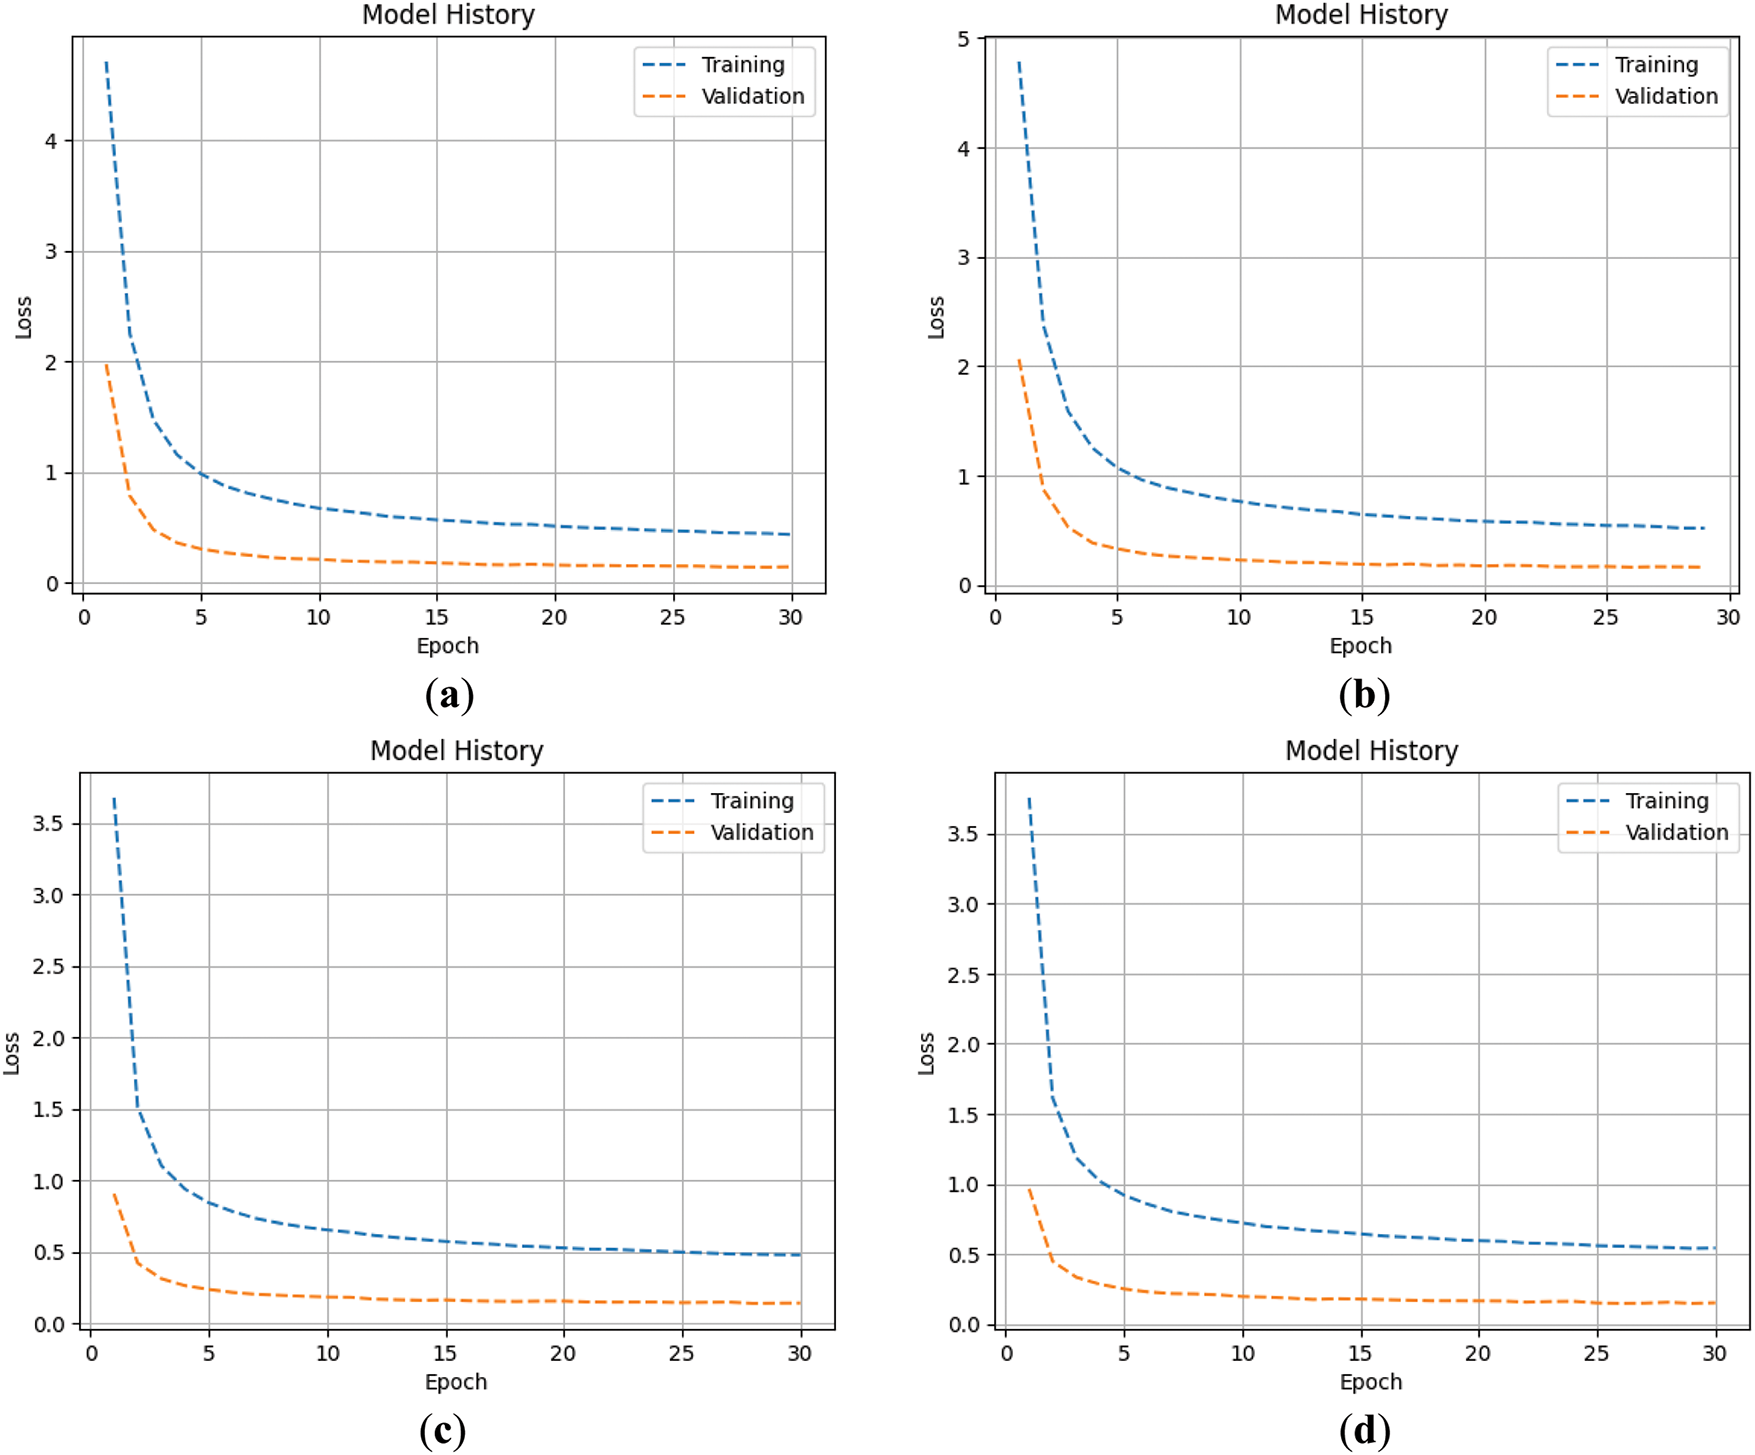
Figure 5: The loss of transfer learning stage: (a) no data augmentation; (b) traditional data augmentation; (c) using image background removal for data augmentation; (d) hybrid data augmentation
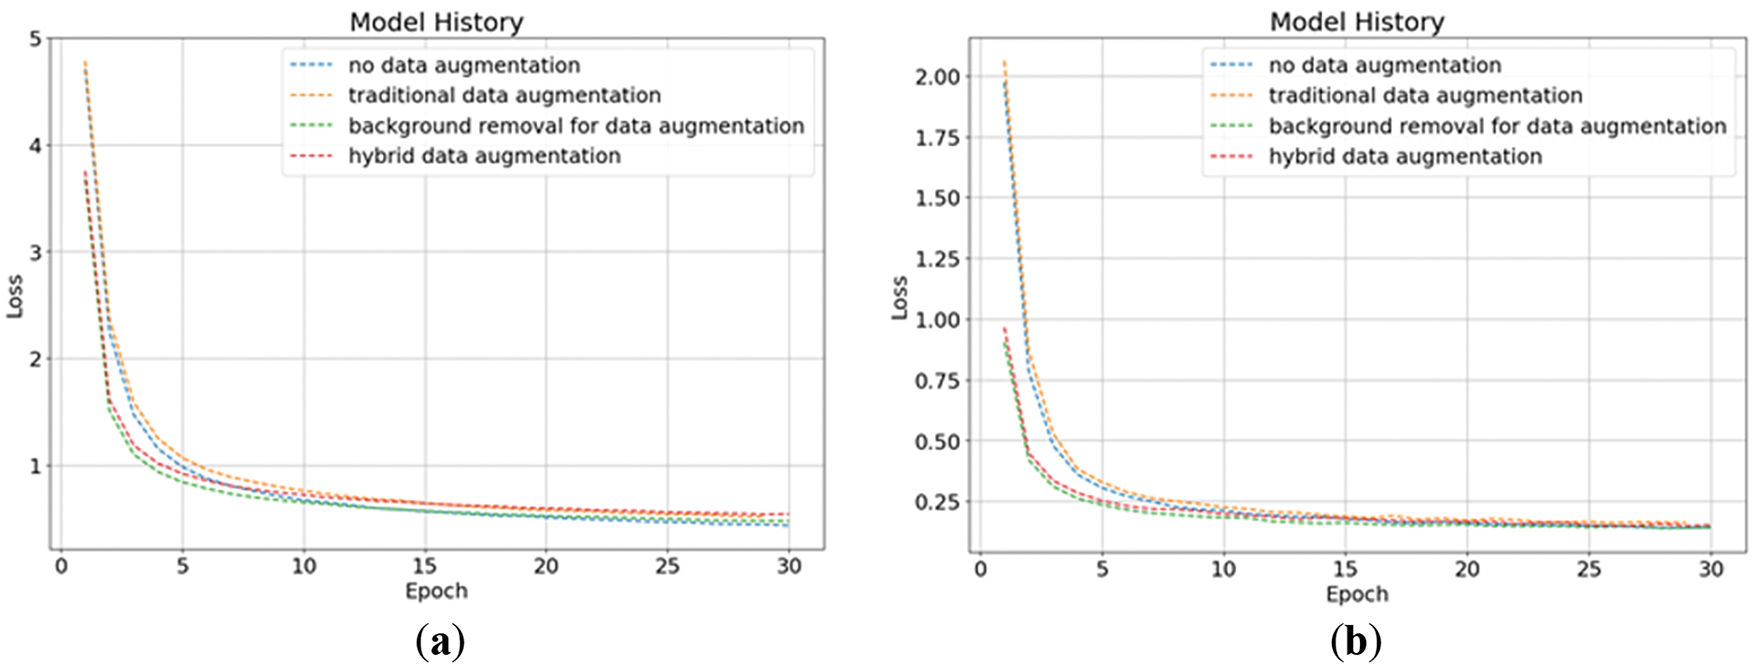
Figure 6: The loss of transfer learning stage in four data augmentation methods: (a) training loss; (b) validation loss
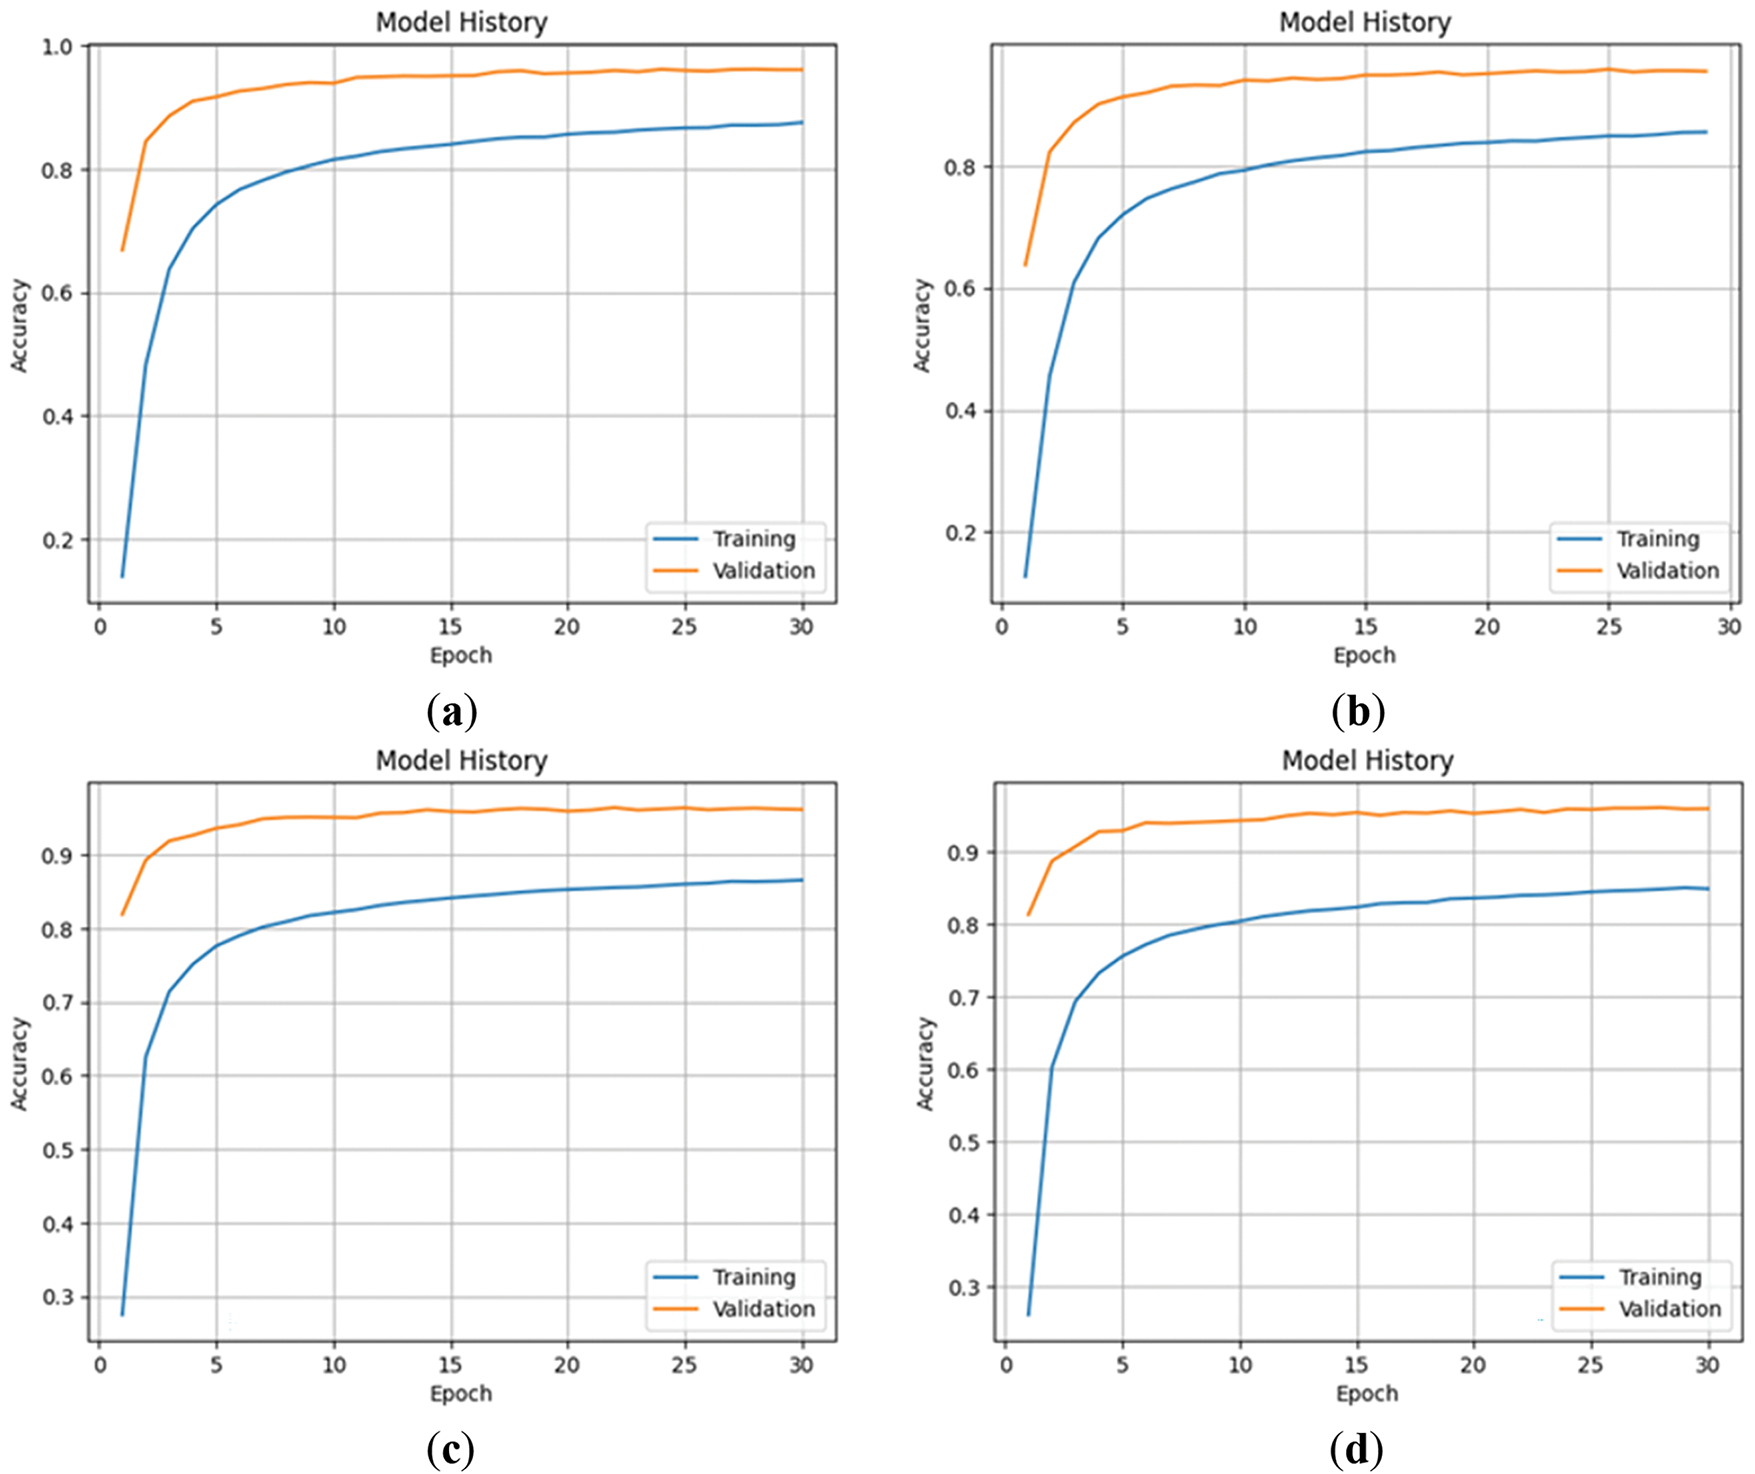
Figure 7: The accuracy of transfer learning stage: (a) no data augmentation; (b) traditional data augmentation; (c) using image background removal for data augmentation; (d) hybrid data augmentation
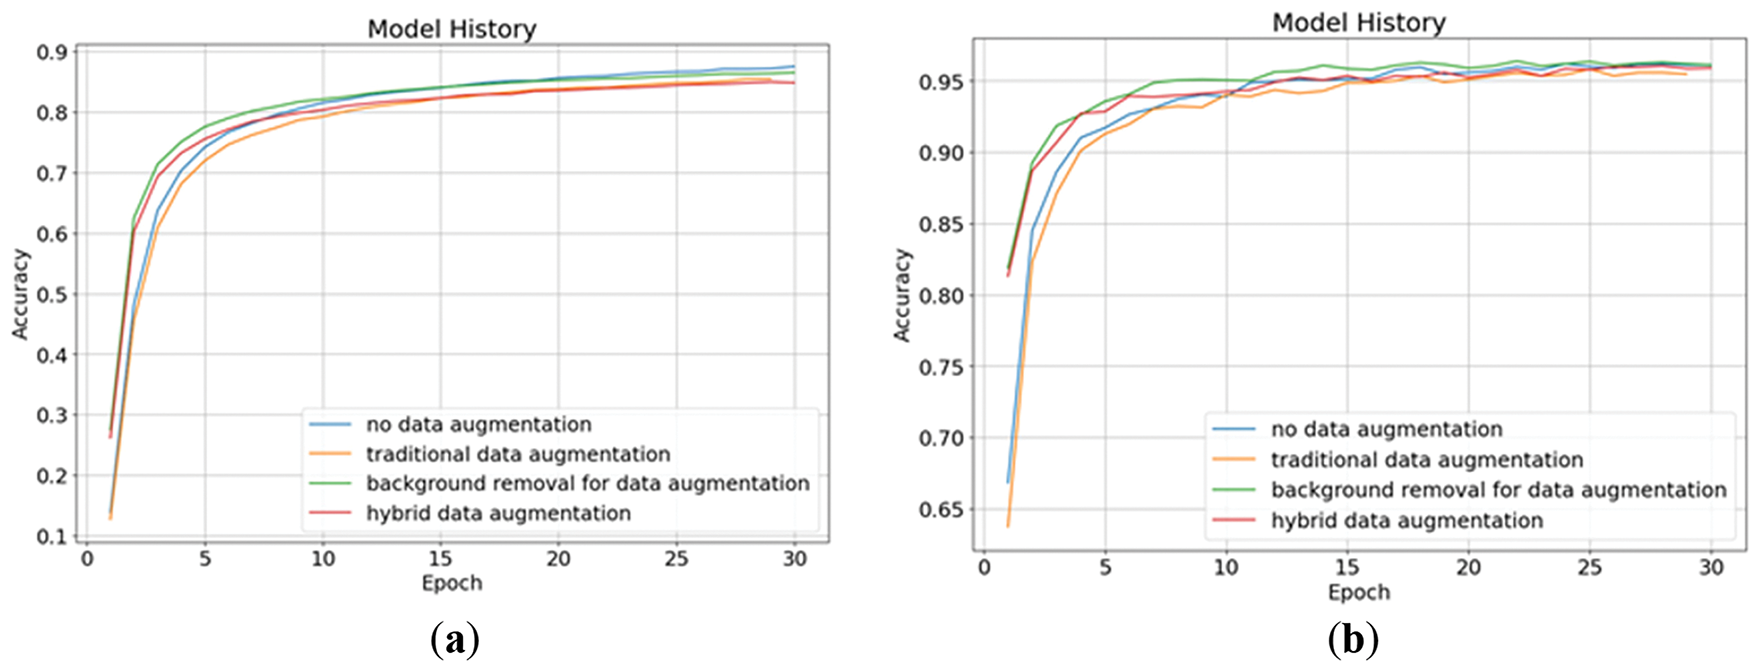
Figure 8: The accuracy of transfer learning stage in four data augmentation methods: (a) training accuracy; (b) validation accuracy
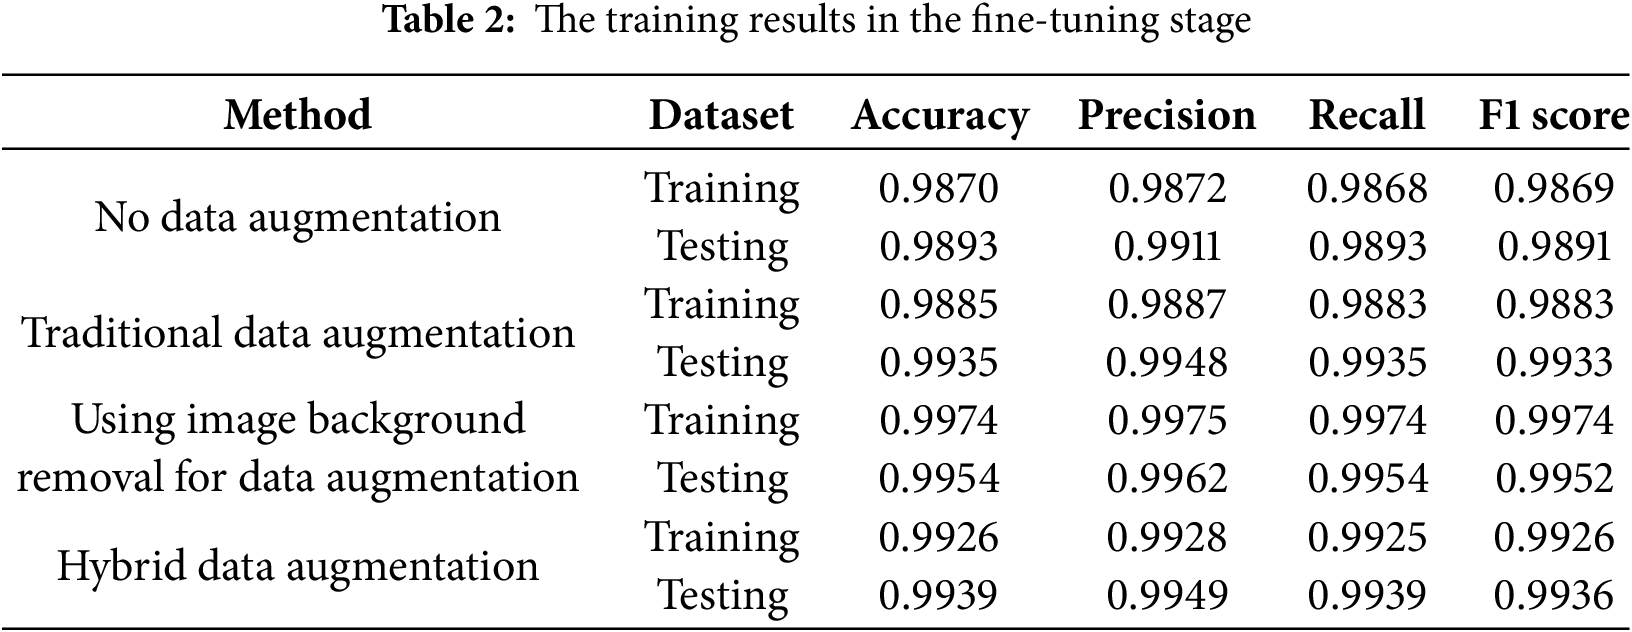
The training results of the four data augmentation methods in the fine-tuning stage are shown in Table 2. From the results, we can see that the model that uses background removal for data augmentation performed best, with an accuracy of 99.54% and a precision of 99.62% on the testing set. The experimental results show that the model’s performance using background removal is significantly better. However, if traditional data augmentation is mixed with background removal, the performance will be worse than using background removal alone. We speculate that the reason is that after the image loses its background, it will look the same even if it is shifted, scaled, rotated, or subjected to other common augmentation techniques. These transformations no longer introduce meaningful variability, as the image content becomes too uniform and lacks contextual diversity. The original purpose of traditional data augmentation is to enrich the dataset with variations that help the model generalize better—for example, by simulating different object positions, scales, or orientations, the model can learn to focus on essential object features rather than being distracted by the surrounding background. However, once the background is removed, this variation is largely diminished. The augmented images become visually similar, which reduces the effectiveness of the augmentation. Instead of promoting robustness, it may introduce redundancy. This lack of meaningful diversity can lead the model to overfit on the repetitive patterns, memorizing specific features rather than learning generalized representations. Consequently, combining traditional data augmentation with background removal may inadvertently harm the training process and degrade overall model performance.
Figs. 9 and 10 show the changes in loss of four data augmentation methods during the fine-tuning stage. It can be seen from the graph that the model starts to get early stopping before the 25th epoch in the training process. Besides the model that uses background removal for data augmentation, the remaining models have not reached a good convergence state. Here we also only give the model 30 epochs and set the early stopping metric to the validation loss. As long as the loss does not decrease for three epochs, early stopping will be triggered. The reason why the model is still not given more patience or more epochs is again to prevent it from overfitting before running on an unknown testing set. We have tested models on higher epochs and found that even though the model’s performance in the validation set and training set has improved, its performance in the testing set has become worse. Therefore, we limit the epoch to 30 and the patience for early stopping to 3, hoping that the model can reach a good convergence state within this range and thus keep the generalization. From the graph here, we can see that only the model using background removal for data augmentation successfully achieved high performance with the validation set and the training set, while the remaining models were early stopped before they showed a good convergence state. Figs. 11 and 12 show the accuracy changes of these models, from which we can also see that they correspond well to the loss changes.
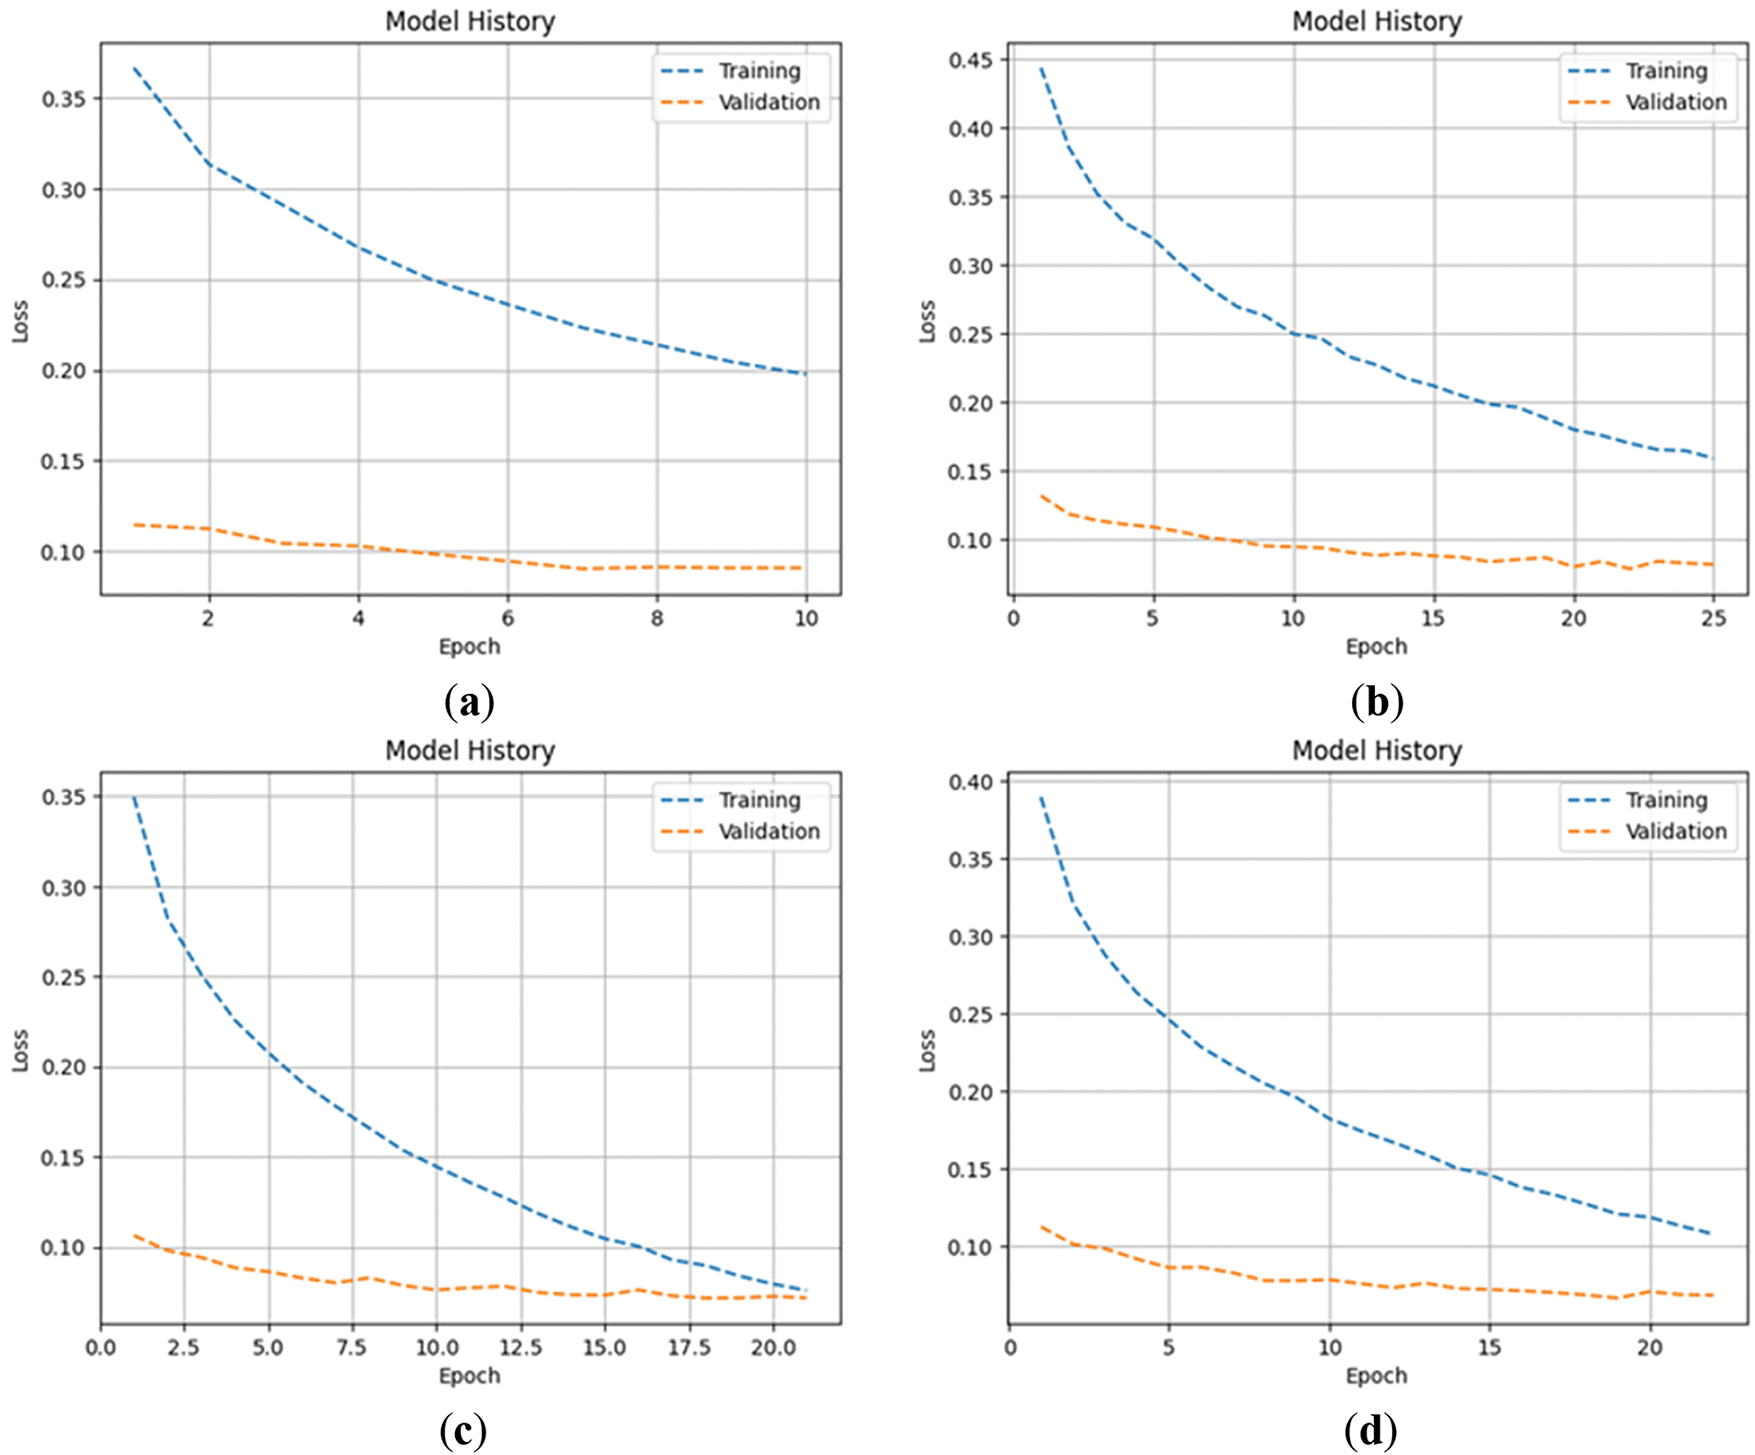
Figure 9: The loss of fine-tuning stage: (a) no data augmentation; (b) traditional data augmentation; (c) using image background removal for data augmentation; (d) hybrid data augmentation
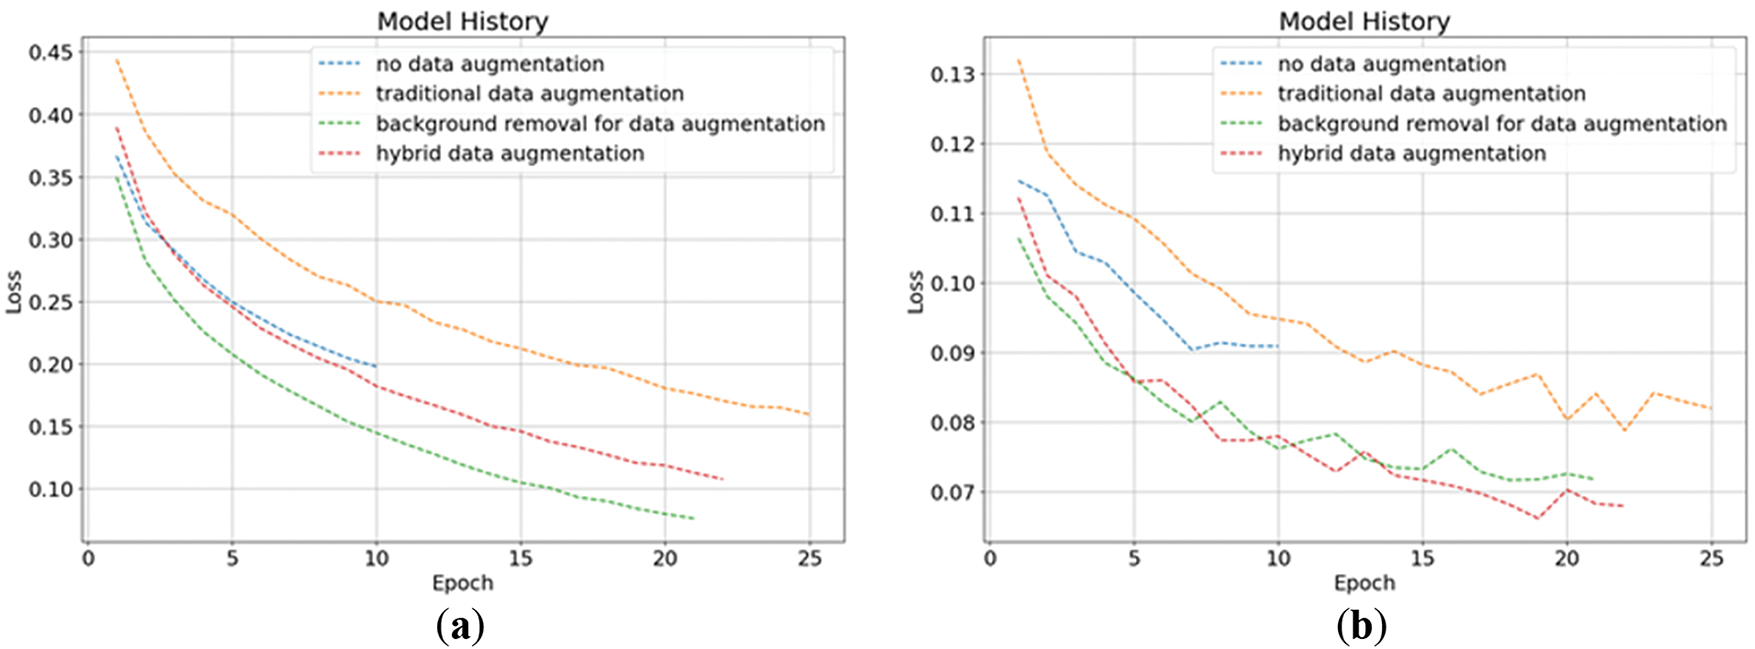
Figure 10: The loss of fine-tuning stage in four data augmentation methods: (a) training loss; (b) validation loss
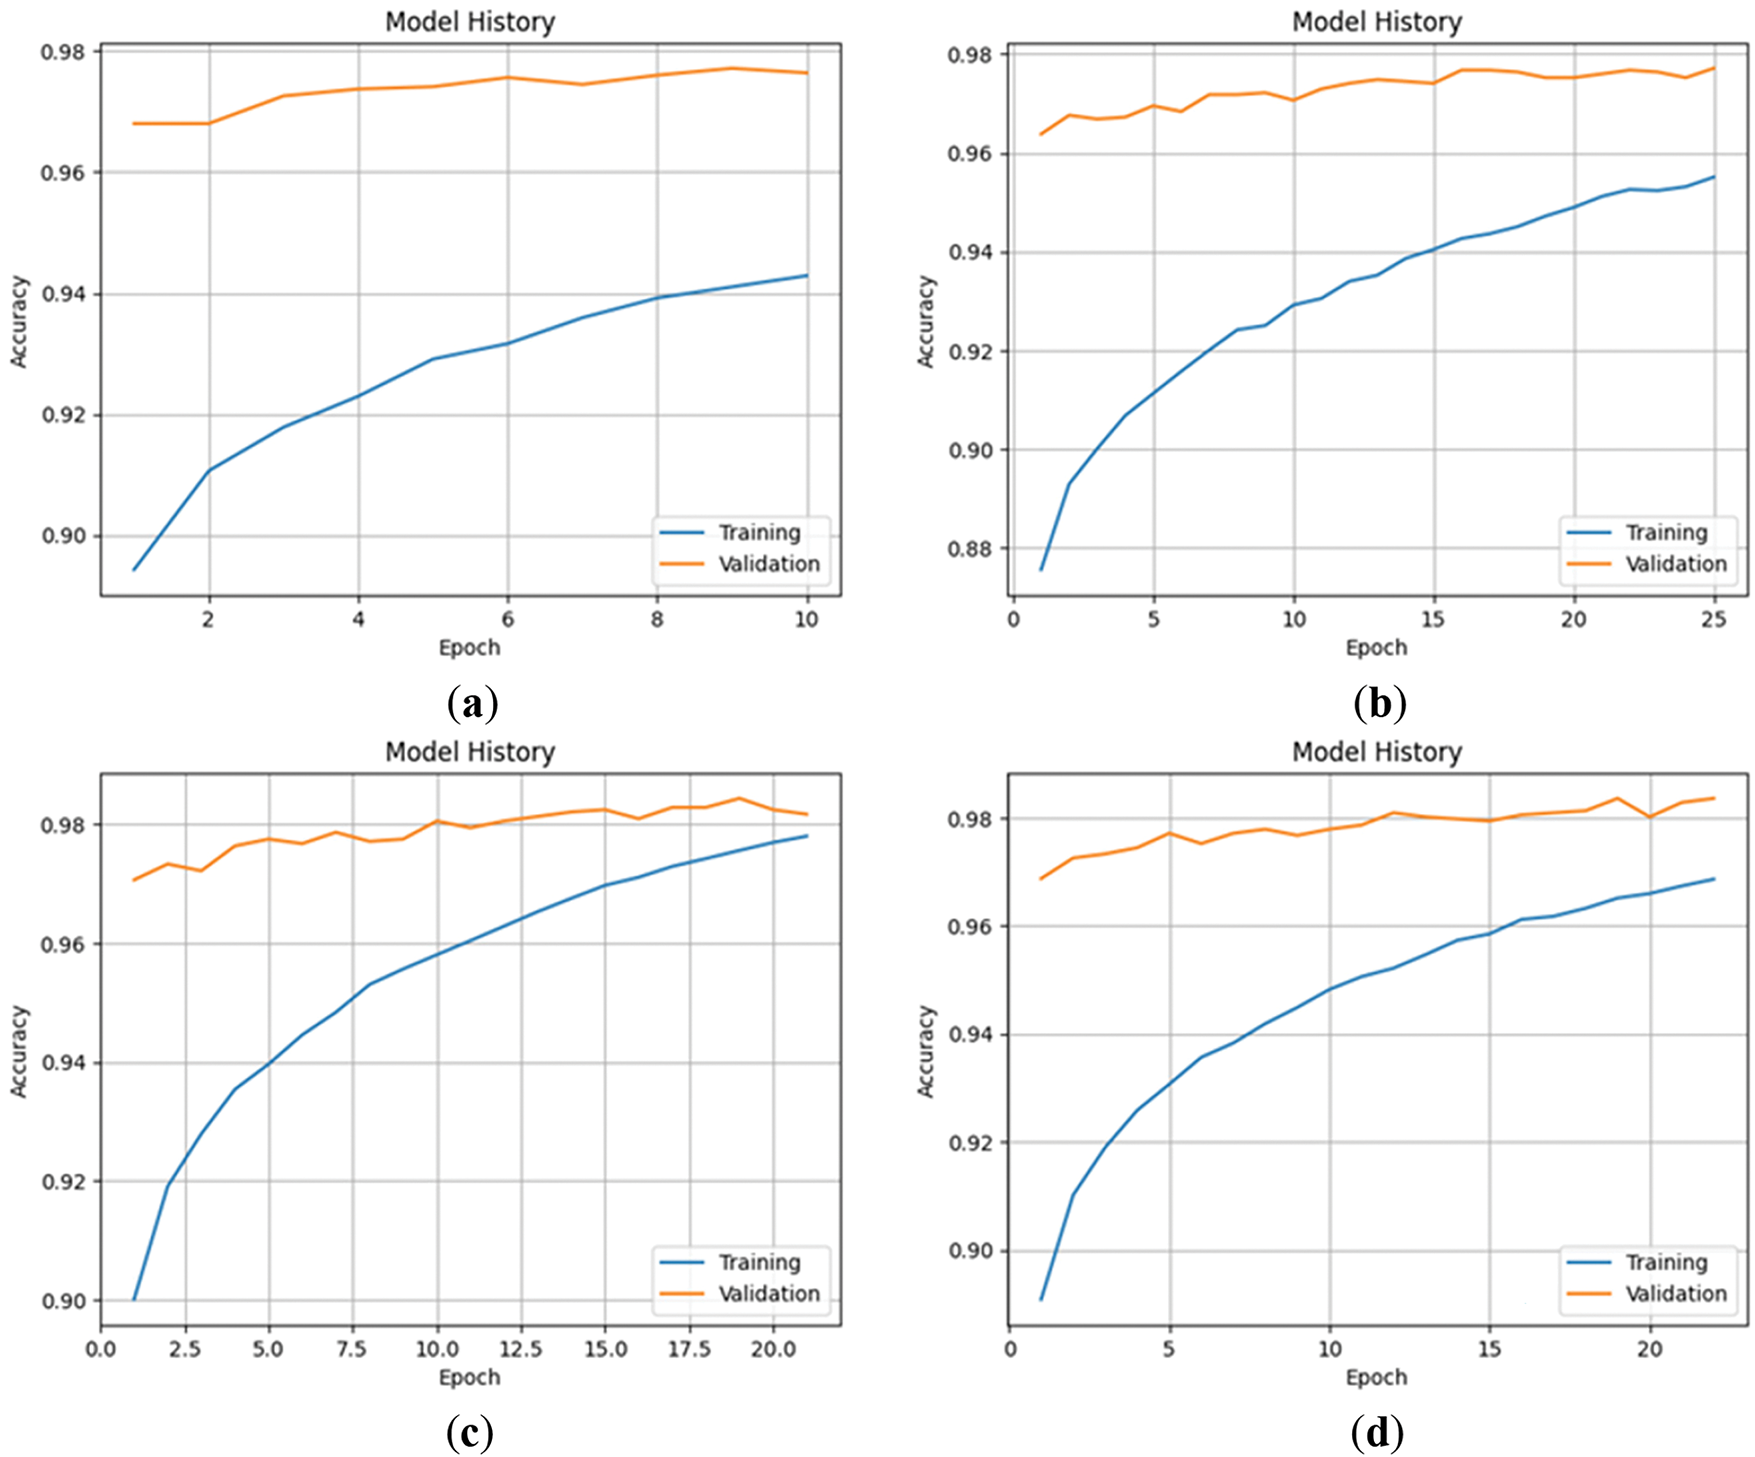
Figure 11: The accuracy of fine-tuning stage: (a) no data augmentation; (b) traditional data augmentation; (c) using image background removal for data augmentation; (d) hybrid data augmentation
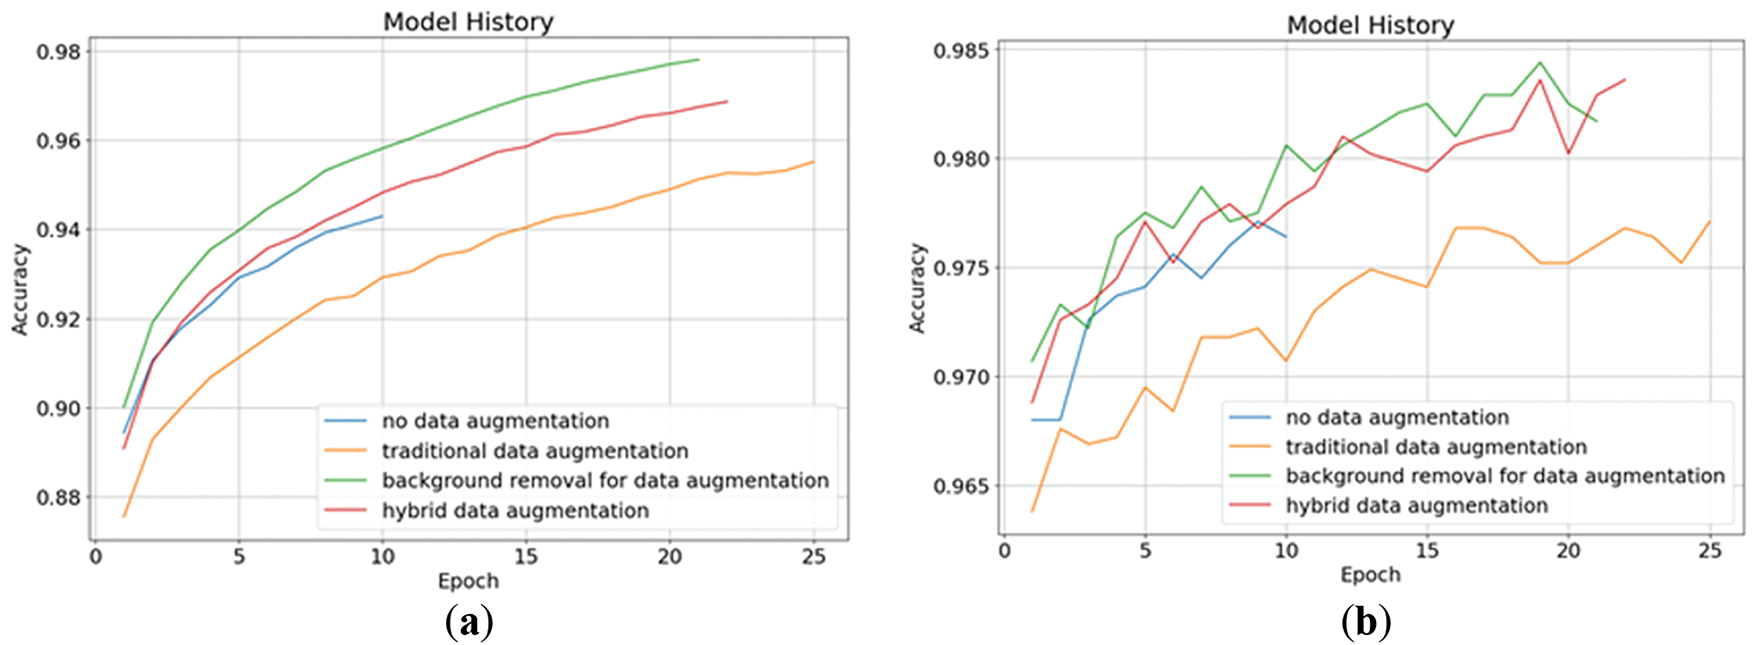
Figure 12: The accuracy of fine-tuning stage in four data augmentation methods: (a) training accuracy; (b) validation accuracy
From the experimental results, we can see that in the transfer learning stage, only the custom layer is trained, which mainly uses the features of the pre-trained model to make classification decisions. Therefore, the performance of all methods is similar. Training the custom layer first will help with the model feature training in the second stage, when different data augmentation methods will produce larger differences. In addition to the training results, another thing we found in our experiments is that using background removal for data augmentation also has a lower cost than other methods during model training. Here we set the batch size of the data to 32. Without any data augmentation, the model needs to be trained for 2645 steps per epoch. This took about 73 s per epoch during the transfer-learning stage and 164 s during the fine-tuning stage. If traditional data augmentation is used, one epoch in the transfer learning stage will take up to 500 s, the same for the fine-tuning stage. If only background removal is used, one epoch in the transfer learning stage will take less than 200 s, and the fine-tuning stage will take 328 s, which is much faster. Therefore, using background removal for data augmentation is a good way to train the model.
We use heatmaps to present the model’s attention distribution and improve the interpretability of the model’s classification. To present the heatmap distribution, we remove the custom layer and directly train a single-layer classification decision layer. Fig. 13 is the heatmaps examples of four data augmentations. We can see that it is difficult to observe the differences directly from the heatmaps. To show the difference, we subtract the first heatmap from the second to fourth heatmaps to find the difference under data augmentation and display it after normalization, as shown in Fig. 14. From the results in Fig. 14b, it can be seen that background removal for data augmentation can clearly highlight the image feature area, and it can more clearly present the impact and credibility of the results.
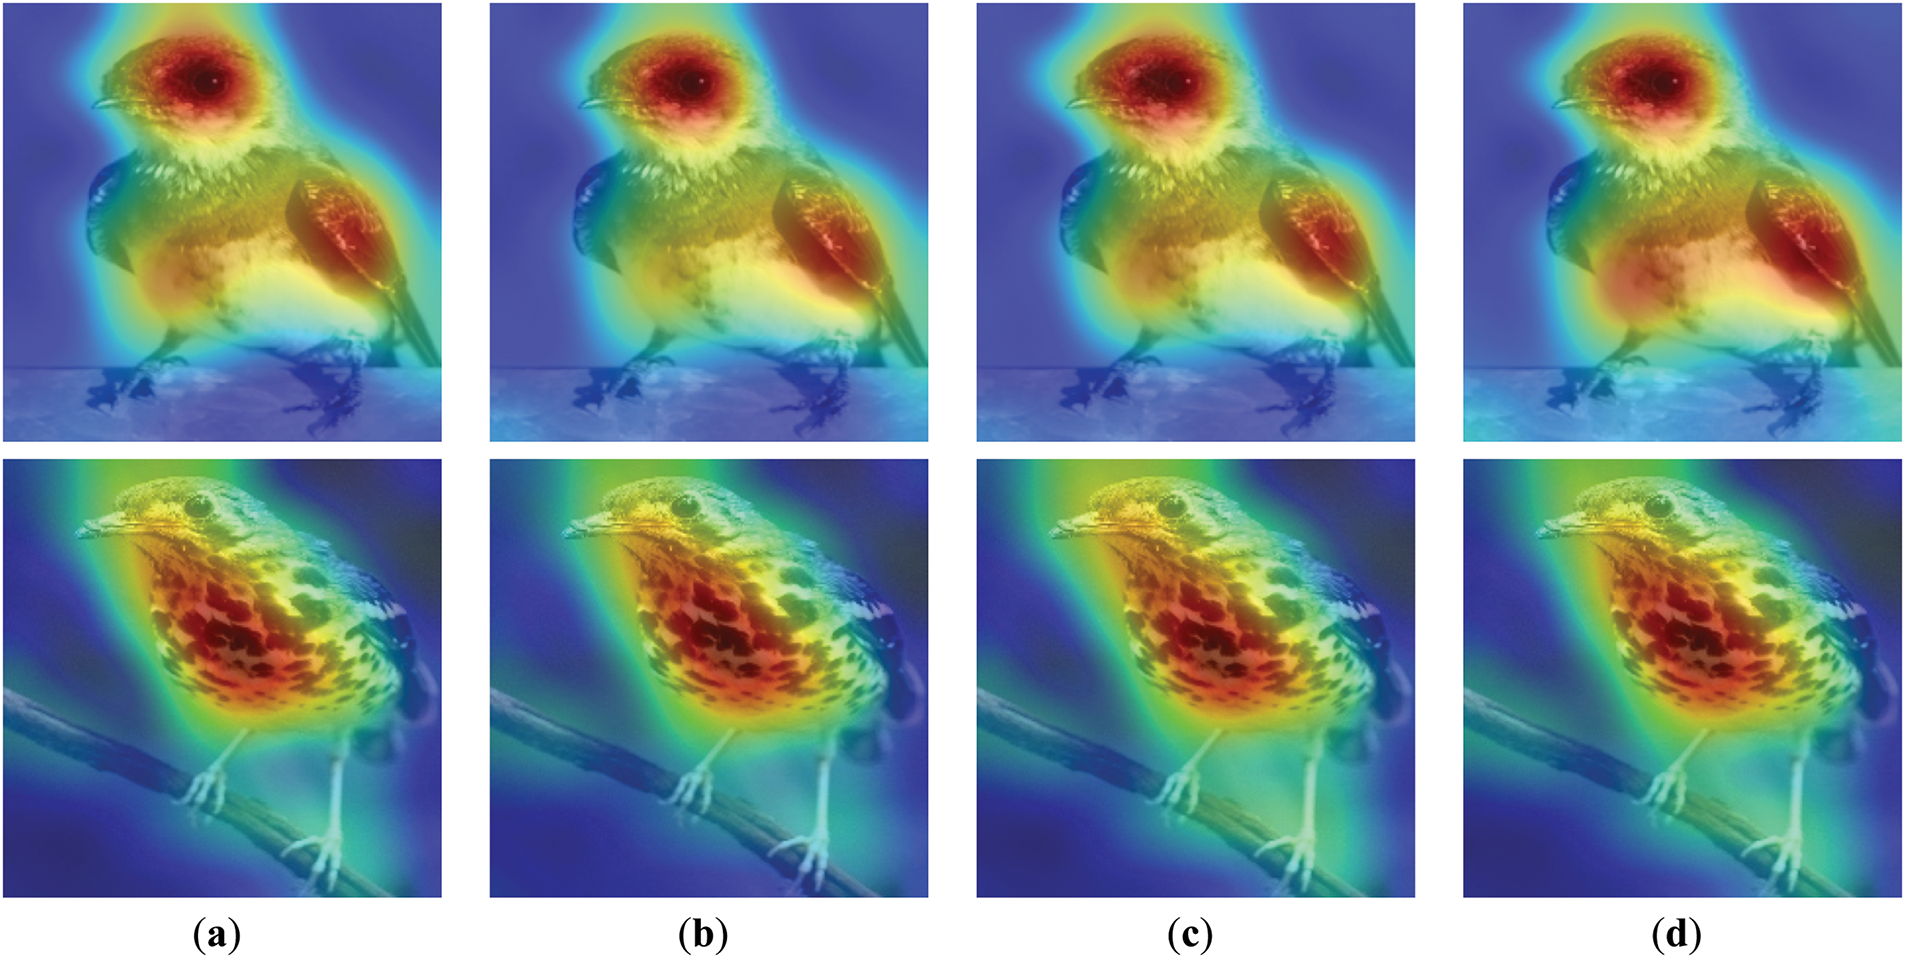
Figure 13: The heatmaps examples of four data augmentation: (a) no data augmentation; (b) traditional data augmentation; (c) using image background removal for data augmentation; (d) hybrid data augmentation
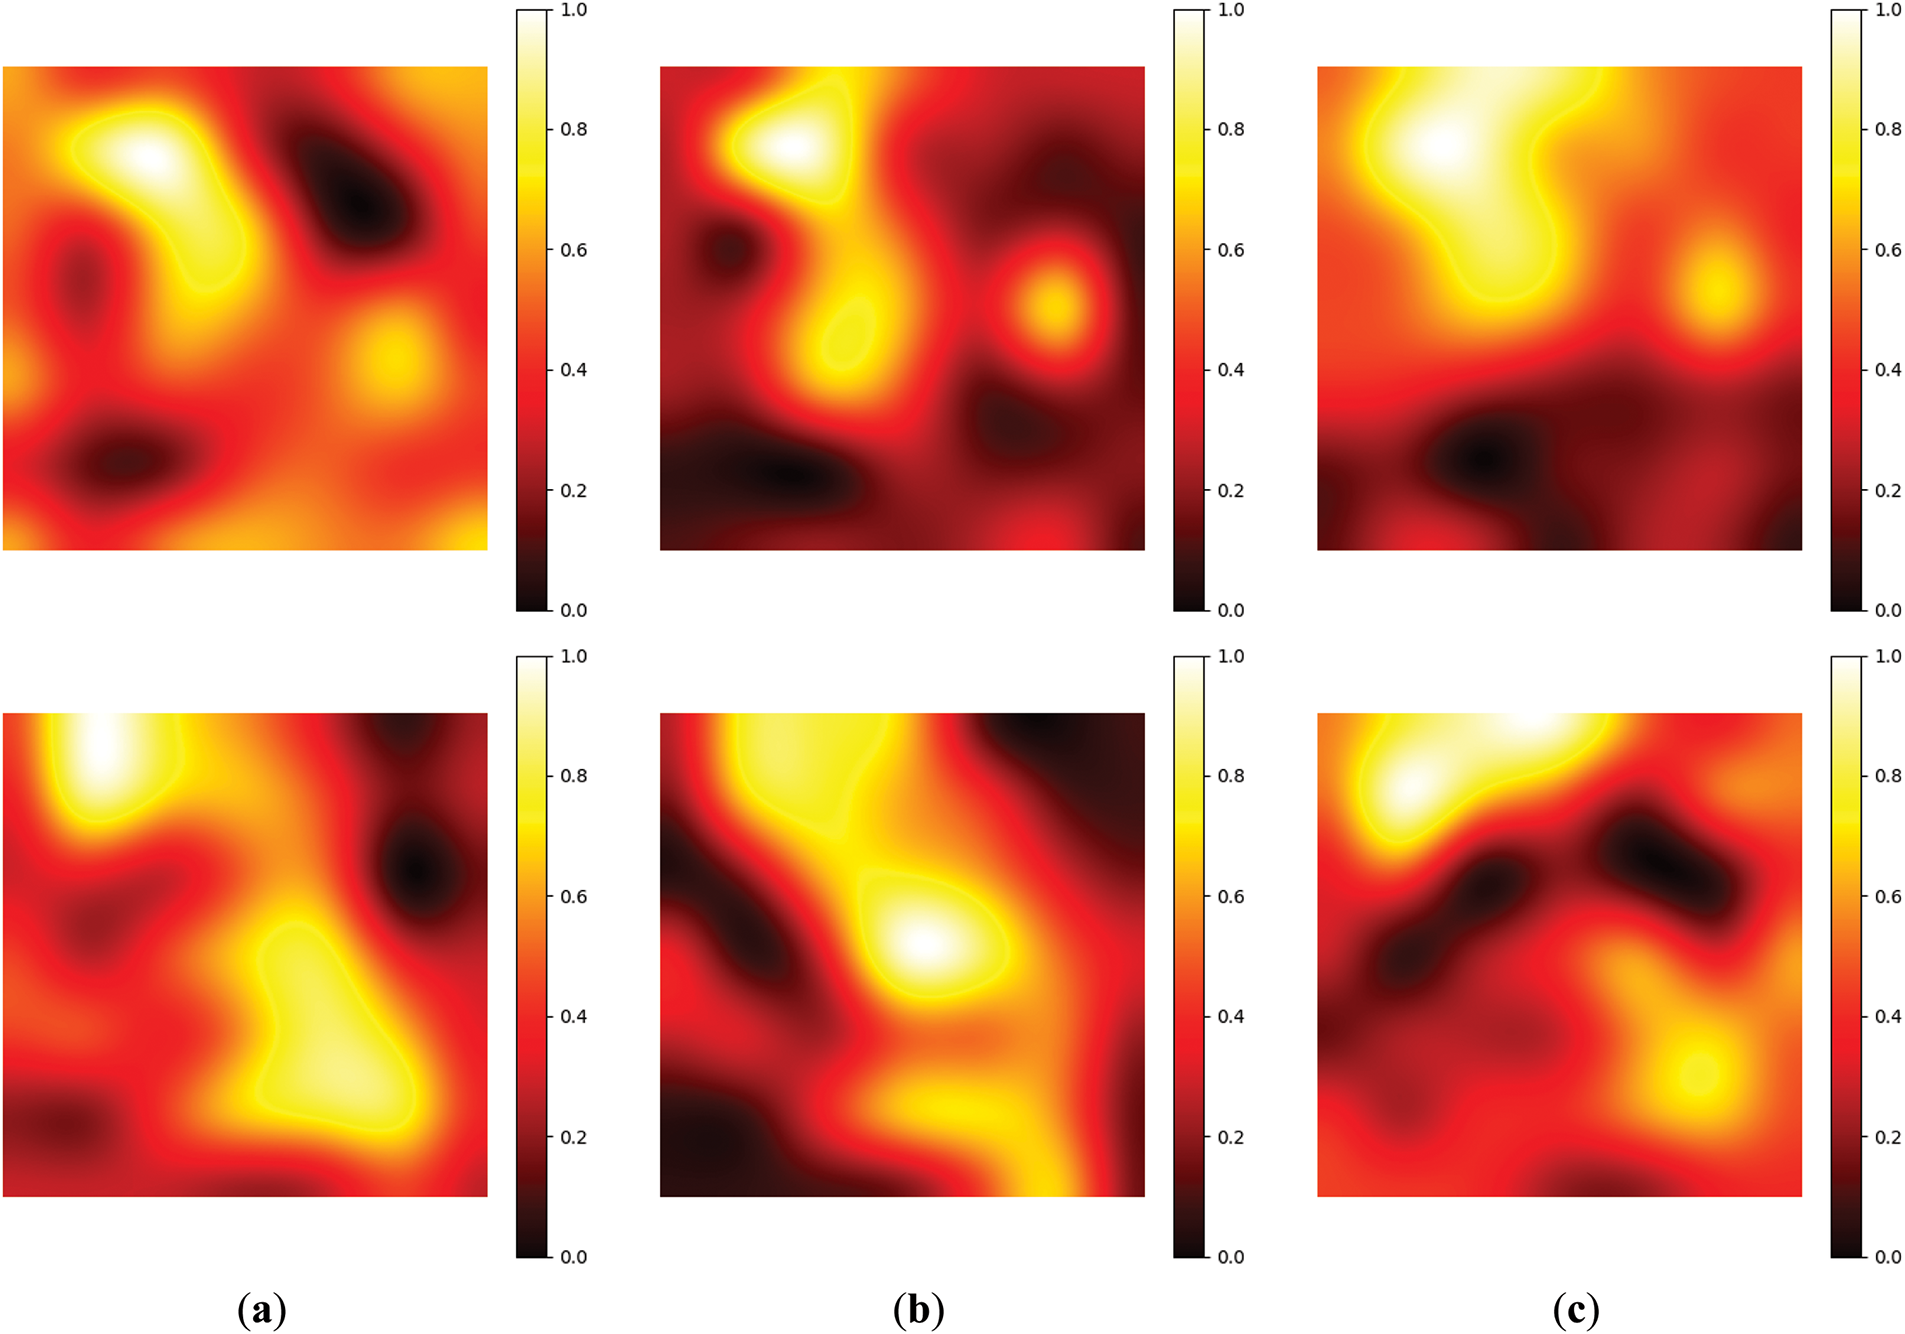
Figure 14: The differences in heatmaps under different data augmentations: (a) the differences between methods 3 and 1; (b) the differences between methods 3 and 2; (c) the differences between methods 3 and 4
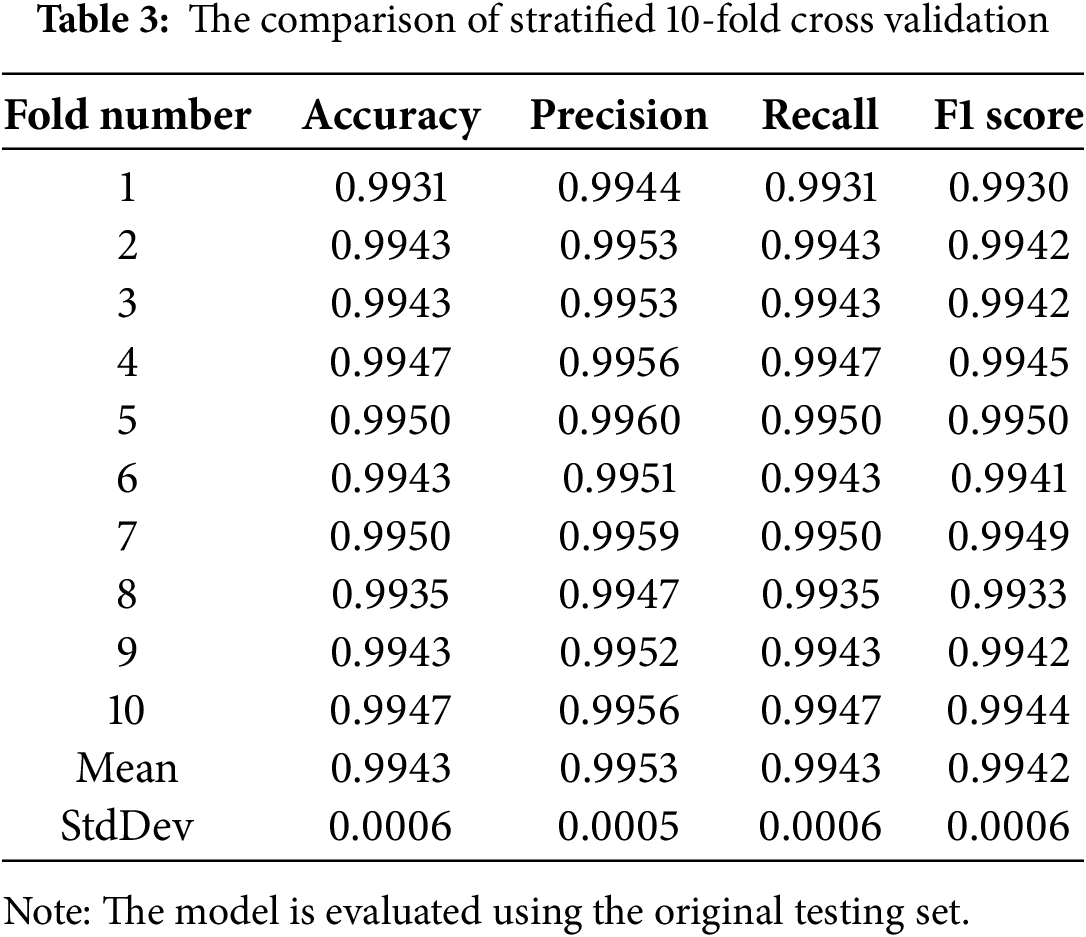
To confirm the credibility of the results, we mix the training set and validation set, using the stratified K-fold method to perform 10-fold cross-validation. The final results are shown in Table 3. The results show that the model using background removal for data augmentation performs well on different data splits and is not much different from the original experimental results. This proved the reliability of our model, with an accuracy of 99.43% and a precision of 99.53% after averaging the result of each split.
In order to further clarify the effects of using image background removal for data augmentation, we show the samples that only the model using data augmentation method 3 can correctly predict, as shown in Fig. 15. From the figure, it can be seen that these birds’ body postures are not traditional standing positions, nor are they common cases seen in our training set. Therefore, models trained without data augmentation and with traditional data augmentation cannot accurately classify these birds based on the features they have learned. In contrast, the model that utilizes background-removed images for data augmentation can classify them correctly. We conjecture that the reason for its accurate classification is that the data augmentation employed during the training process allows the model to focus more on the physical characteristics of the birds, thereby capturing more details. As a result, even if their body postures change, the model can still make correct predictions, achieving a higher accuracy rate.
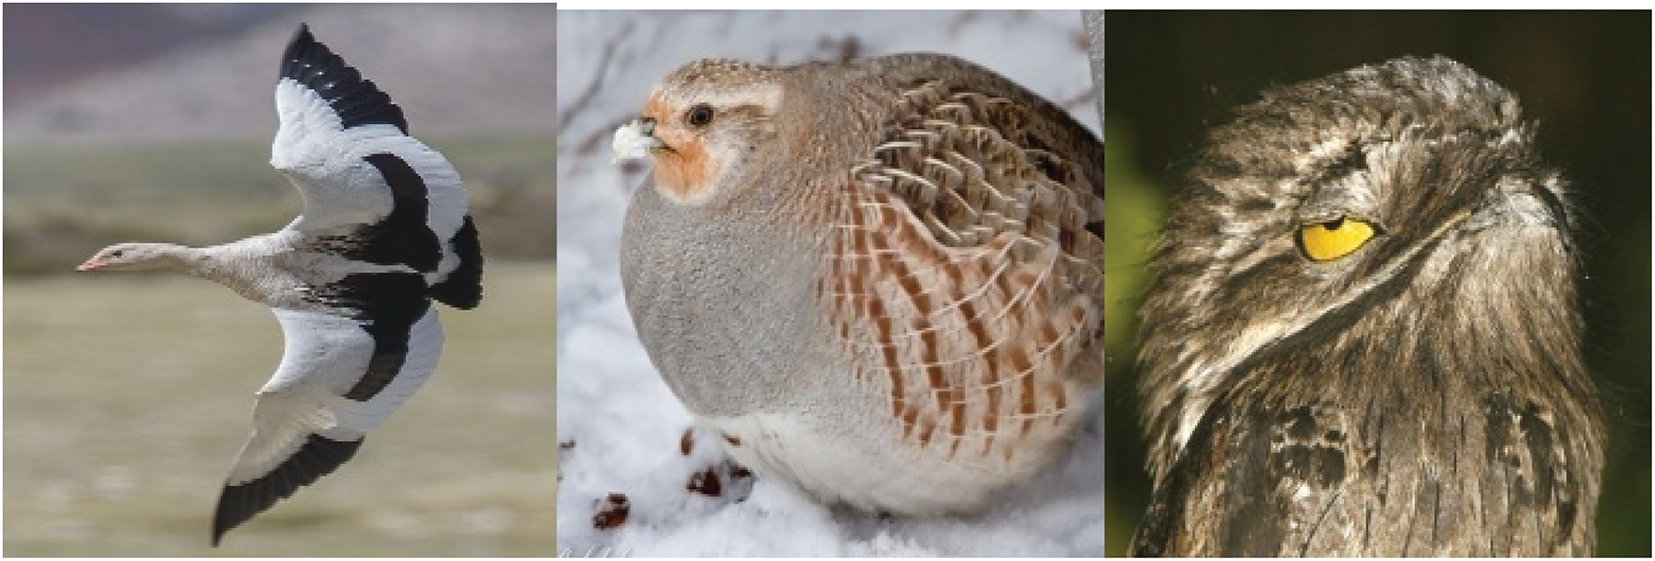
Figure 15: The samples that only the model using data augmentation method 3 can correctly predict
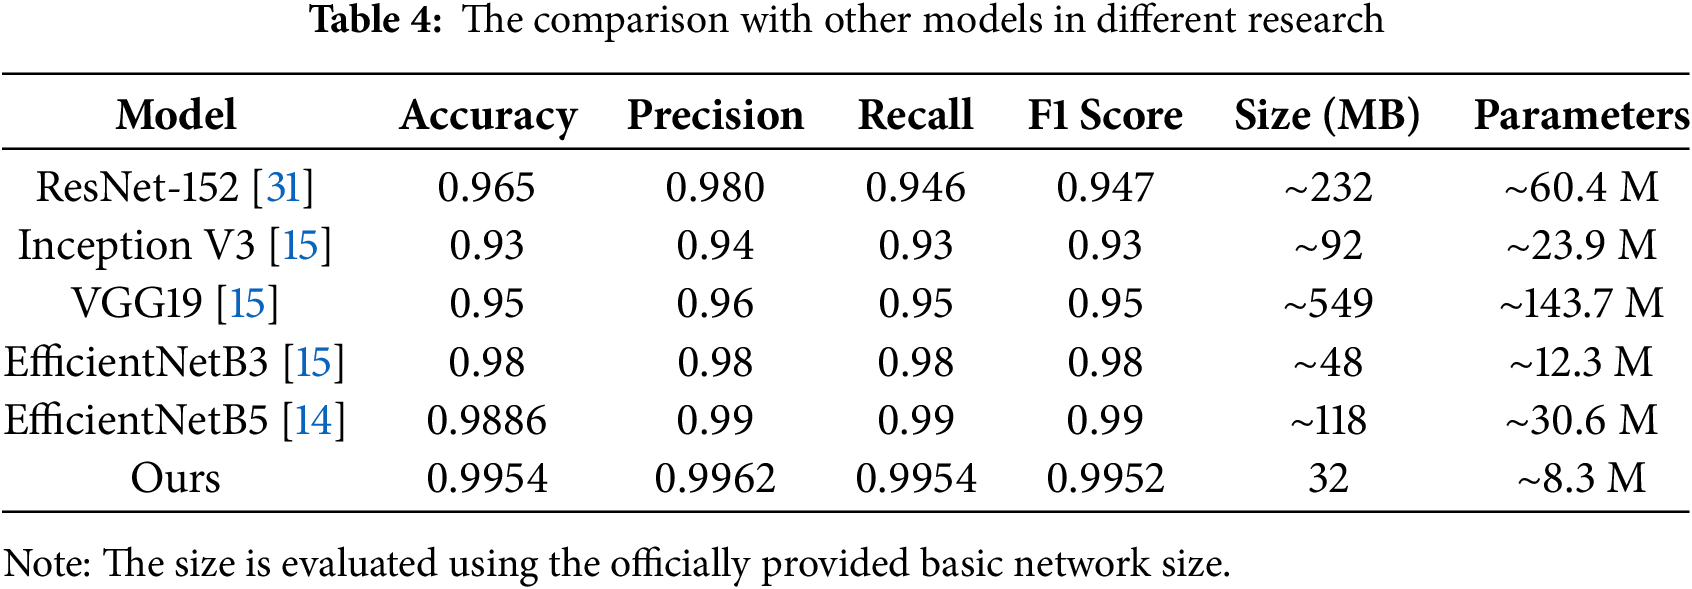
Table 4 shows the comparison with other models in different research. From the comparison results, we can see that our model not only performs best in all metrics but also has the lightest model size. According to Keras [30], the model size of EfficientNetV2B0 only takes 29 MB on the hard disk and reaches 32 MB after adding the newly added custom layer. This is a significant reduction compared to the models used in other researches. Our model requires fewer epochs in the training process and takes less memory in the testing process. It not only meets the needs of general computers but also has the potential to be distributed to different low-level devices for edge computing.
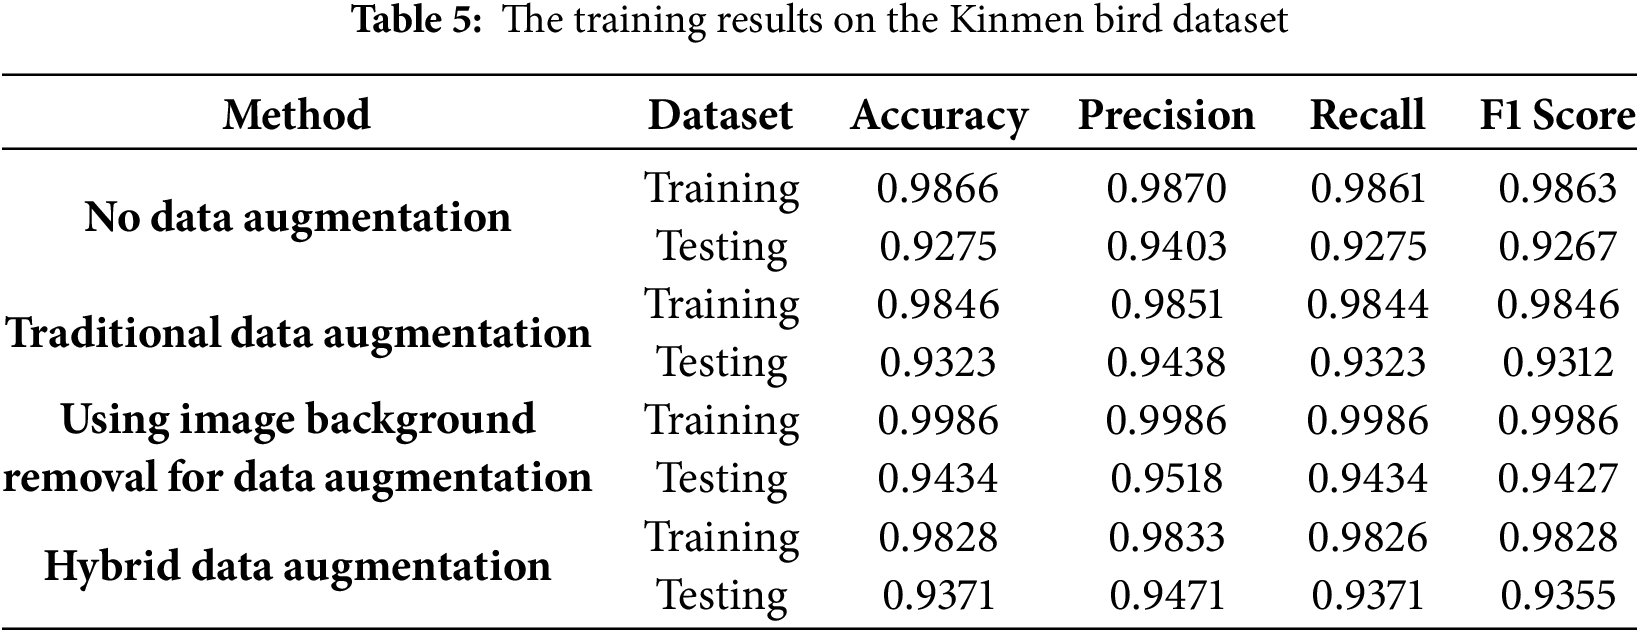
To further test the generalization of the model, we decided to validate the model’s performance on our own dataset. This new dataset we created is based on the bird species of Kinmen Island. This island is rich in different birds, with 251 birds listed in its official bird-watching guide [32] (published by the local government). The data we collected comes from the eBird website [33], which has tons of photo uploads from different people in the real world. Overall, this Kinmen bird species dataset has 251 classes, 41,978 training images, 1255 validation images, and 1255 testing images. With the same split ratio and image size as the 525 bird species dataset. We use the model proposed in this paper for training, and the final results after the fine-tuning stage are shown in Table 5. From the results, we can see that the model using background removal for data augmentation still has better accuracy, which confirms the generalization of the proposed model.
In this paper, we use the EfficientNetV2B0 model for bird species classification, conducting transfer learning on a dataset of 525 bird species, while also using the BiRefNet model to remove backgrounds from images in the training set. This research successfully improved the model performance by removing the background for data augmentation. The model training process can be divided into a transfer learning stage and a fine-tuning stage. In the transfer learning stage, we only need to train the newly added custom layers. In the fine-tuning stage, we need to unfreeze the pre-trained layers. These two stages only require a small number of steps and epochs to reach convergence. Besides that, since the pre-trained model used in this research is the lightest model in the EfficientNetV2 series, we can achieve predictions during operation with low memory consumption. This model not only has an advantage over other models in terms of size but also performs better in different metrics. The model achieved an accuracy of 99.54% and a precision of 99.62%, which can be said that it achieves lightweight while also achieving accuracy. To confirm the credibility of the results, we use heatmaps to interpret the model. The heatmaps show that our model can clearly highlight the image feature area. In addition, we also perform the 10-fold cross-validation on the model to verify its credibility.
The current results not only confirm the effectiveness of combining background removal with the CNN model, but also lay the foundation for practical applications. This integration has demonstrated significant improvements in classification accuracy and model robustness, especially in complex natural environments where background noise can severely hinder performance. In the future, we hope to further integrate the model of this research with edge computing so that it can be deployed on resource-constrained devices for immediate applications in scenarios such as biodiversity monitoring and automatic detection in natural environments. Such integration would allow for real-time analysis in the field, reducing the need for data transmission to centralized servers and enabling more responsive and autonomous monitoring systems. In addition, we also hope to introduce the design of explainable models in future research to make the model’s judgment process more transparent and understandable. By incorporating explainable artificial intelligence (XAI) techniques, we aim to visualize the decision-making process of the model, identify which features contribute most to each classification, and provide interpretable insights for domain experts. This transparency is critical for building trust with ecologists and other users, as it not only helps validate the credibility of the results but also encourages collaborative refinement of the model. Ultimately, we believe these directions will further promote the actual implementation and innovative development of machine learning in the domain of ecological monitoring and image classification, contributing to both scientific research and real-world environmental conservation efforts.
Acknowledgement: Not applicable.
Funding Statement: The authors received no specific funding for this study.
Author Contributions: The authors confirm contribution to the paper as follows: Conceptualization, Yu-Xiang Zhao and Yi Lee; methodology, Yu-Xiang Zhao; software, Yi Lee; validation, Yi Lee; formal analysis, Yu-Xiang Zhao; data curation, Yi Lee; writing—original draft preparation, Yu-Xiang Zhao and Yi Lee; writing—review and editing, Yu-Xiang Zhao and Yi Lee; visualization, Yi Lee; supervision, Yu-Xiang Zhao; project administration, Yu-Xiang Zhao. All authors reviewed the results and approved the final version of the manuscript.
Availability of Data and Materials: The data that support the findings of this study are openly available in BIRDS-525-SPECIES-IMAGE-CLASSIFICATION at https://github.com/LeeYi-user/BIRDS-525-SPECIES-IMAGE-CLASSIFICATION and Kinmen Bird Dataset at https://github.com/LeeYi-user/KinmenBirdDataset (accessed on 13 May 2025).
Ethics Approval: Not applicable.
Conflicts of Interest: The authors declare no conflicts of interest to report regarding the present study.
References
1. LeCun Y, Bottou L, Bengio Y, Haffner P. Gradient-based learning applied to document recognition. Proc IEEE. 1998;86(11):2278–324. doi:10.1109/5.726791. [Google Scholar] [CrossRef]
2. Krizhevsky A, Sutskever I, Hinton GE. ImageNet classification with deep convolutional neural networks. Adv Neural Inf Process Syst. 2012;25(6):1097–105. doi:10.1145/3065386. [Google Scholar] [CrossRef]
3. Ioffe S, Szegedy C. Batch normalization: accelerating deep network training by reducing internal covariate shift. In: Proceedings of the 32nd International Conference on Machine Learning; 2015 Jul 6–11; Lille, France. p. 448–56. [Google Scholar]
4. Simonyan K, Zisserman A. Very deep convolutional networks for large-scale image recognition. arXiv:1409.1556. 2014. [Google Scholar]
5. He K, Zhang X, Ren S, Sun J. Deep residual learning for image recognition. In: Proceedings of the 2016 IEEE Conference on Computer Vision and Pattern Recognition (CVPR); 2016 Dec 27–30; Las Vegas, NV, USA. [Google Scholar]
6. Szegedy C, Liu W, Jia Y, Sermanet P, Reed S, Anguelov D, et al. Going deeper with convolutions. In: Proceedings of the 2015 IEEE Conference on Computer Vision and Pattern Recognition (CVPR); 2015 Jun 7–12; Boston, MA, USA. [Google Scholar]
7. Tan M, Le Q. EfficientNet: rethinking model scaling for convolutional neural networks. In: Proceedings of the 36th International Conference on Machine Learning; 2019 Jun 9–15; Long Beach, CA, USA. [Google Scholar]
8. Zoph B, Le QV. Neural architecture search with reinforcement learning. arXiv:1611.01578. 2016. [Google Scholar]
9. Hu J, Shen L, Sun G. Squeeze-and-excitation networks. In: Proceedings of the 2018 IEEE/CVF Conference on Computer Vision and Pattern Recognition; 2018 Jun 18–23; Salt Lake City, UT, USA. [Google Scholar]
10. Sandler M, Howard A, Zhu M, Zhmoginov A, Chen LC. MobileNetV2: inverted residuals and linear bottlenecks. In: Proceedings of the 2018 IEEE/CVF Conference on Computer Vision and Pattern Recognition (CVPR); 2018 Jan 13; Salt Lake City, UT, USA. [Google Scholar]
11. Tan M, Le Q. EfficientNetV2: smaller models and faster training. In: Proceedings of the International Conference on Machine Learning; 2021 Jul 18–24; PMLR. p. 10096–106. [Google Scholar]
12. Pan SJ, Yang Q. A survey on transfer learning. IEEE Trans Knowl Data Eng. 2010;22(10):1345–59. doi:10.1109/TKDE.2009.191. [Google Scholar] [CrossRef]
13. Piosenka G. Birds 525 species-image classifcation; 2022 [cited 2025 Apr 10]. Available from: https://www.kaggle.com/datasets/gpiosenka/100-bird-species. [Google Scholar]
14. Mochurad L, Svystovych S. A new efficient classifier for bird classification based on transfer learning. J Eng. 2024;2024(1):8254130. doi:10.1155/2024/8254130. [Google Scholar] [CrossRef]
15. Vo HT, Thien NN, Mui KC. Bird detection and species classification: using YOLOv5 and deep transfer learning models. Int J Adv Comput Sci Appl. 2023;14(7):939–47. doi:10.14569/IJACSA.2023.01407102. [Google Scholar] [CrossRef]
16. Szegedy C, Vanhoucke V, Ioffe S, Shlens J, Wojna Z. Rethinking the inception architecture for computer vision. In: Proceedings of the 2016 IEEE Conference on Computer Vision and Pattern Recognition (CVPR); 2016 Jun 23–30; Las Vegas, NV, USA. [Google Scholar]
17. Kingma DP, Ba J. Adam: a method for stochastic optimization; arXiv:1412.6980. 2014. [Google Scholar]
18. Goodfellow I, Pouget-Abadie J, Mirza M, Xu B, Warde-Farley D, Ozair S, et al. Generative adversarial nets. Adv Neural Inf Process Syst. 2014;27(11):2672–80. doi:10.1145/3422622. [Google Scholar] [CrossRef]
19. Perez L, Wang J. The effectiveness of data augmentation in image classification using deep learning. arXiv:1712.04621. 2017. [Google Scholar]
20. Vaswani A, Shazeer N, Parmar N, Uszkoreit J, Jones L, Gomez AN, et al. Attention is all you need. Adv Neural Inf Process Syst. 2017;30:5998–6008. [Google Scholar]
21. Dosovitskiy A, Beyer L, Kolesnikov A, Weissenborn D, Zhai X, Unterthiner T, et al. An image is worth 16 × 16 words: transformers for image recognition at scale. arXiv:2010.11929. 2020. [Google Scholar]
22. Liu Z, Lin Y, Cao Y, Hu H, Wei Y, Zhang Z, et al. Swin transformer: hierarchical vision transformer using shifted windows. In: Proceedings of the 2021 IEEE/CVF International Conference on Computer Vision (ICCV); 2021 Oct 10–17; Montreal, QC, Canada. [Google Scholar]
23. Chou PY, Kao YY, Lin CH. Fine-grained visual classification with high-temperature refinement and background suppression. arXiv:2303.06442. 2023. [Google Scholar]
24. Wang Y, Xu C, Wang Y, Wang X, Ding W. Graph-in-graph discriminative feature enhancement network for fine-grained visual classification. Appl Intell. 2025;55(1):22. doi:10.1007/s10489-024-05846-8. [Google Scholar] [CrossRef]
25. Wang Y, Xu C, Wang Y, Wang X, Ding W. Adversarially attack feature similarity for fine-grained visual classification. Appl Soft Comput. 2024;163:111945. doi:10.1016/j.asoc.2024.111945. [Google Scholar] [CrossRef]
26. Liang J, Liu Y, Vlassov V. The impact of background removal on performance of neural networks for fashion image classification and segmentation. In: Proceedings of the 2023 Congress in Computer Science, Computer Engineering, & Applied Computing (CSCE); 2023 Jul 24–27; Las Vegas, NV, USA. [Google Scholar]
27. Qin X, Zhang Z, Huang C, Dehghan M, Zaiane OR, Jagersand M. U2-Net: going deeper with nested U-structure for salient object detection. Pattern Recognit. 2020;106:107404. doi:10.1016/j.patcog.2020.107404. [Google Scholar] [CrossRef]
28. Zheng P, Gao D, Fan DP, Liu L, Laaksonen J, Ouyang W, et al. Bilateral reference for high-resolution dichotomous image segmentation. arXiv:2401.03407. 2024. [Google Scholar]
29. Lab C. NABirds dataset [Internet]. [cited 2025 Apr 10]. Available from: https://dl.allaboutbirds.org/nabirds. [Google Scholar]
30. Keras. EfficientNetV2B0 [Internet]. [cited 2025 Apr 10]. Available from: https://keras.io/api/applications. [Google Scholar]
31. Song H. Bird image classification based on improved ResNet-152 image classification model. Appl Comput Eng. 2024;54(1):206–12. doi:10.54254/2755-2721/54/20241530. [Google Scholar] [CrossRef]
32. Transportation Bureau of Kaohsiung City Government. Bird watching in Kinmen (Guide to bird watching in Kinmen). Kinmen, Taiwan: Kinmen County Government; 2008. [Google Scholar]
33. Sullivan BL, Wood CL, Iliff MJ, Bonney RE, Fink D, Kelling S. eBird: a citizen-based bird observation network in the biological sciences. Biol Conserv. 2009;142(10):2282–92. doi:10.1016/j.biocon.2009.05.006. [Google Scholar] [CrossRef]
Cite This Article
 Copyright © 2025 The Author(s). Published by Tech Science Press.
This work is licensed under a Creative Commons Attribution 4.0 International License , which permits unrestricted use, distribution, and reproduction in any medium, provided the original work is properly cited.
 Downloads
 Citation Tools