
 Submit a Paper
 Propose a Special lssue
 Open Access
ARTICLE
A Machine Learning-Based Framework for Heart Disease Diagnosis Using a Comprehensive Patient Cohort
1 Department of Electronics Engineering Technology, Shuhada-e-APS University of Technology, Nowshera, 24170, Pakistan
2 Department of Electrical Engineering, University of Engineering & Technology, Mardan, 02323, Pakistan
3 Department of Business and Management, University of Chester, Chester, 01244, UK
4 Department of Electrical Engineering Technology, Shuhada-e-APS University of Technology, Nowshera, 24170, Pakistan
5 Department of Computer Science, Shaheed Benazir Bhutto Women University, Peshawar, 25000, Pakistan
6 Department of Electrical Engineering, COMSATS University Islamabad, Abbottabad Campus, Abbottabad, 22060, Pakistan
7 Department of Information Systems, College of Computer and Information Sciences, Princess Nourah bint Abdulrahman University, P.O. Box 84428, Riyadh, 11671, Saudi Arabia
* Corresponding Author: Amal Al-Rasheed. Email:
Computers, Materials & Continua 2025, 84(1), 1253-1278. https://doi.org/10.32604/cmc.2025.065423
Received 12 March 2025; Accepted 21 April 2025; Issue published 09 June 2025
 View Full Text
 Download PDF
Abstract
Early and accurate detection of Heart Disease (HD) is critical for improving patient outcomes, as HD remains a leading cause of mortality worldwide. Timely and precise prediction can aid in preventive interventions, reducing fatal risks associated with misdiagnosis. Machine learning (ML) models have gained significant attention in healthcare for their ability to assist professionals in diagnosing diseases with high accuracy. This study utilizes 918 instances from publicly available UCI and Kaggle datasets to develop and compare the performance of various ML models, including Adaptive Boosting (AB), Naïve Bayes (NB), Extreme Gradient Boosting (XGB), Bagging, and Logistic Regression (LR). Before model training, data preprocessing techniques such as handling missing values, outlier detection using Isolation Forest, and feature scaling were applied to improve model performance. The evaluation was conducted using performance metrics, including accuracy, precision, recall, and F1-score. Among the tested models, XGB demonstrated the highest predictive performance, achieving an accuracy of 94.34% and an F1-score of 95.19%, surpassing other models and previous studies in HD prediction. LR closely followed with an accuracy of 93.08% and an F1-score of 93.99%, indicating competitive performance. In contrast, NB exhibited the lowest performance, with an accuracy of 88.05% and an F1-score of 89.02%, highlighting its limitations in handling complex patterns within the dataset. Although ML models show superior performance as compared to previous studies, some limitations exist, including the use of publicly available datasets, which may not fully capture real-world clinical variations, and the lack of feature selection techniques, which could impact model interpretability and robustness. Despite these limitations, the findings highlight the potential of ML-based frameworks for accurate and efficient HD detection, demonstrating their value as decision-support tools in clinical settings.Keywords
Artificial Intelligence (AI) encompasses a range of computing advancements that mimic human intelligence, including cognition, deep learning, and adaptability. In healthcare, AI has garnered attention for its potential in disease detection, diagnosis, treatment recommendations, and surgical assistance. AI systems aid healthcare providers in making timely and informed decisions by the analysis of vast amounts of data and thereby identifying patterns that might escape human observation [1].
Within the realm of AI, Machine Learning (ML) has proved to be a viable approach for disease detection [2], offering great potential in improving diagnostic capabilities such as identifying skin cancer [3], Alzheimer’s disease [4], diabetes [5], breast cancer [6], pancreatic cancer [7], heart disease (HD) [8], liver ailments [9], and brain tumor classification [10,11]. ML’s capacity to process diverse medical data enables quicker and more precise diagnoses, ultimately leading to enhanced healthcare outcomes. Among these diseases, HD is also a major global cause of mortality, accounting for approximately 31% of all deaths [12]. Patients face numerous challenges in diagnosing and treating HD, particularly in resource-limited settings where access to diagnostic centers and skilled medical professionals is limited. Common risk factors, including high cholesterol levels, diabetes and elevated blood pressure further complicate detection. Prompt and accurate diagnosis of the disease is very crucial for effective treatment, thus preventing additional complications. ML techniques offer promise in enhancing disease diagnosis by processing extensive medical data and generating precise predictions. Machine learning (ML) models are increasingly being utilized in the medical field, including the detection of cardiovascular diseases (CVD), to improve the accuracy and efficiency of diagnosis, ultimately leading to better patient outcomes and reduced healthcare costs. Various studies have proposed different ML models, each with distinct strengths and limitations [13–15]. However, this study aims to evaluate multiple ML models to identify the most effective approach for accurately predicting the presence of HD. A review of existing research on HD diagnosis using ML reveals several limitations and areas for improvement. The most common shortcomings in these studies are outlined below:
i. The dataset contains outliers that must be handled before model training.
ii. None of the studies reviewed utilized bagging classifier for HD diagnosis. In this research, in addition to LR, XGB, ADB, and NB, the performance of bagging classifier has been evaluated for HD diagnosis.
iii. Many studies only reported accuracy as the performance evaluation metric (PEM). For medical diagnosis tasks, additional metrics like recall, precision and F1-score are necessary to evaluate the model’s reliability.
iv. The PEM scores reported in previous studies were lower than expected, requiring further enhancement for effective HD diagnosis.
To enhance the precision and accuracy of HD classification, this study focuses on addressing these limitations through the following contributions:
i. Outliers in the dataset were detected using the isolation forest technique and subsequently removed to enhance model performance.
ii. Considering the advantage of bagging classifier in diagnosing other diseases, this study evaluates its effectiveness for HD diagnosis in addition to LR, XGB, ADB, and NB.
iii. In addition to accuracy, other key PEMs like confusion matrix, F1-score, precision and recall are used to assess the reliability of ML models for HD diagnosis.
iv. The models used in this research achieved the highest PEM scores compared to previous studies in HD diagnosis thus demonstrating the effectiveness of this study.
This study utilizes several machine learning (ML) models, including Adaptive Boosting (AB), Naïve Bayes (NB), Logistic Regression (LR), Bagging Classifier, and Extreme Gradient Boosting (XGB), all of which exhibit strong potential for HD prediction. Unlike earlier works that often disregarded the influence of outliers, this study integrates the Isolation Forest technique to identify and eliminate them, thereby enhancing model performance. Additionally, while many previous studies relied solely on accuracy as the primary performance evaluation metric (PEM), this research adopts a more comprehensive approach by incorporating recall, precision, and F1-score analysis. This multifaceted evaluation ensures a deeper understanding of model reliability. Moreover, the proposed models achieve superior PEM scores compared to existing studies, highlighting their effectiveness in improving HD classification accuracy. Section 2 presents a related work on the diagnosis of HD using ML. The experimental setup and methodology are described in Section 3. Section 4 discusses the results, while Section 5 offers a comparative analysis with previous studies in this area. Finally, Section 6 summarizes the key findings and concludes the paper by suggesting directions for future research.
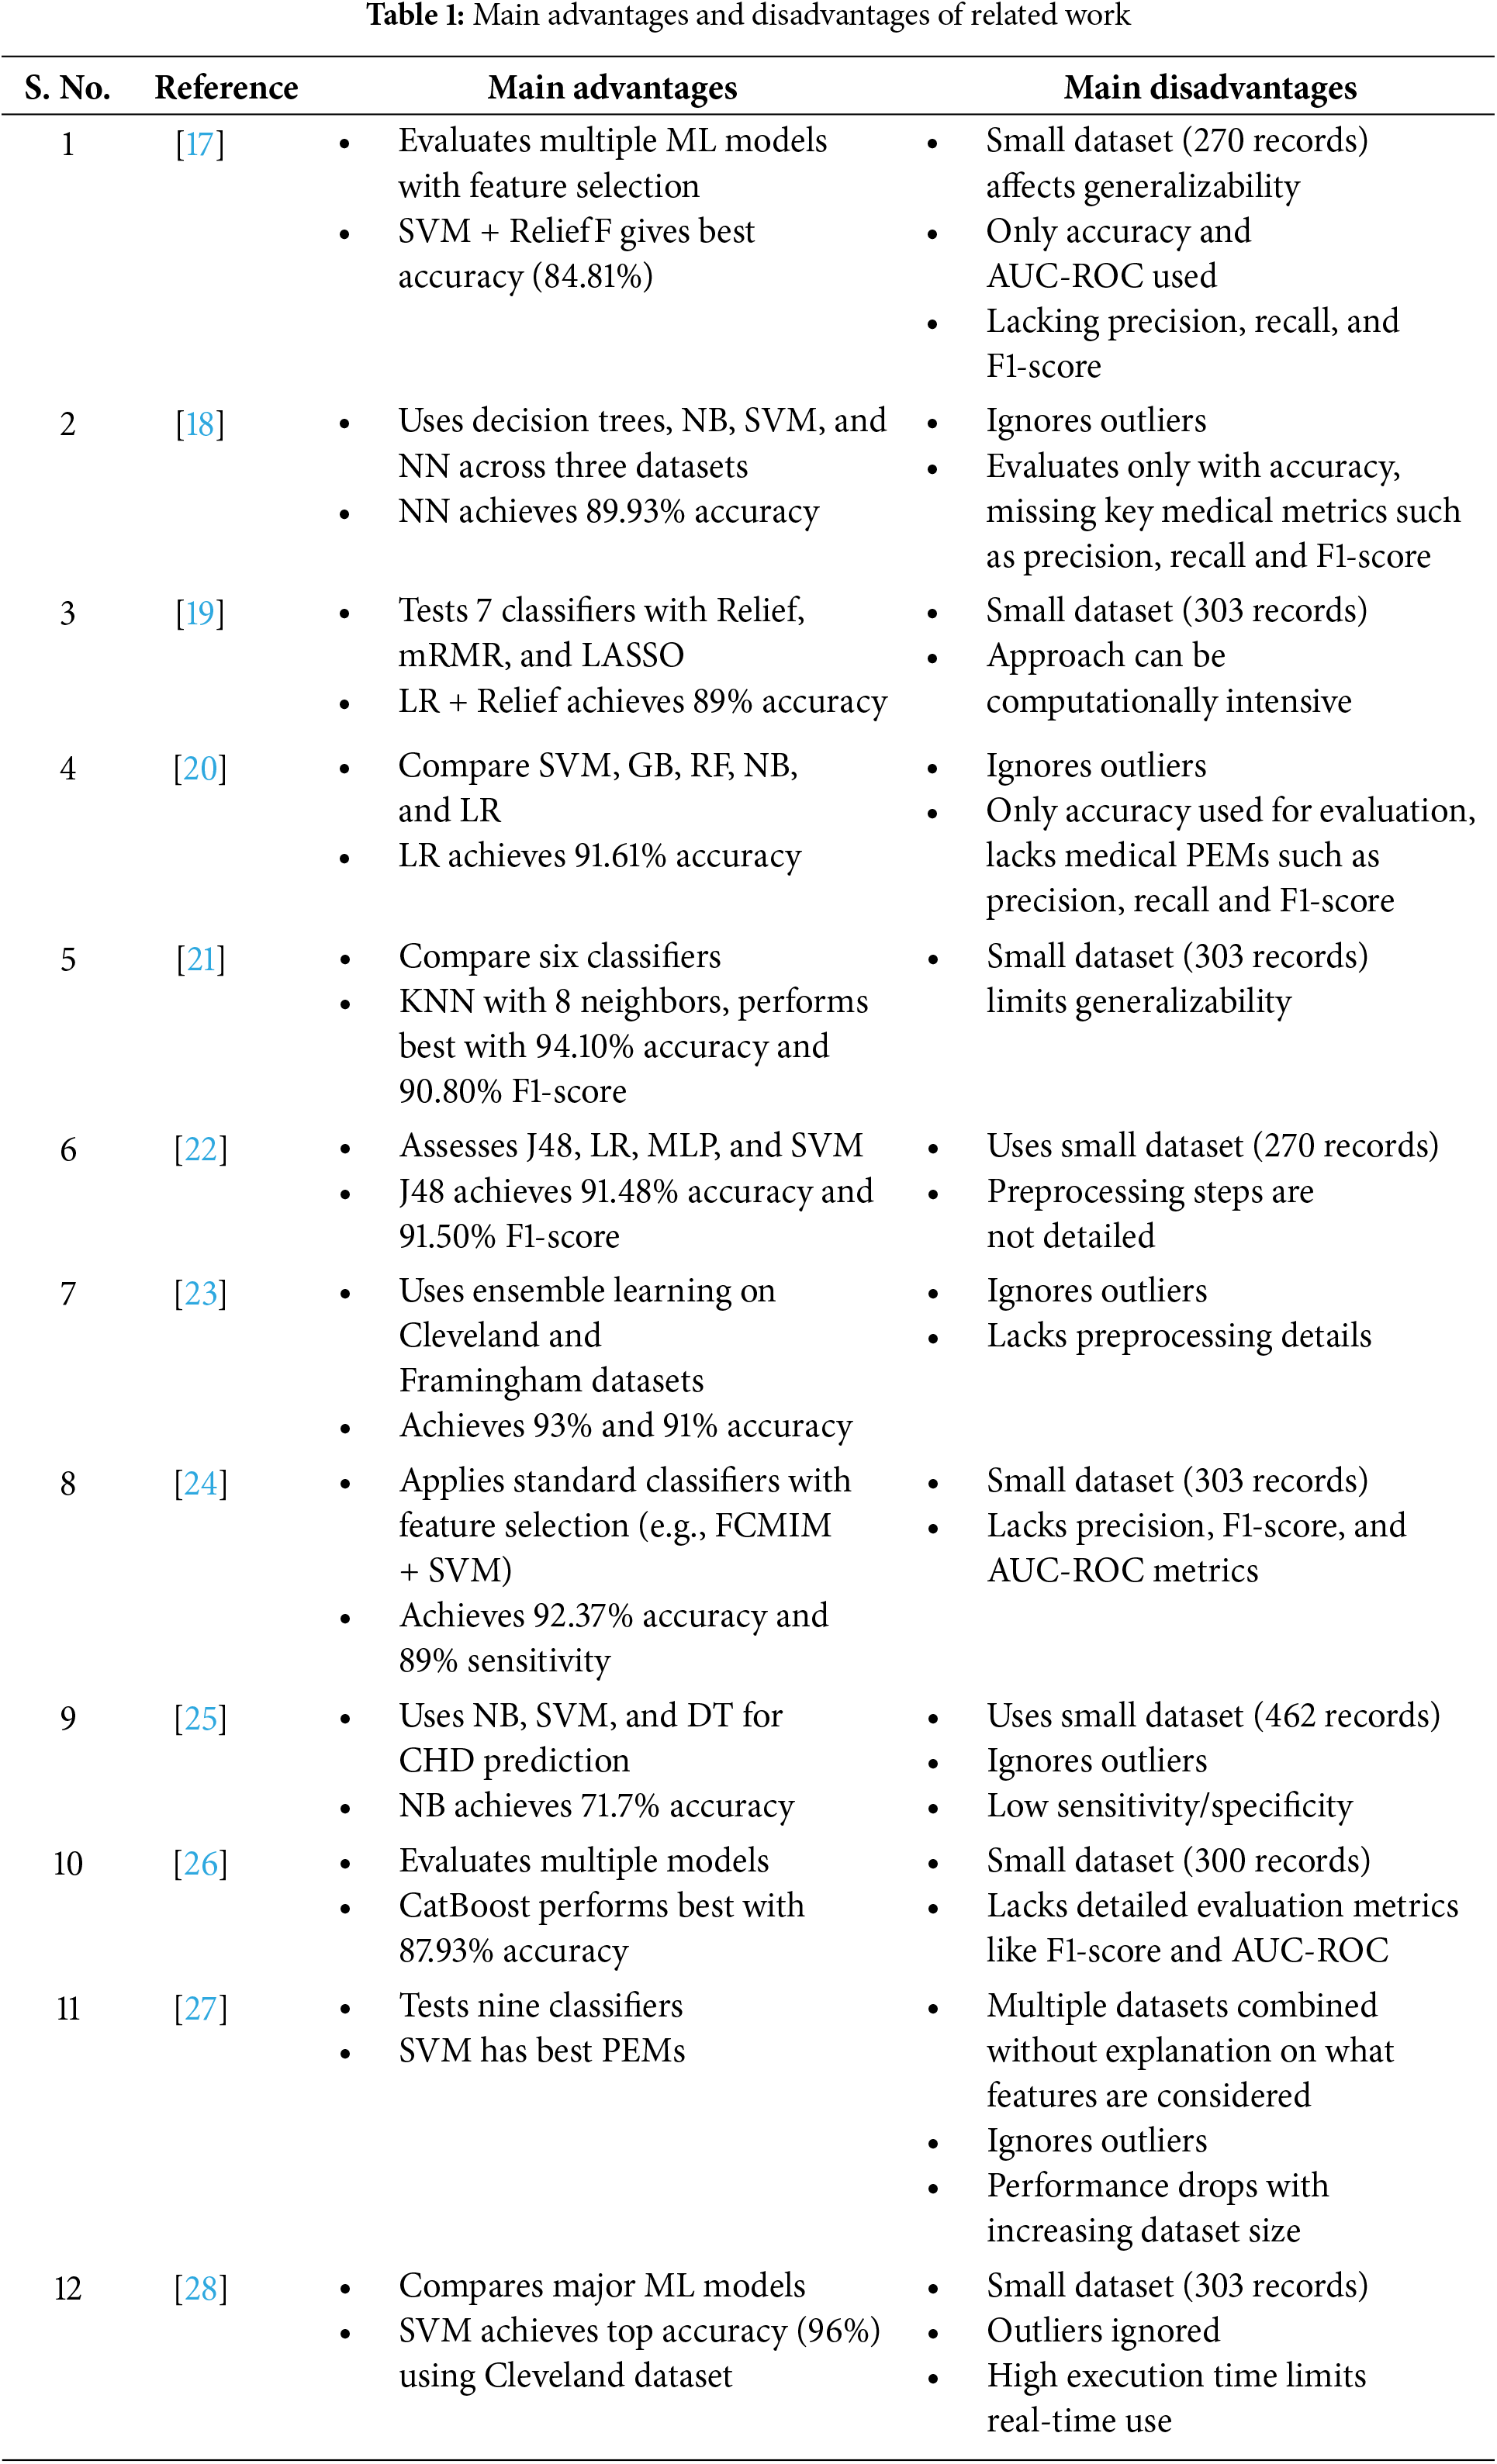
Cardiovascular diseases (CVDs) are the major global cause of mortality. Every year, around 17.9 million lives are lost to CVDs [16] and most of them are caused by heart attacks and strokes. If HD is detected early and treated promptly, it can significantly improve a person’s chances of getting better. That’s why there has been a lot of interest in using ML to detect and diagnose HD early and accurately. Many researchers are studying how ML can help find signs of HD sooner and make accurate diagnoses. The author in [17] concluded that the support vector machine (SVM) along with reliefF feature selection technique has the best performance in prediction of HD. A comprehensive analysis was conducted to diagnose HD using three datasets: the HD Database, Z-Alizadeh Sani Dataset and South African HD [18]. Their study focused on two main approaches: predictive analysis and descriptive analysis. For the predictive analysis, they employed Neural Networks (NN), NB, Support Vector Machine and Decision Trees (DT).
On the other hand, the descriptive analysis focused on association and decision rules. The results obtained from their study were highly promising, often comparable to or even surpassing the outcomes achieved in other related works. In another study, the authors developed an ML-based system for diagnosing coronary artery disease using the Cleveland HD dataset of 303 patients and 76 features [19]. Seven popular ML algorithms and three feature selection algorithms were applied, with LR achieving the highest accuracy of 89%. Different ML algorithms such as SVM, Gradient Boosting (GB), Random Forest (RF), NB classifier, and LR were employed to predict CVD [20]. LR outperformed other models, achieving the highest accuracy.
Supervised ML techniques like SVM, DT and NB were used on the South African HD dataset, employing 10-fold cross-validation [21]. The results showed promising potential for probabilistic models derived by NB in detecting coronary HD. An Internet of Things (IoT) and cloud-based healthcare application to monitor and diagnose HD is presented in [22]. The prediction of HD in patients utilized the UCI Repository dataset and healthcare sensors. Patient data is classified using various algorithms, such as SVM, J48, LR and multilayer perception (MLP). Among these classifiers, J48 outperformed others in terms of F1-score and accuracy. However, it is worth noting that the model’s training and testing were conducted on a limited dataset of only 270 instances. Furthermore, the MLP exhibited poor performance with a relatively low accuracy of 78.14%. A comprehensive review of ML-based coronary artery disease diagnosis is presented. The research examined aspects like the characteristics of the dataset used and the ML methods employed. The study revealed concerns regarding how well the developed models could be applied to new cases due to limited data and insufficient information in certain areas. It was observed that while certain ML models performed effectively on the specific dataset they were trained on, their performance could have extended better to other datasets.
An enhanced ML technique was introduced [23] to predict the risk of HD. Their method involved randomly dividing the dataset and utilizing ensemble modelling with a classification and regression tree (CART) approach. They created a homogenous ensemble by combining multiple CART models using a weighted aging classifier ensemble based on accuracy. This approach demonstrated classification accuracies of 93% for the Cleveland dataset and for the Framingham dataset it was found to be 91%, surpassing the performance of other algorithms. Reference [24] introduces a highly effective and precise ML system, which utilizes the Fast Conditional Mutual Information feature selection algorithm (FCMIM). This system incorporates multiple classification algorithms and standard feature selection techniques to eliminate irrelevant and redundant features. By employing FCMIM in combination with the SVM classifier, the ML system can design an intelligent system for identifying Huntington’s disease at a high level. The proposed diagnosis system, i.e., FCMIM-SVM, exhibits the highest accuracy as compared to all other models discussed in the study. An experimental analysis used an online UCI HD dataset to compare different ML classifiers for HD prediction [25]. The results demonstrated the strength of the RF Classifier, which achieved a prediction accuracy of 88.35%. Authors in [26] utilized different ML models such as LR, SVM, K-Nearest Neighbours (KNN), Gradient NB (GNB), Multinomial Naïve Bayes (MNB), Extra Trees (ET), RF, GB, DT, CatBoost, Light Gradient Boosting Machine (LGBM), and XGB were utilized to predict the heart failure probability. LGBM outperformed other algorithms, achieving the highest accuracy of 86.21%. CatBoost, RF, and GB were identified as providing acceptable results for predicting heart attacks. The authors employed several ML algorithms to detect and predict HD in humans using various evaluation metrics [27]. The researchers took steps to enhance the performance of ML classifiers by performing hyperparameter tuning. All the classifiers underwent training and testing through a 10-fold cross-validation process to ensure robustness. The experimental findings demonstrated that hyperparameter tuning improved accuracy in the prediction classifiers, with SVM displaying particularly noteworthy accuracy. In a recent study [28], the authors focused on diagnosing HD using ML techniques on the Cleveland Clinic dataset. SVMs emerged as the most effective in diagnosing HD, achieving the highest diagnostic accuracy of 96%. Table 1 summarizes the main advantages and disadvantages of the related work conducted in the field of HD diagnosis using ML.
3 Experimental Setup and Methodology
This study analyzes and compares various ML models for HD prediction in terms of performance. The experimental setup involves several critical steps. The workflow for the entire process is shown in Fig. 1. The dataset is acquired and subjected to multiple preprocessing techniques, as detailed in the subsequent sections. The ML models, including Bagging, LR, NB, XGB, and AB, are trained using preprocessed data. Finally, the performance of all the models used is assessed using standard performance evaluation metrics: Accuracy, F1-Score, Recall and precision. This approach provides a comprehensive assessment of the different ML models in terms of their effectiveness in HD prediction.
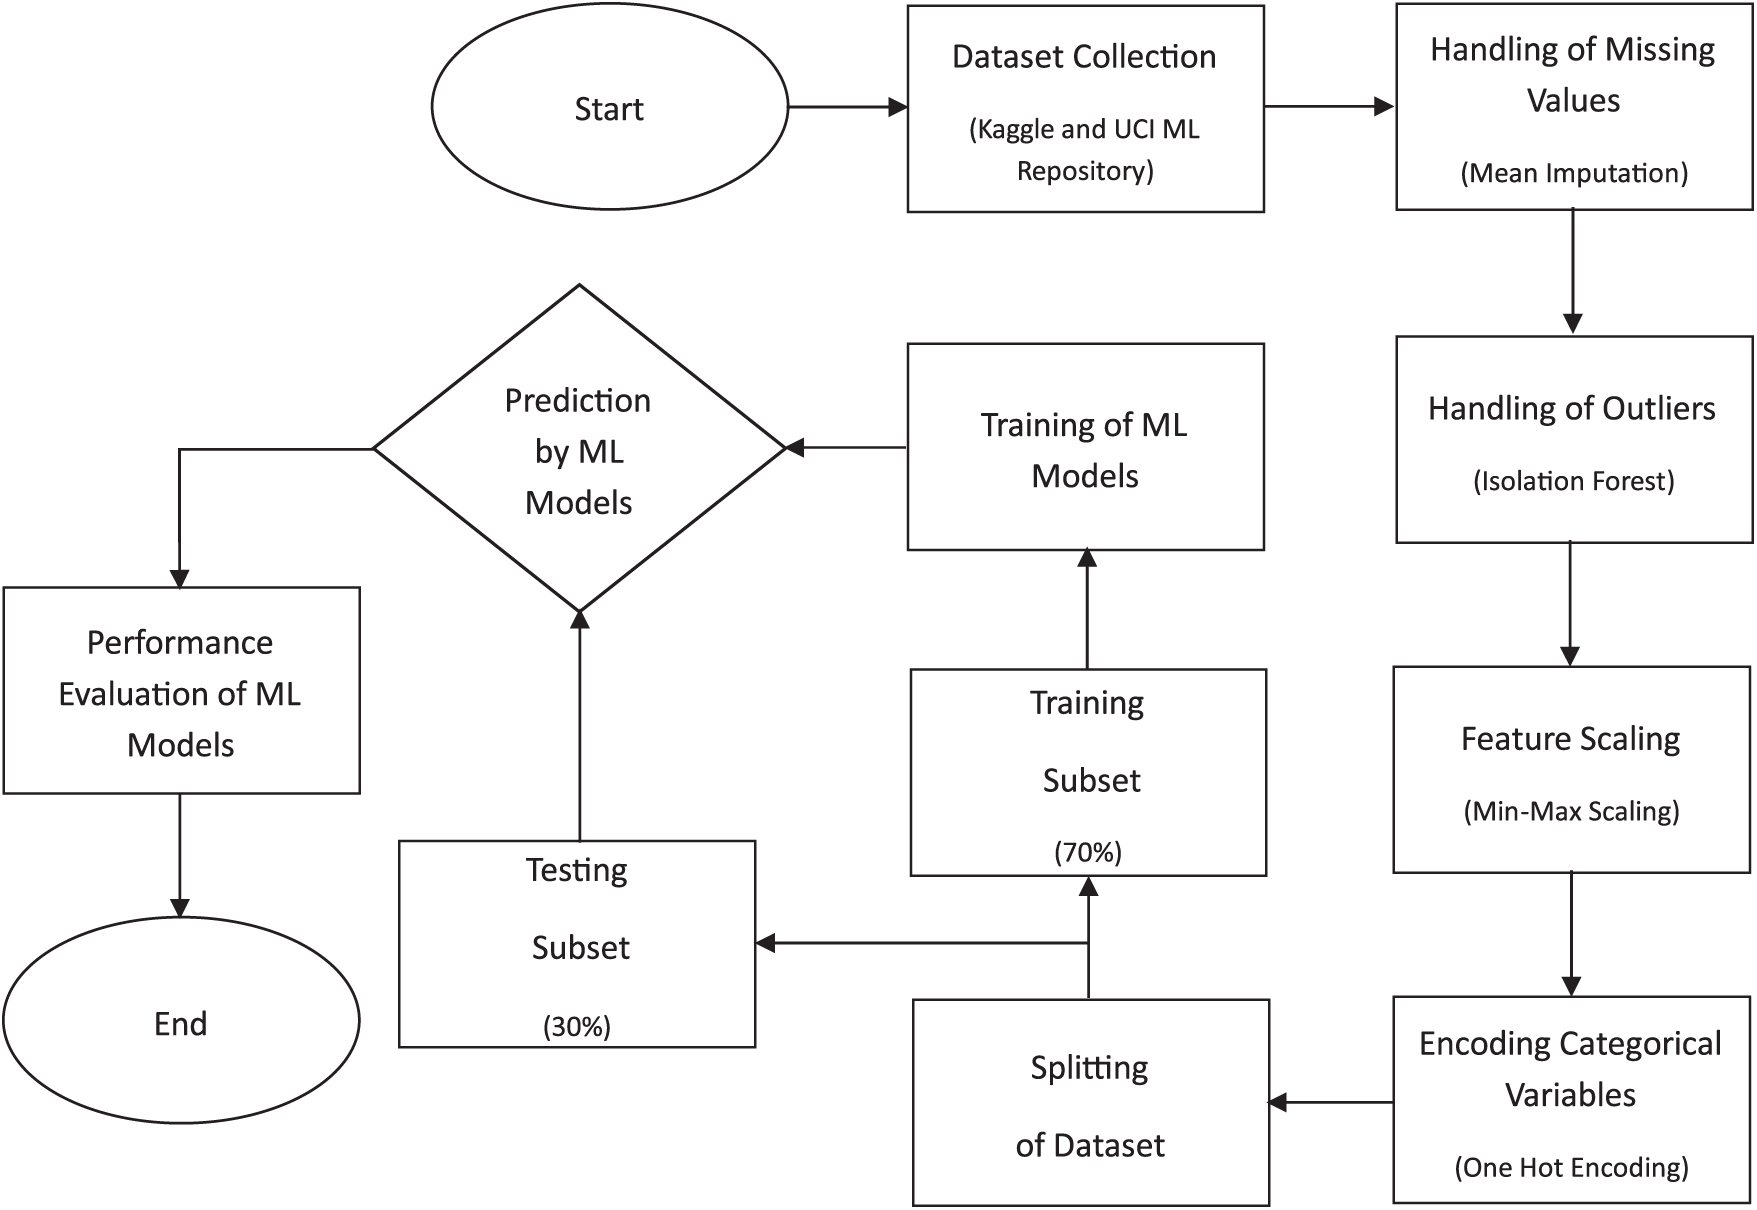
Figure 1: Steps involved in implementing the models for heart disease prediction
3.1 Implementation and Computational Platform
The techniques outlined above were implemented using the Python programming language to obtain the results. Google Colab, a cloud-based service, was used as the computational platform for running simulations. It provides a browser-based interface that allows the users to write and then execute Python code. It eliminates the need for high-speed computers or specialized hardware. It also provides access to powerful computing resources, including high-end Graphics Processing Units (GPU) and Tensor Processing Units (TSU), which can significantly accelerate the execution of computationally intensive tasks, such as training ML models [29].
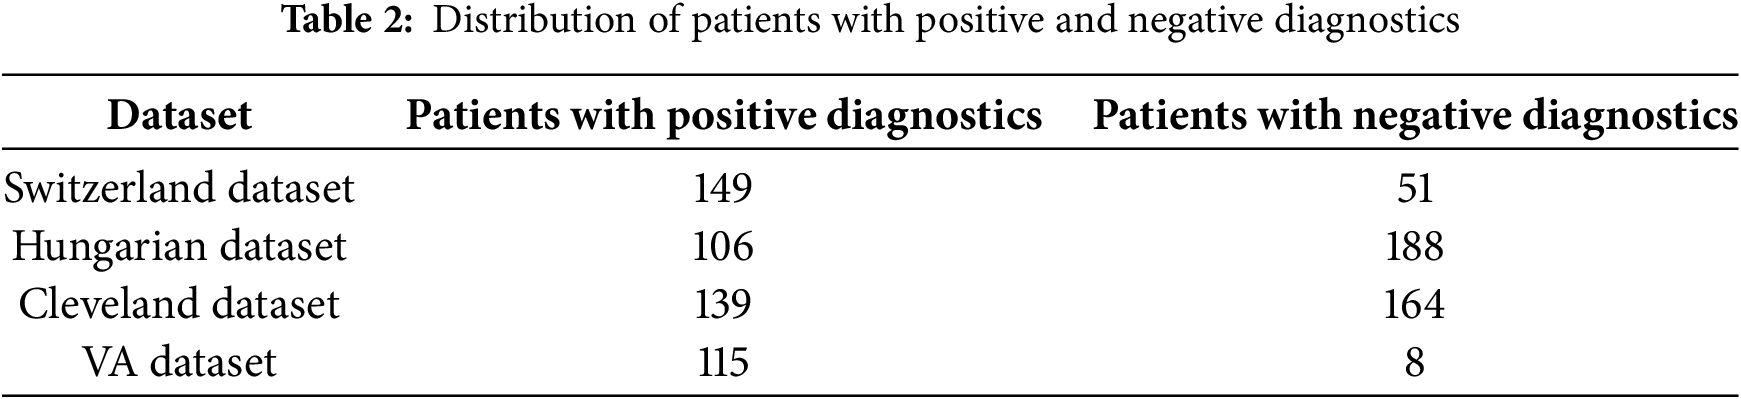
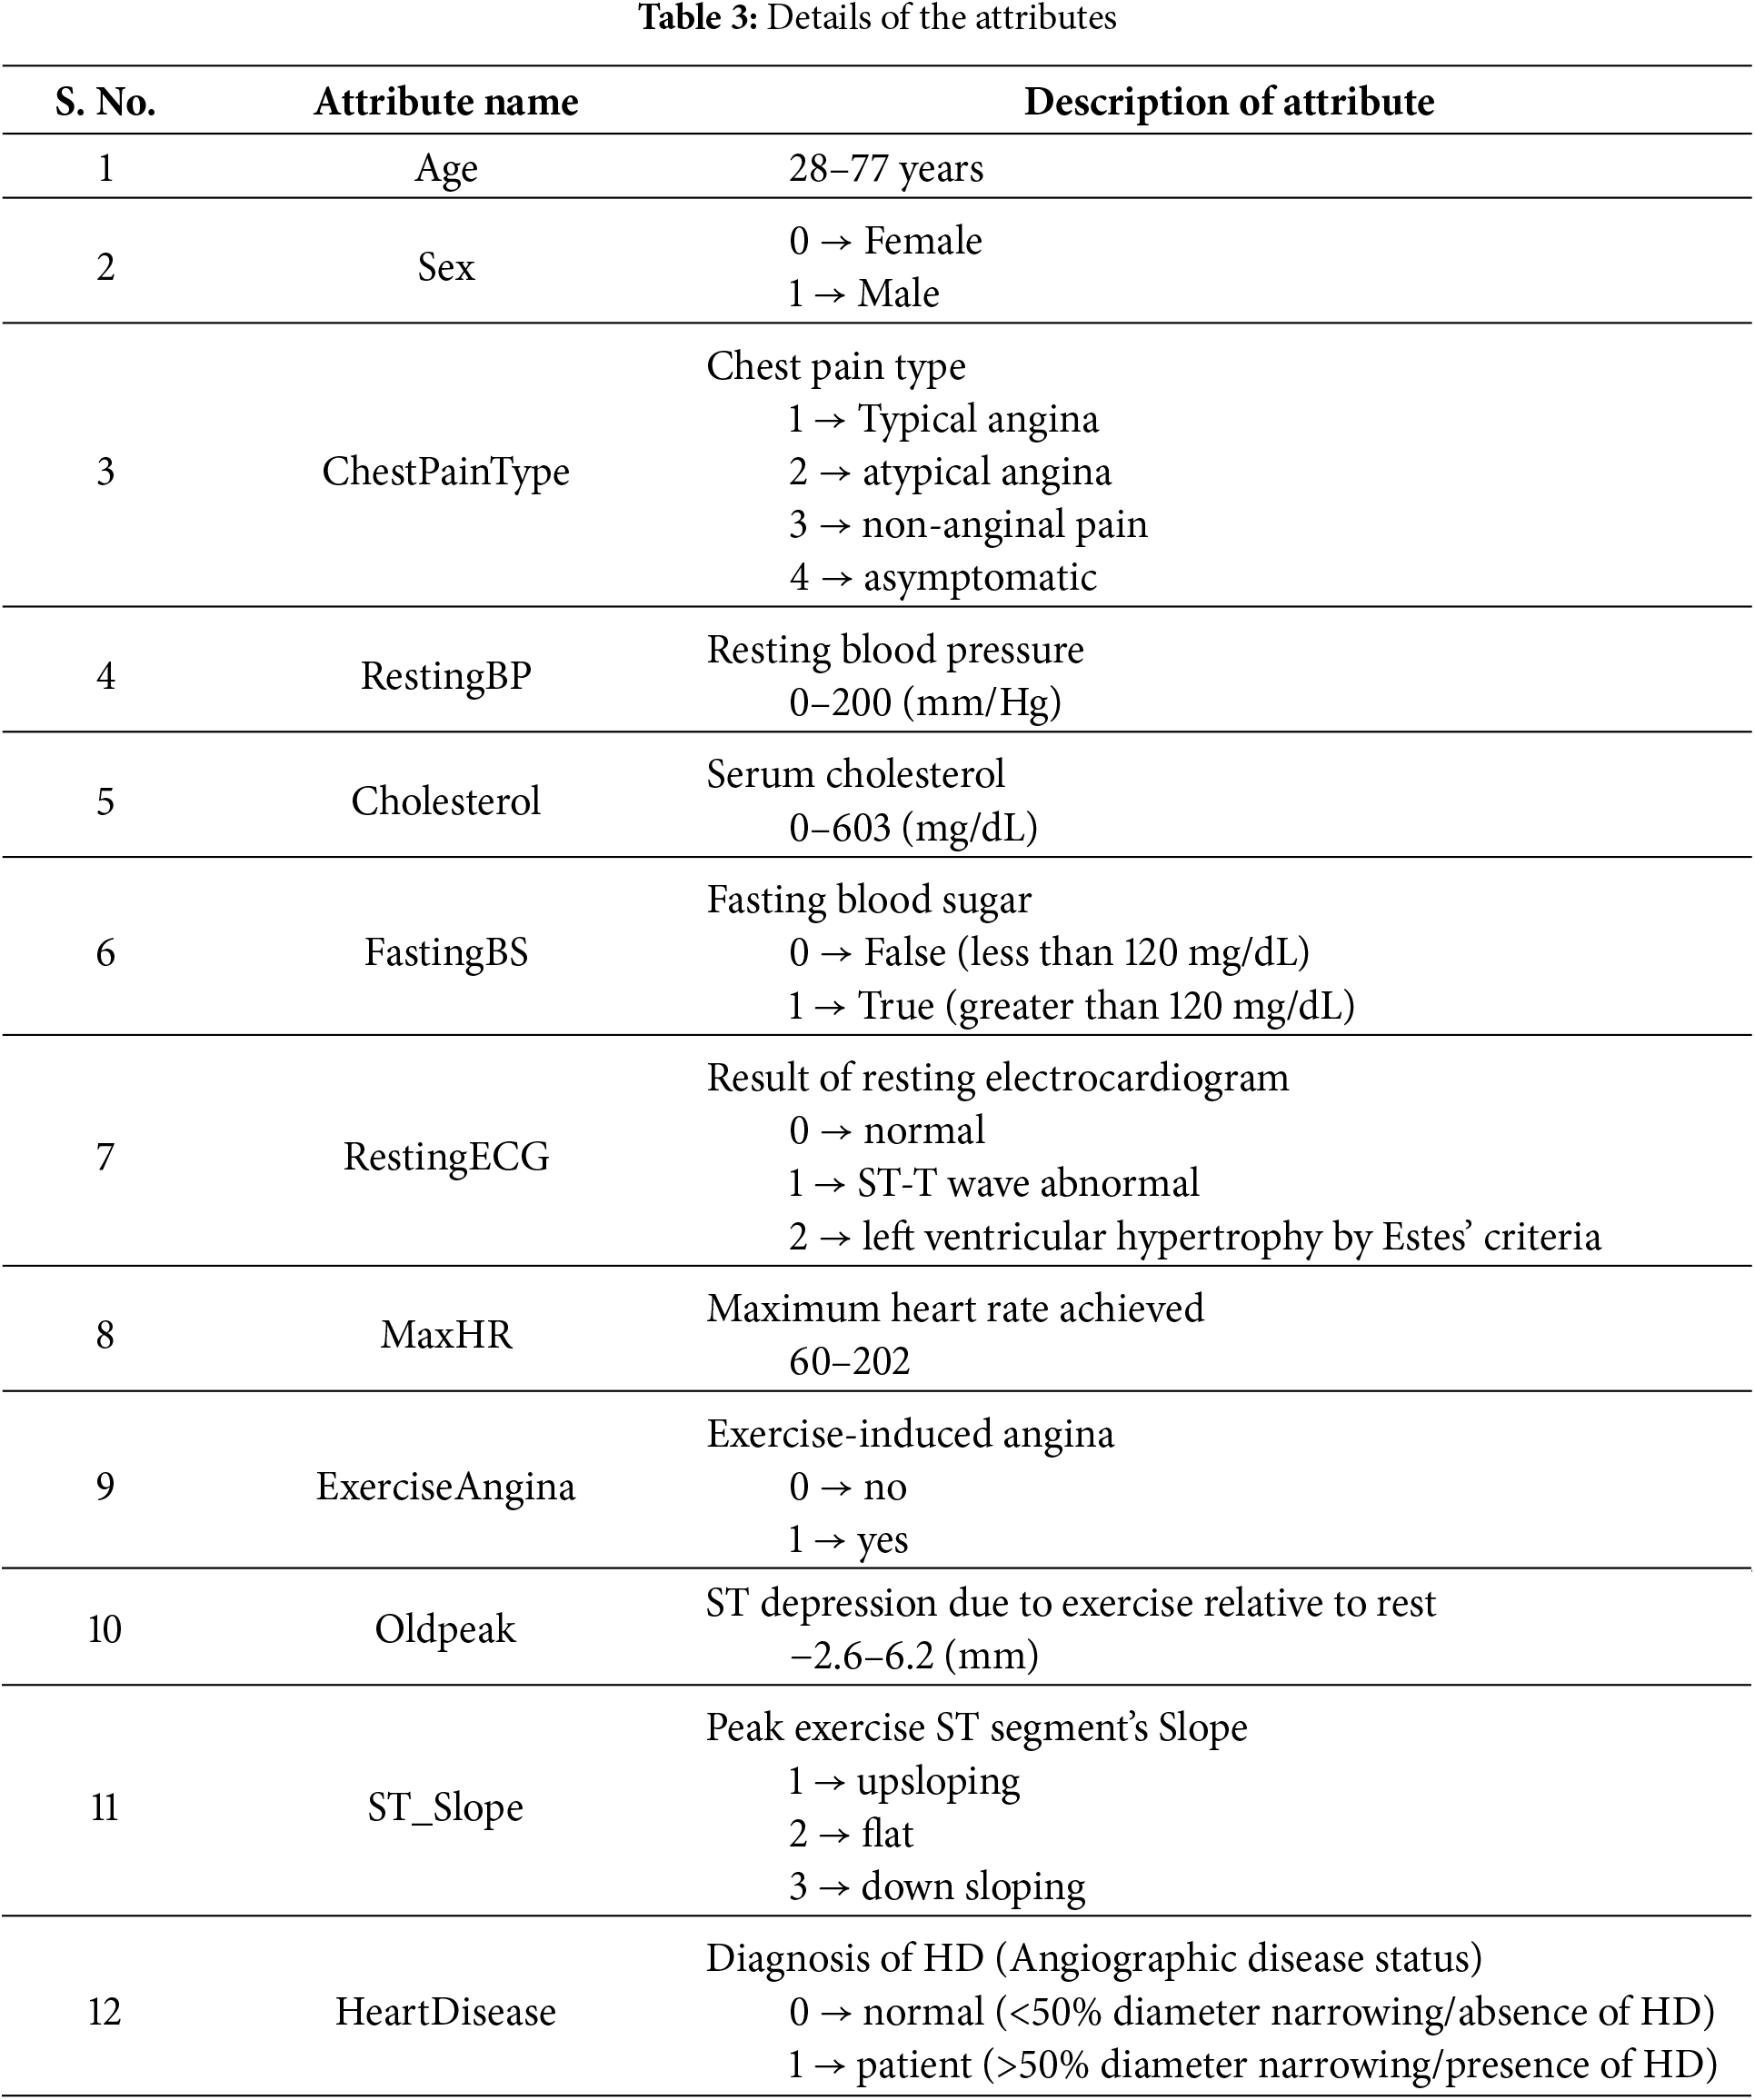
The dataset utilized in this study was first introduced by [30] and has been obtained from Kaggle [31]. A large dataset has been used by combining four datasets originated from well-known institutions: University Hospital in Zurich, Switzerland (200 patients); Hungarian Institute of Cardiology in Budapest, Hungary (294 patients); Cleveland Clinic Foundation in the United States (303 patients); and Veterans Administration (VA) Medical Center in Long Beach, California, U.S. (123 patients). These datasets have been combined because they offer advantages like increased data diversity, improved model performance, mitigated bias and variance, enhanced feature representation, and addressing data scarcity. It allows the model to leverage a wide range of data, capture complex patterns, and improve predictions. Each dataset provides a unique perspective on HD distribution. Table 2 displays the distribution of patients with positive and negative diagnoses in each dataset. The dataset has 918 instances and 12 attributes. The details of the attributes are mentioned in Table 3. These attributes are essential in predicting HD and understanding its underlying factors.
The dataset used in this study comprises patient records from a total of 918 individuals, consisting of 725 men and 193 women. The dataset covers a wide range of ages. Among the patients, 410 individuals (44.67%) exhibited normal cardiac function, while 508 individuals (55.34%) were diagnosed with HD. Fig. 2 displays the distribution of patients based on their cardiac condition, illustrating the proportion of individuals with normal cardiac function vs. those diagnosed with HD. This figure offers insights into the prevalence of HD within the dataset. Fig. 3 presents the distribution of patients based on gender, visually representing the proportion of males and females in the dataset.
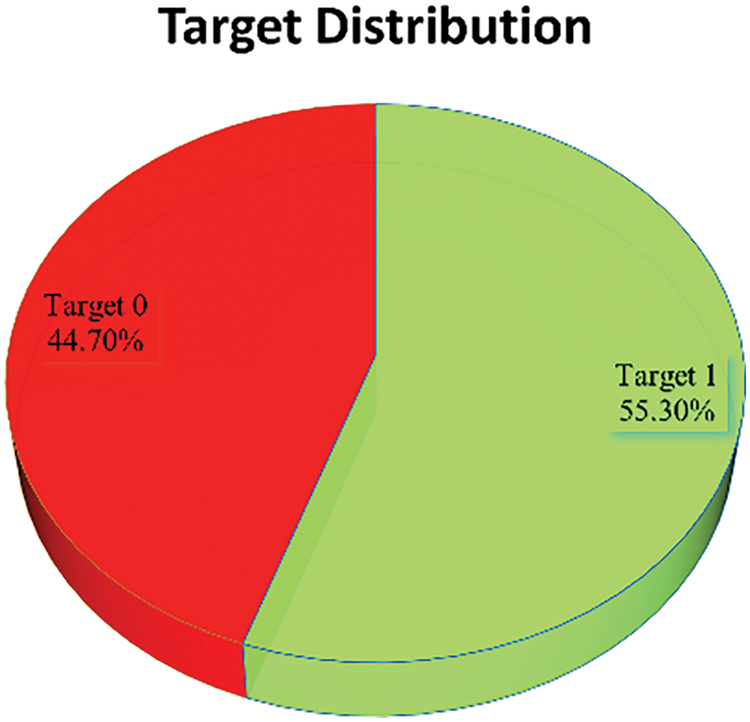
Figure 2: Target (0 → Normal, 1 → Patient) distribution in the dataset
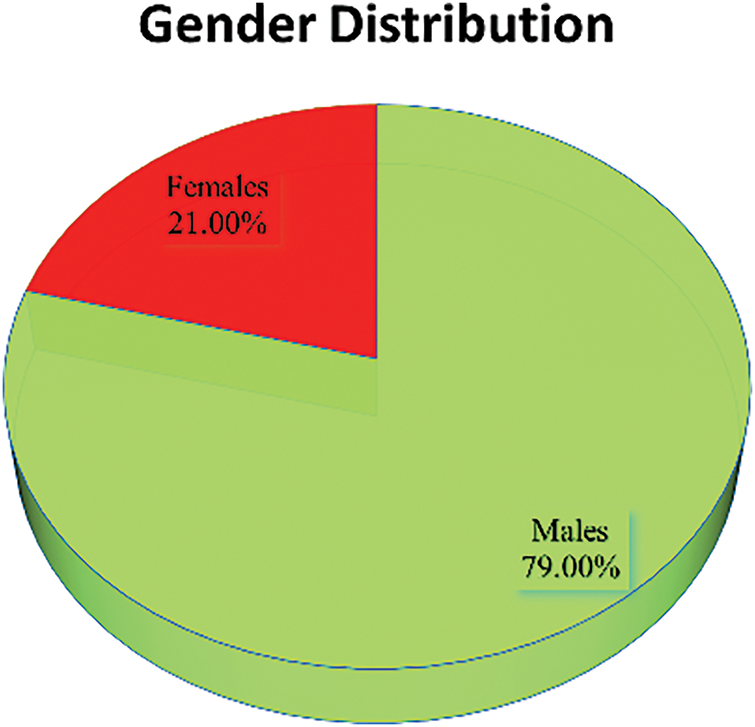
Figure 3: Gender (0 → Female, 1 → Male) distribution in the dataset
To gain a deeper understanding of the dataset, Fig. 4 presents the frequency distribution of all 12 attributes/features included in the dataset. The frequency distribution of attributes enables a detailed analysis of the dataset’s characteristics during the subsequent steps of preprocessing, feature engineering, and model development.
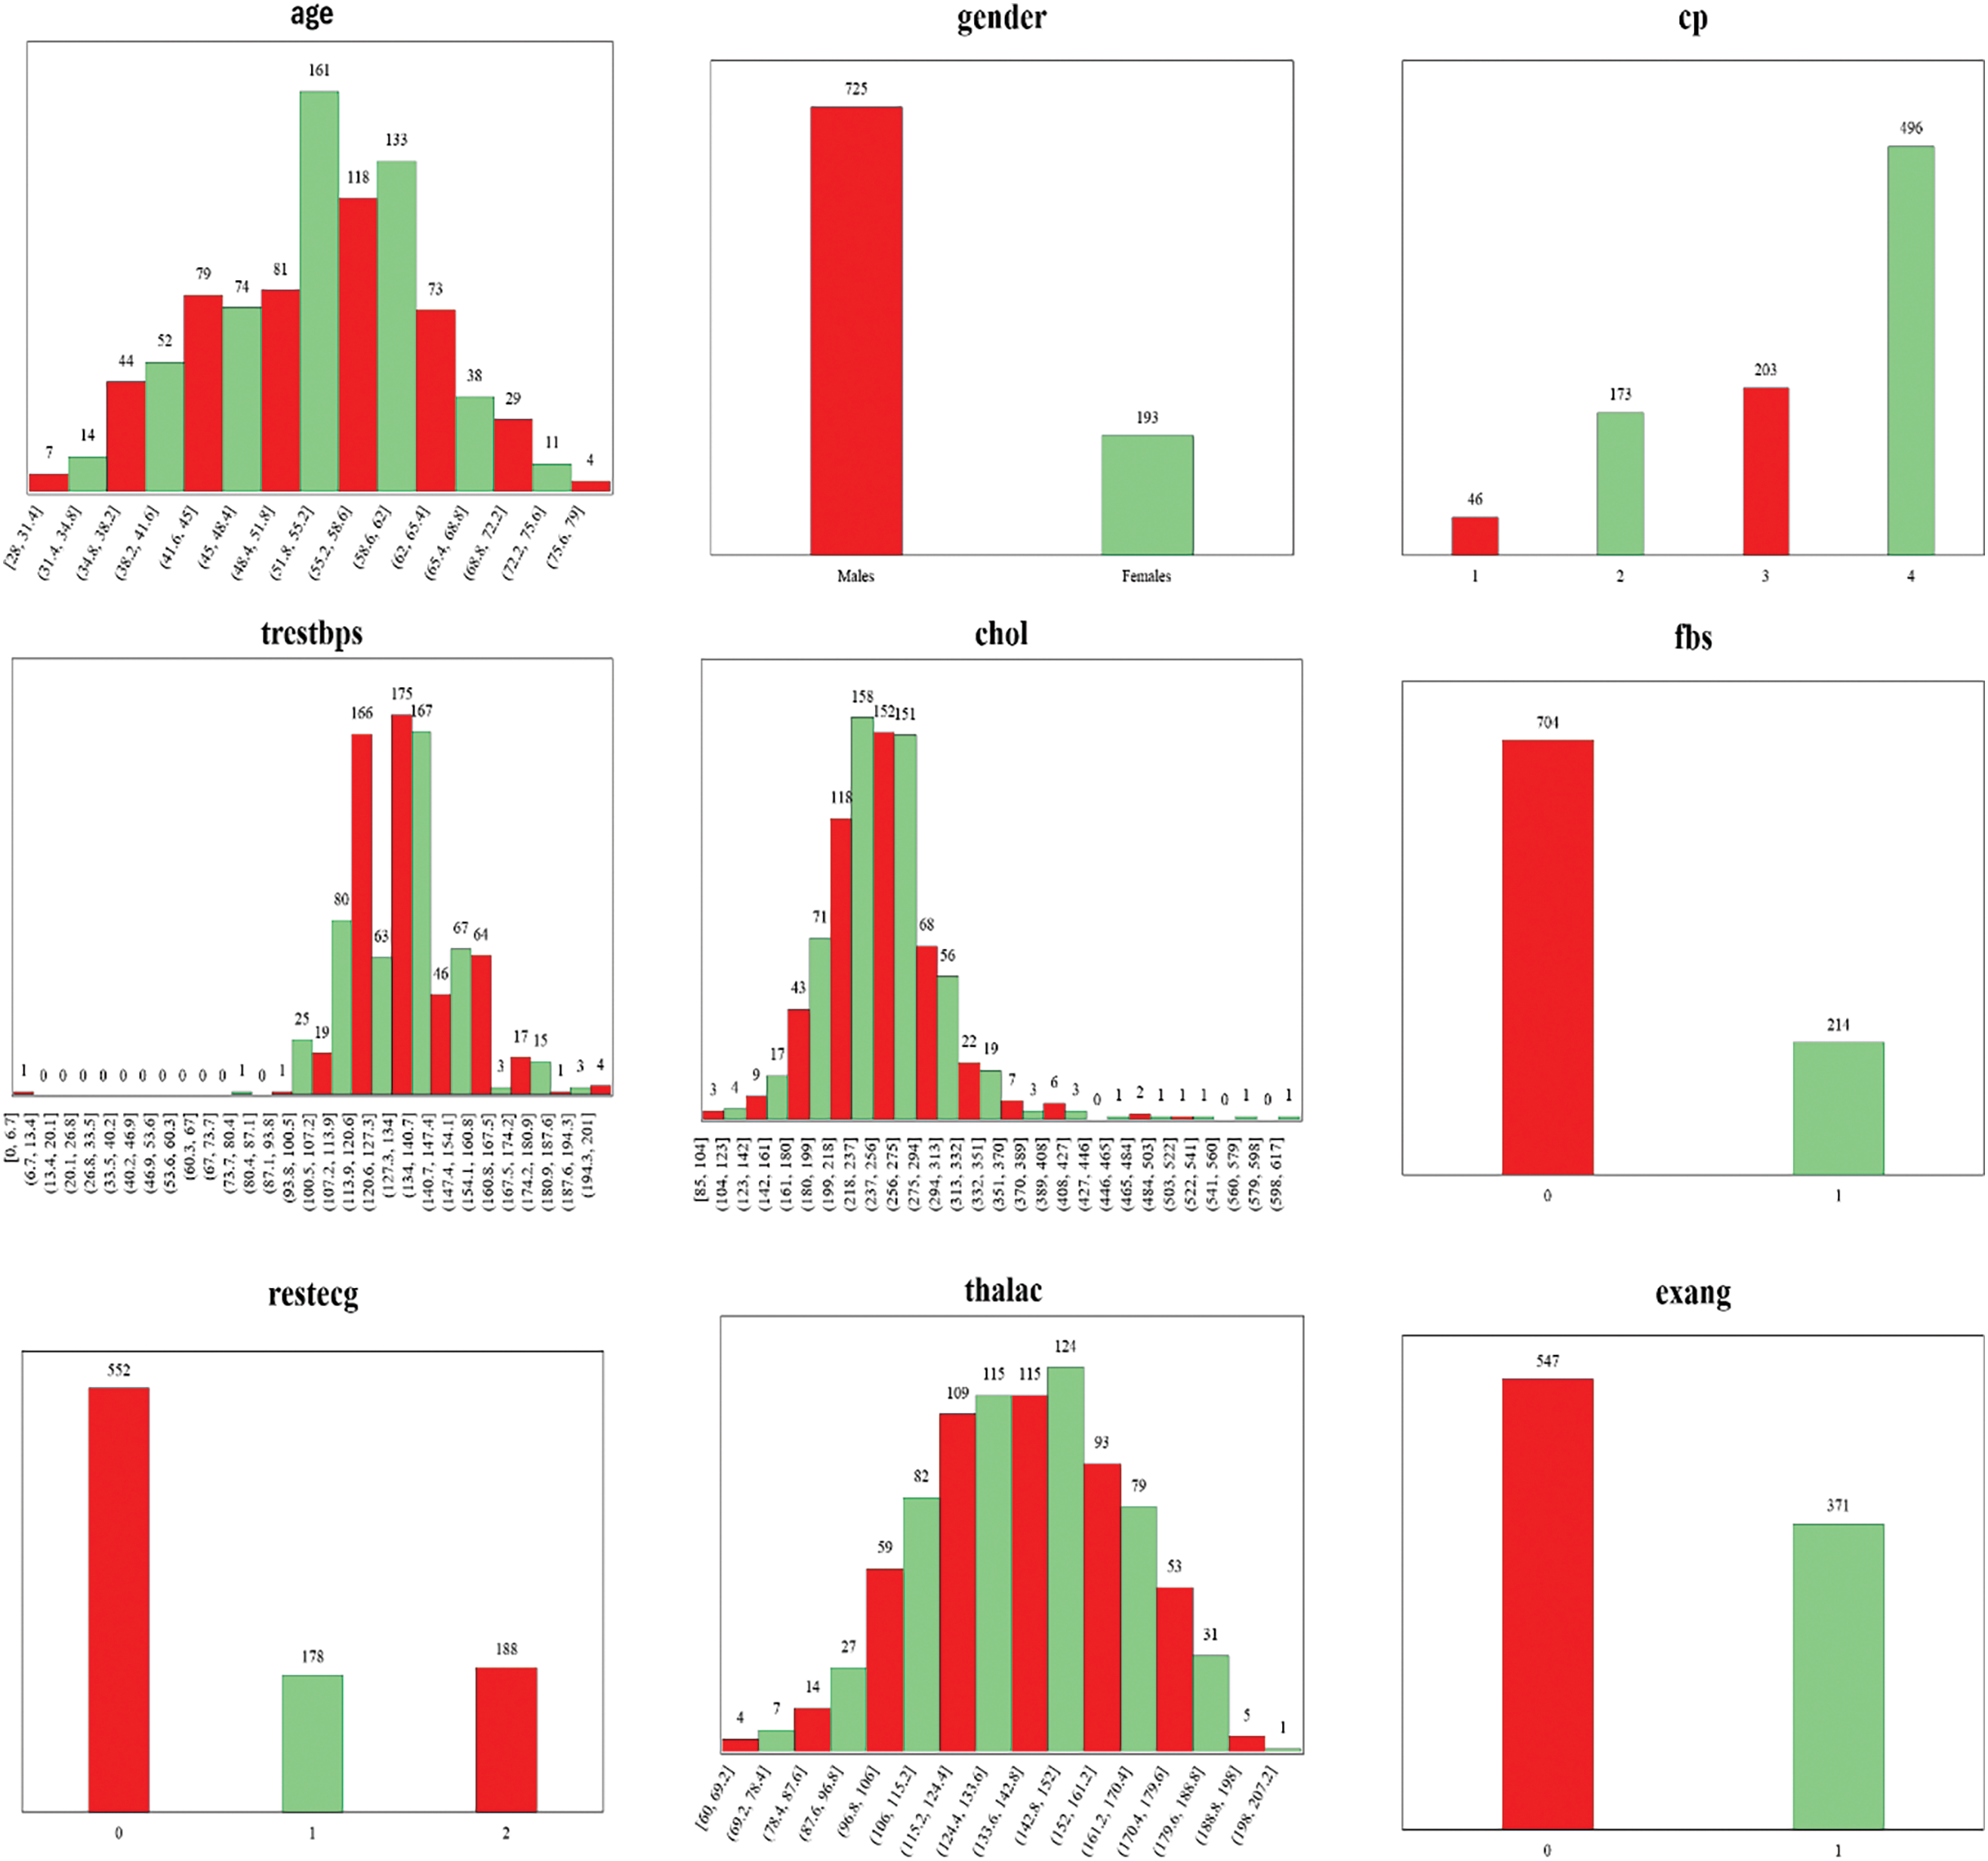
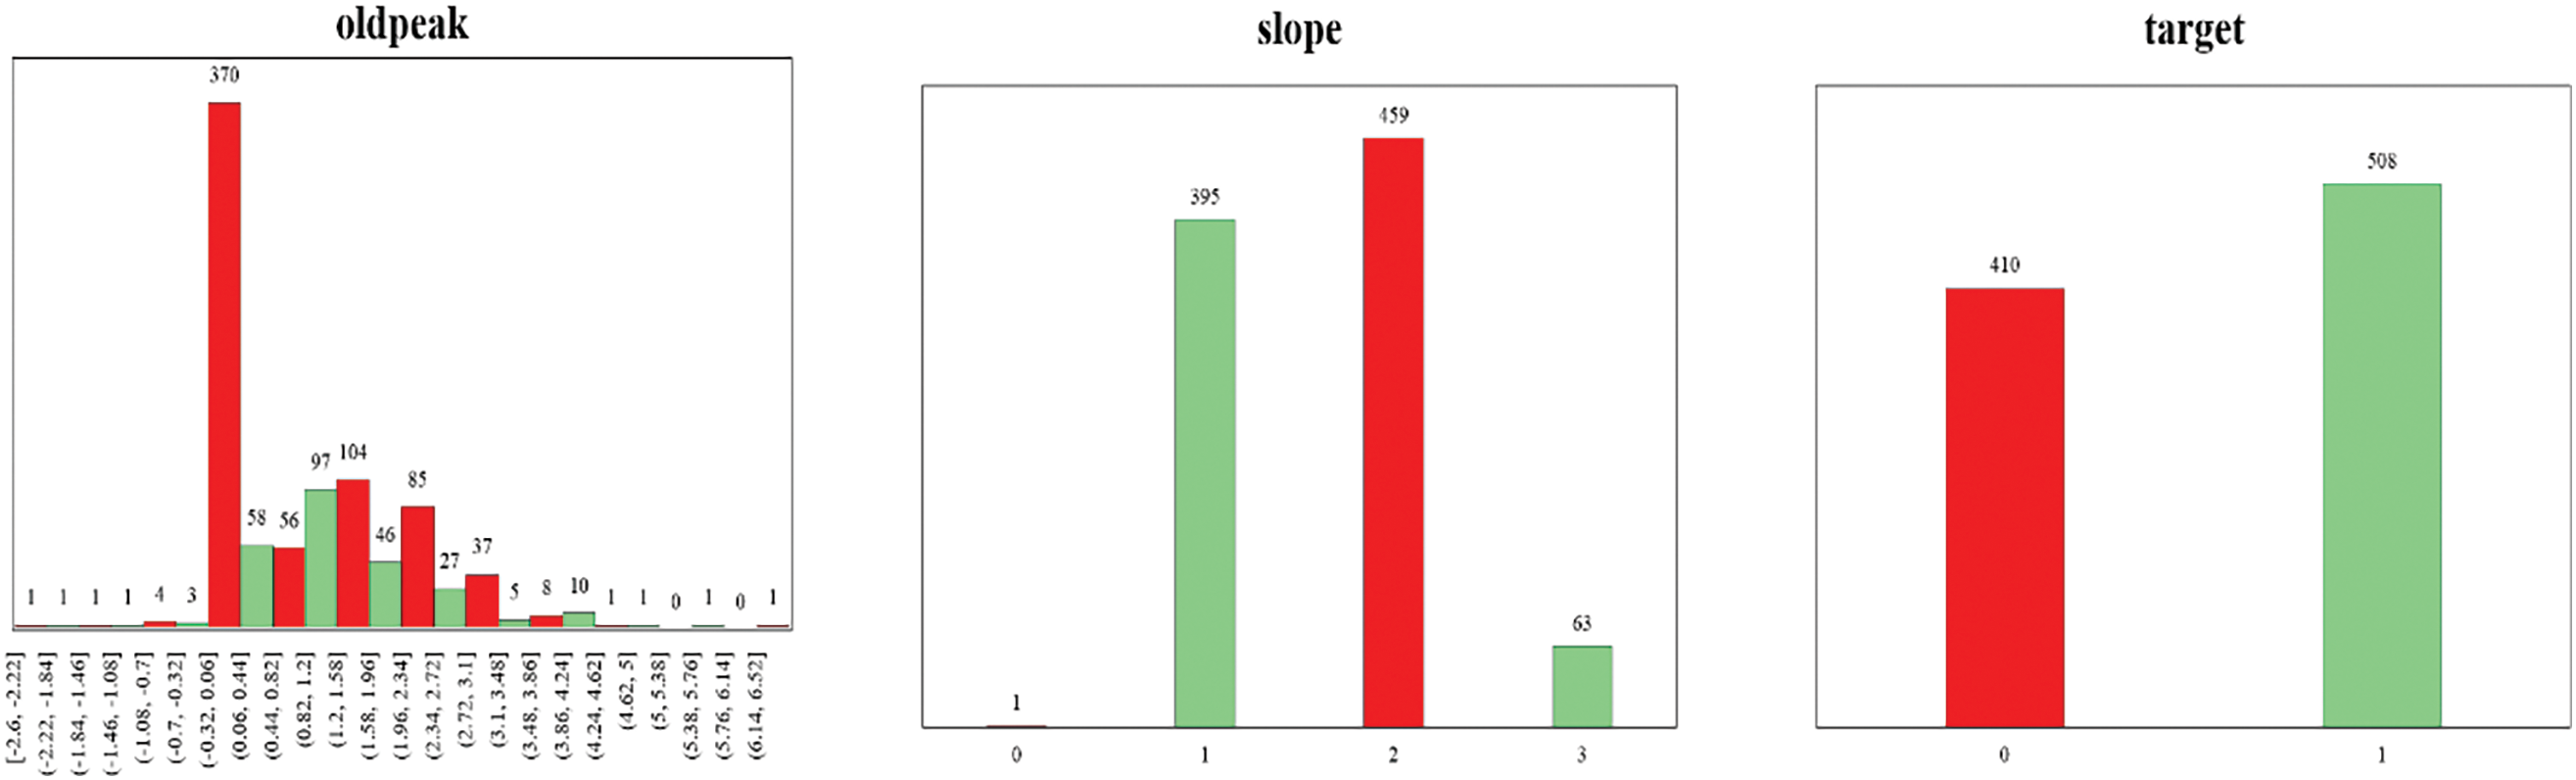
Figure 4: Frequency distribution of 12 attributes of the dataset
Preprocessing of data is a very crucial step in ML and data mining, involving transforming raw data into an appropriate format for analysis and modeling. It holds considerable importance in enhancing the performance and accuracy of ML algorithms by addressing various aspects of the dataset [32]. These include handling missing values, dealing with outliers, performing feature scaling, and encoding categorical values.
3.3.1 Handling of Missing Values
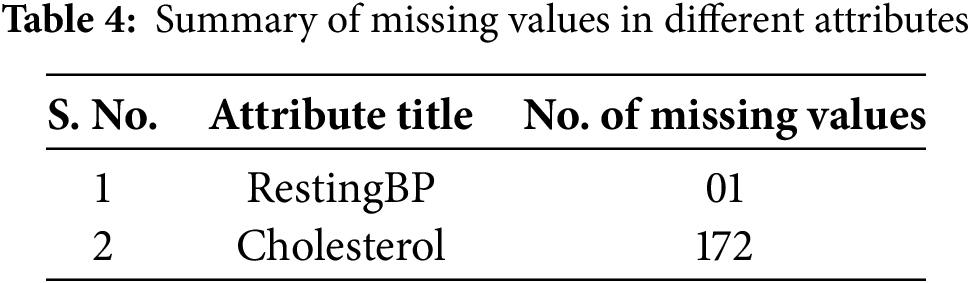
After the analysis of the dataset, it was found that there was a total of 173 missing values in two attributes of the dataset. The summary of the missing values is given in Table 4. To address this issue, the mean imputation method was applied [15,33,34], replacing missing entries with the mean value of the respective attribute. Before performing mean imputation, the dataset was divided into two subsets: one containing records of healthy individuals and the other containing records of patients. Imputation was then carried out separately for each subset to ensure that the statistical properties of patient data did not influence the data of healthy individuals, and vice versa.
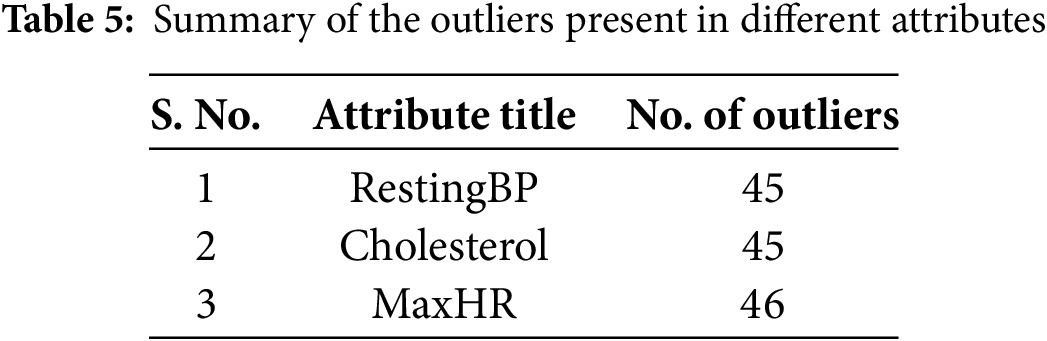
An outlier in a dataset refers to a data point that falls outside a defined range. The presence of outliers can negatively impact the performance of machine learning models, as they often represent anomalies or noise [35]. Identifying and treating these data points as outliers was essential to enhance the reliability and effectiveness of the machine learning models. Measurement errors, incorrect data entries, or rare occurrences that deviate from the general pattern of an attribute can result in biased or unstable predictions. Eliminating such anomalies contributes to developing a more generalized and accurate model. Consequently, outlier removal is a crucial preprocessing step to improve model accuracy. In this study, the Isolation Forest technique was employed for outlier detection. This method isolates outliers by constructing an ensemble of decision trees. The detected outliers were removed from the dataset. By removing outliers, the decision boundary learned by the classifier can better identify the underlying trends and correlations in most of the data. This leads to a more accurate separation between classes, reducing the chances of misclassification. After the application of Isolation Forest, outliers were identified in only three attributes/features. Summary of the detected outliers in these three attributes is given in Table 5. These records containing outliers were subsequently removed from the dataset.
Outliers were carefully analyzed before removal to ensure that clinically significant data was not excluded. For example, regarding the cholesterol attribute, the normal cholesterol range for humans is typically below 200 mg/dL. Values between 200–240 mg/dL indicate high cholesterol levels, while values between 240–420 mg/dL are rare and may signal serious underlying health concerns. Values above 400 mg/dL are typically considered laboratory errors, thus classified as outliers.
This reasoning is further supported by Fig. 5, which visualizes the distribution of data points for the cholesterol attribute using a box plot. The outliers identified by the Isolation Forest technique were subsequently removed, and the resulting dataset is illustrated in Fig. 6. We believe that this approach helps preserve the integrity of the dataset while ensuring the removal of spurious values that could distort the model performance.
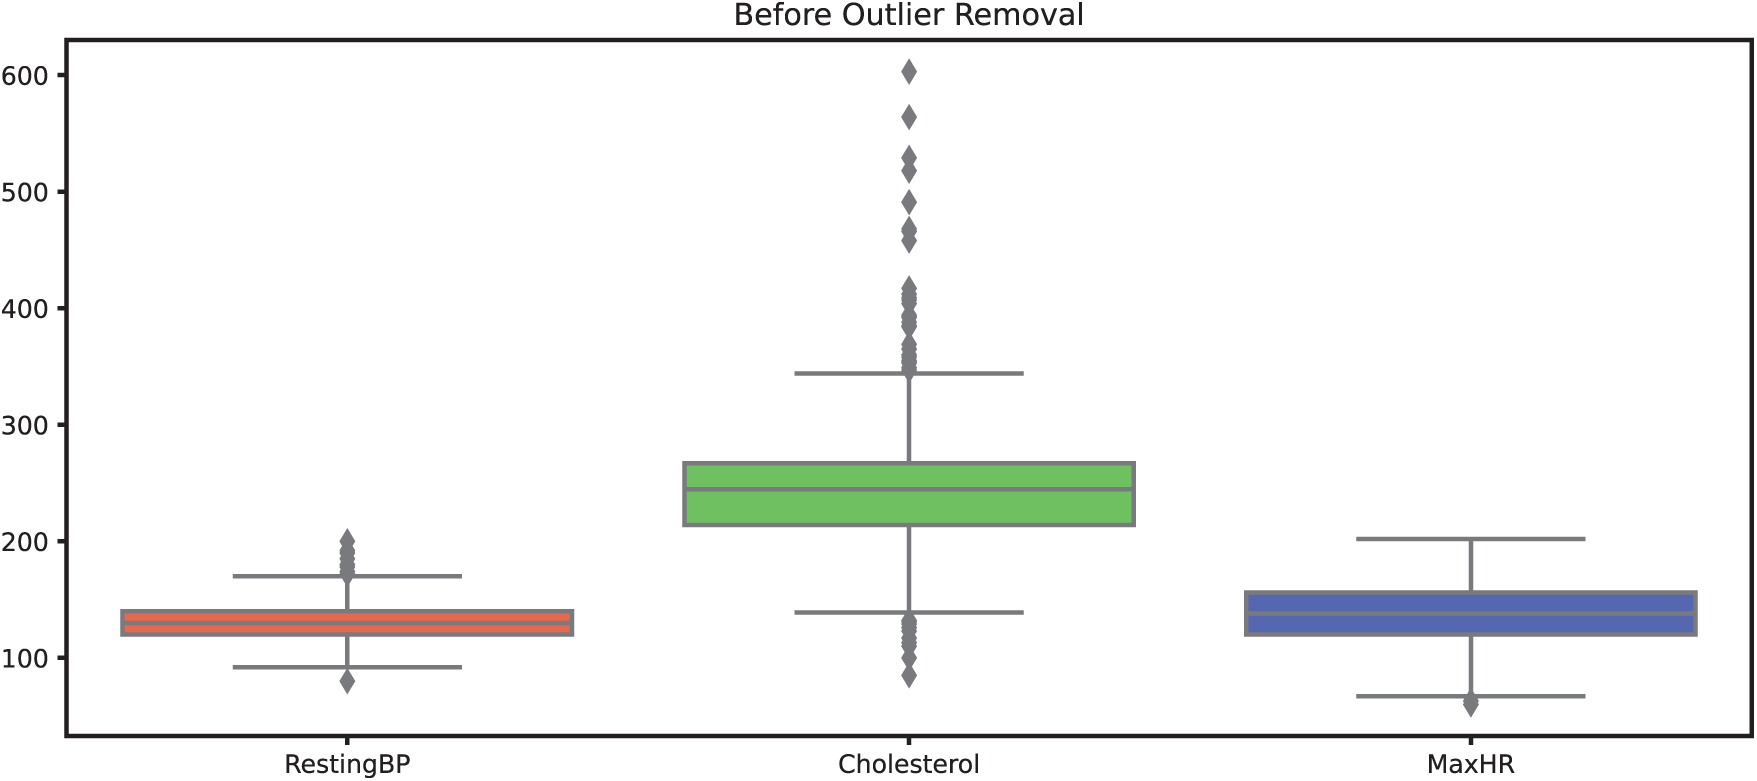
Figure 5: Datapoints of attributes before outliers’ removal
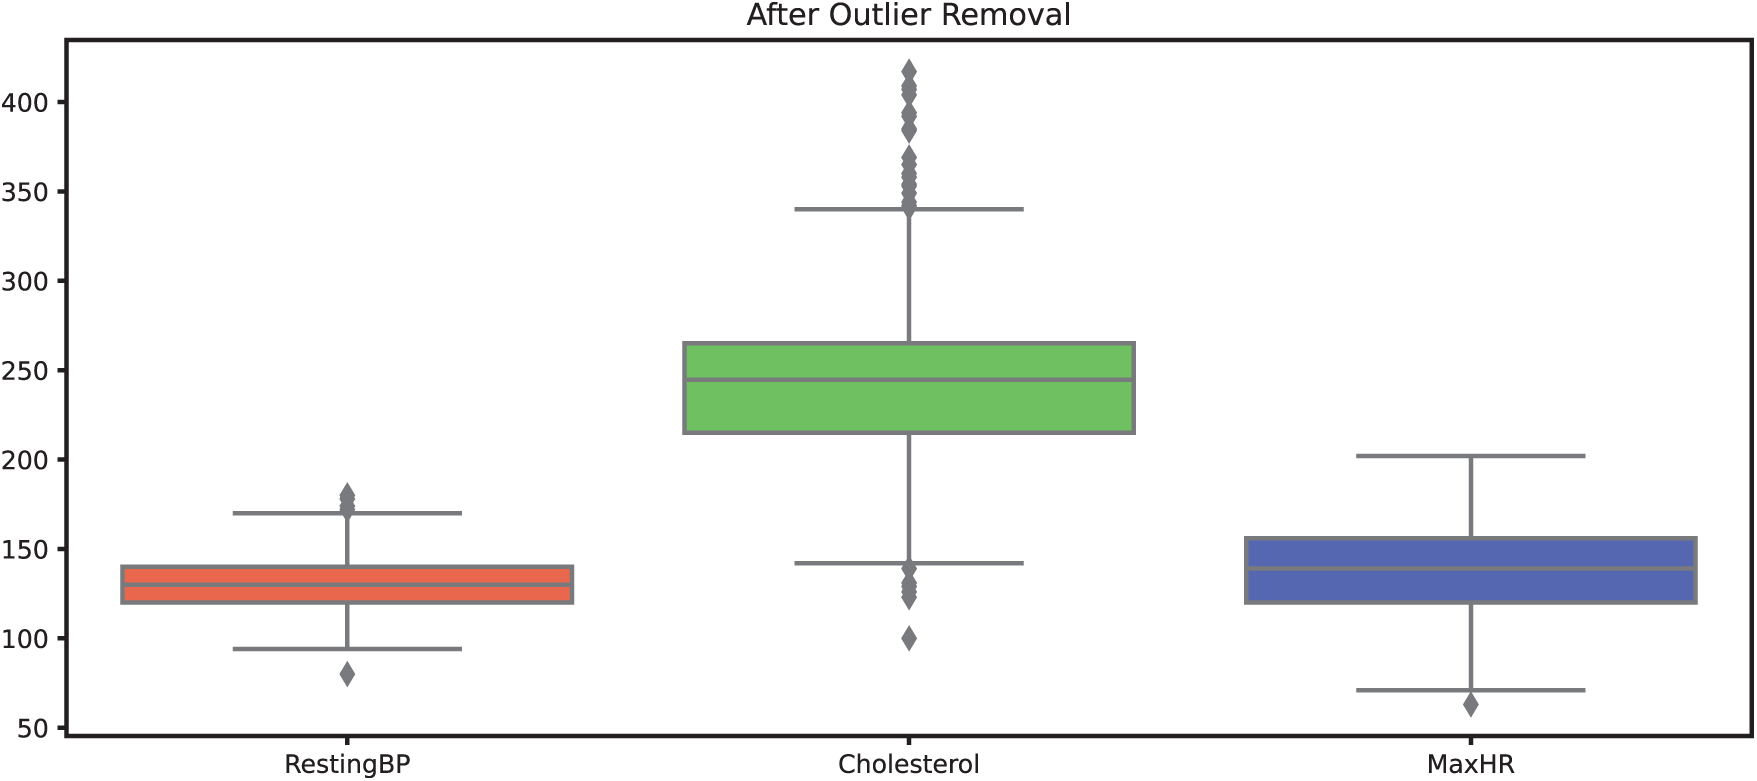
Figure 6: Datapoints of attributes after outliers’ removal
Feature scaling was carried out using the Min-Max normalization technique, which transforms numerical values into a standardized range between 0 and 1 [36]. Min-Max scaling for an attribute is performed using Eq. (1).
where X is the original value of the attribute, Xmin is the minimum value of the attribute, Xmax is the maximum value of the attribute while X′ is the scaled value. This approach ensures that features with different units or magnitudes contribute equally to the model, preventing attributes with larger ranges from dominating the analysis. In this study, Min-Max scaling was specifically applied to Age, RestingBP, Cholesterol, MaxHR, and Oldpeak to maintain consistency across variables and improve the performance of the ML Models.
3.3.4 Encoding Categorical Variables
To transform categorical variables into a numerical format suitable for machine learning models, the one-hot encoding technique was applied. This method converts categorical attributes into binary vectors, where each unique category is represented as a separate column with values of either 0 or 1. By doing so, one-hot encoding ensures that machine learning algorithms can interpret categorical data without assigning any inherent order or priority to the categories.
In this study, one-hot encoding was applied to categorical attributes, including Sex, ChestPainType, FastingBS, RestingECG, ExerciseAngina, and ST_Slope. This process expanded the dataset from 11 independent attributes to 21 independent attributes, effectively increasing the feature space while preventing the model from making incorrect ordinal assumptions about non-numeric categories. By eliminating any unintended relationships between categorical values, this approach helps improve the overall accuracy and reliability of the predictive model.
3.4 Performance Evaluation Metrics
Any field of study must have a critical step for performance evaluation. This study includes accuracy, precision, F1-Score and Recall [37]. These assessment parameters are used to perform a comparative analysis of the used model’s (AdaBoost, Bagging, Logistic Regression, Naïve Bayes, and XGBoost) performance to those of the existing models and are given as:
It is a tabular representation which provides an in-depth view of the classification capabilities of an ML model and also forms the basis for calculating other Performance Evaluation Metrics (PEMs). It presents the counts of true positive (TP), true negative (TN), false positive (FP), and false negative (FN) predictions.
Accuracy plays a vital role in assessing the overall correctness of a classifier. It measures ratio of the correctly predicted instances (the sum of TP and TN) to the total number of instances (the sum of TP, TN, FP, and FN). The accuracy is then calculated using Eq. (2).
Accuracy is commonly used when the distribution is relatively balanced. However, there are more appropriate metrics when dealing with imbalanced datasets. Due to the balanced dataset used in this study, accuracy has been selected as the performance evaluation metric to further evaluate the models’ effectiveness. By leveraging accuracy as the evaluation metric, we aim to provide a complete assessment of the used model’s ability to classify instances of HD within the dataset correctly.
It assesses the classifier’s ability to identify positive instances accurately. Ratio of true positives to the total predicted positives (both TP and FP) is calculated using precision. Precision is particularly useful when the cost of FP is high. Eq. (3) is used for the calculation of precision.
It is also called sensitivity or TP rate. Recall represents the classifier’s potential to correctly identify the positive instances out of all the actual positive instances. The ratio of TP to the total actual positives (both TP and FN) is computed using Recall. It is important when the cost of FN is high. It is generally expressed using Eq. (4).
It offers a balanced assessment of ML models by taking both precision and recall into account. F1 score is especially useful when the class distribution is imbalanced. It is calculated using Eq. (5).
The AUC-ROC (Area Under the Receiver Operating Characteristic Curve) is a popular measure for evaluating the effectiveness of binary classifiers. It measures how well a classifier can separate positive and negative classes at various probability thresholds. The AUC-ROC score ranges between 0 and 1, where a higher score indicates better performance. A score of 0.5 indicates a classifier that performs randomly, while a score of 1 indicates a flawless classifier.
These performance evaluation metrics offer valuable insights into the effectiveness of supervised classifiers and aid in assessing their performance for a given task.
This section presents a comparative analysis of five machine learning (ML) models—XGBoost, AdaBoost, Logistic Regression, Naïve Bayes, and Bagging Classifier—used for heart disease diagnosis. The dataset was split in two subsets, i.e., 70% of the dataset constitute the training subset which was used to train the ML models while 30% of the dataset constitute the testing subset which was used to evaluate the performance of ML models. The models were evaluated under two experimental conditions:
Experiment 1 (Without Outlier Removal): In this experiment, the dataset was subjected to different preprocessing steps such handling missing values using mean imputation, feature scaling using Min-Max normalization and categorical encoding using one hot encoding. The preprocessed dataset was then trained and tested using the training subset and testing subset, respectively.
Experiment 2 (With Outlier Removal): In this experiment, in addition to the preprocessing steps described for Experiment 1, outlier detection was performed using isolation forest. The detected outliers were then subsequently removed from the dataset before training and testing of ML models.
The models were assessed using five key evaluation metrics: accuracy, precision, recall, F1-score, and AUC-ROC. The results of each experiment are discussed in the subsection given below.
4.1 Experiment 1: Model Performance without Outlier Removal
Fig. 7 illustrates the accuracy comparison of different machine learning models in Experiment 1. Among all models, XGB demonstrated the highest accuracy at 88.17%, indicating its strong predictive ability in diagnosing HD. LR followed closely with an accuracy of 87.40%, thus showing its effectiveness in handling structured medical data. The Bagging Classifier also performed competitively, achieving an accuracy of 86.75%. Meanwhile, AB and NB exhibited slightly lower but consistent accuracy values of 86.64% and 86.60%, respectively. These results suggest that while all models provided reliable predictions, XGB and LR had a slight edge in classification performance, likely due to their ability to capture complex relationships within the dataset.
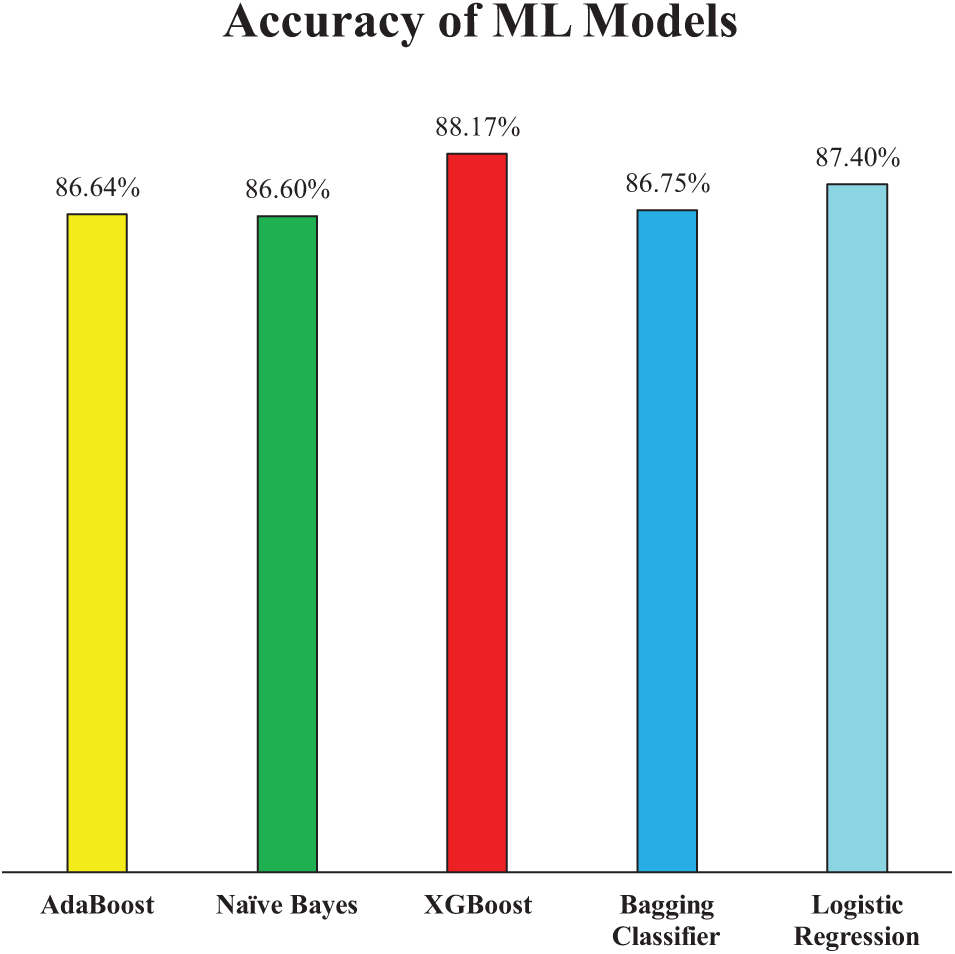
Figure 7: Accuracy of employed ML models (Experiment 1)
Fig. 8 presents the precision scores of the ML models for Experiment 1, further elaborating on their classification effectiveness. Precision is a critical metric, especially in medical diagnostics, as it indicates the model’s ability to minimize false positives. Among the models, NB achieved the highest precision at 90.34%, demonstrating its strong capability to correctly classify HD cases while reducing false alarms. AB and XGB closely followed with precision scores of 89.80% and 89.03%, respectively. Meanwhile, the Bagging Classifier and LR recorded slightly lower precision values of 88.74% and 88.39%, respectively. This minor variation suggests that while all models performed well, XGB had a slight advantage in accurately identifying positive cases, which aligns with their relatively strong accuracy scores.
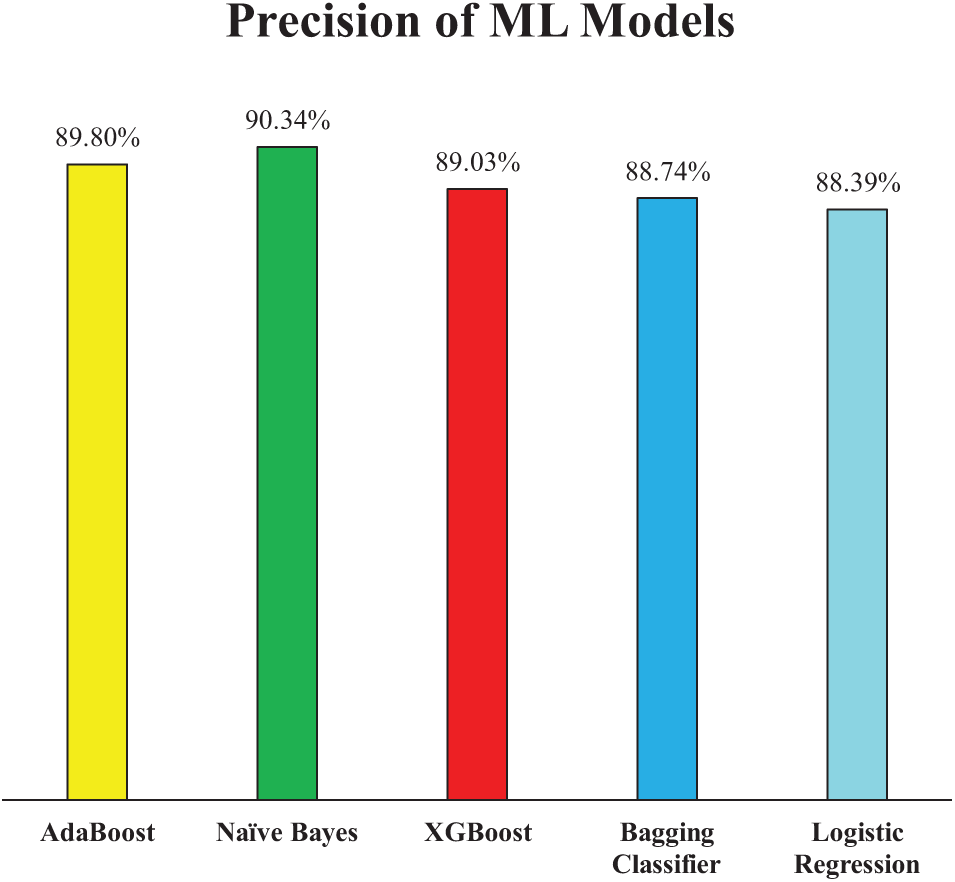
Figure 8: Precision of employed ML models (Experiment 1)
Fig. 9 further supports the models’ performance by illustrating their recall scores, which reflect their ability to correctly identify actual positive cases—an essential aspect in the context of HD diagnosis where missing a true case could have serious consequences. XGB achieved the highest recall at 90.79%, indicating its superior sensitivity and reliability in capturing true heart disease cases. LR also demonstrated strong performance with a recall of 90.13%, closely matching XGB and reaffirming its robustness as observed in both accuracy score and precision score. The Bagging Classifier followed with a recall of 88.16%, showing only a modest drop of approximately 2% compared to XGB. In contrast, NB and AB recorded slightly lower recall scores of 86.18% and 86.84%, respectively—about 4% less than XGB. This suggests that while NB had the highest precision, it has sacrificed some sensitivity, potentially due to its strong bias toward minimizing false positives. These results highlight the trade-off between precision and recall in different models and emphasize the importance of selecting a model that balances both metrics effectively, especially in critical healthcare applications.
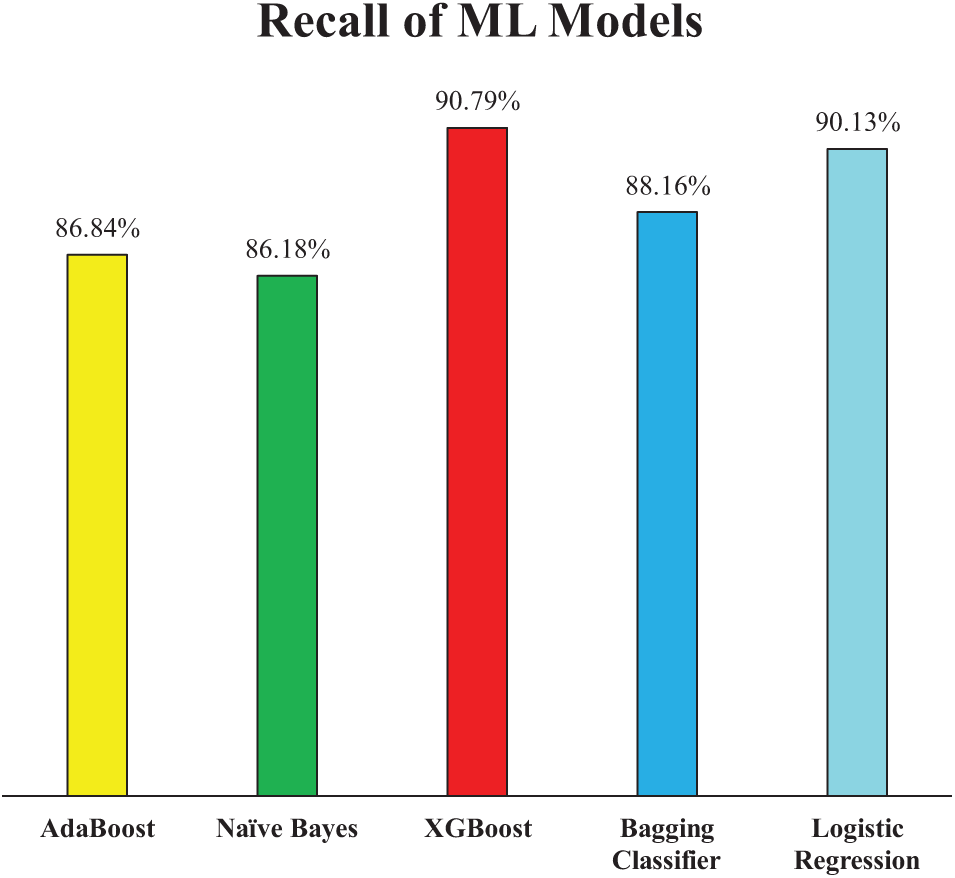
Figure 9: Recall of employed ML models (Experiment 1)
Extending the analysis of model performance, the F1-score presented in Fig. 10 offers a balanced evaluation by combining both precision and recall into a single metric. This is particularly valuable in medical diagnostics, where both false positives and false negatives carry significant consequences. Among the models, XGB achieved the highest F1-score of 89.90%, reinforcing its overall robustness and consistency across all evaluation metrics. LR followed closely with an F1-score of 89.25%, further validating its competitive performance as observed in precision and recall metrics. AB and the Bagging Classifier exhibited very similar F1-scores of 88.29% and 88.45%, respectively, indicating reliable but slightly lower balanced performance when compared to XGB and LR. Notably, although NB had the highest precision among all models, its F1-score was the lowest at 88.22%, approximately 1.7% lower than XGB. This weakness suggests that NB’s comparatively lower recall reduced its overall F1-score, highlighting the trade-off between detecting true positives and avoiding false positives. Therefore, in terms of achieving a balanced and effective classification, XGB stands out as the most robust model in Experiment 1.
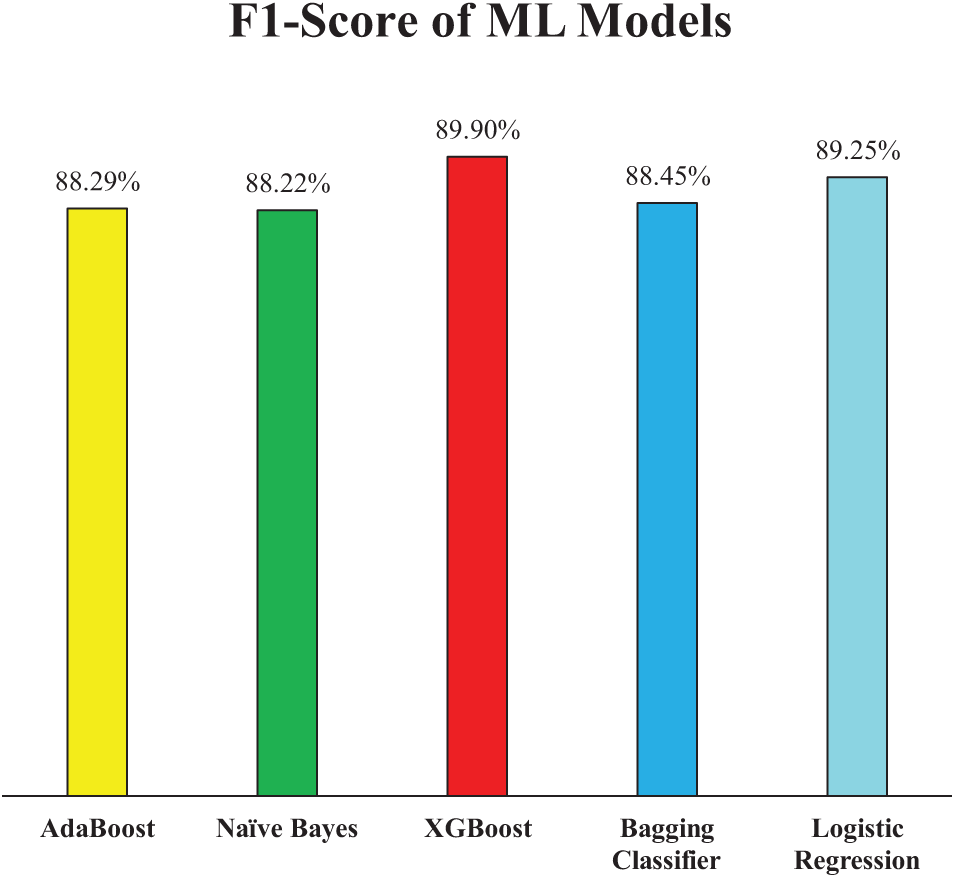
Figure 10: F1-Score of employed ML models (Experiment 1)
The AUC-ROC curves for the ML models are presented in Fig. 11 thus offering deeper insights into the discriminative power of each model across different classification thresholds. The Area Under the ROC Curve (AUC-ROC) reflects a model’s ability to distinguish between classes, i.e., in this case, patients with and without HD. A higher AUC indicates better performance in differentiating true positives from false positives across all thresholds. Among the models, LR achieved the highest AUC-ROC score of 0.94, indicating its strong capability to consistently separate positive and negative cases. NB followed closely with an AUC of 0.93, aligning well with its high precision performance. Both Bagging Classifier and XGB demonstrated solid discriminative performance, each with an AUC-ROC of 0.92, further confirming their reliability. AB, while still effective, showed a slightly lower AUC of 0.91, suggesting a marginally reduced ability to maintain a strong distinction between classes across thresholds. Overall, these AUC-ROC results complement the earlier metrics, reinforcing LR and XGB as the most balanced and reliable models in terms of both sensitivity and specificity in Experiment 1.
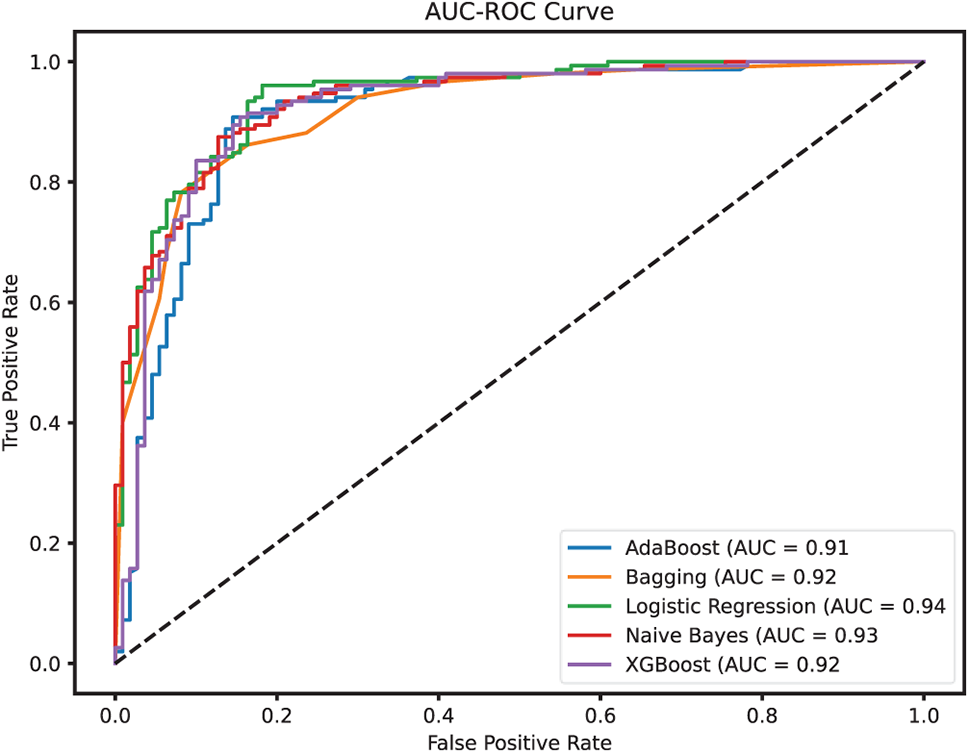
Figure 11: AUC-ROC for the employed ML models (Experiment 1)
The presence of outliers in the dataset likely impacted model performance, particularly for ensemble-based classifiers such as Bagging and AdaBoost. Since these models aggregate multiple weak learners, extreme values in the dataset may have introduced noise, reducing their ability to make optimal predictions. The relatively lower recall scores across certain models also suggest that outliers may have contributed to misclassifications, particularly in cases where heart disease was present but not detected.
4.2 Experiment 2: Impact of Outlier Removal on Model Performance
After incorporating outlier detection and removal using the Isolation Forest algorithm alongside the preprocessing techniques already employed in Experiment 1, a notable enhancement in model performance was observed across all ML models. As depicted in Fig. 12, the accuracy scores of all models improved, demonstrating the effectiveness of removing noisy data points that may have distorted the learning process.
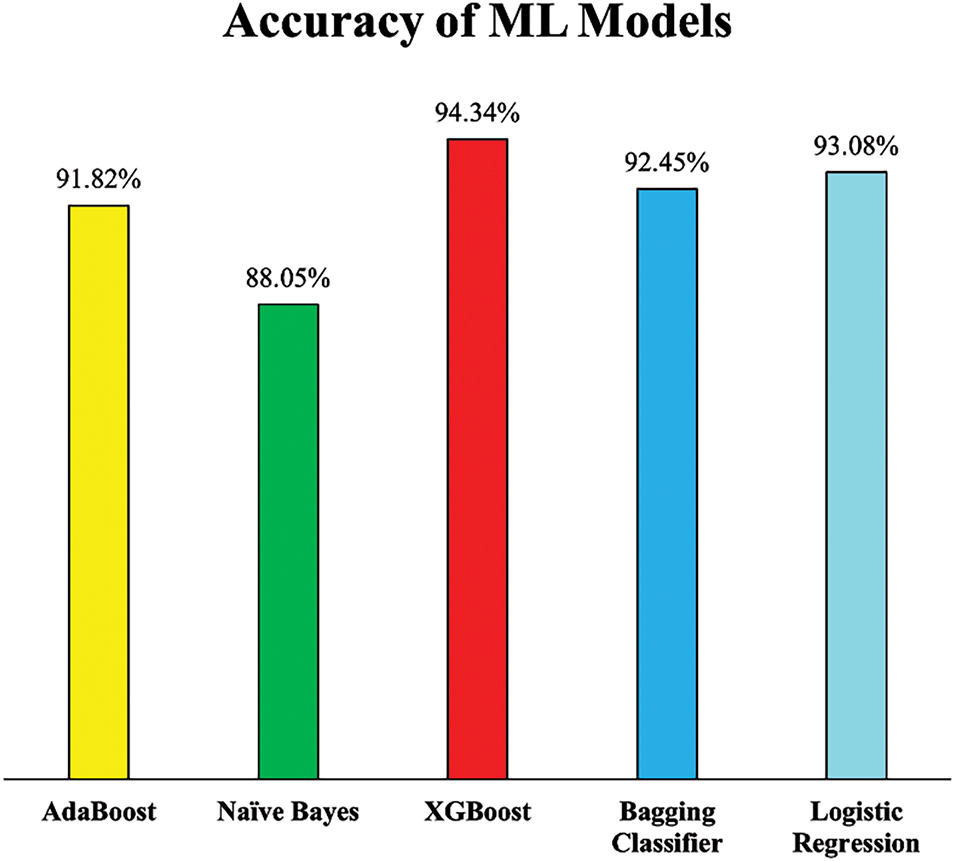
Figure 12: Accuracy of employed ML models (Experiment 2)
Notably, XGB exhibited the most substantial improvement, achieving an accuracy of 94.34%, which reflects a 6.17% increase compared to its performance in Experiment 1. This significant gain suggests that XGB was particularly sensitive to noisy data and benefited greatly from a cleaner dataset. Similarly, LR and the Bagging Classifier also experienced notable boosts in accuracy, reaching 93.08% and 92.45%, respectively, improvements that highlight their enhanced ability to generalize from more consistent and representative training data. Even AB and NB, which had relatively stable performances earlier, demonstrated improvements. The accuracy of AB rose by 5.18%, while NB saw a more modest but still meaningful increase of 1.45%. These improvements collectively emphasize that addressing outliers not only refines the dataset but also positively influences the stability and predictive power of ML models.
The enhancement in precision scores further supports the positive impact of outlier removal through Isolation Forest. As illustrated in Fig. 13, all ML models exhibited increased precision, reflecting a reduced rate of false positives, which is critical in the context of HD diagnosis, where misclassifying a healthy individual as a patient can lead to unnecessary stress and medical intervention.
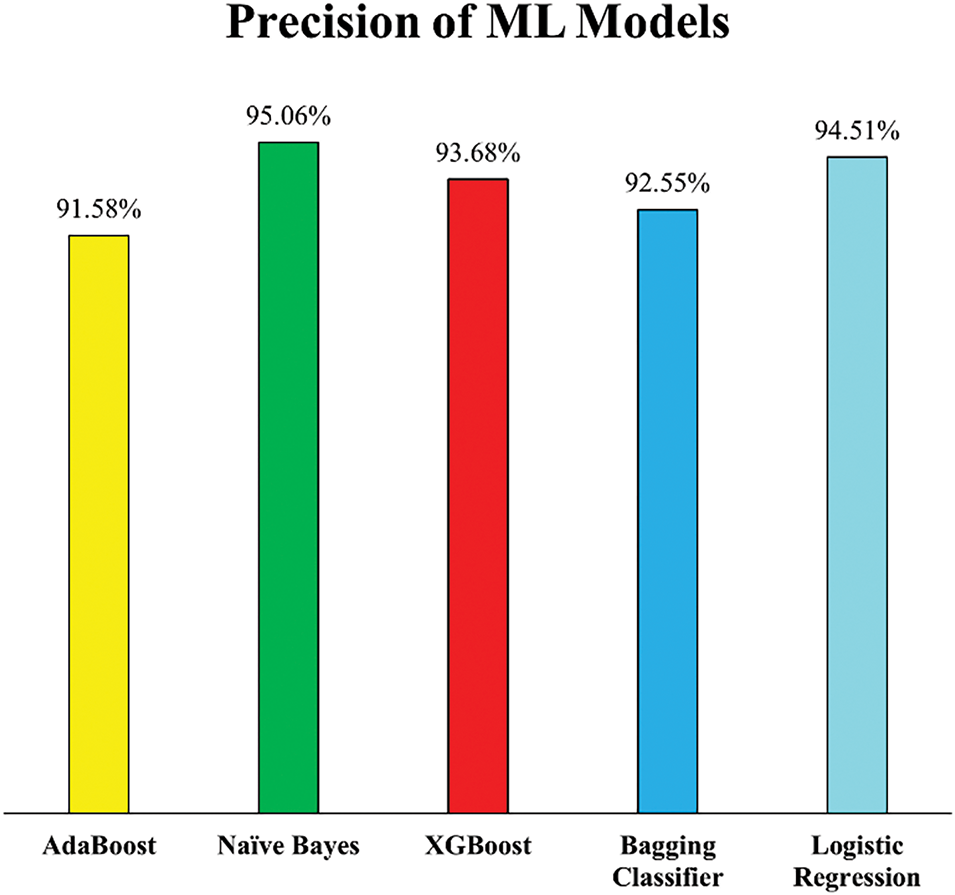
Figure 13: Precision of employed ML models (Experiment 2)
NB recorded the highest precision score of 95.06%, while LR followed closely with 94.51%, indicating these models became significantly more adept at correctly identifying actual HD cases post outlier removal. This improvement suggests that both models, particularly probabilistic ones like NB, benefited from cleaner data distributions that better represented the true class boundaries. Additionally, XGB and the Bagging Classifier showed considerable gains in precision, improving by 4.65% and 3.81%, respectively. These improvements suggest that ensemble models, which rely on multiple weak learners, become more robust when trained on data free from noisy or misleading instances. Conversely, AB showed only a modest precision increase of 1.78%, potentially due to its sensitivity to noisy data even in small amounts. Despite this, the overall rise in precision across all models confirms that the removal of outliers enhanced the models’ reliability in distinguishing between healthy and diseased individuals.
In addition to the improvements in precision, the impact of outlier removal is even more evident when examining the recall scores, which highlight each model’s ability to correctly identify actual HD cases. As depicted in Fig. 14, a significant boost in recall values was observed across most models, indicating that the removal of outliers not only reduced false positives (as seen with precision) but also decreased false negatives, thereby enhancing the models’ sensitivity to detecting true positive cases. XGB demonstrated the most substantial gain, achieving a recall of 96.74%, the highest among all models and a notable improvement over its performance in Experiment 1. This indicates that XGB became more effective at capturing a larger proportion of heart disease cases after the dataset was cleaned of anomalous entries. Similarly, both Bagging and AB achieved recall scores of 94.57%, suggesting that ensemble-based models, particularly those combining multiple learners, benefit considerably from training on a more homogeneous dataset. LR also showed strong performance, attaining a recall of 93.48%, further supporting its robustness in identifying heart disease cases when noise is minimized.
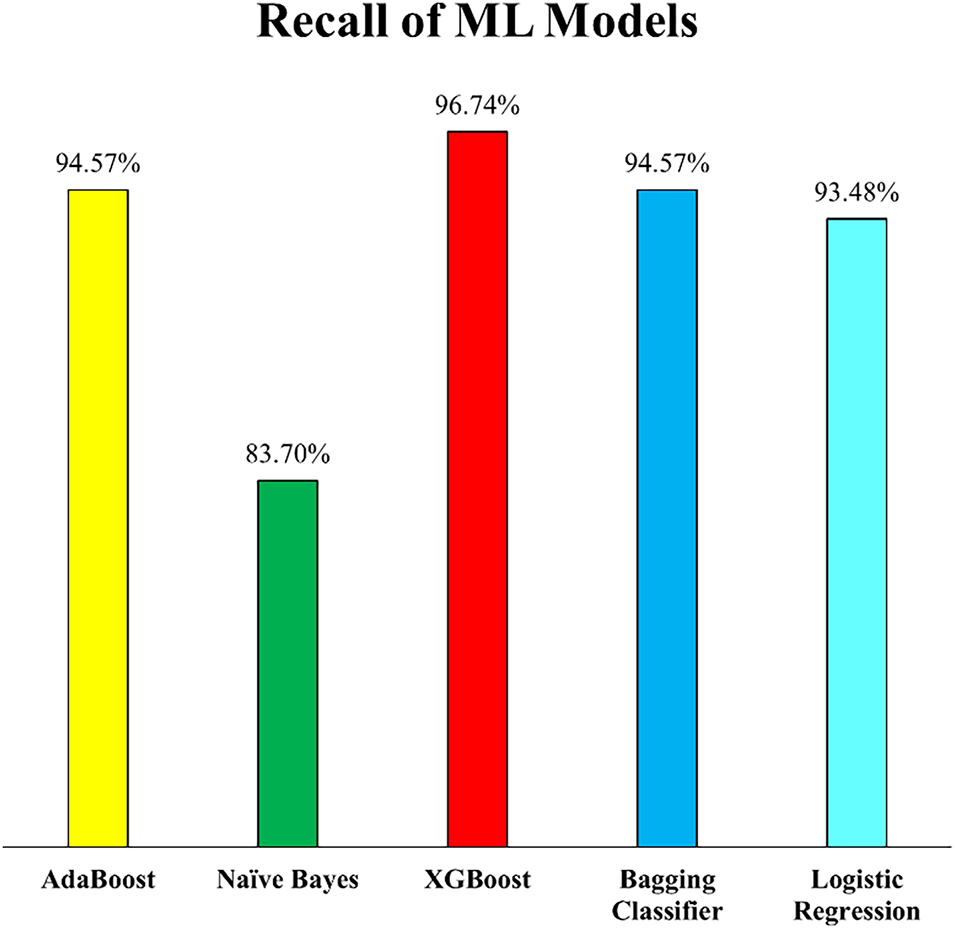
Figure 14: Recall of employed ML models (Experiment 2)
Interestingly, while most models showed improvement, NB experienced a slight decline in recall, decreasing by 2.48% compared to Experiment 1. This could be attributed to the nature of the NB algorithm, which assumes feature independence and might have lost some informative variability due to the removal of outliers that, although noisy, may have contributed favourably for classification. Nonetheless, the overall trend affirms that eliminating outliers enhanced the models’ capability to detect positive cases, a critical factor in medical diagnostics where failing to identify a disease case could have severe consequences.
The F1-scores of the ML models, presented in Fig. 15, offer a comprehensive view of the balance achieved between precision and recall after outlier removal in Experiment 2. These scores further validate the positive impact of incorporating Isolation Forest for outlier detection during data preprocessing. The XGB model led with an F1-score of 95.19%, showing its consistency and robustness in both correctly identifying HD cases and minimizing false predictions. This was closely followed by LR at 93.99%, Bagging Classifier at 93.55%, and AB at 93.05%, all of which demonstrated significant improvements in F1-score as compared to F1-scores of Experiment 1. These increases indicate that the models became more reliable and well-rounded in handling imbalanced classification errors, a critical factor in medical diagnostics.
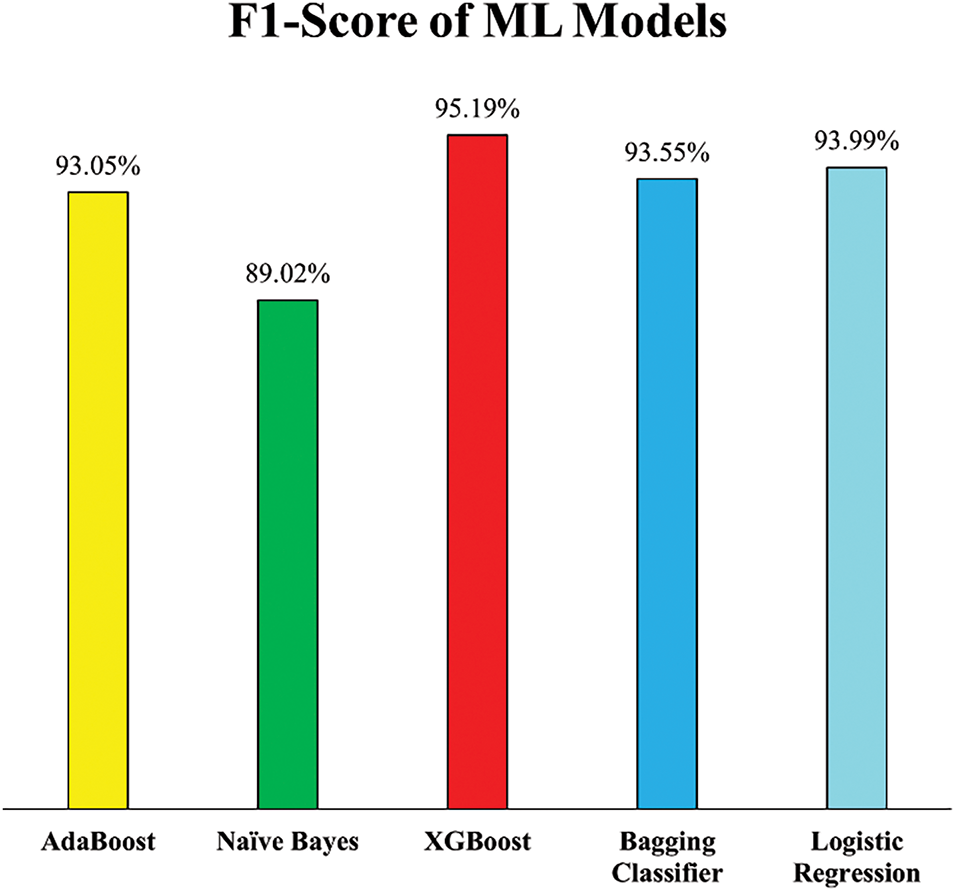
Figure 15: F1-Score of employed ML models (Experiment 2)
While NB showed only a marginal improvement in F1-score i.e., from 88.22% in Experiment 1 to 89.02%, this slight gain suggests that although the model became marginally more stable, its performance may be inherently limited by its simplifying assumptions, particularly when dealing with datasets refined through outlier removal.
The overall classification performance of the models is further supported by the AUC-ROC curves shown in Fig. 16. This metric evaluates the models’ ability to distinguish between the two classes, patients with and without HD. XGB again emerged as the top-performing model with an AUC-ROC score of 0.94, confirming its excellent discriminative power. LR and Bagging Classifier followed with scores of 0.93 and 0.92, respectively, reinforcing their improved capability in accurate classification post outlier elimination. While AB maintained a consistent AUC of 0.91, NB dropped to 0.89, the lowest among the models, which is due to its decreased recall, as discussed previously. These AUC-ROC values reinforce the effectiveness of the outlier detection strategy and highlight the relative strengths and limitations of each model in diagnosing heart disease accurately.
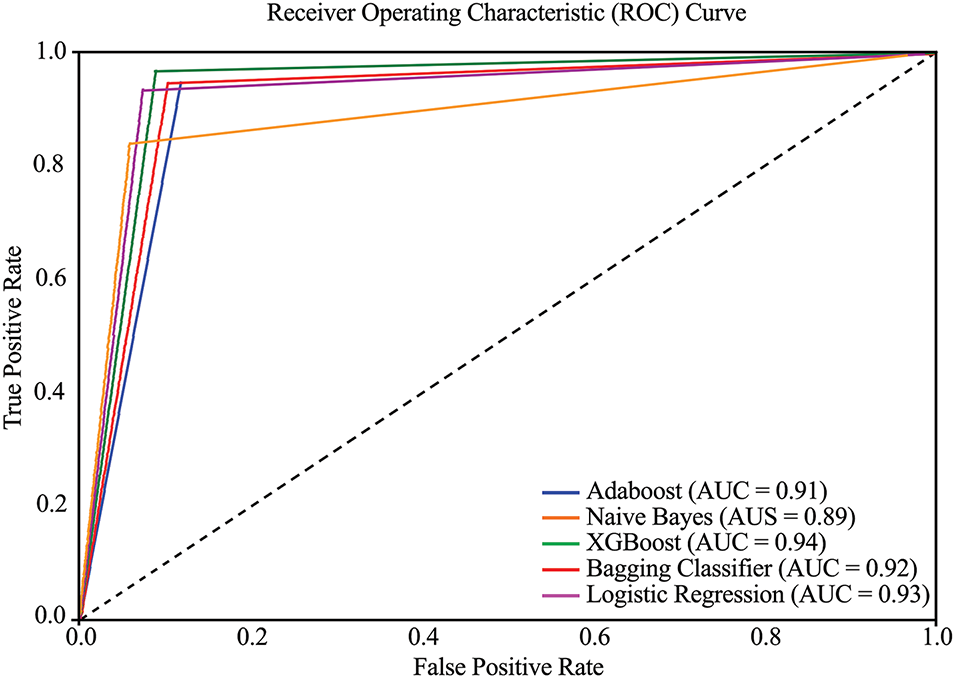
Figure 16: AUC-ROC curve of employed ML models (Experiment 2)
Outlier removal significantly improved ML model’s robustness for diagnosing HD. Most models demonstrated higher accuracy, recall, and F1-score after outlier removal, confirming that noisy data had previously negatively affected the ML Models performance. The biggest improvements were observed for XGB, Bagging, and LR. XGB emerged as the best-performing model for HD classification, achieving 94.34% accuracy and 96.74% recall after outlier removal.
5 Comparative Analysis with Existing Models
In this section, the PEMs of the ML models used in this study are compared with those reported in previous research on HD detection. Various datasets have been utilized in prior studies; however, for the purpose of comparison, only those studies that employed the same dataset as this study have been considered. It is important to note that since this study has utilized the same dataset as these previous studies, the results have been directly extracted and analyzed to ensure a fair and accurate comparison. Table 6 presents detailed comparative analysis of the PEMs, providing an overview of the relative performance of the proposed models compared to existing approaches.
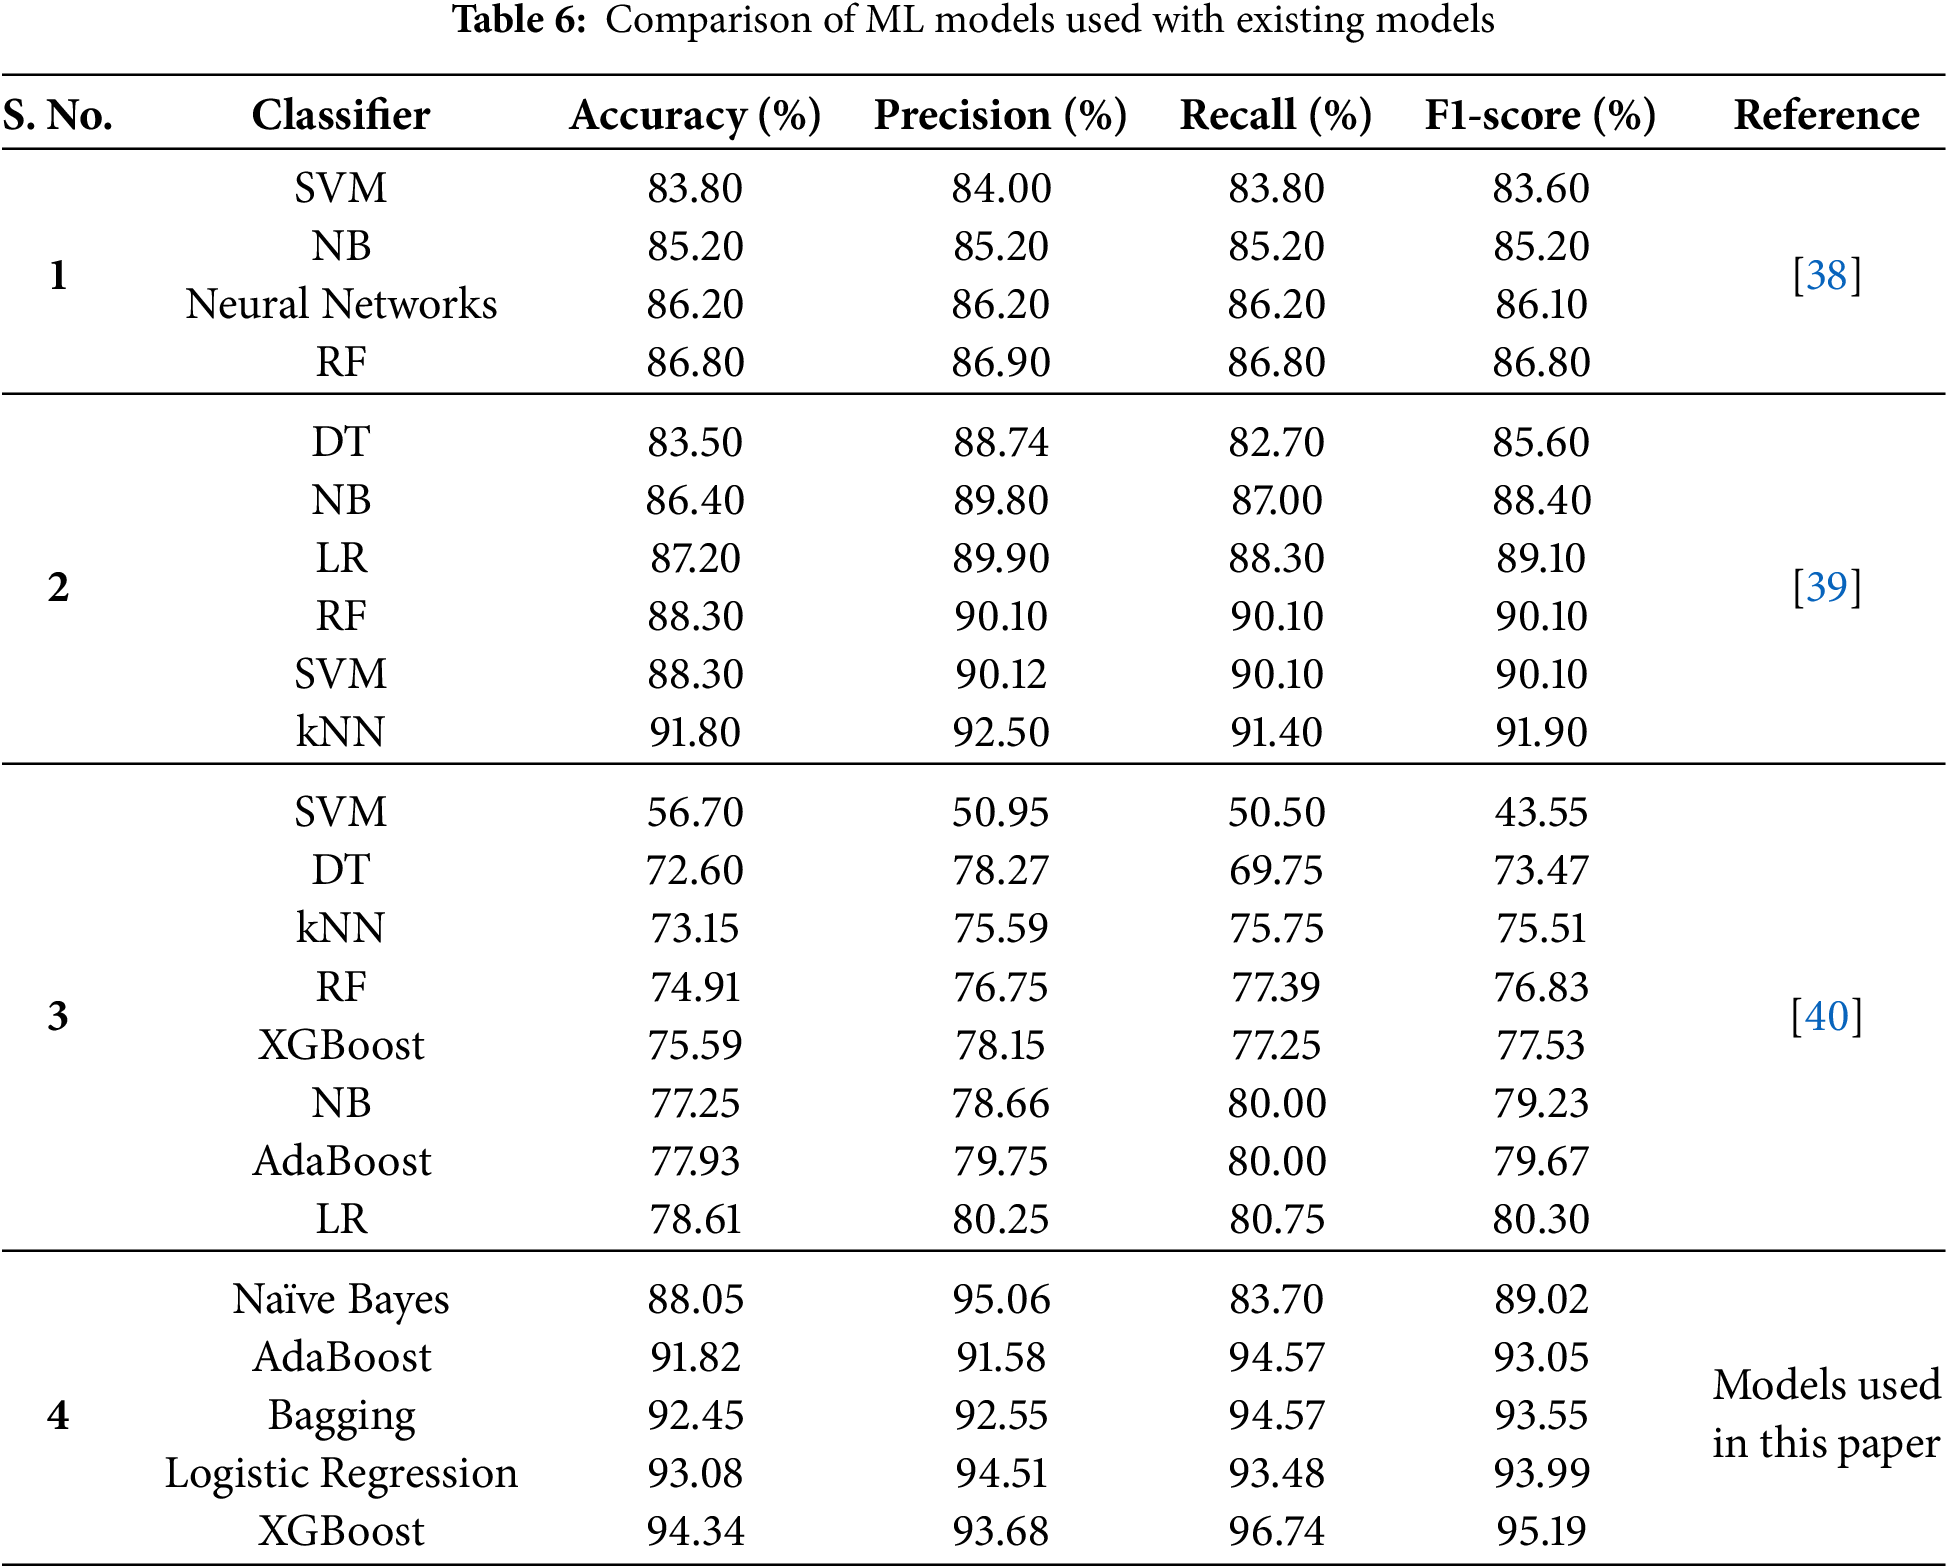
A comparison with previous studies highlights the superiority of the implemented models. For instance, this study outperformed ML models used in [40], where models like SVM and Decision Tree showed significantly lower accuracy (56.70% and 72.60%, respectively). Their low performance is attributed to non-treatment of outliers present in the dataset. Furthermore, the features were also not normalized before training and testing of ML models. In comparison to [39], where classifiers like kNN and Random Forest achieved competitive results (91.80% and 88.30%, respectively), XGBoost demonstrated higher accuracy and F1-score. Although the authors in [39] have used strip charts to detect outliers, but very few outliers in three attributes only were detected using this technique. Logistic Regression, with an accuracy of 93.08%, also surpassed its performance in other studies, such as the 87.20% reported in [39]. The NB model used in this study has 3% higher accuracy and 4% higher F1-score as compare to the NB model used in [38]. The authors in [38] did not utilized pre-processing steps which contributed to lower model’s performance for HD diagnosis as compare to this study. These results underline the impact of robust preprocessing techniques and the adoption of advanced ensemble methods in improving diagnostic accuracy.
XGBoost consistently emerged as the best-performing model in this study. Its superior handling of imbalanced datasets and effective optimization of loss functions enabled it to achieve the highest F1-score, indicating balanced performance across precision and recall. This makes XGBoost especially well-suited for clinical applications where minimizing the impact of false positives and false negatives is crucial. Bagging and Logistic Regression also demonstrated strong and balanced performance, reinforcing their utility in heart disease diagnosis tasks.
This study emphasizes the significance of preprocessing and model selection in achieving state-of-the-art results in medical data analysis. It illustrates that combining effective preprocessing steps with advanced ensemble models like XGBoost can significantly improve the reliability and accuracy of diagnostic systems for HD. These performance improvements are attributed to isolation forests for outlier detection and removal. Outliers introduce noise in the data and disrupt the decision boundary learned by the classifier. By removing them, the decision boundary becomes better aligned with most of the data, which results in improved classification accuracy.
While this study offers valuable insights into heart disease prediction using machine learning models, it has certain limitations and challenges. The dataset used in this study was collected from publicly available sources, i.e., UCI ML repository and Kaggle. Expanding the analysis to larger, more diverse, and real-world clinical datasets from multiple hospitals could impact the findings and improve generalizability. Although multiple performance metrics are considered, real-world clinical adoption would require additional validation, such as external dataset testing and expert evaluation. Additionally, while the selected machine learning techniques performed well, integrating more advanced or hybrid models could further improve predictive accuracy. Moreover, the applicability of the proposed method to other diseases remains uncertain, as this study specifically focuses on cardiovascular disease (CVD) prediction. Future research should explore the effectiveness of these models on broader datasets and different medical conditions to enhance their practical relevance in healthcare.
The increasing mortality rate associated with HD requires the urgent need for reliable and efficient detection methods to identify individuals at risk. This study presents an ML-based framework for HD prediction, demonstrating superior performance compared to existing approaches. The enhanced accuracy of the proposed models can be attributed to the use of a comprehensive dataset and effective preprocessing techniques such as addressing missing values, detecting outliers using the Isolation Forest technique, and applying feature scaling to enhance model efficiency. The models were evaluated using various performance metrics, including accuracy, precision, recall, and F1-score. Among all tested models, XGB achieved the highest predictive accuracy of 94.34% and an F1-score of 95.19%, outperforming other approaches and previous studies in heart disease prediction. LR followed closely, attaining an accuracy of 93.08% and an F1-score of 93.99%, demonstrating strong reliability. Conversely, NB exhibited the weakest performance, with an accuracy of 88.05% and an F1-score of 89.02%, indicating its limitations in capturing intricate patterns within the dataset. The results indicate the effectiveness of the proposed approach in accurately predicting the presence or absence of HD. Despite these promising outcomes, further research is needed to enhance model’s performance through the implementation of various feature selection techniques to identify the most relevant predictors. Additionally, exploring alternative preprocessing methods could further improve model accuracy and efficiency. The integration of advanced hybrid ensemble learning techniques may provide an opportunity to compare and enhance predictive performance beyond traditional models like XGBoost and AdaBoost, potentially leading to greater classification accuracy and model stability. Furthermore, privacy-preserving approaches such as federated learning offer a promising direction for collaborative model training across multiple healthcare institutions, enabling the secure integration of IoT-generated health data with conventional medical records while maintaining data confidentiality. Lastly, validating the proposed models on larger and more diverse datasets would improve their generalizability and reliability across different population segments. Addressing these aspects in future studies will contribute to the development of more accurate and robust heart disease prediction systems.
Acknowledgement: The authors acknowledge the support by the Princess Nourah bint Abdulrahman University Researchers Supporting Project (Project No. PNURSP2025R235), Princess Nourah bint Abdulrahman University, Riyadh, Saudi Arabia.
Funding Statement: This work is funded by Princess Nourah bint Abdulrahman University Researchers Supporting Project number (PNURSP2025R235), Princess Nourah bint Abdulrahman University, Riyadh, Saudi Arabia.
Author Contributions: Conceptualization: Saadia Tabassum and Muhammad Uzair Khan; Coding and simulations: Dawar Awan and Neelam Gohar; Analysis and interpretation of results: Fazal Muhammad and Shahid Khan; Manuscript preparation: Amal Al-Rasheed and Muhammad Ayaz Khan; Acquisition of funding: Muhammad Ayaz Khan and Amal Al-Rasheed. All authors reviewed the results and approved the final version of the manuscript.
Availability of Data and Materials: The data that support the findings of this work is included in this work, while the data sets used in this study are openly accessible.
Ethics Approval: Not applicable, however, the data set used for this study is available on https://www.kaggle.com/datasets/fedesoriano/heart-failure-prediction (accessed on 1 January 2025) under Open Data Commons Open Database License (ODbL) v1.0.
Conflicts of Interest: The authors declare no conflicts of interest to report regarding the present study.
References
1. Park SH, Han K, Jang HY, Park JE, Lee JG, Kim DW, et al. Methods for clinical evaluation of artificial intelligence algorithms for medical diagnosis. Radiology. 2023;306(1):20–31. doi:10.1148/radiol.220182. [Google Scholar] [PubMed] [CrossRef]
2. Abbas SR, Abbas Z, Zahir A, Lee SW. Federated learning in smart healthcare: a comprehensive review on privacy, security, and predictive analytics with IoT integration. Healthcare. 2024;12(24):2587. doi:10.3390/healthcare12242587. [Google Scholar] [PubMed] [CrossRef]
3. Mazhar T, Haq I, Ditta A, Mohsan SAH, Rehman F, Zafar I, et al. The role of machine learning and deep learning approaches for the detection of skin cancer. Healthcare. 2023;11(3):415. doi:10.3390/healthcare11030415. [Google Scholar] [PubMed] [CrossRef]
4. Tanveer M, Richhariya B, Khan RU, Rashid AH, Khanna P, Prasad M, et al. Machine learning techniques for the diagnosis of Alzheimer’s disease: a review. ACM Trans Multimed Comput Commun Appl. 2020;16(1s):1–35. [Google Scholar]
5. Tasin I, Nabil TU, Islam S, Khan R. Diabetes prediction using machine learning and explainable AI techniques. Healthc Technol Lett. 2023;10(1–2):1–10. doi:10.1049/htl2.12039. [Google Scholar] [PubMed] [CrossRef]
6. Fatima N, Liu L, Hong S, Ahmed H. Prediction of breast cancer, comparative review of machine learning techniques, and their analysis. IEEE Access. 2020;8:150360–76. doi:10.1109/ACCESS.2020.3016715. [Google Scholar] [CrossRef]
7. Acer I, Bulucu FO, Içer S, Latifoğlu F. Early diagnosis of pancreatic cancer by machine learning methods using urine biomarker combinations. Turk J Electr Eng Comput Sci. 2023;31(1):112–25. doi:10.55730/1300-0632.3974. [Google Scholar] [CrossRef]
8. Rani P, Kumar R, Jain A, Lamba R, Sachdeva RK, Kumar K, et al. An extensive review of machine learning and deep learning techniques on heart disease classification and prediction. Arch Comput Methods Eng. 2024;31(6):3331–49. doi:10.1007/s11831-024-10075-w. [Google Scholar] [CrossRef]
9. Shaban WM. Early diagnosis of liver disease using improved binary butterfly optimization and machine learning algorithms. Multimed Tools Appl. 2024;83(10):30867–95. doi:10.1007/s11042-023-16686-y. [Google Scholar] [CrossRef]
10. Asiri AA, Khan B, Muhammad F, Alshamrani HA, Alshamrani KA, Irfan M, et al. Machine learning-based models for magnetic resonance imaging (MRI)-based brain tumor classification. Intell Autom Soft Comput. 2023;36(1):299–312. doi:10.32604/iasc.2023.032426. [Google Scholar] [CrossRef]
11. Oskouei AG, Abdolmaleki N, Bouyer A, Arasteh B, Shirini K. Efficient superpixel-based brain MRI segmentation using multi-scale morphological gradient reconstruction and quantum clustering. Biomed Signal Process Control. 2025;100(4):107063. doi:10.1016/j.bspc.2024.107063. [Google Scholar] [CrossRef]
12. Khan MA, Hashim MJ, Mustafa H, Baniyas MY, Al Suwaidi SKBM, AlKatheeri R, et al. Global epidemiology of ischemic heart disease: results from the global burden of disease study. Cureus. 2020;12(7):e9349. doi:10.7759/cureus.9349. [Google Scholar] [PubMed] [CrossRef]
13. Mijwil MM, Shukur BS. A scoping review of machine learning techniques and their utilisation in predicting heart diseases. Ibn AL-Haitham J Pure Appl Sci. 2022;35(3):175–89. doi:10.30526/35.3.2813. [Google Scholar] [CrossRef]
14. Rahman MM. A web-based heart disease prediction system using machine learning algorithms. Netw Biol. 2022;12(2):64. [Google Scholar]
15. Prabu S, Thiyaneswaran B, Sujatha M, Nalini C, Rajkumar S. Grid search for predicting coronary heart disease by tuning hyper-parameters. Comput Syst Sci Eng. 2022;43(2):737–49. doi:10.32604/csse.2022.022739. [Google Scholar] [CrossRef]
16. Zaidi SAJ, Ghafoor A, Kim J, Abbas Z, Lee SW. HeartEnsembleNet: an innovative hybrid ensemble learning approach for cardiovascular risk prediction. Healthcare. 2025;13(5):507. doi:10.3390/healthcare13050507. [Google Scholar] [PubMed] [CrossRef]
17. Takci H. Improvement of heart attack prediction by the feature selection methods. Turk J Electr Eng Comput Sci. 2018;26(1):1–10. doi:10.3906/elk-1611-235. [Google Scholar] [CrossRef]
18. Babič F, Olejár J, Vantová Z, Paralič J. Predictive and descriptive analysis for heart disease diagnosis. In: 2017 Federated Conference on Computer Science and Information Systems (FedCSIS); 2017 Sep 3–6; Prague, Czech Republic. [Google Scholar]
19. Haq AU, Li JP, Memon MH, Nazir S, Sun R. A hybrid intelligent system framework for the prediction of heart disease using machine learning algorithms. Mob Inf Syst. 2018;2018(1):3860146. doi:10.1155/2018/3860146. [Google Scholar] [CrossRef]
20. Dinesh KG, Arumugaraj K, Santhosh KD, Mareeswari V. Prediction of cardiovascular disease using machine learning algorithms. In: 2018 International Conference on Current Trends towards Converging Technologies (ICCTCT); 2018 Mar 1–3; Coimbatore, India. [Google Scholar]
21. Gonsalves AH, Thabtah F, Mohammad RMA, Singh G. Prediction of coronary heart disease using machine learning: an experimental analysis. In: Proceedings of the 2019 3rd International Conference on Deep Learning Technologies; 2019 Jul 5–7; Xiamen, China. [Google Scholar]
22. Ganesan M, Sivakumar N. IoT based heart disease prediction and diagnosis model for healthcare using machine learning models. In: 2019 IEEE International Conference on System, Computation, Automation and Networking (ICSCAN); 2019 Mar 29–30; Pondicherry, India. [Google Scholar]
23. Mienye ID, Sun Y, Wang Z. An improved ensemble learning approach for the prediction of heart disease risk. Inform Med Unlocked. 2020;20(8):100402. doi:10.1016/j.imu.2020.100402. [Google Scholar] [CrossRef]
24. Li JP, Haq AU, Din SU, Khan J, Khan A, Saboor A. Heart disease identification method using machine learning classification in e-healthcare. IEEE Access. 2020;8:107562–82. doi:10.1109/ACCESS.2020.3001149. [Google Scholar] [CrossRef]
25. Ramesh T, Lilhore UK, Poongodi M, Simaiya S, Kaur A, Hamdi M. Predictive analysis of heart diseases with machine learning approaches. Malays J Comput Sci. 2022;1:132–48. [Google Scholar]
26. Ahmed S, Shaikh S, Ikram F, Fayaz M, Alwageed HS, Khan F, et al. Prediction of cardiovascular disease on self-augmented datasets of heart patients using multiple machine learning models. J Sens. 2022;2022(1):3730303. doi:10.1155/2022/3730303. [Google Scholar] [CrossRef]
27. Saboor A, Usman M, Ali S, Samad A, Abrar MF, Ullah N. A method for improving prediction of human heart disease using machine learning algorithms. Mob Inf Syst. 2022;2022(1):1410169. doi:10.1155/2022/1410169. [Google Scholar] [CrossRef]
28. Shukur BS, Mijwil MM. Involving machine learning techniques in heart disease diagnosis: a performance analysis. Int J Electr Comput Eng. 2023;13(2):2177. [Google Scholar]
29. Benish AA, Muhammad I, Amna Z, Sidra K, Rubina S. Impact of computing platforms on classifier performance in heart disease prediction. Mehran Univ Res J Eng Technol. 2025;44(2):155–63. doi:10.22581/muet1982.3268. [Google Scholar] [CrossRef]
30. Detrano R, Janosi A, Steinbrunn W, Pfisterer M, Schmid JJ, Sandhu S, et al. International application of a new probability algorithm for the diagnosis of coronary artery disease. Am J Cardiol. 1989;64(5):304–10. doi:10.1016/0002-9149(89)90524-9. [Google Scholar] [PubMed] [CrossRef]
31. Fedesoriano. Heart Failure Prediction Dataset [Internet]. Kaggle; 1989 [cited 2025 Feb 4]. Available from: https://www.kaggle.com/datasets/fedesoriano/heart-failure-prediction/data. [Google Scholar]
32. Misra P, Yadav AS. Impact of preprocessing methods on healthcare predictions. In: Proceedings of 2nd International Conference on Advanced Computing and Software Engineering (ICACSE); 2019 Feb 8–9; Sultanpur, India. [Google Scholar]
33. Rashed-Al-Mahfuz M, Haque A, Azad A, Alyami SA, Quinn JM, Moni MA. Clinically applicable machine learning approaches to identify attributes of chronic kidney disease (CKD) for use in low-cost diagnostic screening. IEEE J Transl Eng Health Med. 2021;9:1–11. doi:10.1109/JTEHM.2021.3073629. [Google Scholar] [PubMed] [CrossRef]
34. Hasan MK, Alam MA, Das D, Hossain E, Hasan M. Diabetes prediction using ensembling of different machine learning classifiers. IEEE Access. 2020;8:76516–31. doi:10.1109/ACCESS.2020.2989857. [Google Scholar] [CrossRef]
35. Ahsan MM, Mahmud MP, Saha PK, Gupta KD, Siddique Z. Effect of data scaling methods on machine learning algorithms and model performance. Technologies. 2021;9(3):52. doi:10.3390/technologies9030052. [Google Scholar] [CrossRef]
36. Patil S, Bhosale S. Improving cardiovascular disease prognosis using outlier detection and hyperparameter optimization of machine learning models. Rev D’Intelligence Artif. 2023;37(4):1069–80. doi:10.18280/ria.370429. [Google Scholar] [CrossRef]
37. Khan B, Naseem R, Muhammad F, Abbas G, Kim S. An empirical evaluation of machine learning techniques for chronic kidney disease prophecy. IEEE Access. 2020;8:55012–22. doi:10.1109/ACCESS.2020.2981689. [Google Scholar] [CrossRef]
38. Pradini RS, Anshori M, Haris MS, Marilia B, Geraldo T. Prediction model for diagnosing heart disease using classification algorithm. J World Future Med Health Nurs. 2023;1(2):125–33. doi:10.55849/health.v1i2.347. [Google Scholar] [CrossRef]
39. Muhammad G, Naveed S, Nadeem L, Mahmood T, Khan AR, Amin Y, et al. Enhancing prognosis accuracy for ischemic cardiovascular disease using K nearest neighbor algorithm: a robust approach. IEEE Access. 2023;11:97879–95. doi:10.1109/ACCESS.2023.3312046. [Google Scholar] [CrossRef]
40. Jose R, Thomas A, Guo J, Steinberg R, Toma M. Evaluating machine learning models for prediction of coronary artery disease. Glob Transl Med. 2024;3(1):2669. doi:10.36922/gtm.2669. [Google Scholar] [CrossRef]
Cite This Article
 Copyright © 2025 The Author(s). Published by Tech Science Press.
This work is licensed under a Creative Commons Attribution 4.0 International License , which permits unrestricted use, distribution, and reproduction in any medium, provided the original work is properly cited.
 Downloads
 Citation Tools