
 Submit a Paper
 Propose a Special lssue
 Open Access
ARTICLE
Explainable Diabetic Retinopathy Detection Using a Distributed CNN and LightGBM Framework
1 Artificial Intelligence and Machine Learning Department, Symbiosis Institute of Technology, Symbiosis International (Deemed) University, Pune, 412115, India
2 Department of Computer Engineering, Pimpri Chinchwad College of Engineering, SPPU, Pune, 411044, India
3 Artificial Intelligence and Machine learning Department, Symbiosis Institute of Technology, Symbiosis International (Deemed) University, Pune, 412115, India
4 Centre for Advanced Modelling and Geospatial Information Systems (CAMGIS), School of Civil and Environmental Engineering, University of Technology Sydney, NSW 2007, Australia
5 Department of Geology & Geophysics, College of Science, King Saud University, Riyadh, 11451, Saudi Arabia
* Corresponding Author: Biswajeet Pradhan. Email:
(This article belongs to the Special Issue: Computer Vision and Image Processing: Feature Selection, Image Enhancement and Recognition)
Computers, Materials & Continua 2025, 84(2), 2645-2676. https://doi.org/10.32604/cmc.2025.061018
Received 14 November 2024; Accepted 11 April 2025; Issue published 03 July 2025
 View Full Text
 Download PDF
Abstract
Diabetic Retinopathy (DR) is a critical disorder that affects the retina due to the constant rise in diabetics and remains the major cause of blindness across the world. Early detection and timely treatment are essential to mitigate the effects of DR, such as retinal damage and vision impairment. Several conventional approaches have been proposed to detect DR early and accurately, but they are limited by data imbalance, interpretability, overfitting, convergence time, and other issues. To address these drawbacks and improve DR detection accurately, a distributed Explainable Convolutional Neural network-enabled Light Gradient Boosting Machine (DE-ExLNN) is proposed in this research. The model combines an explainable Convolutional Neural Network (CNN) and Light Gradient Boosting Machine (LightGBM), achieving highly accurate outcomes in DR detection. LightGBM serves as the detection model, and the inclusion of an explainable CNN addresses issues that conventional CNN classifiers could not resolve. A custom dataset was created for this research, containing both fundus and OCTA images collected from a real-time environment, providing more accurate results compared to standard conventional DR datasets. The custom dataset demonstrates notable accuracy, sensitivity, specificity, and Matthews Correlation Coefficient (MCC) scores, underscoring the effectiveness of this approach. Evaluations against other standard datasets achieved an accuracy of 93.94%, sensitivity of 93.90%, specificity of 93.99%, and MCC of 93.88% for fundus images. For OCTA images, the results obtained an accuracy of 95.30%, sensitivity of 95.50%, specificity of 95.09%, and MCC of 95%. Results prove that the combination of explainable CNN and LightGBM outperforms other methods. The inclusion of distributed learning enhances the model’s efficiency by reducing time consumption and complexity while facilitating feature extraction.Keywords
DR majorly appears in diabetic patients and is noted as a retinal vascular disorder marked by abnormal growth in the blood vessels of the retina. Several researchers report that DR attains symptoms such as hemorrhages, exudates, and microaneurysms [1]. Thin and weak blood veins cause hemorrhages, while the loss of proteins in tiny retinal veins causes exudates, appearing as pale-yellow patches in the eyes [2]. A significant portion of diabetic patients worldwide are unaware of DR and its severity, leading to blindness, heart attacks, kidney failure, and other complications [3,4]. There are two types of DR: non-proliferative diabetic retinopathy (NPDR) and proliferative diabetic retinopathy (PDR). Both types cause swelling, leakage in the blood vessels, and vision impairment in mild, moderate, and severe forms of DR, respectively [2]. Early detection is crucial to mitigate the long-term effects of DR. Manual detection of DR requires well-trained experts to analyze the fundus images, which is a time-consuming process even when done digitally [5]. Given the increasing prevalence of diabetes worldwide, improper screening of DR can result in irreversible damage [2].
Manual detection by ophthalmologists often leads to treatments involving eye lenses and surgeries, which can be ineffective if DR is detected late. To address the limitations of manual detection [6], Computer-aided diagnosis (CAD) has emerged as a promising solution [3]. Additionally, Artificial Intelligence (AI) offers precise DR detection capabilities. Machine learning (ML) and deep learning (DL) techniques are particularly effective in recording visual defects of the retina [7,8]. Specifically, Convolutional Neural Networks (CNNs) are widely used to process images and time series data related to DR [9,10]. More specifically, DL architectures offer outstanding performance in practical applications and address numerous issues in Natural Language Processing (NLP) and Computer Vision (CV) [11]. For instance, in the CNN model [12], one study accurately identified the locations of wound lesions, while another study used a DL model to determine the [13] severity of these lesions [4]. Furthermore, Recurrent Neural Networks (RNNs) have been utilized in DR detection research to extract significant features [14]. Numerous computer-aided systems integrating advanced algorithms and telemedicine technologies are developed for early and highly accurate performance in DR detection [8,15].
Though deep learning (DL) models have achieved significant outcomes, certain drawbacks persist. Imbalanced dataset issues have affected accurate and reliable DR detection [16]. In real-world applications, using imbalanced datasets to detect diseases and predict quality has led to accuracy variation in the majority class and poor performance in the minority class [17]. This imbalance results in irregular classification rates and bias towards the minority class. Additionally, models have faced challenges with smaller datasets, leading to underfitting issues, while larger datasets have caused overfitting issues [18]. One study’s feature fusion mechanism resulted in DR’s misclassification [4], leading to poor performance. Another model ignored segmentation and feature extraction mechanisms, negatively impacting performance and outcomes [11]. This highlights the need for autoencoders to achieve more significant results [2]. Furthermore, issues with data imbalance and minority class classification remain problematic [17].
To overcome the above-mentioned limitations, this research proposes a distributed Explainable Convolutional Neural network-enabled Light Gradient Boosting Machine (DE-ExLNN) for accurately detecting DR. The major contributions of this paper are as follows: First, a Distributed Explainable Deep Convolutional Neural Network-enabled Light Gradient Boosting Machine (DE-ExLNN) model is utilized to detect diabetic retinopathy (DR) accurately. Second, ResNet 101 is employed to extract features from OCTA images and capture comprehensive patterns, while statistical features extract information from fundus images. The DE-ExLNN model integrates an explainable CNN and a distributed learning mechanism into LightGBM to identify DR. Third, effectively, LightGBM serves as the detection model, and including an explainable CNN addresses issues that conventional CNN classifiers could not resolve. The model overcomes temporal complexity problems and initiates parallel computing with the support of a distributed learning mechanism. The explainable CNN handles convergence problems, resulting in effective detection.
The article’s description is organized as follows: Section 2 describes the conventional methods, Section 3 imposes the proposed methodology, Section 4 analyses the pattern of the data, Section 5 presents the results and discussion, and Section 6 concludes the article.
Conventional methods in DR detection offer several advantages but face challenges that prevent them from becoming the standard approach. These models are described in this section.
Mustafa et al. [2] introduced a multi-stream Deep Neural Network combining ResNet-50 and DenseNet-121 for extracting features in conjunction with an ensemble ML classifier to grade and classify DR. Principal Component Analysis (PCA) was incorporated to handle high-dimensional feature vectors, resulting in high outcomes in terms of reduced categories. However, the model worked with a minimum amount of data, suggesting potential for improvement to achieve more accurate outcomes. However, the model neglected segmentation techniques, which could potentially enhance the efficacy of the research.
Md. Nur-A-Alam et al. [4] presented a faster Region-based CNN (faster-RCNN) to achieve highly accurate detection. Adaptive median filtering and feature extraction processes provided better noise removal and more precise detection. However, the dataset used in their research was imbalanced, indicating the potential need for additional mechanisms, such as GANs (Generative Adversarial Networks), to improve performance. Moreover, the feature fusion mechanism led to misclassifications, suggesting that fine-tuning could provide more accurate results with diverse images.
Farg et al. [19] incorporated DenseNet and a channel attention mechanism to attain highly accurate outcomes. Despite encountering issues related to data imbalance, the model demonstrated low training time and high inference speed, exploring the same batch size. The performance of various CBAMs and several imbalanced techniques were evaluated to achieve superior outcomes, although challenges persisted regarding data imbalance and minor classification.
Nazih et al. [3] utilized the vision transformer (ViT) to detect DR with fundus image inputs. Their model effectively captured long-term dependencies and incorporated a transfer learning mechanism to train a large-scale model even with small datasets. Data balancing mechanisms and hyperparameter optimizations were included to achieve higher performance and more stable models. However, the model did not include lesion segmentation, and the training was not tested against adversarial attacks, resulting in some uncertainty. Future improvements could include lightweight models to achieve more efficient outcomes.
Naz et al. [17] suggested using a deep convolutional generative adversarial network (DCGAN) that attained high accuracy outcomes. This model was applied to detection in screening programs, telemedicine, remote monitoring, healthcare resource optimization, and more. Future research could enhance accuracy by enlarging datasets to reduce overfitting issues and optimizing parameters. Additionally, incorporating data augmentation mechanisms could further improve results.
Jagadesh et al. [18] introduced an improved contoured convolutional transformer (IC2T) and a Rock Hyrax Swarm-based coordination attention mechanism for segmentation and classification. These models achieved a high accuracy rate in detecting DR, but they only worked with fundus images and could be expanded to include both fundus and OCTA images.
Ali et al. [20] introduced the IR-CNN model in their research on DR detection. Resnet50 and Inceptionv3 served as the feature extraction models, followed by the classification with CNN, achieving high-efficiency outcomes and classifying various levels of DR severity. The model required different data augmentation techniques to address underfitting issues and expand the dataset.
Yang et al. [21] implemented the Inception-V4 architecture in conjunction with the dynamic Snow Leopard Optimization (Inception-V4/DSLO) model to improve the efficiency of DR detection. Specifically, the DSLO algorithm optimizes the feature selection process, thus resulting in enhanced diagnostic performance. Further, the Inception-V4/DSLO model effectively analyzed digital images and assisted in identifying the early signs of DR, including optic nerve edema or leaking vessels. Further, the innovative model resulted in high robustness in early DR detection, facilitating timely interventions and enhancing patient outcomes.
Melin et al. [22] developed the Particle Swarm Optimization (PSO) enabled CNN model for classifying DR images. In the PSO-CNN model, the PSO algorithm optimally tuned the hyperparameters of the CNN and assisted in reducing the classification error. The key parameters, including the number of convolutional layers, filter size, number of neurons, batch size, and number of epochs, are optimized utilizing the PSO algorithm, resulting in improved performance.
AlBalawi et al. [23] developed an IoT-Opthom-CAD model incorporating the Swin transformers and the (LightGBM) method for classifying the retinal fundus images. More specifically, the Swin transformers and LightGBM models assisted in finding diverse eye diseases from colored fundus images after using data augmentation techniques. Further, the dynamic attention assisted in focusing on different parts of the image, and the application Grad-CAM explained the decision-making process, improving the model’s transparency and interpretability. However, the extensive data augmentation resulted in overfitting issues that limited the performance of the model. Table 1 depicts the comparative study of the literature works analyzed in the research.

From the literature mentioned above, several challenges were encountered:
Data imbalance: The issue of data imbalance required clarification regarding appropriate methods to achieve enhanced outcomes [2].
Data augmentation: The model necessitated data augmentation techniques to address issues related to overfitting and convergence [17].
Limited input images: Many research efforts focused solely on fundus input images, indicating the potential for expansion to include OCTA images to achieve more appropriate outcomes [18].
Pattern extraction and segmentation: Challenges persisted in effectively extracting patterns, providing detailed structural depictions, and incorporating segmentation techniques [8].
Hence, as mentioned above, our paper addresses the challenges identified in the literature by introducing a distributed Explainable Convolutional Neural Network-enabled Light Gradient Boosting Machine (DE-ExLNN) model. This approach effectively mitigates data imbalance through a custom dataset that includes both fundus and OCTA images, enhancing the robustness of the model. Additionally, by integrating explainable CNN and LightGBM, our model improves interpretability and reduces overfitting and convergence issues, which were prevalent in previous methods. The inclusion of distributed learning further optimizes efficiency, addressing the identified limitations and significantly improving the accuracy of Diabetic Retinopathy detection.
In this section, the data and the steps involved in the research of DR detection are explained as follows.
3.1 Detection of DR with Distributed Explainable Deep LightGBM-CNN
The main intention is to develop several ML and DL techniques for DR detection using both Secondary and Primary datasets. The research compares both modalities, considering primary and secondary datasets, to demonstrate the efficiency of the newly created custom dataset. Fundus images utilized in the research are sourced from the custom fundus dataset, while OCTA images are sourced from the custom OCTA datasets. The study primarily focuses on comparing primary and secondary datasets. Feature extraction is applied to fundus images, extracting patterns using statistical features such as Mean, Median, and Standard Deviation. Additionally, ResNet-101 is employed to extract significant features from OCTA images. These features are then distributed into the Explainable LightGBM-CNN model for accurate DR detection. Test data from various datasets are fed into the research model and compared with outcomes from the custom dataset to demonstrate the latter’s efficiency in DR detection. The workflow of the research in DR detection is illustrated in Fig. 1.

Figure 1: Methodology of DR detection using DE-ExLNN
The input fundus images for the research are obtained from the custom fundus dataset, whereas the OCTA images are obtained from the custom OCTA datasets. The images from the FUNDUS dataset are represented as,
where,
where,
3.1.2 Preprocessing of Input Image
Preprocessing of both fundus and OCTA images involves the use of a bilateral filter to remove noise and achieve accurate detection of DR. Bilateral filtering functions as a non-linear, non-iterative, and local means of filtering mechanism, computing both the geometric closeness and color similarities of image pixels [24]. In addition, bilateral filtering is the advancement of the Gaussian filter, which overcomes the noise reduction issues at the edges having no smooth spatial variations. The estimated bilateral filtering of the assumed pixel r is expressed as,
where,
where,
Further, the color similarity function is evaluated as,
where,
3.1.3 Preprocessed Image Augmentation
The process of enlarging the dataset provided to apply several transformations to input fundus and OCTA images is called data augmentation. This technique is commonly utilized in deep learning mechanisms to address challenges arising from limited data. Specifically, in diabetic retinopathy (DR) detection, data augmentation techniques play a crucial role in enhancing the model’s performance. As such, several data augmentation techniques are incorporated, including:
a) Adjust Brightness: To address the most significant changes in the input image, the fundus and OCTA images’ brightness are modified in the data augmentation process.
b) Translation: The process of identifying the objects irrespective of their locations in the image is known as translation, where the images are shifted in all directions to mitigate the effect of positional bias [25].
c) Gaussian Blur: One of the most unique methods to minimize the noise occurrences in the image is termed Gaussian Blur, which smoothens the image by figuring out the imperfections and irregularities that occur in the image [26]. In addition, the Gaussian Blur is not completely dependent on the specific noise, which remains the major advantage of utilizing it as one of the data augmentation mechanisms. The Blur function with the Gaussian filter is initiated with the included variance value that finalizes the degree of blurring.
d) Flip Image: The image’s flipping process can be performed horizontally and vertically, where horizontal flipping is performed with a 90-degree rotation. However, the vertical flip is a bit tedious and thus requires 180-degree rotation followed by the horizontal flip integration [27].
e) Add Noise: The method that changes the original image’s pixel value through noise integration is called noise addition [28]. In this process, artificial noise is added to the input images to show the imperfections that occurred in the real-time scenario.
f) Contrast Adjustments: To show the differences in the lighting conditions of the observed data, image contrast is modified in the data augmentation process.
g) Rotate: The images are rotated to achieve different orientations at certain angles, which enhances the augmentation safety level and establishes the degree of rotation [29].
h) In this research, each data augmentation method generates seven other outputs with a single input image. The outcome obtained after the data augmentation process in the fundus images is denoted as
4 Pattern Extraction in Input Images
The patterns of the input images are extracted with Statistical features and ResNet 101 with the respective input fundus and OCTA images. The extraction of the features is as follows.
4.1 Pattern Extraction of Fundus Image
The fundus image from the dataset undergoes pattern extraction using the statistical feature extraction method. Statistical features utilized for pattern extraction include Mean, Standard Deviation, and Median. Instead of extracting feature vectors, patterns are collected. The input fundus image is treated as the image of the pattern to obtain these patterns, as illustrated in Fig. 2.

Figure 2: 3 × 3 grid structure of the augmented fundus image
Through the obtained grid image formation, the 3 × 3 neighborhood pixels [30] are evaluated to identify the mean, median, and standard deviation. The estimation of the average of the pixel values in 3 × 3 neighborhood pixels is named the image mean. The pattern obtained through the image mean is denoted as,
where,
where,
4.2 Pattern Extraction of OCTA Image
Pattern extraction of OCTA images is conducted using ResNet 101. Generally, ResNet 101 comprises 101 convolutional layers and other layers [32]. The stacks of ResNet 101 consist of a convolutional layer followed by ReLU (Rectified Linear Unit) as the activation function and conclude with batch normalization. Utilizing deep layers assists in extracting the most significant features from OCTA images, ranging from extremely complex to basic. The architecture of ResNet 101, as illustrated in Fig. 3, consists of four basic blocks, each containing 33 residual blocks in series. Furthermore, the model achieves improved feature extraction, maximizing the spatial resolution of the image. The output of ResNet 101 is represented as,
where,

Figure 3: ResNet 101 architecture
The outcomes of the pattern extraction section concerning the fundus and the OCTA images are represented as
4.3 Detection of DR with Distributed Explainable CNN-Enabled LightGBM
The model used for DR detection is the DE-ExLNN, which aims to provide the most accurate results. The Explainable CNN serves as the base model, followed by LightGBM, to ensure DR detection. To explore the model further, the explainable CNN is initially employed, combining the concept of Explainable AI with CNN due to the drawbacks of standard CNN classifiers. Standard CNN classifiers are prone to overfitting and misclassification issues [34]. However, the model couldn’t achieve its potential with the limited dataset available. Hence, an Explainable AI mechanism is integrated with CNN to address these limitations and offer significant outcomes in DR detection. Initially, either a fundus or OCTA feature-extracted image pattern is inputted into the explainable CNN, generating Gradient-weighted Class Activation Mapping (Grad CAM++) and fully grad images. Grad CAM++ and the fully Grad process produce Grad CAM and fully grad images, along with guided propagation [35]. Considering Grad CAM++, the saliency map is estimated as follows:
where, L represents the saliency map generated for grad CAM++, W represents the weights, and J indicates the input image, which may be either
where,
which is elaborated as follows,
The fused outcome of Grad CAM++ and fully grad is fed into CNN to extract the most absolute features. The CNN architecture comprises four stacks of convolution that contain the convolutional layer incorporated with ReLU as the activation function and batch normalization followed by the Pooling function by max pooling. In addition, the proposed model works with a distributed learning mechanism that minimizes the training time and builds intricate models. The distributed model is concatenated and obtains the dimension of
where,

Figure 4: The architecture of the DE-EXLNN model
Pseudocode for the proposed Distributed Explainable CNN-enabled Light GBM using Fundus image is depicted in Algorithm 1 of Table 2.

The Pseudo code for the proposed Distributed Explainable CNN-enabled LightGBM for OCTAimage is depicted in Algorithm 2 of Table 3.

The results of the DE-ExLNN model are explained in this section.
The experiment uses Python software in the system with Windows 11 configuration and 32 GB RAM. The hyperparameters of Light GBM are the number of leaves 31, the metric as multi-log loss, the learning rate is 0.05, the feature fraction is 0.9, and the number of boosting rounds is 1000. Also, the hyperparameters of the DE-ExLNN model used in the research are included in Table 4.

The overall utilized datasets in the research are DiaretDb1, Messidor, STARE, OCTA-500, and custom datasets.
A: DiaretDb1 Dataset: The diaretDb1 dataset contains 89 fundus images, where 84 are mild DR and 4 represent the normal image. The dataset’s images were collected using the 50-degree fields-of-view digital fundus camera with various settings [38].
B: Messidor Dataset: In total, 1200 fundus images exist collected with 45-degree fields of view from three departments of ophthalmologists. Among the images, 800 have pupil dilation, and 400 are without pupil dilation. The total images are divided based on the three sectors of ophthalmologists, where each set has 100 images zipped in the TIFF format carrying 100 images [39].
C: STARE Dataset: The STARE dataset is a dataset for retinal vessel segmentation. It contains 20 equal-sized (700 × 605) color fundus images. For each image, two groups of annotations are provided [40].
D: OCTA 500 Dataset: The dataset contains 500 OCTA images captured in two fields of view, which consist of six types of projections, seven types of segmentation, four types of text labels, and so on [41].
E: Custom Dataset: The custom dataset is collected from real-time hospital environments [42]. This dataset consists of 268 OCTA images with dimensions 1596 × 990 and 320 Fundus images with dimensions 3680 × 3288 collected at Natasha Eye Care and Research Institute in Pune [43], Maharashtra, India. The Symbiosis Institutional Ethics Committee for Biomedical and Health Research authorized the project under approval code SIU/IEC/583. Images were captured using a nonmydriatic Optical Coherence Tomography Angiography (OCTA) device, specifically the Optovue Avanti Edition machine as per the protocol, and Fundus images using an Eidon machine. OCTA scan requires approximately 5 min if the patient is co-operative. A Fundus scan requires 1–2 min if the patient is cooperative. Two ophthalmologists then annotated the images. ETDRS scale is used to classify images. A signed consent form was given by every patient. Researchers and doctors can use this dataset to develop automated diagnostic tools for early detection of diabetic retinopathy (DR).
The image outcomes of the research, comparing the fundus input and the OCTA input for both the existing standard datasets and the custom dataset, are respectively depicted and compared in Fig. 5.


Figure 5: Image outcomes of existing datasets and custom datasets
5.3.1 Comparative Evaluation with DiaretDb1 Dataset
The evaluation of the DE-ExLNN model yielded significant results compared to conventional methods. Regarding accuracy, the model achieved 89.52% with the DiaretDb1 dataset, showing improvements of 5.53%, 2.12%, 1.64%, 1.53%, 1.34%, 1.26%, 1.18%, 0.52%, 0.47%, and 0.34% over DCGAN, Faster RCNN, Inception-V4/DSLO, PSO-CNN, IoT-Opthom-CAD, CNN-LSTM, CBAM-Dense Net, IC2T, ViT, and PCA-DNN, respectively. In terms of sensitivity, the model reached 89.52%, marking an average improvement of 4.04% over DCGAN, 3.09% over Faster RCNN, 3.07% over Inception-V4/DSLO, 3.02% over PSO-CNN, 2.59% over IoT-Opthom-CAD, 2.29% over CNN-LSTM, 2.16% over CBAM-DenseNet, 0.90% over IC2T, 0.82% over ViT, 0.58% over PCA-DNN, respectively. Moreover, the specificity of the DE-ExLNN model for DR detection reached 89.52%, indicating the highest improvement of 7.01% over DCGAN, 1.15% over Faster RCNN, 0.97% over Inception-V4/DSLO, 0.96% over PSO-CNN, 0.89% over IoT-Opthom-CAD, 0.24% over CNN-LSTM, 0.20% over CBAM-DenseNet, 0.14% over IC2T, 0.12% over ViT, 0.10% over a minimal improvement of PCA-DNN. Furthermore, the model achieved a Matthews Correlation Coefficient of 88.46%, showcasing the highest improvement of 9.69% over DCGAN, 3.96% over Faster RCNN, 3.87% over Inception-V4/DSLO, 3.70% over PSO-CNN, 3.44% over IoT-Opthom-CAD, 3.43% over CNN-LSTM, 3.21% over CBAM-DenseNet, 3.10% over IC2T, 2.08% over ViT, 2.02% over PCA-DNN, respectively. The comparative outcomes for the DiaretDb1 dataset are illustrated in Fig. 6.
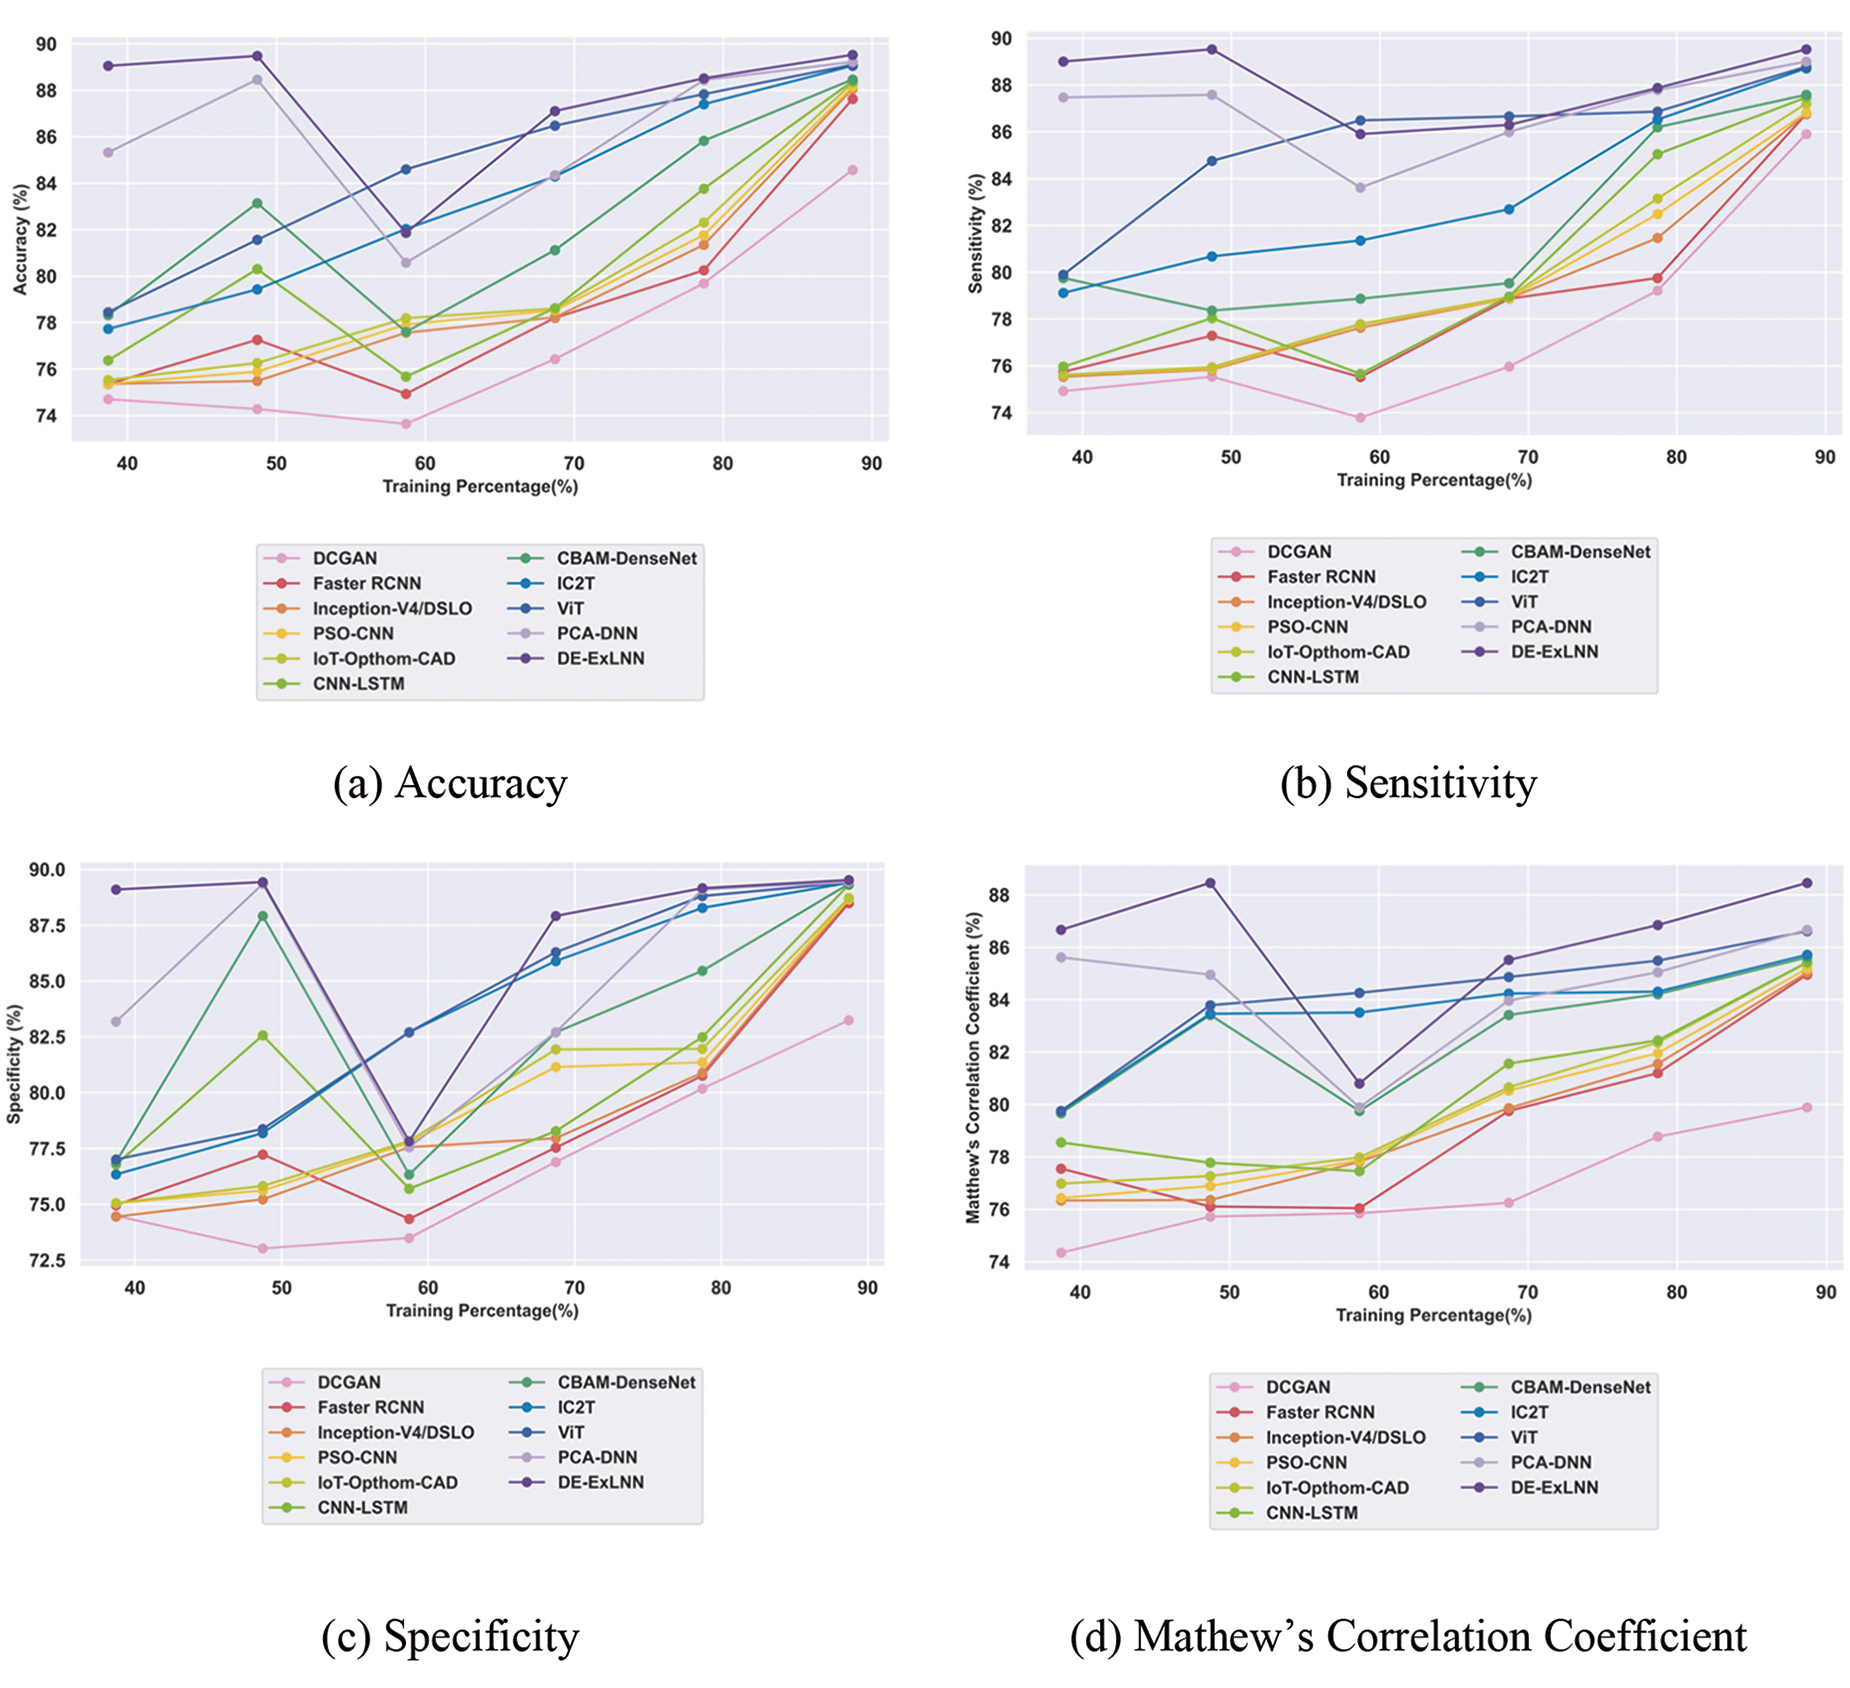
Figure 6: Comparative evaluation of the DiaretDb1 dataset
5.3.2 Comparative Evaluation with Messidor Dataset
Evaluating the DE-ExLNN model against conventional methods using the Messidor dataset revealed certain improvements. In terms of accuracy, the DE-ExLNN achieved 92.66%, which is 2.61% higher than DCGAN, 1.45% higher than Faster RCNN, 1.34% higher than Inception-V4/DSLO, 1.14% higher than PSO-CNN, 0.99% higher than IoT-Opthom-CAD, 0.86% higher than CNN-LSTM, 0.58% higher than CBAM-DenseNet, 0.51% higher than IC2T, 0.42% higher than ViT, 0.40% higher than PCA-DNN. Regarding sensitivity, the model obtained 92.48%, representing an average improvement of 1.65% by DCGAN, 0.91% by Faster RCNN, 0.68% by Inception-V4/DSLO, 0.56% by PSO-CNN, 0.52% by IoT-Opthom-CAD, 0.42% by CNN-LSTM, 0.28% by CBAM-DenseNet, 0.28% by IC2T, 0.26% by ViT, 0.25% by PCA-DNN, respectively. Moreover, the specificity of the DE-ExLNN model for DR detection reached 92.83%, indicating the highest improvement of 3.56% over DCGAN, 1.19% over Faster RCNN, 1.88% over Inception-V4/DSLO, 1.67% over PSO-CNN, 1.40% over IoT-Opthom-CAD, 1.30% over CNN-LSTM, 0.87% over CBAM-DenseNet, 0.73% over IC2T, 0.58% over ViT, and the smallest improvement of 0.54% over PCA-DNN. Furthermore, considering the Matthews Correlation Coefficient, the model attained 92.17%, showcasing the highest improvement of 6.07% over DCGAN, 4.77% over Faster RCNN, 4.48% over Inception-V4/DSLO, 2.82% over PSO-CNN, 2.47% over IoT-Opthom-CAD, 2.39% over CNN-LSTM, 0.80% over CBAM-DenseNet, 0.70% over IC2T, 0.44% over ViT, and the lowest improvement of 0.25% over PCA-DNN. The comparative outcomes for the Messidor dataset are illustrated in Fig. 7.

Figure 7: Comparative evaluation of Messidor dataset
5.3.3 Comparative Evaluation with STARE Dataset
The evaluation of the DE-ExLNN model against conventional methods using the STARE dataset revealed certain improvements. In terms of accuracy, the DE-ExLNN achieved 90.74%, which is 3.72% higher than DCGAN, 2.06% higher than Faster RCNN, 1.93% higher than Inception-V4/DSLO, 1.66% higher than PSO-CNN, 1.50% higher than IoT-Opthom-CAD, 1.50% higher than CNN-LSTM, 1.02% higher than CBAM-DenseNet, 0.69% higher than IC2T, 0.62% higher than ViT, and 0.56% higher than PCA-DNN. Regarding sensitivity, the model obtained 90.90%, representing an average improvement of 4.06% by DCGAN, 1.00% by Faster RCNN, 0.96% by Inception-V4/DSLO, 0.95% by PSO-CNN, 0.84% by IoT-Opthom-CAD, 0.78% by CNN-LSTM, 0.33% by CBAM-DenseNet, 0.25% by IC2T, 0.22% by ViT, 0.11% by PCA-DNN, respectively. Moreover, the specificity of the DE-ExLNN model for DR detection reached 90.58%, indicating the highest improvement of 3.37% over DCGAN, 3.12% over Faster RCNN, 3.04% over Inception-V4/DSLO, 2.85% over PSO-CNN, 2.31% over IoT-Opthom-CAD, 2.22% over CNN-LSTM, 1.71% over CBAM-DenseNet, 1.12% over IC2T, 1.03% over ViT, and the smallest improvement of 1.02% over PCA-DNN. Furthermore, considering the Matthews Correlation Coefficient, the model attained 88.74%, showcasing the highest improvement of 6.46% over DCGAN, 3.42% over Faster RCNN, 3.20% over Inception-V4/DSLO, 2.74% over PSO-CNN, 2.21% over IoT-Opthom-CAD, 1.95% over CNN-LSTM, 0.50% over CBAM-DenseNet, 0.41% over IC2T, 0.39% over ViT, 0.18% over PCA-DNN. The comparative outcomes for the STARE dataset are illustrated in Fig. 8.

Figure 8: Comparative evaluation of STARE dataset
5.3.4 Comparative Evaluation with OCTA 500 Dataset
The comparative evaluation of the DE-ExLNN model against conventional methods using the OCTA 500 dataset revealed certain improvements. In terms of accuracy, the DE-ExLNN achieved 93.59%, which is 3.23% higher than DCGAN, 1.11% higher than Faster RCNN, 1.05% higher than Inception-V4/DSLO, 1.03% higher than PSO-CNN, 0.96% higher than IoT-Opthom-CAD, 0.91% higher than CNN-LSTM, 0.64% higher than CBAM-DenseNet, 0.59% higher than IC2T, 0.58% higher than ViT, 0.49% higher than PCA-DNN. Regarding sensitivity, the model obtained 93.63%, representing an average improvement of 4.47% over DCGAN, 0.72% over Faster RCNN, 0.71% over Inception-V4/DSLO, 0.61% over PSO-CNN, 0.60% over IoT-Opthom-CAD, 0.58% over CNN-LSTM, 0.28% over CBAM-DenseNet, 0.24% over IC2T, 0.23% over ViT, and 0.06% over PCA-DNN. Moreover, the specificity of the DE-ExLNN model for DR detection reached 93.55%, indicating the highest improvement of 1.98% over DCGAN, 1.49% over Faster RCNN, 1.48% over Inception-V4/DSLO, 1.44% over PSO-CNN, 1.36% over IoT-Opthom-CAD, 1.25% over CNN-LSTM, 1.01% over CBAM-DenseNet, 0.94% over IC2T, 0.92% over ViT, and 0.92% over PCA-DNN. Furthermore, considering the Matthews Correlation Coefficient, the model attained 93.35%, showcasing the highest improvement of 3.09% over DCGAN, 0.93% over Faster RCNN, 0.74% over Inception-V4/DSLO, 0.64% over PSO-CNN, 0.63% over IoT-Opthom-CAD, 0.53% over CNN-LSTM, 0.44% over CBAM-DenseNet, 0.18% over IC2T, 0.16% over ViT, and 0.12% over PCA-DNN. More specifically, the proposed approach exploited the DE-ExLNN model, incorporating the explainable CNN and a distributed learning mechanism into LightGBM, allowing the model to dynamically focus on significant input image regions, eliminating the temporal complexity problems and resulting in better performance. The comparative outcomes for the OCTA 500 dataset are illustrated in Fig. 9.

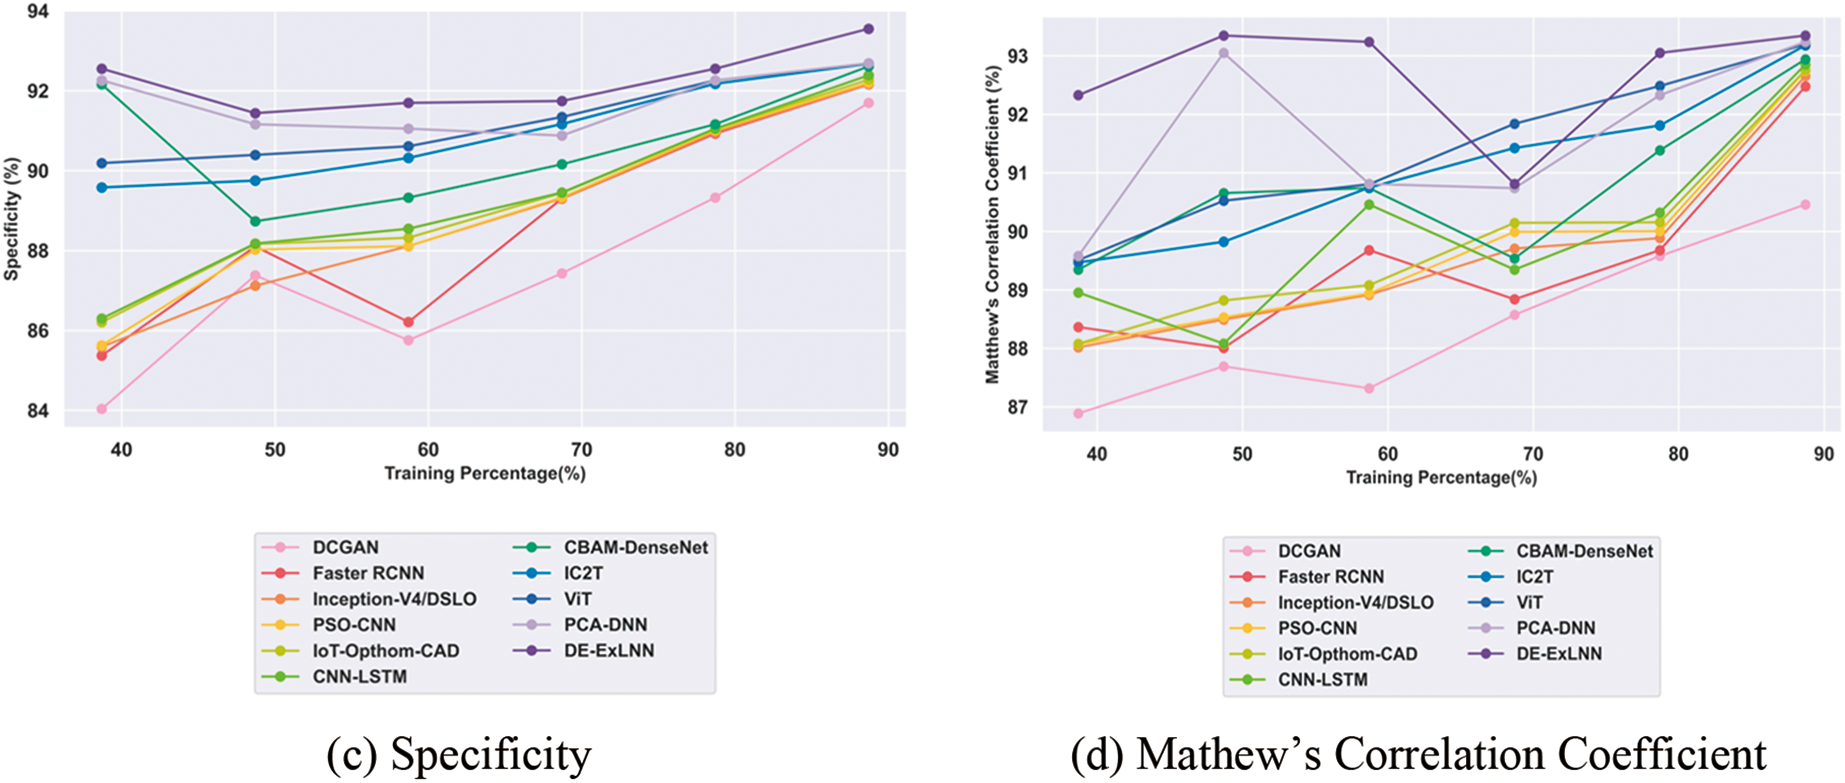
Figure 9: Comparative evaluation of OCTA 500 dataset
5.3.5 Comparative Evaluation with Custom Dataset
The custom dataset comprises both fundus and OCTA images collected from real-time environments. The evaluation of the DE-ExLNN model against conventional methods showed certain improvements. In terms of accuracy for fundus images, the DE-ExLNN achieved 93.94%, which is 2.09% higher than DCGAN, 1.73% higher than Faster RCNN, 1.45% higher than Inception-V4/DSLO, 1.43% higher than PSO-CNN, 1.35% higher than IoT-Opthom-CAD, 1.28% higher than CNN-LSTM, 0.91% higher than CBAM-DenseNet, 0.66% higher than IC2T, 0.45% higher than ViT, and 0.34% higher than PCA-DNN. Regarding sensitivity, the model obtained 93.90%, representing an average improvement of 3.18% over DCGAN, 2.48% over Faster RCNN, 1.98% over Inception-V4/DSLO, 1.94% over PSO-CNN, 1.82% over IoT-Opthom-CAD, 1.62% over CNN-LSTM, 0.93% over CBAM-DenseNet, 0.56% over IC2T, 0.27% over ViT, and 0.05% over PCA-DNN. Moreover, the specificity of the DE-ExLNN model for DR detection reached 93.99%, indicating the highest improvement of 1.00% over DCGAN, 0.98% over Faster RCNN, 0.97% over Inception-V4/DSLO, 0.96% over PSO-CNN, 0.95% over IoT-Opthom-CAD, 0.94% over CNN-LSTM, 0.89% over CBAM-DenseNet, 0.76% over IC2T, 0.64% over ViT, and 0.63% over PCA-DNN. Furthermore, considering the Matthews Correlation Coefficient, the model attained 93.88%, showcasing the highest improvement of 3.60% against DCGAN, 2.78% against Faster RCNN, 2.59% against Inception-V4/DSLO, 2.31% against PSO-CNN, 1.95% against IoT-Opthom-CAD, 1.90% against CNN-LSTM, 1.71% against CBAM-DenseNet, 1.65% against IC2T, 1.61% against ViT, and 1.47% against PCA-DNN. The comparative outcomes of the custom fundus dataset are illustrated in Fig. 10.

Figure 10: Comparative evaluation of custom-fundus dataset
In terms of accuracy for OCTA images in the custom dataset, the DE-ExLNN achieved 95.30%, which is 2.19% higher than DCGAN, 1.08% higher than Faster RCNN, 1.07% higher than Inception-V4/DSLO, 1.06% higher than PSO-CNN, 1.04% higher than IoT-Opthom-CAD, 1.04% higher than CNN-LSTM, 0.92% higher than CBAM-DenseNet, 0.64% higher than IC2T, 0.36% higher than ViT, and 0.21% higher than PCA-DNN. Regarding sensitivity, the model obtained 95.50%, indicating an average improvement of 3.34% over DCGAN, 1.20% over Faster RCNN, 1.20% over Inception-V4/DSLO, 1.18% over PSO-CNN, 1.17% over IoT-Opthom-CAD, 1.16% over CNN-LSTM, 0.96% over CBAM-DenseNet, 0.76% over IC2T, 0.44% over ViT, and 0.33% over PCA-DNN. Moreover, the specificity of the DE-ExLNN model for DR detection in the custom dataset reached 95.09%, showing the highest improvement of 1.04% over DCGAN, 0.95% over Faster RCNN, 0.94% over Inception-V4/DSLO, 0.91% over PSO-CNN, 0.91% over IoT-Opthom-CAD, 0.91% over CNN-LSTM, 0.88% over CBAM-DenseNet, 0.52% over IC2T, 0.27% over ViT, and 0.09% over PCA-DNN. Furthermore, for the Matthews Correlation Coefficient concerning OCTA images in the custom dataset, the developed model attained 95.00%, which is 4.38% higher than DCGAN, 1.75% higher than Faster RCNN, 1.73% higher than Inception-V4/DSLO, 1.52% higher than PSO-CNN, 1.51% higher than IoT-Opthom-CAD, 1.28% higher than CNN-LSTM, 0.74% higher than CBAM-DenseNet, 0.73% higher than IC2T, 0.73% higher than ViT, and 0.73% higher than PCA-DNN. The comparative outcomes of the OCTA 500 dataset are illustrated in Fig. 11.

Figure 11: Comparative evaluation of custom-OCTA dataset
Although the DE-ExLNN achieved high results across all utilized datasets, the custom dataset collected from real environments exhibited the most efficient outcomes, as shown in Table 5. Furthermore, the results from all datasets were compared with existing methods such as DCGAN, Faster RCNN, CNN-LSTM, CBAM-DenseNet, and PCA-DNN. In terms of comparative methods, the proposed DE-ExLNN yielded the most efficient outcomes across all existing as well as custom datasets. Existing methods faced certain challenges such as DCGAN was prone to overfitting, especially with complex data trees, and remained unstable due to data changes and noise. Faster RCNN could be computationally expensive and might not perform well on imbalanced datasets, reducing interpretability compared to individual DCGANs. CNN-LSTM assumed independence between features and was sensitive to irrelevant features, leading to poor performance. PCA-DNN requires large amounts of labeled data, making the model computationally expensive and difficult to interpret due to its deep architecture. These drawbacks are addressed by the proposed DE-ExLNN. Moreover, the custom dataset, comprising both fundus and OCTA images, had more samples after data augmentation, thereby enhancing the efficacy of the research.

The statistical analysis is carried out in terms of Best, Mean, and Variance to evaluate the results’ robustness using the metrics of accuracy, sensitivity, and specificity. Here, the results of the proposed DE-ExLNN are compared with the existing methods DCGAN, Faster RCNN, Inception-V4/DSLO, PSO-CNN, IoT-Opthom-CAD, CNN-LSTM, CBAM-DenseNet, IC2T, ViT, and PCA-DNN. Tables 6 and 7 include the statistical analysis of the proposed model compared with the existing methods.


The computational time comparison between the proposed DE-ExLNN model and the other existing methodologies is conducted across multiple iterations to showcase the efficacy of the DE-ExLNN model. The results highlight the recommended strategy’s computational efficacy because it consistently requires a significant reduction in time compared to other approaches. At iteration 100, the DE-ExLNN model has the lowest computation time of 20.60 s when compared to the existing approaches. Table 8 presents information about the computational complexity analysis of the methods and is depicted graphically in Fig. 12.
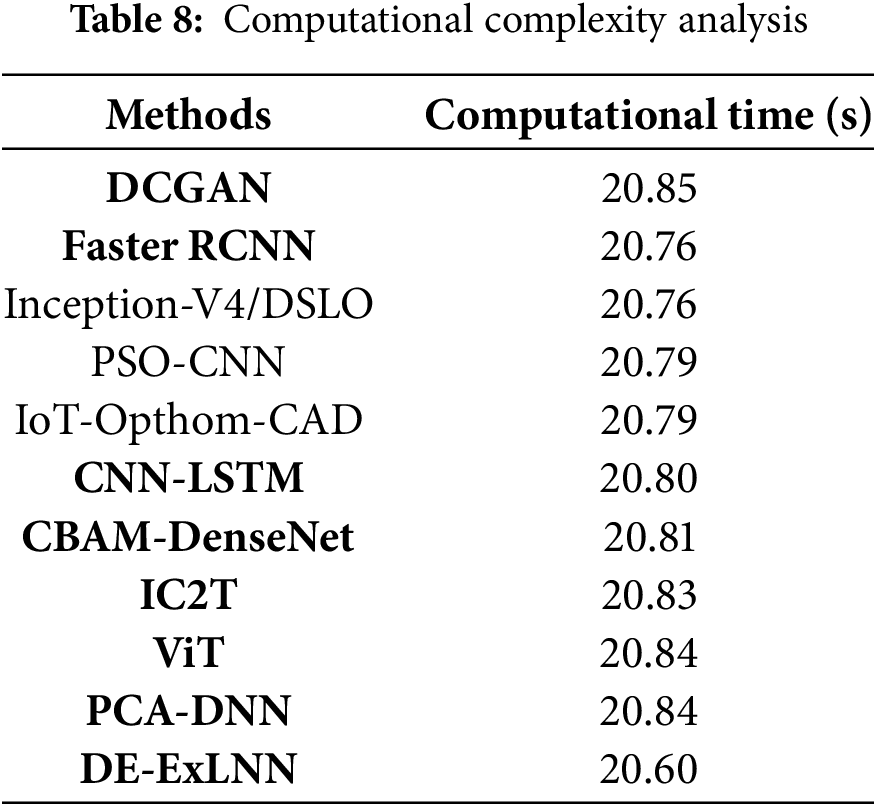
Figure 12: Computational complexity analysis
In the ablation study, the performance of diabetic retinopathy detection by eliminating the components is evaluated to investigate the robustness and performance of the proposed DE-ExLNN model. The performance of the model with and without noise using the custom dataset is evaluated to explicate the robustness of the DE-ExLNN model. Fig. 13 depicts the robustness of the proposed DE-ExLNN model with Fundus and OCTA images in terms of accuracy by eliminating and including noise. For Fundus images without noise, the DE-ExLNN model achieves a high accuracy of 93.94%. Meanwhile, the proposed model obtained an accuracy of 90.76% which is reduced from the maximum accuracy obtained with noise. Similarly, for OCTA images without noise, the DE-ExLNN model achieves a high accuracy of 95.35%. Meanwhile, the proposed model obtained an accuracy of 93.97% which is reduced from the maximum accuracy obtained with noise. Moreover, the ablation study highlights the robustness of the proposed DE-ExLNN model with and without noise.

Figure 13: Ablation study
In conclusion, this research demonstrates the high proficiency of the DE-ExLNN model in detecting Diabetic Retinopathy (DR). Through the integration of the explainable CNN and Light GBM, the limitations of standard CNN classifiers, particularly in terms of time complexity and convergence issues, are effectively addressed. The inclusion of distributed learning further enhances the model’s efficiency by reducing time consumption and complexity while facilitating feature extraction. The model overcomes temporal complexity problems and initiates parallel computing with the support of a distributed learning mechanism. The explainable CNN handles convergence problems, resulting in effective detection. Utilizing fundus and OCTA images separately, accurate outcomes are achieved across various datasets. Comparison with existing standard datasets reveals improved performance, particularly in detecting DR, No DR, and Mild DR categories. Evaluations against other standard datasets achieved 93.94% accuracy, 93.90% sensitivity, 93.99% specificity, and a Mathews Correlation Coefficient of 93.88% for fundus images. For OCTA images, the results were 95.26% accuracy, 95.5% sensitivity, 95.09% specificity, and a Mathews Coefficient Correlation of 95, underscoring the effectiveness of the approach.
In the future, augmenting the custom dataset with more images and incorporating hybrid learning and bio-inspired algorithms will be proposed to enhance DR detection efficacy further. Also, the proposed model can be evaluated with other datasets, including the diversity in terms of patient demographics, image quality, and clinical conditions. Moreover, the clinical adoption of the proposed model utilizing the explainability aspect, though integrated via Grad-CAM++ can be analyzed to enhance the efficiency of the proposed model. By training specific models for distinct stages and ensembling the outcomes, increased accuracy is anticipated, especially in early-stage disease detection. Additionally, focusing on improving the detection of mild disease and transitioning to more challenging multi-grade disease detection will be pivotal for advancing future research in this field.
Acknowledgement: I extend my heartfelt thanks to the medical professionals, interns, and optometrists at Natasha Eye Care and Research Centre for their unwavering support. Their expertise and dedication were instrumental in the successful completion of this study.
Funding Statement: This research was funded by the Centre for Advanced Modelling and Geospatial Information Systems (CAMGIS), Faculty of Engineering and IT, University of Technology Sydney. Moreover, it is supported by the Research Funding Program, King Saud University, Riyadh, Saudi Arabia, under Project Ongoing Research Funding program (ORF-2025-14).
Author Contributions: The authors confirm their contribution to the paper as follows: Conceptualization, Pooja Bidwai, Shilpa Gite, and Biswajeet Pradhan; methodology, Pooja Bidwai; software, Shilpa Gite; validation, Pooja Bidwai, Shilpa Gite, and Biswajeet Pradhan; formal analysis, Pooja Bidwai; investigation, Pooja Bidwai, Shilpa Gite, and Biswajeet Pradhan; resources, Biswajeet Pradhan; data curation, Pooja Bidwai; writing—original draft preparation, Pooja Bidwai; writing—review and editing, Shilpa Gite, Biswajeet Pradhan, and Abdullah Almari; visualization, Shilpa Gite and Biswajeet Pradhan; supervision, Shilpa Gite and Biswajeet Pradhan; project administration, Biswajeet Pradhan; funding acquisition, Biswajeet Pradhan and Abdullah Almari. All authors reviewed the results and approved the final version of the manuscript.
Availability of Data and Materials: The data will be accessible upon request. An informed consent form was obtained by every patient for the collection of the dataset. Fundus dataset for detection of Diabetic Retinopathy [Dataset]. Zenodo. https://doi.org/10.5281/zenodo.13734036 (accessed on 15 January 2024). Optical Coherence Tomography Angiography-OCTA Dataset for Detection of Diabetic Retinopathy [Dataset]. Zenodo. https://doi.org/10.5281/zenodo.10400092 (accessed on 15 January 2024).
Ethics Approval: The Symbiosis Institutional Ethics Committee (BHR) SIU approved the study with approval number SIU/IEC/583.
Conflicts of Interest: The authors declare no conflicts of interest to report regarding the present study.
Abbreviations
| DR | Diabetic Retinopathy |
| CBAM | Convolutional Block Attention Module |
| CNN | Convolutional Neural Network |
| ANN | Artificial Neural Network |
| LSTM | Long Short-Term Memory |
| NPDR | Non-Proliferative Diabetic Retinopathy |
| PDR | Proliferative Diabetic Retinopathy |
| CAD | Computer-Aided Diagnosis |
| AI | Artificial Intelligence |
| ML | Machine Learning |
| DL | Deep Learning |
| NLP | Natural Language Processing |
| CV | Computer Vision |
| OCT | Optical Coherence Tomography |
| OCTA | Optical Coherence Tomography Angiography |
| PCA-DNN | Principal Component Analysis-Deep Neural Network |
| RCNN | Region-based Convolutional Neural Network |
| SVM | Support Vector Machines |
| VEGF | Vascular Endothelial Growth Factor |
| DCGAN | Deep Convolutional Generative Adversarial Network |
| ROI | Region of Interest |
| DE-ExLNN | Distributed Explainable Convolutional Neural Network Enabled Light Gradient Boosting Machine |
References
1. Acharya UR, Mookiah MRK, Koh JE, Tan JH, Bhandary SV, Rao AK, et al. Automated screening system for retinal health using bi-dimensional empirical mode decomposition and integrated index. Comput Bio Med. 2016;75(5):54–62. doi:10.1016/j.compbiomed.2016.04.015. [Google Scholar] [PubMed] [CrossRef]
2. Mustafa H, Ali SF, Bilal M, Hanif MS. Multi-stream deep neural network for diabetic retinopathy severity classification under a boosting framework. IEEE Access. 2022;10:113172–83. doi:10.1109/access.2022.3217216. [Google Scholar] [CrossRef]
3. Nazih W, Aseeri AO, Atallah OY, El-Sappagh S. Vision transformer model for predicting the severity of diabetic retinopathy in fundus photography-based retina images. IEEE Access. 2023;11:117546–61. doi:10.1109/access.2023.3326528. [Google Scholar] [CrossRef]
4. Nur-A-Alam M, Nasir MMK, Ahsan M, Based MA, Haider J, Palani S. A faster RCNN-based diabetic retinopathy detection method using fused features from retina images. IEEE Access. 2023;11:124331–49. doi:10.1109/access.2023.3330104. [Google Scholar] [CrossRef]
5. Vijayan M, Venkatakrishnan S. A regression-based approach to diabetic retinopathy diagnosis using efficientnet. Diagnostics. 2023;13(4):774. doi:10.3390/diagnostics13040774. [Google Scholar] [PubMed] [CrossRef]
6. Tan T-E, Wong TY. Diabetic retinopathy: looking forward to 2030. Front Endocr. 2023;13:1077669. doi:10.3389/fendo.2022.1077669. [Google Scholar] [PubMed] [CrossRef]
7. Grzybowski A, Singhanetr P, Nanegrungsunk O, Ruamviboonsuk P. Artificial intelligence for diabetic retinopathy screening using color retinal photographs: from development to deployment. Ophthalmol Ther. 2023;12(3):1419–37. doi:10.1007/s40123-023-00691-3. [Google Scholar] [PubMed] [CrossRef]
8. Palaniswamy T, Vellingiri M. Internet of Things and deep learning enabled diabetic retinopathy diagnosis using retinal fundus images. IEEE Access. 2023;11:27590–601. doi:10.1109/access.2023.3257988. [Google Scholar] [CrossRef]
9. Goodfellow I. Nips 2016 tutorial: generative adversarial networks. arXiv:1701.00160. 2016. [Google Scholar]
10. Khanna M, Singh LK, Thawkar S, Goyal M. Deep learning based computer-aided automatic prediction and grading system for diabetic retinopathy. Multimed Tools Appl. 2023;82(25):39255–302. doi:10.1007/s11042-023-14970-5. [Google Scholar] [CrossRef]
11. Chai J, Zeng H, Li A, Ngai EWT. Deep learning in computer vision: a critical review of emerging techniques and application scenarios. Mach Learn Appl. 2021;6:100134. doi:10.1016/j.mlwa.2021.100134. [Google Scholar] [CrossRef]
12. Zago GT, Andreão RV, Dorizzi B, Salles EO. Diabetic retinopathy detection using red lesion localization and convolutional neural networks. Comput Biol Med. 2020;116:103537. doi:10.1016/j.compbiomed.2019.103537. [Google Scholar] [PubMed] [CrossRef]
13. Wu J, Zhang Q, Liu M, Xiao Z, Zhang F, Geng L, et al. Diabetic macular edema grading based on improved Faster R-CNN and MD-ResNet. Signal, Image Video Process. 2021;15:743–51. doi:10.1007/s11760-020-01792-3. [Google Scholar] [CrossRef]
14. Sivapriya G, Praveen V, Gowri P, Saranya S, Sweetha S, Shekar K. Segmentation of Hard exudates for the detection of Diabetic Retinopathy with RNN based sematic features using fundus images. Mater Today: Proc. 2022;64(P1):693–701. doi:10.1016/j.matpr.2022.05.189. [Google Scholar] [CrossRef]
15. Nadeem MW, Goh HG, Hussain M, Liew SY, Andonovic I, Khan MA. Deep learning for diabetic retinopathy analysis: a review, research challenges, and future directions. Sensors. 2022;22(18):6780. doi:10.3390/s22186780. [Google Scholar] [PubMed] [CrossRef]
16. Saini M, Susan S. Diabetic retinopathy screening using deep learning for multi-class imbalanced datasets. Comput Biol Med. 2022;149:149,105989. doi:10.1016/j.compbiomed.2022.105989. [Google Scholar] [PubMed] [CrossRef]
17. Naz H, Nijhawan R, Ahuja NJ, Al-Otaibi S, Saba T, Bahaj SA, et al. Ensembled deep convolutional generative adversarial network for grading imbalanced diabetic retinopathy recognition. IEEE Access. 2023;11:120554–68. doi:10.1109/access.2023.3327900. [Google Scholar] [CrossRef]
18. Jagadesh BN, Karthik MG, Siri D, Shareef SK, Mantena SV, Vatambeti R. Segmentation using the IC2T model and classification of diabetic retinopathy using the rock hyrax swarm-based coordination attention mechanism. IEEE Access. 2023;11:124441–58. doi:10.1109/access.2023.3330436. [Google Scholar] [CrossRef]
19. Farg MM, Fouad M, Abdel-Hamid AT. Automatic severity classification of diabetic retinopathy based on denseNet and convolutional block attention module. IEEE Access. 2022;10:38299–38308. doi:10.1109/access.2022.3165193. [Google Scholar] [CrossRef]
20. Ali G, Dastgir A, Iqbal MW, Anwar M, Faheem M. A hybrid convolutional neural network model for automatic diabetic retinopathy classification from fundus images. IEEE J Transl Eng Health Med. 2023;11:341–50. doi:10.1109/jtehm.2023.3282104. [Google Scholar] [CrossRef]
21. Yang J, Qin H, Por LY, Shaikh ZA, Alfarraj O, Tolba A, et al. Optimizing diabetic retinopathy detection with inception-V4 and dynamic version of snow leopard optimization algorithm. Biomed Signal Process Control. 2024;96:106501. doi:10.1016/j.bspc.2024.106501. [Google Scholar] [CrossRef]
22. Melin P, Sánchez D, Cordero-Martínez R. Particle swarm optimization of convolutional neural networks for diabetic retinopathy classification. In: Fuzzy logic and neural networks for hybrid intelligent system design. Cham, Switzerland: Springer; 2023. p. 237–52. doi:10.1007/978-3-031-22042-5_14. [Google Scholar] [CrossRef]
23. AlBalawi T, Aldajani MB, Abbas Q, Daadaa Y. IoT-Opthom-CAD: IoT-enabled classification system of multiclass retinal eye diseases using dynamic swin transformers and explainable artificial intelligence. Int J Adv Comput Sci Appl. 2024;15(7). doi:10.14569/IJACSA.2024.0150716. [Google Scholar] [CrossRef]
24. Kumar BS. Image denoising based on gaussian/bilateral filter and its method noise thresholding. Signal Image Video Process. 2013;7(6):1159–72. doi:10.1007/s11760-012-0372-7. [Google Scholar] [CrossRef]
25. Shorten C, Khoshgoftaar TM. A survey on image data augmentation for deep learning. J Big Data. 2019;6(1):1–48. doi:10.1186/s40537-019-0197-0. [Google Scholar] [CrossRef]
26. Gedraite ES, Hadad M. Investigation on the effect of a Gaussian Blur in image filtering and segmentation. In: Proceedings ELMAR-2011; 2011 Sep 14–16; Zadar, Croatia. p. 393–6. [Google Scholar]
27. Rosebrock A. OpenCV Flip Image (cv2.flip). PyImageSearch. 2021 [cited 2025 Apr 10]. Available from: https://pyimagesearch.com/2021/01/20/opencv-flip-image-cv2-flip/. [Google Scholar]
28. Liu Z, Cao Y, Li Y, Xiao X, Qiu Q, Yang M, et al. Automatic diagnosis of fungal keratitis using data augmentation and image fusion with deep convolutional neural network. Comput Methods Programs Biomed. 2020;187:105019. doi:10.1016/j.cmpb.2019.105019. [Google Scholar] [PubMed] [CrossRef]
29. Khosla C, Saini BS. Enhancing performance of deep learning models with different data augmentation techniques: a survey. In: 2020 International Conference on Intelligent Engineering and Management (ICIEM); 2020 Jun 17–19; London, UK. p. 79–85. [Google Scholar]
30. Das D, Biswas SK, Bandyopadhyay S. Detection of diabetic retinopathy using convolutional neural networks for feature extraction and classification (DRFEC). Multimed Tools Appl. 2023;82(19):29943–30001. doi:10.1007/s11042-022-14165-4. [Google Scholar] [PubMed] [CrossRef]
31. Petronas U. Mean and standard deviation features of color histogram using laplacian filter for content-based image retrieval. J Theor Appl Inform Technol. 2011;34(1):1–7. [Google Scholar]
32. Li Y, El Habib Daho M, Conze PH, Zeghlache R, Le Boité H, Bonnin S, et al. Hybrid fusion of high-resolution and ultra-widefield OCTA acquisitions for the automatic diagnosis of diabetic retinopathy. Diagnostics. 2023;13(17):2770. doi:10.3390/diagnostics13172770. [Google Scholar] [PubMed] [CrossRef]
33. Shamrat FJ, Shakil R, Akter B, Ahmed MZ, Ahmed K, Bui FM, et al. An advanced deep neural network for fundus image analysis and enhancing diabetic retinopathy detection. Healthc Anal. 2024;5:100303. doi:10.1016/j.health.2024.100303. [Google Scholar] [CrossRef]
34. Selvaraju RR, Cogswell M, Das A, Vedantam R, Parikh D, Batra D. Grad-CAM: visual explanations from deep networks via gradient-based localization. In: Proceedings of the IEEE International Conference on Computer Vision (ICCV). Venice, Italy: IEEE; 2017. p. 618–26. doi:10.1109/ICCV.2017.74. [Google Scholar] [CrossRef]
35. Chattopadhay A, Sarkar A, Howlader P, Balasubramanian VN. Grad-cam++: Generalized gradient-based visual explanations for deep convolutional networks. In: Proceedings of the IEEE Winter Conference on Applications of Computer Vision (WACV). Lake Tahoe, NV, USA: IEEE; 2018. p. 839–47. doi:10.1109/WACV.2018.00097. [Google Scholar] [CrossRef]
36. Srinivas S, Fleuret F. Full-gradient representation for neural network visualization. Adv Neural Inform Process Syst. 2019;32. [Google Scholar]
37. Rufo DD, Debelee TG, Ibenthal A, Negera WG. Diagnosis of diabetes mellitus using gradient boosting machine (LightGBM). Diagnostics. 2021;11(9):1714. doi:10.3390/diagnostics11091714. [Google Scholar] [PubMed] [CrossRef]
38. DiaretDb1 dataset. [cited 2025 Apr 10]. Available from: https://paperswithcode.com/dataset/diaretdb1. [Google Scholar]
39. Messidor dataset. [cited 2025 Apr 10]. Available from: https://paperswithcode.com/dataset/messidor-1. [Google Scholar]
40. STARE dataset. [cited 2025 Apr 10]. Available from: https://paperswithcode.com/dataset/stare. [Google Scholar]
41. OCTA 500 dataset. [cited 2025 Apr 10]. Available from: https://paperswithcode.com/dataset/octagon. [Google Scholar]
42. Bidwai P, Gite S, Gupta A, Pahuja K. Optical coherence tomography angiography-OCTA dataset for detection of diabetic retinopathy [Dataset]. Zenodo. 2023. doi:10.5281/zenodo.10400092. [Google Scholar] [CrossRef]
43. Bidwai P, Gite S, Gupta A, Pahuja K. Fundus dataset for detection of diabetic retinopathy [Dataset]. Zenodo. 2024. doi:10.5281/zenodo.13734036. [Google Scholar] [CrossRef]
Cite This Article
 Copyright © 2025 The Author(s). Published by Tech Science Press.
This work is licensed under a Creative Commons Attribution 4.0 International License , which permits unrestricted use, distribution, and reproduction in any medium, provided the original work is properly cited.
 Downloads
 Citation Tools