
 Submit a Paper
 Propose a Special lssue
 Open Access
REVIEW
Utility of Graph Neural Networks in Short-to Medium-Range Weather Forecasting
1 Beijing Key Laboratory of Multimedia and Intelligent Software Technology, Beijing Institute of Artificial Intelligence, School of Information Science and Technology, Beijing University of Technology, Beijing, 100124, China
2 Key Laboratory for Cloud Physics of China Meteorological Administration, China Meteorological Administration Weather Modification Centre, Beijing, 100081, China
3 School of Computers, Chengdu University of Information Technology, Chengdu, 610039, China
* Corresponding Author: Yong Zhang. Email:
(This article belongs to the Special Issue: Graph Neural Networks: Methods and Applications in Graph-related Problems)
Computers, Materials & Continua 2025, 84(2), 2121-2149. https://doi.org/10.32604/cmc.2025.063373
Received 13 January 2025; Accepted 29 April 2025; Issue published 03 July 2025
 View Full Text
 Download PDF
Abstract
Weather forecasting is crucial for agriculture, transportation, and industry. Deep Learning (DL) has greatly improved the prediction accuracy. Among them, Graph Neural Networks (GNNs) excel at processing weather data by establishing connections between regions. This allows them to understand complex patterns that traditional methods might miss. As a result, achieving more accurate predictions becomes possible. The paper reviews the role of GNNs in short-to medium-range weather forecasting. The methods are classified into three categories based on dataset differences. The paper also further identifies five promising research frontiers. These areas aim to boost forecasting precision and enhance computational efficiency. They offer valuable insights for future weather forecasting systems.Keywords
Accurate weather forecasting is now more critical than ever, given the ongoing challenges of global climate change [1] and the rising frequency of extreme weather events [2–4]. It is essential for managing climate risks and ensuring economic and social stability [5]. However, weather forecasting is a complex scientific challenge. It necessitates processing large amounts of meteorological data, modeling spatio-temporal relationships and identifying nonlinear patterns [6]. Based on the differences in theoretical foundations and computational processes, the weather prediction methods can be broadly categorized into Numerical Weather Prediction (NWP) methods [7], DL-based models [8] and hybrid methods that combine them. NWP methods rely on meteorological observations and physical models, using numerical calculations to simulate atmospheric dynamics. They are commonly utilized for long-term and large-scale forecasting. As a result, these methods require significant computational resources. However, their accuracy is suboptimal, especially for predictions that are short-term or small-scale. The high computational cost and insufficient precision in detailed forecasting present significant challenges.
Recent advancements in Artificial Intelligence (AI) have introduced data-driven methods in meteorology, creating new possibilities for weather forecasting [9]. DL-based methods utilize substantial amounts of historical data to learn and identify data features automatically. Promising results have been achieved in many fields. They have also been applied to short-term weather forecasting. Vision Transformers (ViTs) [10] segment images into fixed-size patches and process them using Transformer architectures, effectively capturing long-range dependencies within visual data. In meteorological forecasting, ViTs have been applied to tasks such as image recognition and segmentation, demonstrating potential in handling complex visual information. Adaptive Fourier Neural Operators (AFNOs) [11] operate in the frequency domain using Fourier transforms, efficiently capturing global features of spatial data. In weather forecasting, AFNOs have been employed to process meteorological data, facilitating efficient modeling and prediction of atmospheric patterns. Spectral Fourier Neural Operators (SFNOs) [12] apply Fourier transforms on spherical surfaces, effectively handling spectral information of spherical data like Earth’s atmosphere. In meteorological forecasting, SFNOs capture global spectral characteristics, achieving high-precision simulation and prediction of climate patterns. The complexity of weather data and significant spatiotemporal dependency present challenges for DL-based models. Despite the promise of DL-based methods in weather forecasting, several challenges still need to be addressed. Firstly, traditional DL-based methods, such as Convolutional Neural Networks (CNNs), are typically designed for structured data (images). However, meteorological data often forms irregular, spatially correlated graph structures (such as relationships between weather stations and interactions between atmospheric layers). As a result, conventional methods generally cannot handle such graph-structured data expediently. Secondly, the atmospheric environment includes complex regional interactions such as wind patterns, humidity, and temperature [13]. CNNs excel at capturing local spatial information. However, they have limitations in modeling global and cross-regional dependencies. In contrast, GNNs are more effective in naturally capturing the complex spatial relationships and dependencies between data.
Meteorological data often involves complex, non-linear structures. As shown in Fig. 1, the transition from convolution to graph convolution opens new possibilities for processing them. GNNs are a broader framework that includes graph convolution as a critical operation [14]. GNNs offer a robust and versatile solution for analyzing meteorological data due to their outstanding ability to capture various characteristics within the data. Specifically, GNNs show great promise in weather forecasting, disaster warning, and climate modeling, highlighting a key research area in meteorology. As shown in Fig. 2, the exploration of graph structures, variants of fundamental structures such as heterogeneous graphs, multidimensional graphs, bipartite graphs, hypergraphs and dual graphs, are opening new avenues for future research in weather forecasting. Notably, spatio-temporal Graph Neural Networks (STGNNs), as a specialized form of multidimensional graphs, can effectively capture the intricate spatial and temporal dependencies inherent in meteorological systems. In weather forecasting, STGNNs represent weather stations or geographical regions as nodes within a graph, utilizing edges to denote spatial proximities or correlations. This methodology enables the modeling of dynamic changes in weather systems, thereby enhancing the accuracy and reliability of forecasts. These advanced graph structures provide flexible and powerful tools to model the complex spatial, temporal, and multimodal relationships inherent in weather systems. As meteorological data becomes increasingly accessible, advancements in network model development continue to grow. AI technologies are anticipated to significantly enhance weather forecasting shortly. Notably, GraphCast [15], developed by Google’s DeepMind research team, has achieved high-precision predictions of future weather conditions. This method not only enhances the accuracy and efficiency of weather forecasting but also marks a significant breakthrough in the application of GNNs to this field.
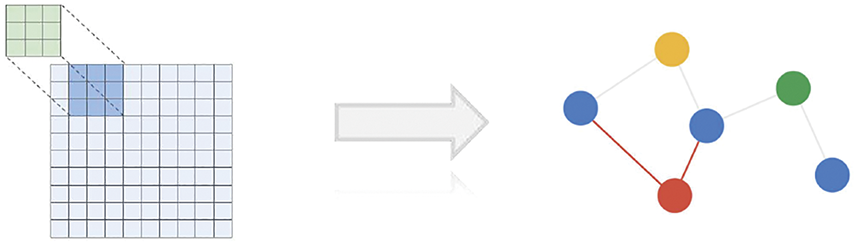
Figure 1: Convolution from image to graph
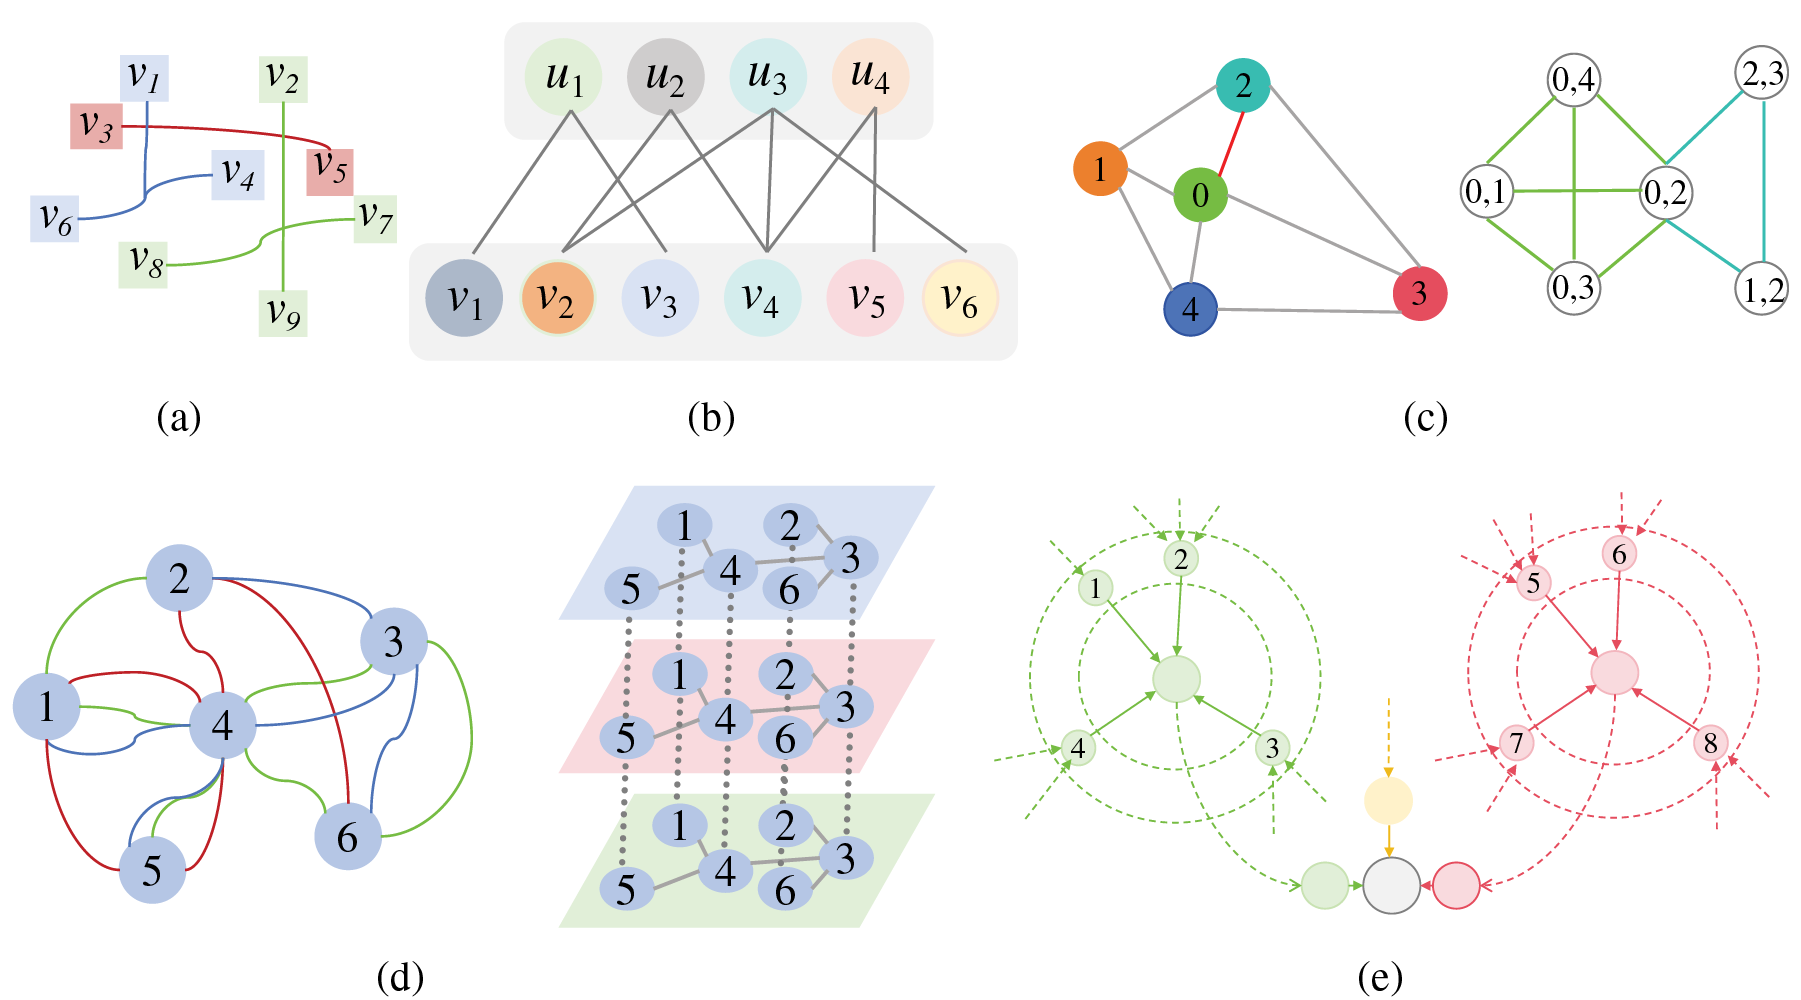
Figure 2: Derived structures of graphs. (a) Hypergraph. (b) Bipartite Graph. (c) Dual Graph. (d) Multidimensional Graph. (e) Heterogeneous Graph
Concerning weather forecasting tasks, GNNs effectively account for spatial dependencies, the evolution over time, local and global relationships, heterogeneity and dynamic changes. The specific statement can be expressed as follows:
(1) Spatial Dependencies. In contrast to CNNs, which excel at handling regular structures such as images, GNNs can naturally process non-Euclidean data structures. As shown in Fig. 3, applying spatial dependencies through the design of Graph Convolutional Networks (GCNs) enables the model to automatically learn and capture the spatial relationships between meteorological variables from observational data. This enhances the model’s ability to model dependencies across different geographical locations. This approach is handy for tasks with significant spatial characteristics in meteorological data, such as weather system prediction and climate change studies. For example, GNNs represent locations such as weather stations, cities, or regions as nodes in a graph. The edges illustrate the relationships between these locations. Graph structure effectively represents spatial dependencies, illustrating how weather changes in one region can impact nearby areas [16]. In addition, GNNs are also applicable to remote sensing meteorological data. Fig. 4 illustrates the schematic of graph construction based on radar echo images [17].
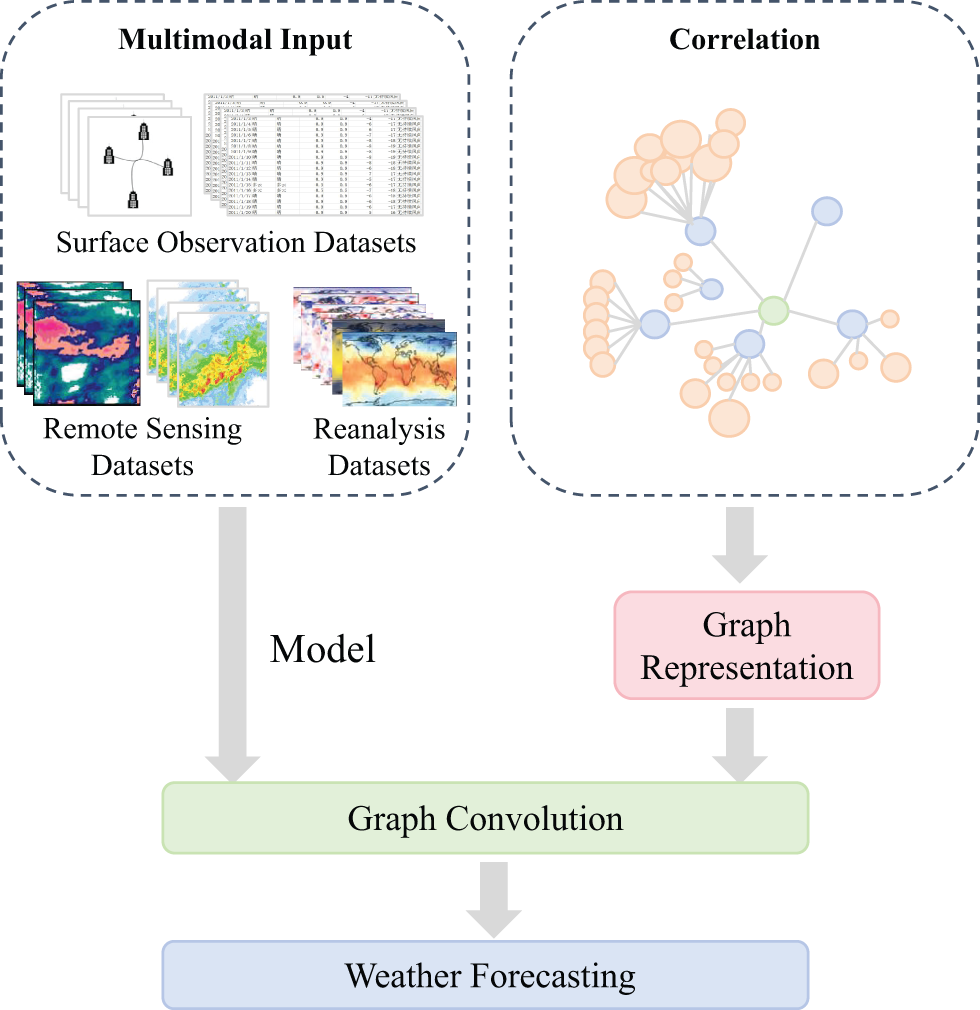
Figure 3: Spatiotemporal dependency modeling based on GNNs
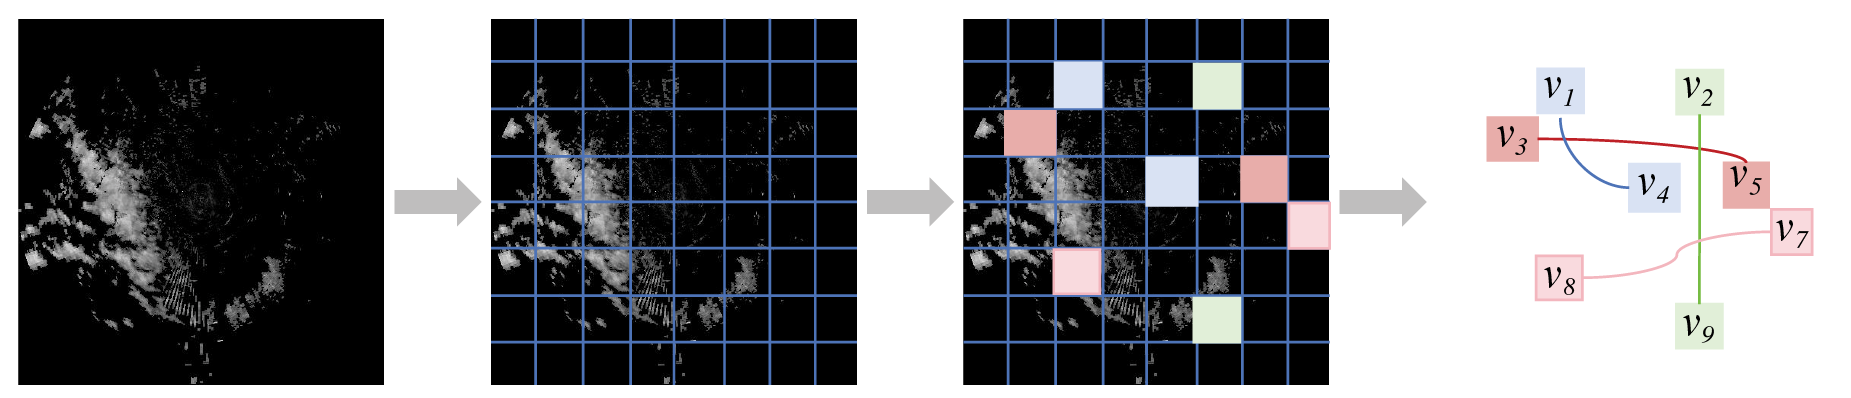
Figure 4: Graph representation of weather data
(2) Temporal Evolution. Weather patterns change over time and require fine-grained temporal modeling. As shown in Fig. 3, graph-based theory provides crucial support for capturing the dynamic changes of meteorological variables over time. Incorporating GCNs, the model can integrate spatial dependencies within a single time step. Additionally, the model can capture dynamic changes across multiple time steps by combining temporal evolution mechanisms, such as RNNs or attention mechanisms. Whether through integrating timestamp embedding, temporal convolutions, or designing dynamic GNNs, temporal dependencies can seamlessly be incorporated into the GNNs. This expands the applicability of GNNs. As a result, GNNs can handle static graph structures and perform effective inference in complex, time-varying graphs [18]. This approach allows the model to capture both spatial and temporal dependencies of meteorological variables, leading to more accurate predictions of future weather conditions.
(3) Local and Global Relationships. The complexity of meteorological systems involves local weather phenomena and their interactions with larger-scale weather patterns [19]. GNNs naturally capture regional and global relationships utilizing graph structures [20]. Local nodes exchange information with different nodes from nearby areas, enabling the model to capture complex interactions between local and global weather patterns.
(4) Heterogeneity. Meteorological data is often diverse, as it can originate from multiple sources. GNNs effectively manage heterogeneous data by incorporating various node and edge types to represent different data sources [21]. This allows the model to integrate and process data from multiple sources and dimensions within a unified framework, improving its performance and predictive ability.
(5) Dynamics. Meteorological systems are naturally dynamic, and weather conditions can change quickly over short periods. The dynamic nature must be carefully considered in the forecasting model. Fig. 5 illustrates the message-passing process within a graph structure. GNNs are highly adaptive and can update the graph, capturing the dynamic changes of nodes through information propagation within the graph [22]. As new meteorological data arrives, the structure and features of the graph are adjusted to reflect the latest conditions of the meteorological system.
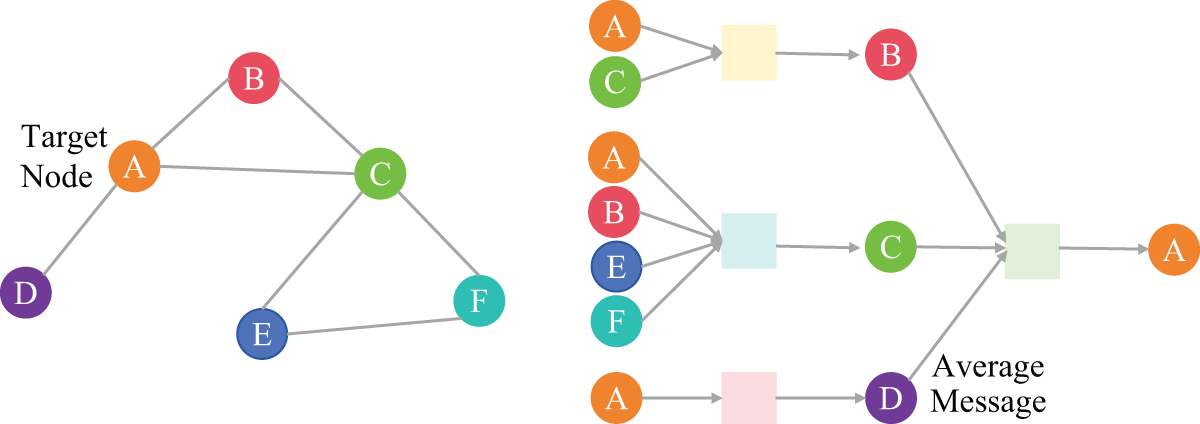
Figure 5: Message-passing process in graph structure
Fig. 6 presents the general workflow of the weather forecasting method based on GNNs. Based on these, this paper reviews the advancements in GNNs for weather prediction and explores potential future research directions. The remainder of the survey is structured as follows. Section 2 presents the relevant theories of GNNs, establishing a strong foundation for the introduction of subsequent methods. Section 3 discusses three types of datasets and the GNNs-based weather forecasting methods developed for each. Section 4 explores potential future research directions for GNNs-based weather forecasting methods. Finally, Section 5 concludes by summarizing the main findings of the study. Highlights the limitations of existing processes and suggests possible areas for improvement.
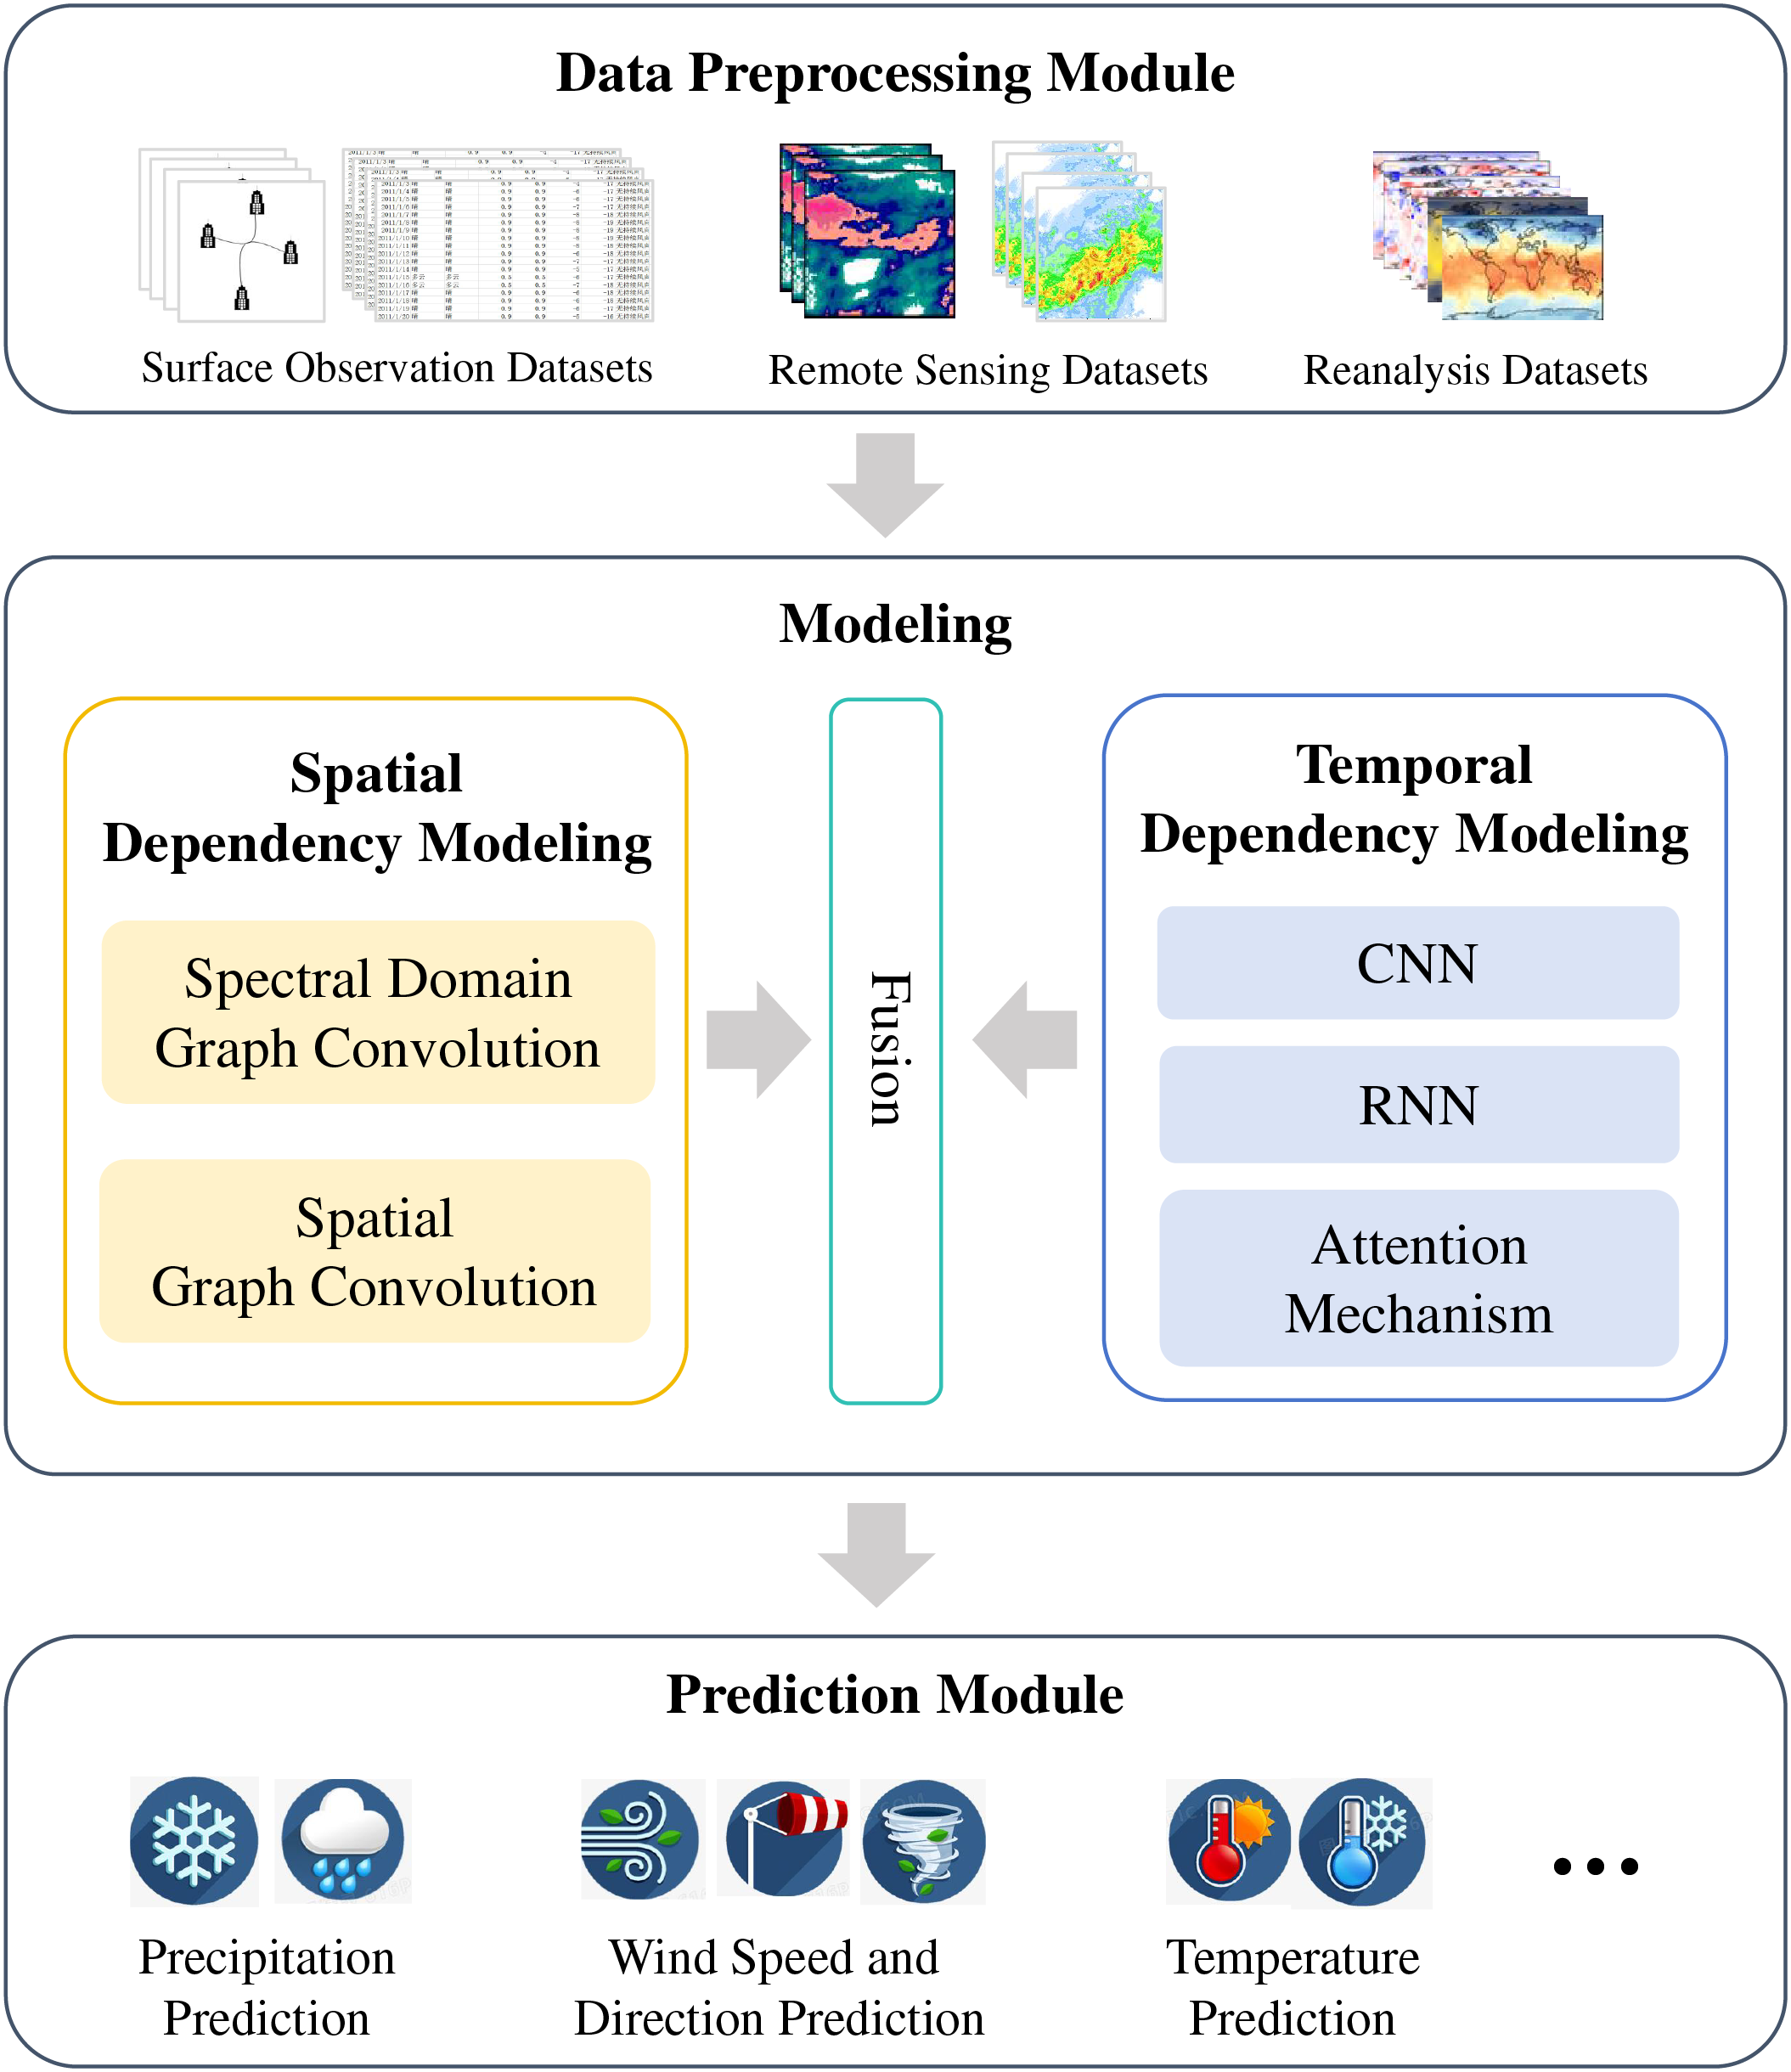
Figure 6: Overarching framework diagram for weather forecasting tasks
GNNs have been showing considerable promise in analyzing complex data structures. They are highly skilled at analyzing data that includes intricate relational and structural information. This chapter gives an overview of the fundamental framework and key principles of GNNs, followed by the essential GNNs-based techniques used in weather forecasting. These techniques offer innovative methods for modeling meteorological data, greatly improving the accuracy and efficiency of weather predictions.
GNNs are particularly suitable for processing data that can be represented as graphs, making them highly applicable in social networks [23], knowledge graphs [24], and transportation systems [25].
For a node in a graph, the element in
Similarly, the elements in
Weather prediction forecasts future meteorological conditions based on historical data. Given the historical weather data
GNNs are highly effective in weather forecasting because they can model spatial and temporal dependencies in meteorological data. The key technologies include message passing, graph convolution, graph pooling, graph embedding, and attention mechanisms. These technologies enable GNNs to capture interactions among weather stations and the relationships between atmospheric variables such as temperature, humidity, and wind patterns.
Message Passing Mechanism [26]. The message-passing mechanism is central to how weather data is essential for processing weather data in GNNs. Each weather station communicates with its neighboring stations to share local weather conditions. Message passing, aggregation, and updating are three key steps. In message passing, a node sends its feature vector to its neighbors. The neighbors then aggregate the received messages, typically through summation, averaging, or maximum pooling. Finally, each node updates its feature vector based on the aggregated information. This enables the model to capture regional weather patterns. The message-passing process is mathematically represented as follows:
where
Graph convolution [27]. It allows nodes to aggregate information from their neighbors in a way that reflects the spatial relationships between weather stations. In GCNs, the node features are updated by multiplying the normalized adjacency matrix (which represents the relationships between stations) with the feature matrix of nodes, followed by a linear transformation. The update rule in GCNs is:
where
Graph pooling and embedding techniques [28,29]. They are also useful for weather forecasting, especially when dealing with large-scale data. Pooling methods aggregate features from different weather stations into a global representation, which can then be used for prediction tasks. For instance, global pooling might aggregate features from all stations in a region to predict the average temperature or rainfall. Graph embedding methods like DeepWalk or node2vec reduce the dimensionality of the data and learn compact representations of weather stations, which can then be used for clustering or other analyses. Through graph pooling and embedding, the model transforms complex meteorological data into low-dimensional features that are easier to process, enabling accurate predictions.
Graph Attention Network (GAT) [30]. It introduces an attention mechanism in GNNs, enabling the model to assign varying weights to the information received from neighboring stations. This is crucial for weather forecasting, as certain stations may have a greater impact on the conditions at a specific location. The attention mechanism enables the model to adjust the importance of data from each station dynamically. The attention coefficients between nodes are calculated as follows:
where
3 Weather Forecasting Models Based on the GNNs
Weather forecasting involves predicting future weather conditions based on historical and current meteorological data. The core task is to predict future atmospheric states by simulating the atmosphere’s physical, chemical, and dynamic processes. This includes the distribution and spatiotemporal characteristics of meteorological variables, such as temperature, humidity, pressure, and wind speed. The challenge lies in how to efficiently combine the complex, nonlinear evolution of the atmosphere and large amounts of observational data to produce accurate predictions. Given the atmospheric state vector as
where
In GNNs-based models, meteorological data is transformed into a graph structure. Each node in the graph represents a weather observation point or region. For example, it could represent the temperature or humidity at a specific location. The edges between the nodes represent spatial relationships. These edges capture interactions between different meteorological variables. Given the undirected graph
where

3.1 Forecasting Methods Based on Reanalysis Datasets
The NWP methods forecast future weather using supercomputers to simulate the physical and dynamic equations of the atmosphere. These methods are widely recognized and have been implemented globally. Notable examples include European Centre for Medium-Range Weather Forecasts (ECMWF) [31,38,39], Global/Regional Assimilation and Prediction Enhanced System (GRAPES) [40], Weather Research and Forecasting (WRF) [41] and Advanced Regional Prediction System (ARPS) [42]. Combining NWP models with historical observational data forms reanalysis data building on this. These datasets offer continuous and long-term analyses of past climate variables. They cover global data on the atmosphere, oceans, land, and ice. Reanalysis data have been used for various applications, such as tropical cyclone tracking [43], the actual path datasets of tropical cyclones [44], and the fifth-generation climate reanalysis dataset published by ECMWF [45], NCEP/NCAR global temperature dataset [46], JRA-55 dataset [47] and MERRA-2 [48], etc.
Due to the relative abundance of such data, research related to it is also extensive. GraphCast [15] is a global medium-range weather forecast model. It uses an “encode-process-decode” structure. The processor applies 16 non-shared GNN layers for message passing across multiple grids. This enables efficient transfer of information both locally and remotely, resulting in fewer steps needed for message passing. GraphCast takes two recent weather states as input. It supports applications like predicting tropical cyclone tracks, atmospheric rivers, and extreme temperatures. Reference [49] proposed a data-driven method for predicting global weather using GNNs. The system learns to advance the current 3D atmospheric state by 6 h. Multiple steps are linked together to generate accurate forecasts for the coming days. The model is trained on reanalysis data from ERA5 or forecast data from GFS. Its experimental results are comparable to the full-resolution physical models of GFS and ECMWF. Peng et al. [50] focused on weather stations as the central nodes. They generated edges by calculating correlation coefficients between these nodes. The correlation was based on 15 years of daily maximum temperature and precipitation time series data. Perkins-Kirkpatrick and Lewis [51] examined the significant increase in the frequency, intensity, and duration of regional heatwaves under global climate warming, revealing spatial differences in heatwave trends across various regions and highlighting the intensifying impact of climate change on extreme weather events. Considering that global temperature changes have affected atmospheric circulation patterns, leading to various extreme weather events that were previously rare, Jeon et al. [52] proposed a new system called CloudNine. This system allows the analysis of individual observations’ impact on specific predictions based on explainable GNNs (XGNNs). Data from the Korea Meteorological Administration (KMA) and NWP grid points were collected. A web application was developed to allow users to search for 3D spatial observations of the Earth system. It also enables the visualization of the impact of individual observations on predictions. These predictions can be analyzed for specific spatial regions and periods. To enhance information sharing across locations, Feik et al. [53] proposed a GNN architecture for integrated post-processing. This architecture represents stations as nodes on a graph and employs an attention mechanism to identify relevant forecast information from nearby locations. In a case study using the EUPPBench dataset [54], the GNNs model demonstrated substantial improvements over highly competitive neural network-based post-processing methods. Ejurothu et al. [55] proposed a clustering-based ensemble GNNs method for air quality prediction across India. The model’s performance was validated on the ERA5 dataset. NWP is currently the most effective method for weather forecasting, but it may produce biases in specific regions when more local information is needed. To address this issue, reference [56] proposed a local NWP bias correction method called WeatherGNN. The model leverages GNNs under the guidance of Tobler’s First and Second Laws of Geography, effectively utilizing meteorological dependency density and spatial dependency. Experimental results on two real-world datasets from Ningbo and Ningxia demonstrated that WeatherGNN achieved state-of-the-art performance, surpassing the best baselines. Reference [57] proposes a novel approach for medium-range weather forecasting by leveraging graph-based models. It introduces GRAPHDOP, a framework that directly learns from observational data and initializes the model to improve forecasting skills, aiming to enhance the accuracy and reliability of medium-range weather predictions.
Reanalysis data combines historical weather observation data with NWP models to generate a comprehensive record of past atmospheric conditions. They provide consistent meteorological information globally and typically cover long periods, enabling detailed studies of localized weather events. Newer reanalysis datasets offer higher temporal and spatial resolutions, which enhances the possibility of modeling localized weather events in detail. Especially in the context of big data, the relationships among these types of data can be more effectively explored and leveraged using GNNs. GNNs are applied to reanalyze data to model long-term dependencies and the relationships between different weather variables (such as temperature, pressure, and wind speed) across both time and space. Reanalysis data exhibits strong spatiotemporal correlations, which GNNs can effectively capture. In particular, Spatiotemporal GCNs (ST-GCNs) are widely used for prediction tasks involving reanalysis data. These networks build spatial graphs between weather stations and combine them with time series data to model the spatiotemporal evolution of weather patterns. Although existing research has confirmed the usefulness of GNNs in weather forecasting tasks, the complex relationships inherent in large-scale reanalysis data have not been fully explored. Therefore, future research should focus on this area to fully leverage the potential of reanalysis data.
3.2 Forecasting Methods Based on Surface Observation Datasets
Although the reanalysis data includes a wide range of meteorological elements and multiple datasets, the quality of these datasets could be more consistent. Comparatively, surface observation datasets come from a global network of observation stations. These stations continuously monitor and collect a range of meteorological parameters. These stations are located on land, in oceans, and in polar regions. These stations primarily record essential weather and climate elements. These elements encompass temperature, atmospheric pressure, wind speed, wind direction, precipitation, relative humidity, and solar radiation. These datasets are typically available in structured formats like CSV, NetCDF, and GRIB, which enable efficient storage and analysis. Data sources are diverse. For example, NOAA’s Integrated Surface Database (ISD) [34] offers global observational data from 1901 to the present. And the Global Historical Climatology Network (GHCN) [58] supports long-term climate analysis. These stations provide critical scientific data that enhances the precision of weather forecasts. Reference [59] is a high-resolution weather dataset containing 2048 surface stations and includes four meteorological elements: temperature, cloud cover, humidity, and wind. The sub-dataset proposed by Lin et al. [60] comprises global weather conditions from 01 January 2010, to 31 December 2018, with hourly meteorological observations. The integrated dataset [61], constructed from 145 wind stations across northern U.S. states, includes wind speeds for 1326 simulated wind farms. Wind speed and direction measurements were collected every five minutes over six years, from 2007 to 2012, totaling 105,120 data samples recorded each year. Gathering and analyzing these datasets are crucial for environmental science, meteorology, and related fields. They enable researchers to study the occurrence and evolution of meteorological phenomena and evaluate their effects on human activities and the natural environment. They are widely used in weather forecasting, climate change research, agriculture, and water resource management.
Some current methods have focused their attention on the prediction of individual meteorological elements. Lira et al. [62] proposed GRAST-Frost for low-temperature and frost warnings. Furthermore, the authors developed an Internet of Things (IoT) platform capable of retrieving weather data from stations and gathering data from 10 nearby stations. The model is designed to provide predictions 6, 12, 24, and 48 h in advance. Conversely, in high-temperature forecasting, Li et al. [63] proposed a GNN-based heatwave prediction method. This method offers accurate real-time alerts for sudden regional heatwaves while keeping computational and data collection costs low. It reveals the spatial and temporal patterns of regional heatwaves, contributing to a deeper understanding of general climate dynamics and causal interactions between locations. The authors also emphasize that the proposed framework can be extended to the detection and prediction of other extreme or compound climate events. Reference [64] compared the weather forecasting capabilities of Graph WaveNet (GWN) and Low Rank Weighted GNNs (WGN) in South Africa. These results were compared with two baseline temporal deep neural network architectures: LSTM and Temporal Convolutional Network (TCN), for predicting maximum temperatures at 21 weather stations across South Africa. Since PM2.5 concentrations are affected by various long-term factors, it is crucial to consider complex information sources. Reference [65] proposed a new graph-based model, PM2.5-gnn, which can capture long-term dependencies. The model’s effectiveness was validated using the real-world dataset, KnowAir, showing its ability to capture both fine-grained and long-term impacts on PM2.5. Liu et al. [66] developed a Spatiotemporal Adaptive Attention Graph Convolutional Model for short-term PM2.5 forecasting in urban air quality prediction. The model achieved state-of-the-art experimental results on real-world datasets from cities such as Beijing, Tianjin, and London. Due to many factors influencing wind speeds, Wu et al. [67] proposed a Multidimensional Spatial-Temporal GNN (MST-GNN). By aggregating wind speed data from both local and surrounding nodes, the model accurately forecasts local wind speeds. Experimental results on the Denmark Dataset and Netherlands Dataset demonstrated that the longer the prediction steps, the greater the advantage of MST-GNN compared to other methods. Similarly, Aykas and Mehrkanoon [68] proposed a wind speed prediction model based on GAT with multivariate input. The goal of this model is to obtain attention scores for each weather variable, effectively utilizing the spatiotemporal features of multivariate historical weather data. Experimental results from 12 stations in Denmark and the Netherlands show that the proposed model captures complex relationships in weather data better than previous architectures used for wind speed prediction. Khodayar and Wang [69] introduced a graph-based model that learns robust spatiotemporal features from data on wind speed and wind direction at nearby wind farms. The wind farms are modeled as undirected graphs, in which each node corresponds to a wind station. Simulation results show that the proposed framework effectively captures deep spatial and temporal features compared to the latest DL-based models.
In addition to the prediction of a single meteorological element, more work has emerged in the area of collaborative forecasting of multiple meteorological elements. Recognizing that existing methods often ignore interactions between regions, HiSTGNN [70] incorporates an adaptive graph learning module. This module constructs a self-learning hierarchical graph consisting of a global graph representing regions and a local graph capturing meteorological variables for each region. HiSTGNN effectively captures hidden spatial dependencies and various long-term meteorological trends through the use of graph convolution and gated temporal convolution. A dynamic interaction learning mechanism is introduced to enhance the bidirectional information flow between the two levels of the graph. Validation results on the WD_BJ, WD_ISR, and WD_USA datasets demonstrate that HiSTGNN exhibits significant advantages in predicting multiple meteorological factors. To address the nonlinearity and spatiotemporal autocorrelation in this data, Wilson et al. [71] proposed a coupled Weighted Graph Convolutional Long Short-Term Memory (WGC-LSTM) method. The graph convolution models spatial relationships. The model’s effectiveness in weather prediction was validated using two datasets: the Integrated Global Radiosonde Archive (IGRA) [72] and NOAA Global Surface Summary of the Day (GSOD) [73]. Similarly, reference [74] proposed a method for accurate weather forecasting within the framework of a Physics-Aware Graph Network (PaGN). The aim is to improve the prediction of weather by integrating data defined over sparsely distributed spatial domains with physical equations. The study enhanced weather forecasting accuracy by incorporating climate observations from Los Angeles, San Diego, and additional data from NOAA.
To tackle the challenges of large-scale and long-term spatiotemporal forecasting, Xu et al. [75] designed the Dynamic Graph Former (DGFormer) to predict the weather, capturing the effects of inherent nonlinearity and dynamic spatiotemporal autocorrelation. The model’s effectiveness was enhanced by embedding domain knowledge. Using weather station data from WeatherBench [76], DGFormer achieved remarkable performance in both short-term and medium-term forecasting. Similarly, to tackle large-scale and long-term spatiotemporal forecasting, reference [77] applied a graph structure learning and optimization method based on an Evolutionary Multi-Objective Optimization (EMO) algorithm, referred to as Graph Evolution (GE). Experimental results from 184 stations and 18 meteorological element datasets in northern China demonstrated that the model consistently outperformed many existing models. Chen et al. [78] designed a new air quality forecasting method that effectively addresses the shortcomings of existing research in learning the spatiotemporal correlations of air pollutants. They proposed a model called Adaptive Adjacency Matrix-based Graph Convolutional Recurrent Network (AAMGCRN), which embeds GCN into LSTM to learn spatiotemporal dependencies. The paper demonstrated multi-step forecasting of hourly concentrations of PM2.5, PM10, and O3 at monitoring stations in Fangshan, Tiantan, and Dongsi in Beijing. Bhandari et al. [79] tackled the challenge of accurately capturing the complexity of geographical landscapes by introducing a novel graph representation method. This approach aims to improve the way spatial relationships and interactions within varied landscapes are modeled. The study developed a domain-guided knowledge graph specifically tailored for large and geographically diverse regions. Utilizing a comprehensive dataset spanning forty years, the model predicted multiple weather elements over long periods. Existing weather forecasting methods often overlook the irregular distribution of meteorological data and the complex coupling relationships between stations.
Miao et al. [80] proposed a hypergraph convolutional network (HGCN) that aggregates and disentangles multi-spatiotemporal information to model the spatiotemporal dependencies between meteorological flows. The final output provides multi-step forecasts of meteorological elements. Air quality forecasting methods struggle to model the diffusion of air pollutants between stations effectively. Chen et al. [81] proposed a hierarchical model for nationwide urban air quality forecasting called Group-Aware GNN (GAGNN). They constructed a city graph and a city group graph to model the spatial dependencies and latent dependencies between cities, respectively. A differentiable grouping network was introduced to discover latent dependencies between cities and generate city groups. Previous methods primarily focused on single-task approaches, often neglecting the mutual reinforcement between multiple tasks. To address this, Han et al. proposed a Multi-adversarial spatiotemporal recurrent GNN (MasterGNN) [82] for joint air quality and weather forecasting. The model uses a heterogeneous recurrent GNN to capture the spatiotemporal dependencies between air quality and meteorological monitoring stations. Air quality prediction focuses on the Air Quality Index (AQI), while temperature, humidity, and wind speed are used for weather forecasting. Experiments on datasets from Beijing [83] and Shanghai [84] show that MasterGNN outperforms seven baseline models in both air quality and weather forecasting tasks.
Surface observational data provide essential meteorological parameters such as ground-level temperature, humidity, wind speed, and precipitation, which help forecasting models accurately capture the current atmospheric state. GNNs are applied to these data to capture the relationships between observation stations with different geographic distributions. Since surface observation data typically has high spatial resolution, GNNs can effectively predict local weather patterns, such as short-term weather changes and the behavior of regional weather systems. Although existing forecasting methods have achieved excellent performance, they largely rely on the geographic locations of observation stations to construct the graph structure. Future research could explore how to enrich graph construction methods based on the characteristics of the data and application scenarios, to make further breakthroughs in this field.
3.3 Forecasting Methods Based on Remote Sensing Datasets
Remote sensing provides continuous coverage over a larger area than surface observation data. This is especially beneficial in remote areas and oceans where stations on the surface are limited. The advantages of remote sensing lie in its timeliness and wide coverage, enabling more comprehensive monitoring and forecasting. The Hong Kong Observatory’s radar echo data [35] from 2009 to 2015 records data every six minutes, resulting in 240 frames per day. Each frame has a resolution of 480
The radar echo extrapolation task most prominently represents weather forecasting based on remote sensing datasets. Radar echoes reflect the intensity and spatial distribution of precipitation in the atmosphere, serving as a critical data source for short-term precipitation forecasting. The radar echo extrapolation task aims to predict the distribution of radar echoes at future time steps using historical radar echo data. Radar echo extrapolation can be formalized as a sequence prediction problem. Let
which captures both spatial dependencies and temporal dynamics to predict the future evolution of radar echoes. Graph construction and spatiotemporal modeling are two aspects focused on this domain. Graph construction involves building dynamic graphs based on grid adjacency relationships or radar echo correlations. The adjacency-based graph construction method treats grid cells or regions as nodes. Edges are created between two nodes if their geographic distance is below a specified threshold. As for the physics-based graph construction method, edges are established based on airflow or water flow directions to capture the transport characteristics of physical processes. To achieve a more comprehensive representation, homogeneous and heterogeneous graphs can be constructed by combining geographic distance graphs and meteorological correlation graphs.
In recent years, the development of GNNs has led to the emergence of several representative works in weather forecasting methods based on remote sensing data. However, these methods are still relatively few. These advancements harness GNNs’ powerful capability to model intricate spatial dependencies. GNNs are becoming increasingly relevant for meteorological tasks that involve large-scale, highly dynamic datasets, particularly those obtained from remote sensing. Peng et al. [86] proposesd a radar quantitative precipitation estimation (RQPE) model based on GNN called Categorical Node Graph Attention Network (CNGAT). This model is designed to simulate the complex spatiotemporal characteristics of precipitation fields reflected in radar echo fields. CNGAT is particularly effective in capturing multiple features of the precipitation field, as indicated by the varying intensities in radar echo regions. Radar and observational data from East China in the summers of 2017 and 2018 showed that CNGAT significantly improves estimation accuracy and detection rates. It effectively resolves the underestimation of high precipitation rates and accurately represents complex precipitation patterns. Sun et al. [17] identified a crucial limitation in previous precipitation forecasting methods, often assuming a solid correlation between spatially adjacent locations and neglecting complex higher-order relationships. They proposed a short-term precipitation forecasting algorithm based on Hypergraph Neural Networks (HGNNs) to address this. This method analyzes higher-order correlations and uses historical data to track changes in precipitation patterns. The algorithm features a dual-branch network to capture both the overall trend of evolution and the intricate texture details. Effective drought forecasting depends on various climate variables and shows spatiotemporal, non-stationary, and nonlinear characteristics. Reference [87] proposed a Generative Adversarial Network (GAN) model that integrates CNN and LSTM networks using multivariate remote sensing data from the U.S. Geological Survey for African drought prediction.
Remote sensing data is gathered from a variety of sources. For instance, geostationary weather satellites monitor specific regions continuously, whereas polar-orbiting satellites provide detailed global meteorological observations. Weather radars are capable of accurately detecting precipitation, storms, and cloud dynamics. GNNs are used to process remote sensing data by encoding the spatial structure of images as graphs, capturing the interdependencies between pixels or regions. They have been applied to cloud classification, precipitation prediction, and atmospheric temperature estimation tasks. However, an unavoidable challenge is that the introduction of GNNs increases the complexity of the network to some extent. This is especially true for remote sensing image datasets, where it results in higher computational requirements, thus limiting the applicability of such methods in certain scenarios.
The rapid advancement of GNNs has significantly improved the field of meteorology. These advancements can greatly improve the accuracy and effectiveness of weather forecasting. Leveraging these innovations, researchers can unlock deeper insights and develop more accurate, robust forecasting models, further enhancing the accuracy and efficacy of weather predictions.
Ensemble forecasting [15,88] entails generating multiple predictions using various forecasting models or different initial conditions and synthesizing these results to create a more reliable weather forecast. Traditional ensemble forecasting methods usually give equal weights to each ensemble member. The DL-based ensemble forecasting method is an emerging technology that improves weather prediction performance using data-driven approaches. Traditional ensemble forecasting relies on NWP models, which simulate atmospheric dynamics using physical equations and parameterization schemes. The nonlinear nature of the atmospheric system and its sensitivity to initial conditions require ensemble forecasts to generate multiple members. In this process, DL-based methods can learn complex nonlinear relationships by analyzing large amounts of historical data. It can effectively manage high-dimensional data, incorporate multiple sources, and adapt to dynamic characteristics. This capability offers a new solution for ensemble forecasting.
Traditional ensemble forecasting methods in meteorology often rely on perturbing initial conditions to generate multiple forecasts, which may not fully exploit the complex spatial and temporal correlations inherent in meteorological data. Advancements in AI, such as Huawei Cloud’s Pangu-Weather model [89], have demonstrated significant improvements in forecasting speed and accuracy. Integrating these advanced models and knowledge graphs into ensemble forecasting could enhance the accuracy and reliability of weather predictions. Additionally, knowledge graphs can help construct associations between meteorological elements, enhancing the model’s understanding capabilities. Combining these advanced technologies with ensemble forecasting is expected to improve the accuracy and reliability of predictions. GNNs can significantly improve model performance in ensemble forecasting, especially when addressing complex spatiotemporal dependencies. GNNs are well-suited to capture intricate relationships between different regions, which is crucial for improving forecast accuracy. Meteorological data sources are diverse, including surface observations, satellite remote sensing, and numerical model outputs. As shown in Fig. 7, the DL-based model is an effective tool for ensemble forecasting, particularly in connecting the prediction outputs of different models with actual observation data. Aggregating these biases, the ensemble system can dynamically adjust individual model predictions to reduce systematic errors. As new data emerges, the model can be updated by adjusting edge weights to reflect the model’s performance under different weather conditions. Bipartite graphs, hypergraphs, and other graph structures help integrate various data sources, models, and forecasting strategies. These approaches contribute to the development of more accurate and intelligent meteorological forecasting systems.
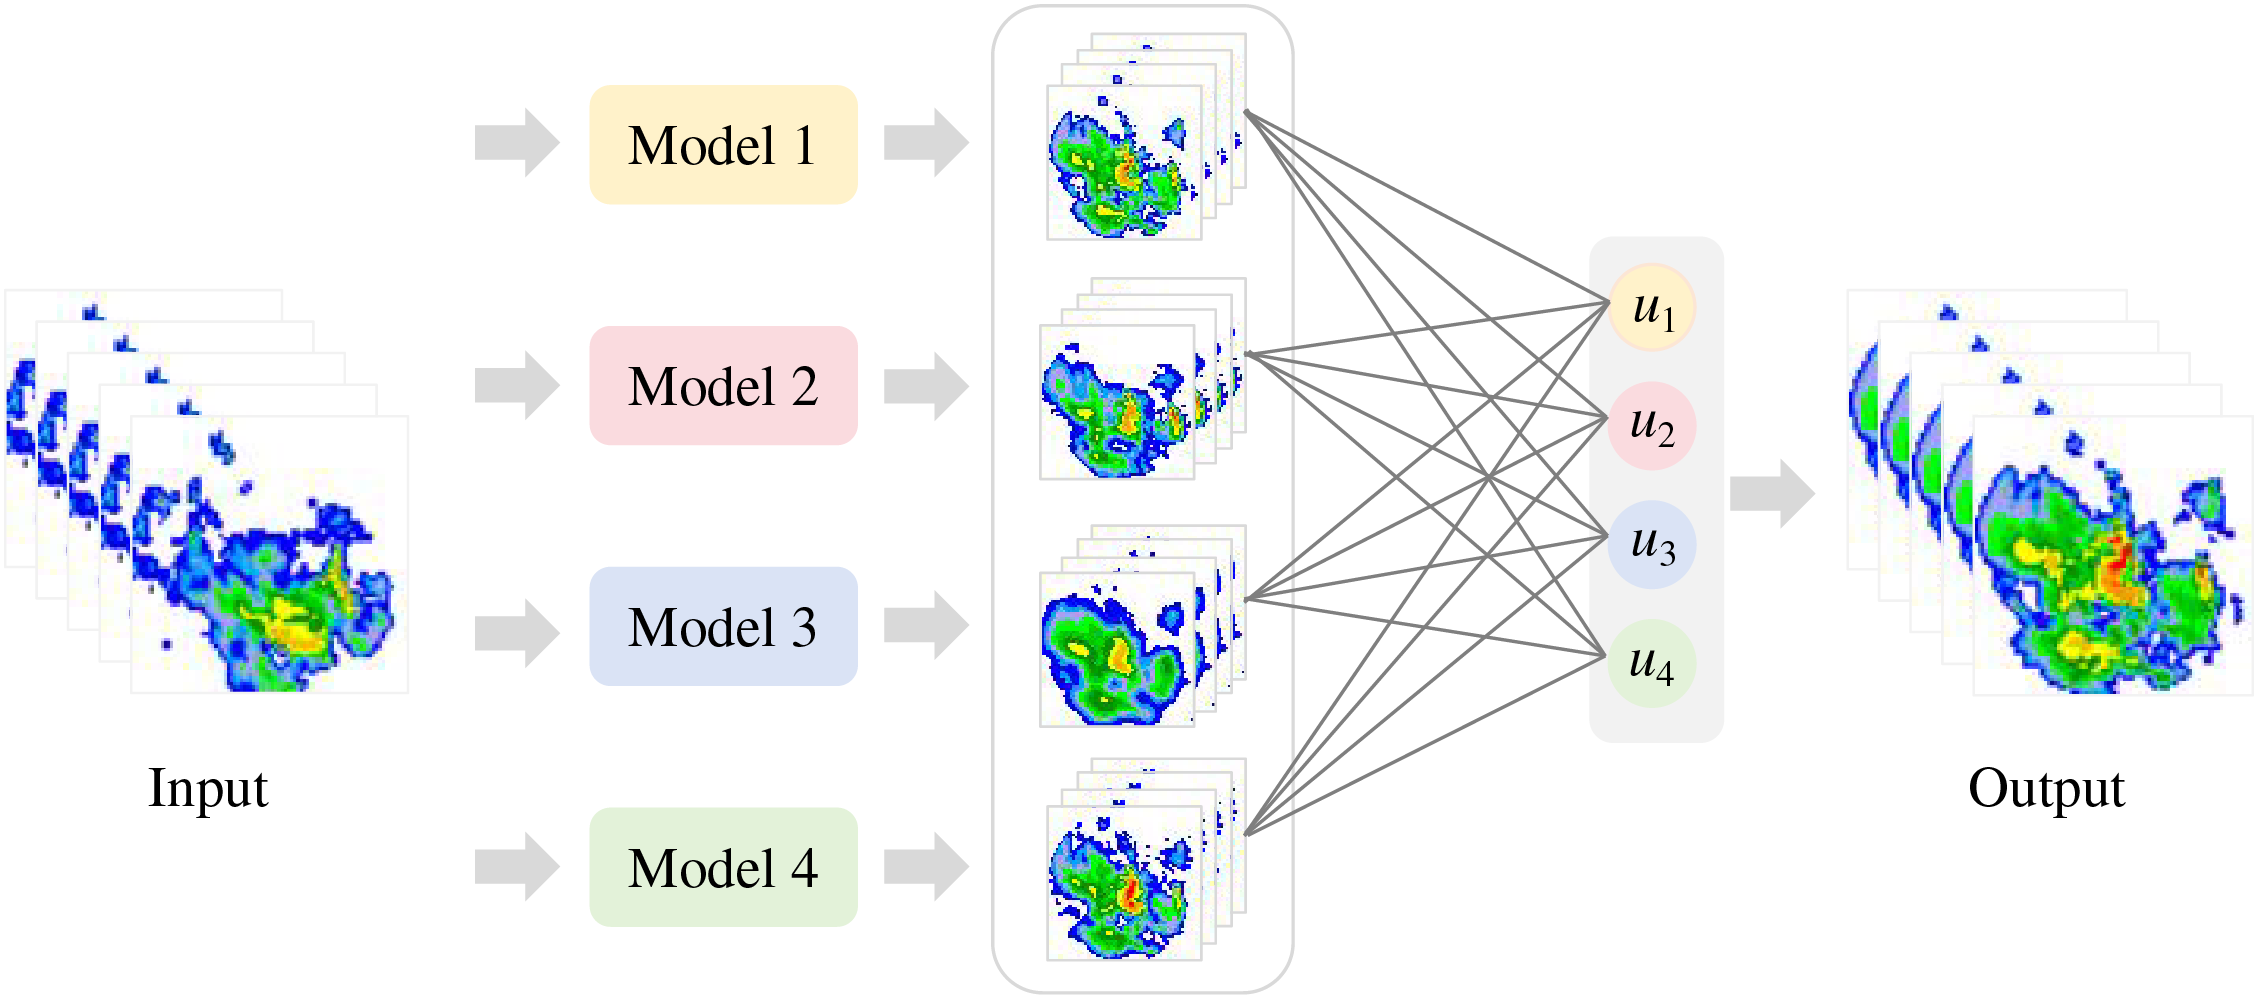
Figure 7: A schematic diagram of ensemble forecasting
4.2 Physics-Informed Forecasting
Spatial correlations are crucial in weather forecasting. For instance, changes in pressure in nearby areas can influence adjustments in wind patterns. More than relying solely on spatial correlations is required to comprehensively capture the evolution of meteorological systems. Meteorological systems are also governed by physical constraints, including energy conservation, mass conservation, and the principles of thermodynamics [90]. These physical constraints drive atmospheric motion and weather changes, offering valuable insights for meteorological forecasting [91]. Consequently, combining spatial correlations with physical constraints enhances the accuracy and robustness of meteorological forecasting models. Integrating physics-guided mechanisms with GNNs offers unique opportunities in weather forecasting. By embedding physical laws and constraints directly into GNNs, predictions can adhere to known meteorological principles, enhancing both interpretability and reliability. For instance, incorporating conservation laws or fluid dynamics equations into GNN frameworks can lead to more physically consistent forecasts. This integration also addresses data scarcity challenges by leveraging physical insights to guide the learning process, reducing reliance on large datasets.
Physics-informed forecasting methods enhance model interpretation of complex meteorological phenomena while addressing inconsistencies common in purely data-driven approaches. Capturing both spatial and temporal variations is crucial due to the complex dynamics of meteorological systems. Models based on GNNs and their variants provide effective frameworks for incorporating physical constraints into meteorological forecasting. These graph structures naturally represent the complex relationships between different meteorological variables. By leveraging flexible node and edge configurations, physical constraints can be easily integrated into the model. For instance, in surface observation data, observation stations can be represented as nodes in the graph, while the physical constraints related to them are reflected through the edges. This approach allows the graph structure to capture the interactions and constraints between meteorological variables, ensuring that the forecasting adheres to physical laws. Furthermore, the advantage of graph structures and their variants lies in their ability to handle complex, multi-variable, and multi-scale problems [92]. They enable the integration of various types of physical constraints (such as local and global constraints and nonlinear relationships) into the forecasting process. This structured representation enhances the model’s predictive capability and strengthens its adherence to physical laws. Importantly, graph structures also offer significant advantages in improving model interpretability [93]. The nodes and edges in the graph represent meteorological variables and their physical constraints, making the model’s prediction process more transparent and easier to understand. Each prediction can be traced back to specific variables and constraints, helping to analyze and verify whether the model’s outputs align with physical laws. Thus, graph structures not only provide a powerful mathematical tool for representing physical constraints but also offer a more flexible and efficient solution for physics-constrained meteorological forecasting tasks.
4.3 Multi-Modal Meteorological Forecasting
Traditional mathematical models rely on predefined physical laws. AI methods primarily rely on data. They emphasize extracting and learning patterns from data. They highlight the importance of effective multi-source data representations and collaboration for future advancements in meteorology. The need stems from specific task objectives and a variety of meteorological data. Meteorological datasets are becoming increasingly rich and varied. They include textual data, such as temperature, humidity, and pressure records from weather stations, typically presented in tables or written formats. They also consist of image data, including satellite and radar images that show cloud formations and precipitation. Additionally, there is 3D volumetric data, such as LIDAR or meteorological radar data, which represent atmospheric phenomena like clouds or raindrops as three-dimensional points. Integrating various types of meteorological data can enhance data utilization, thereby improving weather forecasting and climate research outcomes.
Cross-media data fusion facilitates learning joint representations across various sources, enhancing the model’s generalization ability and improving predictive accuracy across multiple weather phenomena [94]. In this context, GNNs can be extended into HGNNs to handle different types of nodes and edges. As shown in Fig. 8, HGNNs can capture higher-order relational dependencies between various regions. Satellite images, textual weather station records, and radar scans represent different modalities, yet HGNNs can harmonize these disparate inputs into a unified predictive framework.
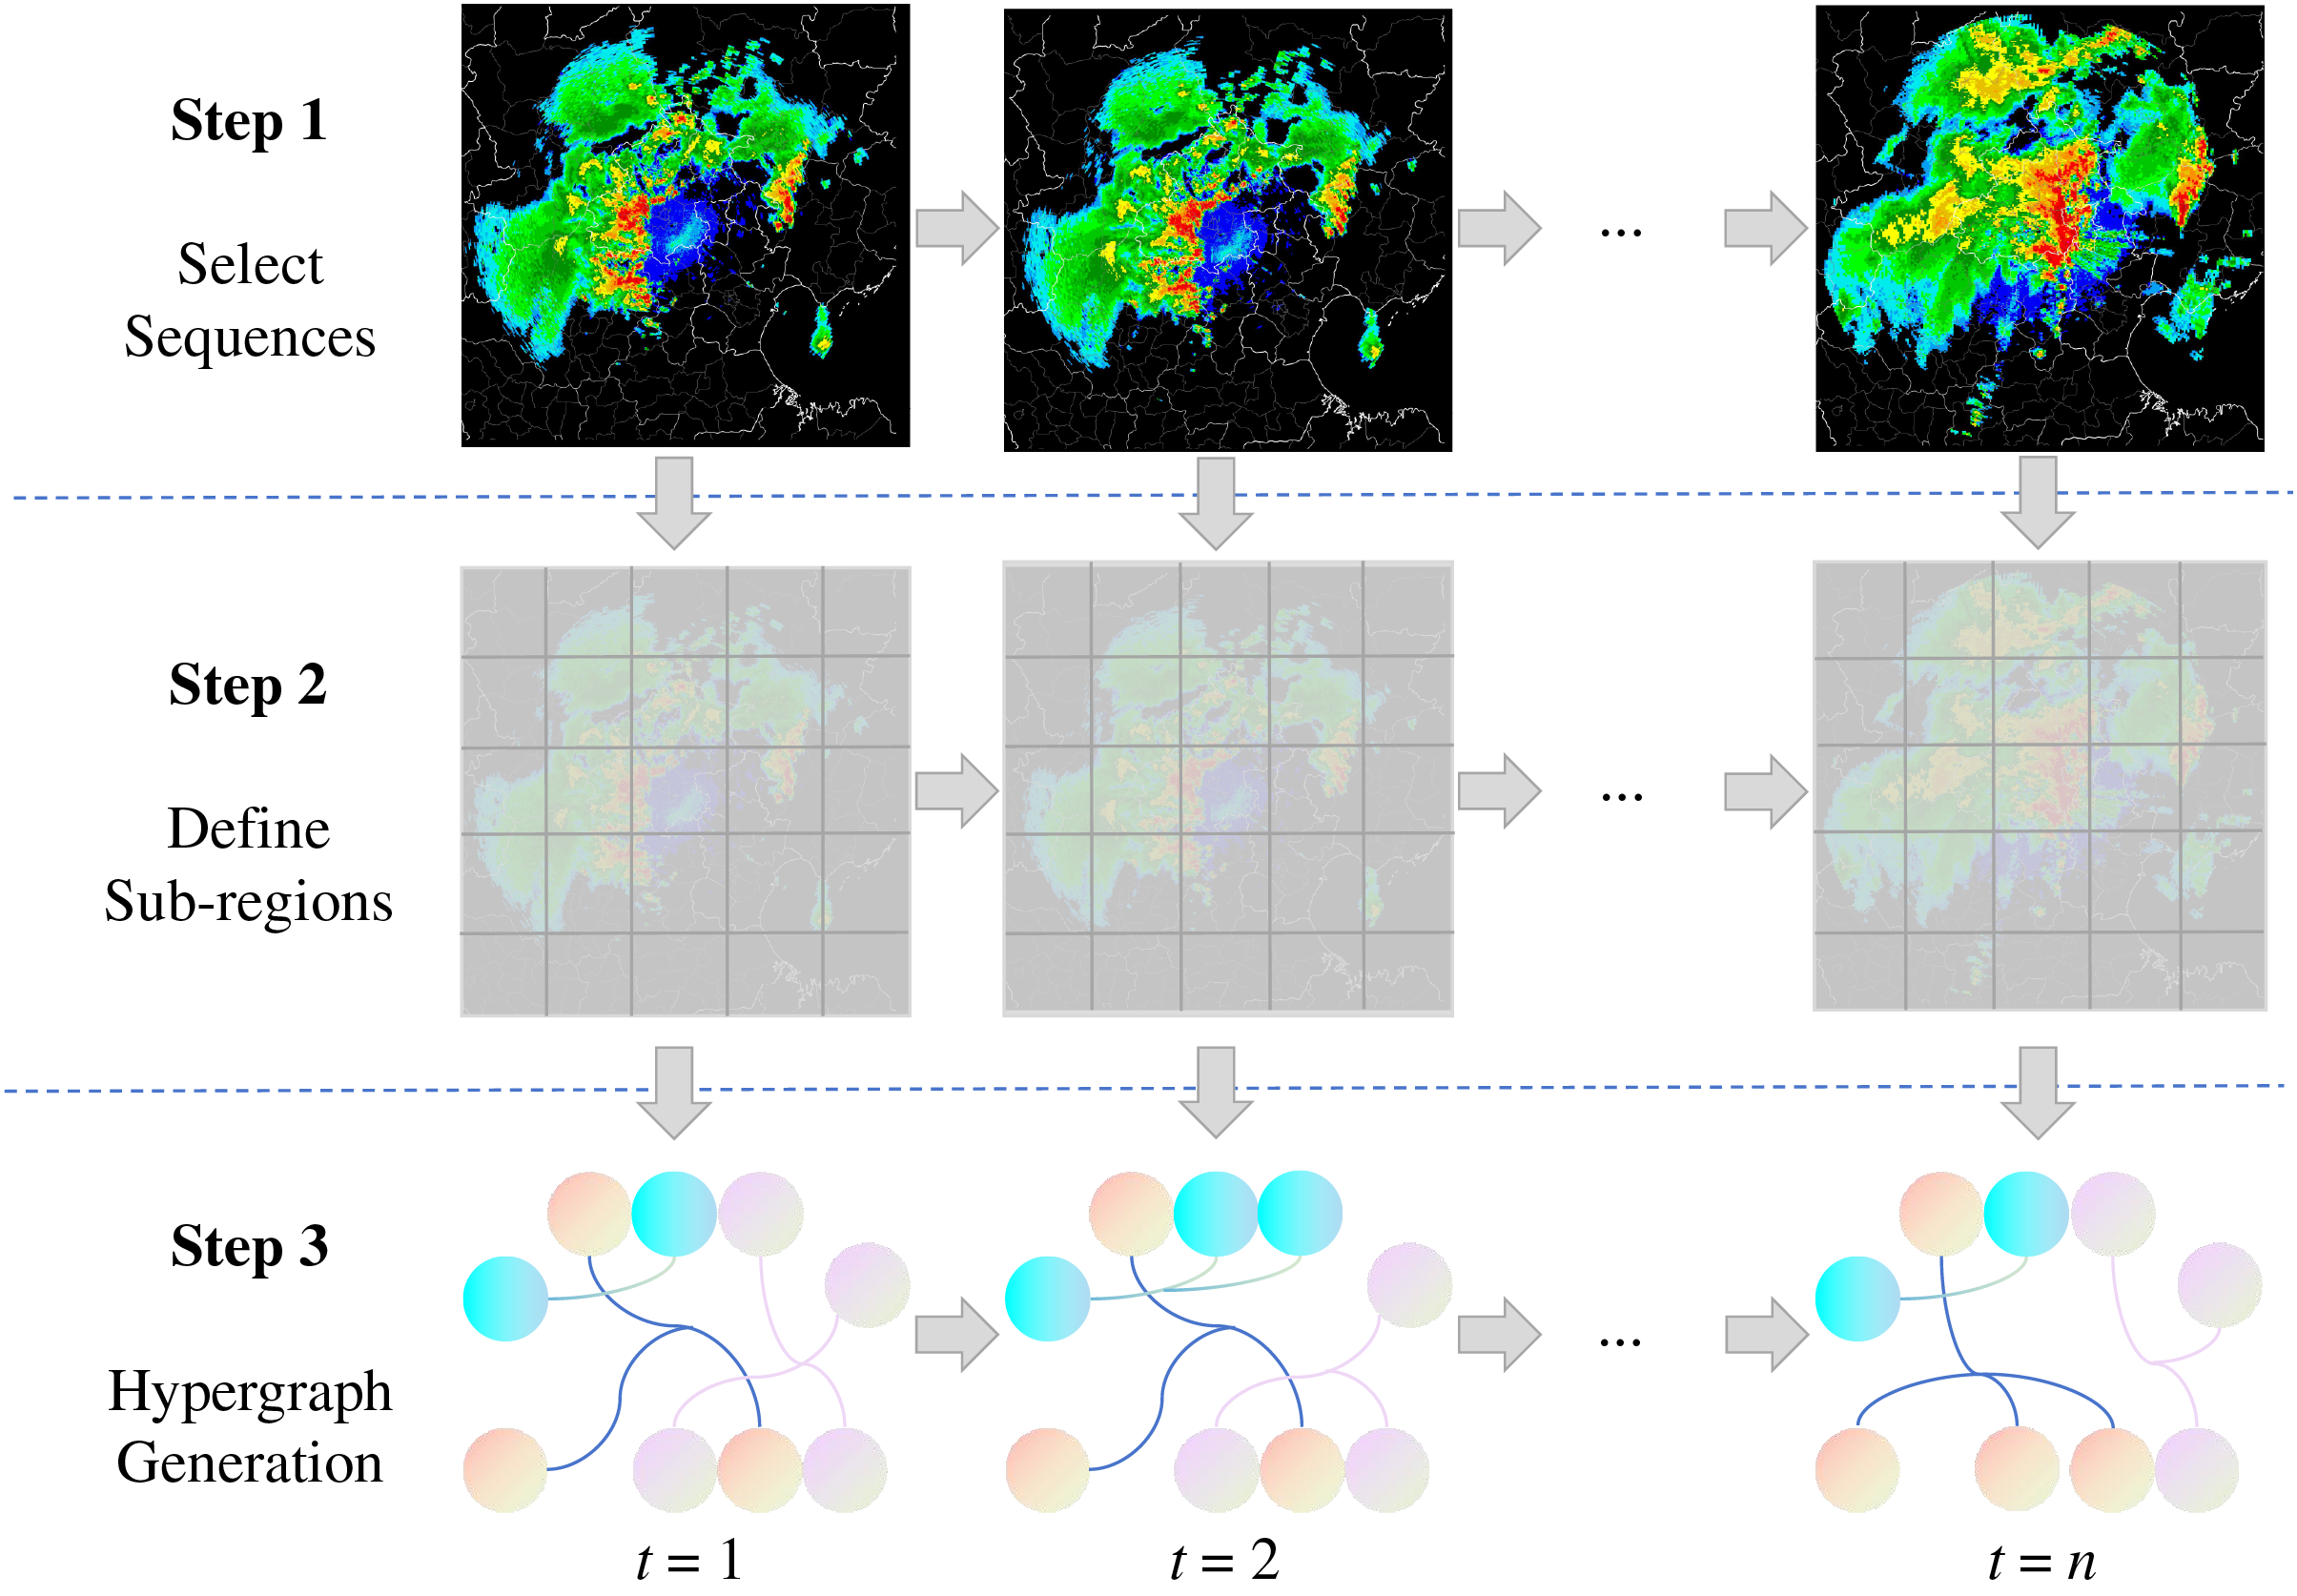
Figure 8: Capturing higher-order relational dependencies using hypergraphs
In weather forecasting tasks, various data sources, such as satellite imagery, radar data, and ground weather station data, often exhibit different features and structures. Graph-based methods [95] utilize various modalities to depict and capture the intricate dependencies among multimodal data. Heterogeneous graphs [96] are suitable for multimodal scenarios because they can handle different types of nodes and edges, effectively representing relationships between data. Heterogeneous graphs represent these diverse data in a unified framework. Additionally, multidimensional graphs provide a comprehensive model approach to these diverse dependencies. As illustrated in Fig. 9, multidimensional graph models can effectively integrate different modalities of meteorological data, such as images and text, to enhance prediction accuracy. Image data captures visual information such as weather patterns, cloud formations, and satellite imagery, while text data provides language-based information, including weather reports, meteorological observations, and historical weather records. GNNs can simultaneously process and learn the relationships and dependencies between them by mapping these heterogeneous data types into a unified multidimensional graph structure. In this framework, nodes represent different meteorological features, such as regions in images or keywords in text, while edges indicate their relationships or dependencies. This method allows the model to analyze and predict weather changes using spatial and contextual data from images and text.
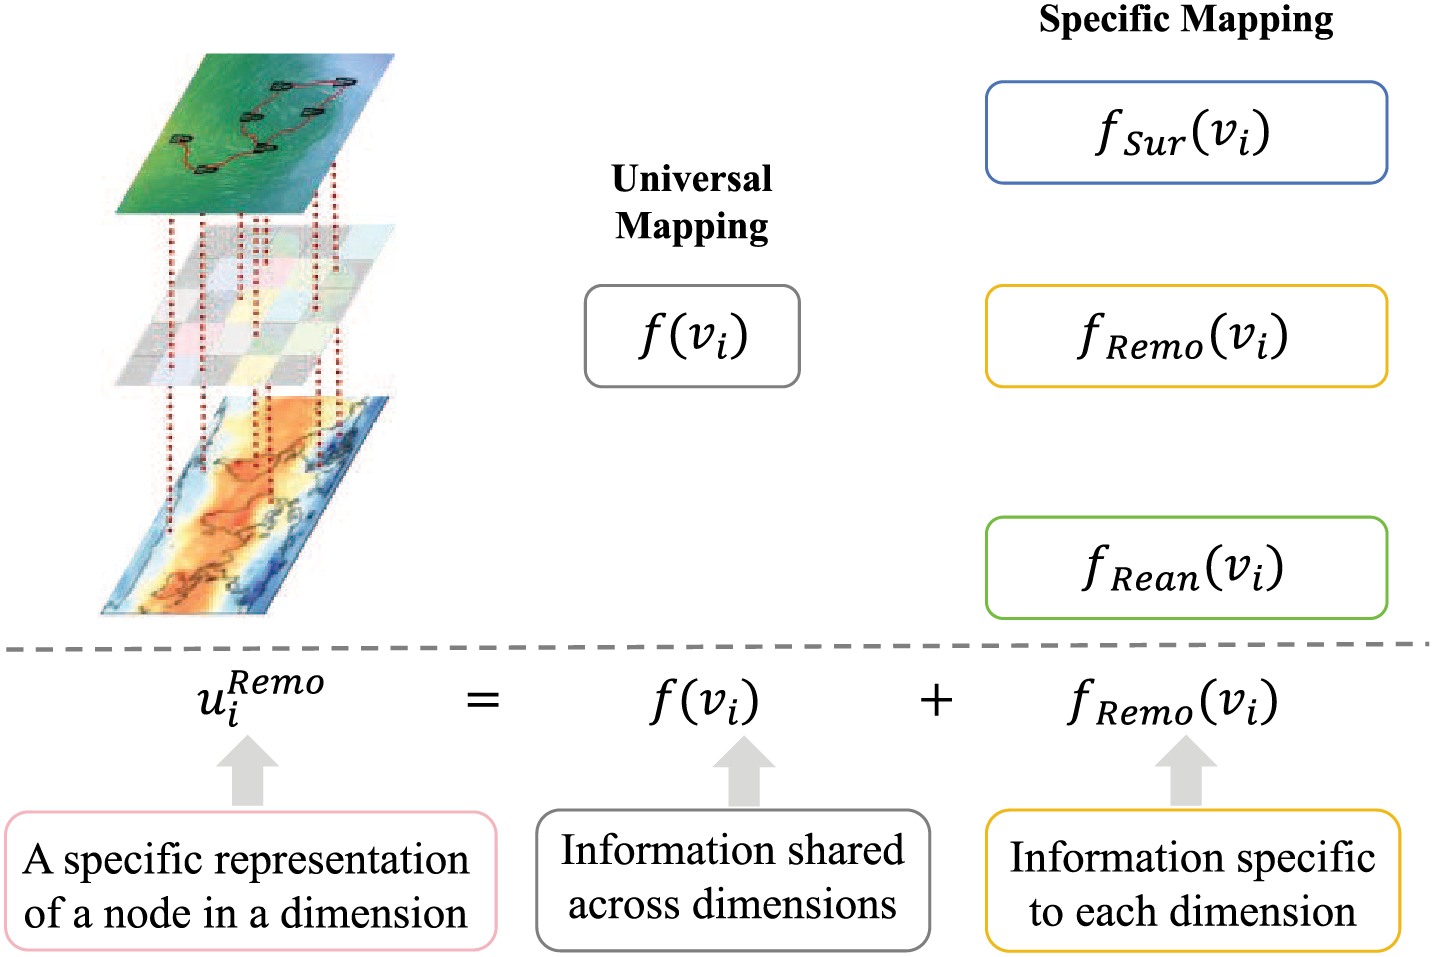
Figure 9: Integrating multimodal meteorological data using multidimensional graphs
4.4 Knowledge Graph-Based Forecasting
A knowledge graph [97] represents entities and their relationships as nodes and edges in a graph, effectively organizing and storing large amounts of structured and unstructured knowledge. Essentially, it is a graph structure, and many GNN-based models can be directly applied to knowledge graph data to leverage its advantages. This graph structure provides a rich source of information for GNNs, allowing the model to utilize the relationships and semantic information between entities during the training process, enabling more intelligent learning and reasoning [98]. First, a knowledge graph provides a richer source of background knowledge, helping models incorporate prior knowledge into prediction and decision-making processes. By introducing the entities and relationships within the knowledge graph, the model can draw on external knowledge sources, enhancing its understanding of the task beyond data-driven learning. Second, knowledge graphs offer significant support for the interpretability of the model. Traditional DL-based models often suffer from the black-box problem, where the decision-making process and predictions are difficult to interpret. In contrast, the graph structure makes the model’s learning process more transparent, as the predictions can be traced back through the relationships between nodes and edges, providing clearer insights into the reasoning behind the model’s outputs. Fig. 10 illustrates that the meteorological domain includes several core ontological concepts. These concepts can form the foundation for building meteorological knowledge graphs to support weather forecasting. These core ontological concepts include meteorological phenomena, geographic entities, temporal dimensions, and causal relationships related to meteorological events. These ontological concepts offer a logical framework for constructing meteorological knowledge graphs. This framework allows for the effective integration of heterogeneous meteorological data and helps uncover the intrinsic relationships among variables. As illustrated in Fig. 11, constructing a meteorological knowledge graph enables the capture of complex interactions among meteorological factors. For instance, reasoning based on the knowledge graph can help identify potential triggers for extreme weather events under specific conditions or predict possible future weather trends. Additionally, knowledge graphs provide domain knowledge that improves AI-based models and addresses the limitations of data-driven approaches in predictive performance. In summary, knowledge graphs built upon core ontological concepts represent an innovative and promising tool for enhancing weather forecasting methodologies.
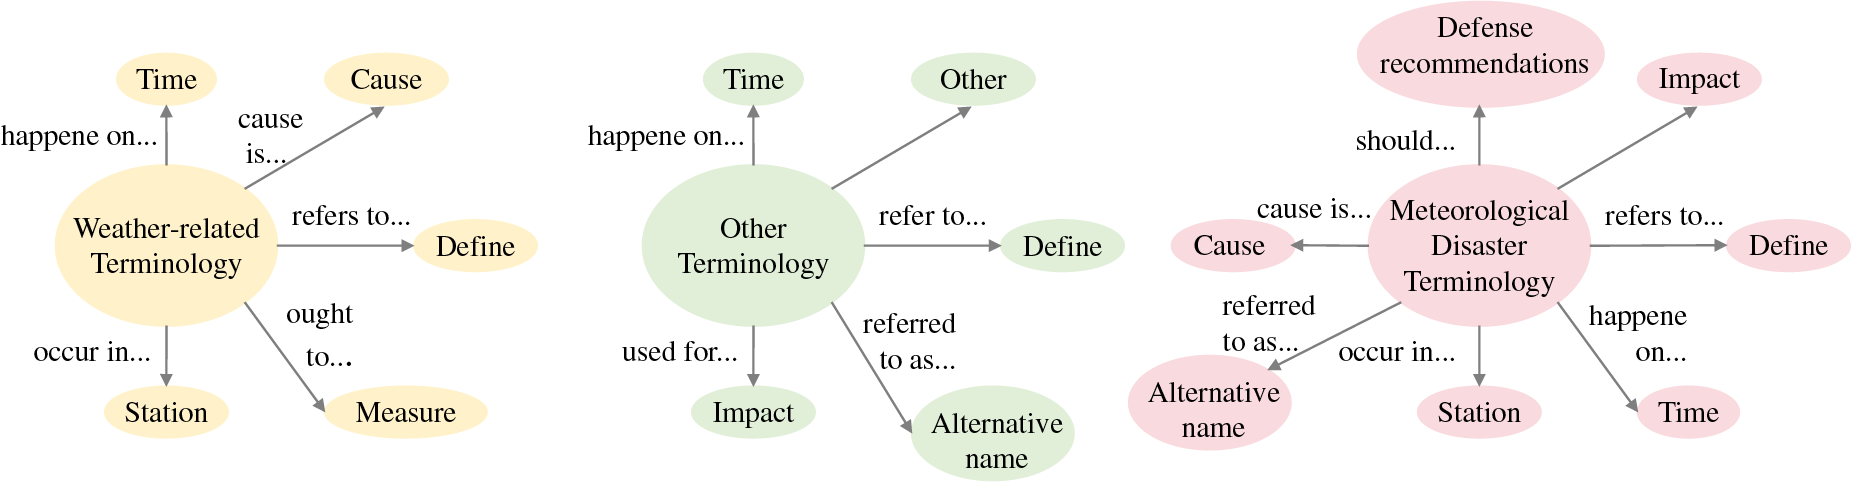
Figure 10: Core ontology conceptual model in weather forecasting
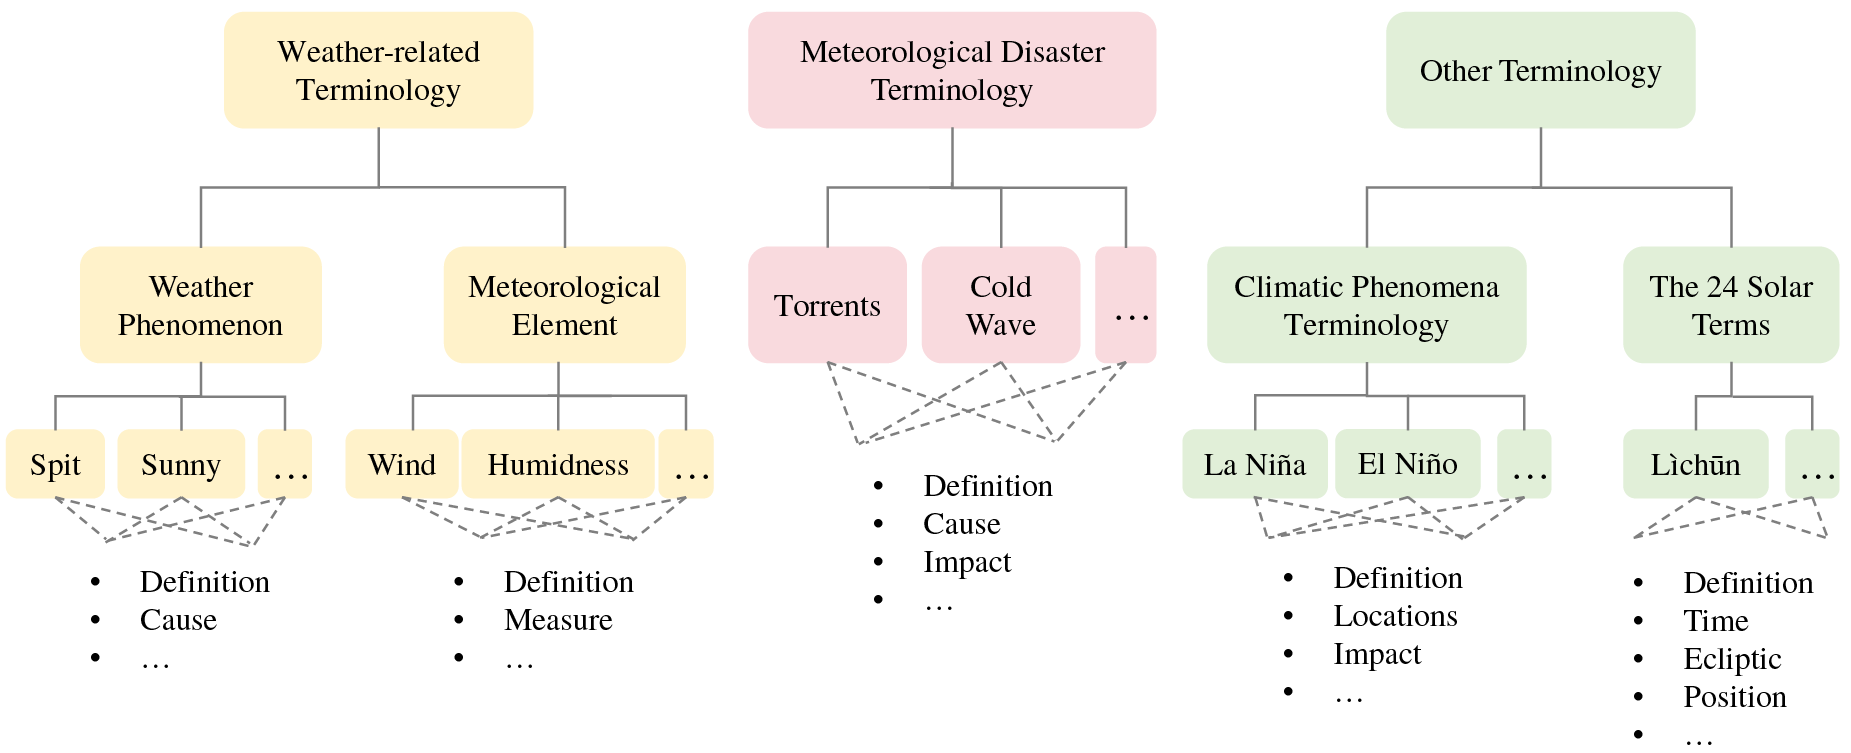
Figure 11: Hierarchical structure of the meteorological knowledge graph
Knowledge graphs play a crucial role in weather forecasting by enabling the integration and analysis of diverse data sources. However, integrating knowledge graphs into forecasting tasks presents challenges [99]. Building and maintaining accurate and up-to-date knowledge graphs is a challenging task. Additionally, computational complexity combines knowledge graphs with DL-based models for spatiotemporal forecasting. Furthermore, the real-time processing required for forecasting systems can strain knowledge of graph-based solutions. Despite the challenges, significant benefits exist, and advancements in automated knowledge graph construction, graph-based AI techniques, and scalable cloud systems provide promising solutions. The future of weather forecasting can be improved by creating dynamic real-time knowledge graphs and improving AI-based models to better visualize causal relationships. Additionally, cross-domain integration of knowledge graphs could help optimize disaster management and response strategies [100]. Establishing standards for constructing and sharing weather knowledge graphs is essential to promote collaboration and enhance the accuracy and reliability of weather predictions.
4.5 Large Language Models-Based Forecasting
Since 2022, forecasting models such as GraphCast [15], NowcastNet [101], Pangu [90], MetNet [6,102], Fuxi [103], and Fengwu [104] have emerged from both domestic and international research groups. A summary of several representative large-scale meteorological models is provided in Table 2. ECMWF has upgraded its data-driven AI ensemble prediction system, increasing the resolution from 111 km to 28 km and extending the forecast range to 9.5 days. The Pangu model now provides a resolution of 25 km and a forecast range of up to 9 days. In 2024, the Shanghai Artificial Intelligence Laboratory released the world’s first weather model with a resolution of 9 km, capable of forecasting up to 11.25 days. These advances highlight how AI-powered models drive improvements in spatial resolution and forecast accuracy, pushing towards an integrated weather-climate prediction framework.

As shown in Fig. 12, integrating large-scale datasets with advanced machine learning algorithms has enabled large models to predict various meteorological phenomena with greater precision. These models offer essential scientific insights for disaster warnings, resource allocation, and decision-making processes. Trained on extensive multimodal datasets, they effectively utilize diverse data sources to generate accurate and practical forecasts. Moreover, large models excel in multimodal data fusion, employing techniques to integrate diverse inputs into spatial relationship networks within meteorological systems [106]. This enables them to capture complex inter-regional interactions and dynamic variations. By utilizing these capabilities, large models can analyze complex atmospheric processes, improving the accuracy of short-term weather forecasts and facilitating robust risk assessment for extreme weather events. These models are valuable for predicting climate trends. They provide essential insights to address climate change and optimize resource allocation. This enhances support for modern meteorology.
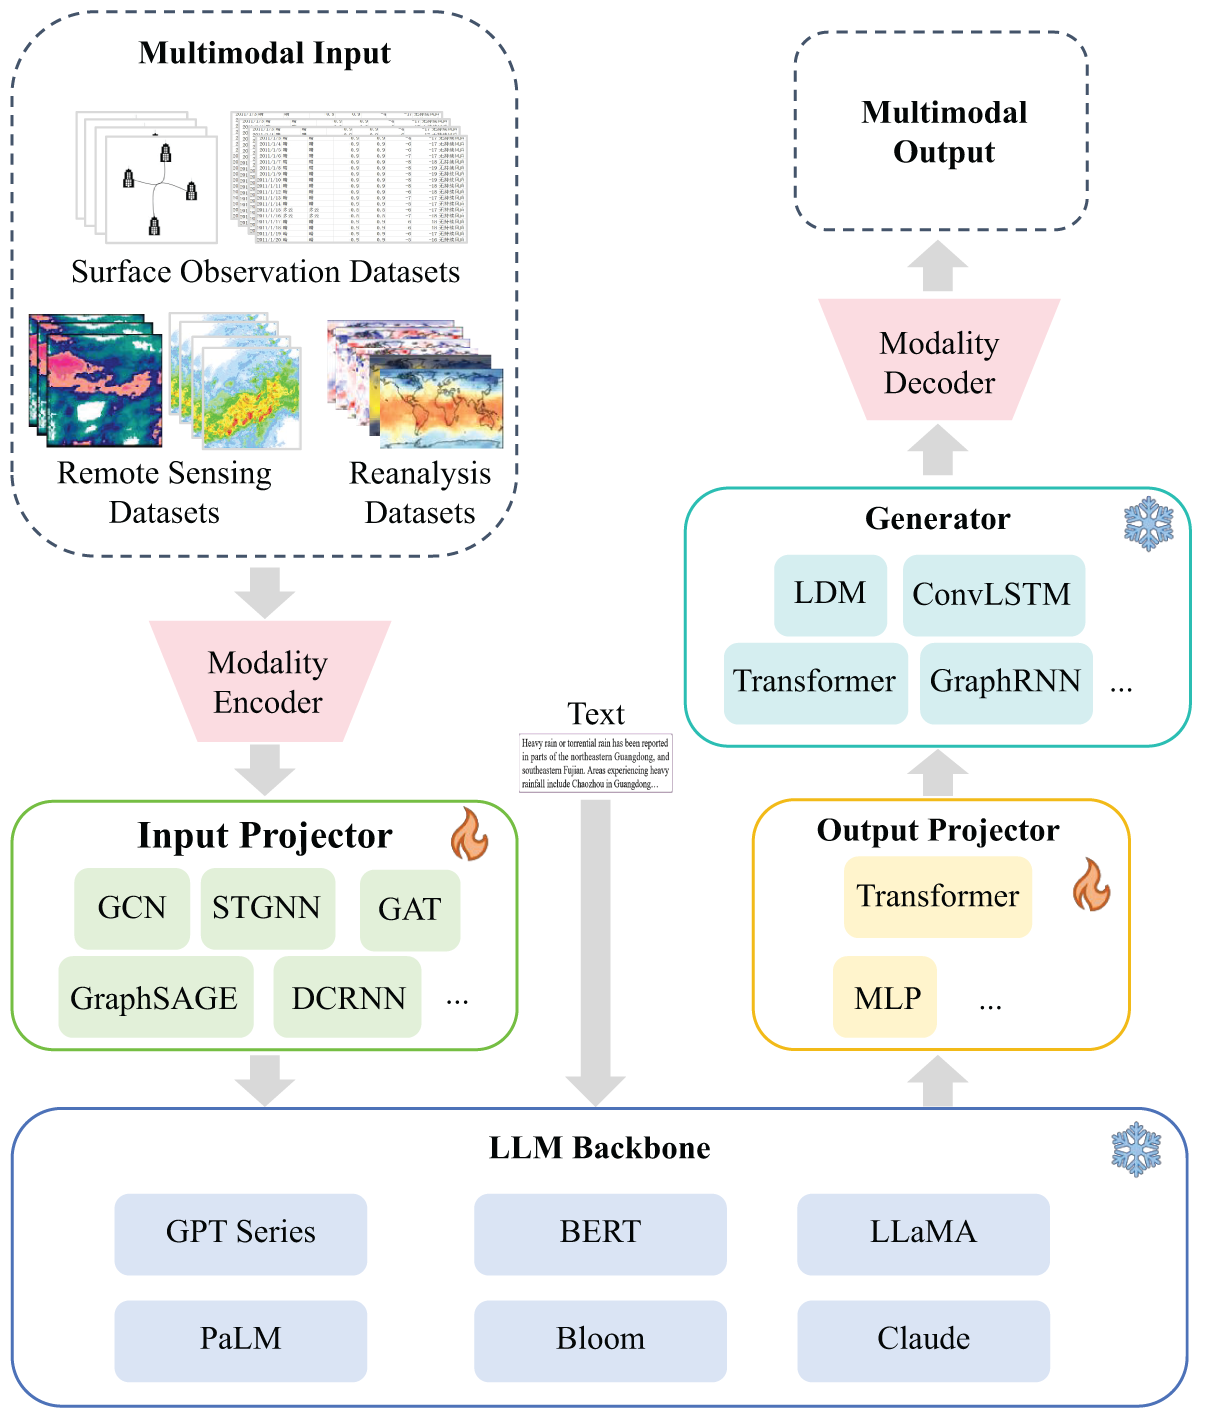
Figure 12: Schematic of weather forecasting based on large language models
Large models have shown great potential in offering unprecedented capabilities in analyzing vast amounts of meteorological data and identifying complex patterns [107]. However, compared to advanced large models in language and image processing, current meteorological models show significant gaps in scale, capability, and application depth. First, existing meteorological models need more computational power and complexity to process large-scale, diverse meteorological data effectively. Meteorological data often exhibit strong cross-modal characteristics, such as images, time series, and text. Models must fully integrate the relationships between these different data types. The limitation hinders thorough exploration and utilization of data, limiting prediction accuracy and applicability. Second, these models show weaknesses in multi-task learning and generalization. This limitation restricts their ability to leverage connections between functions, resulting in task isolation and reduced overall performance. Current meteorological models need to handle complex scenarios and generate innovative predictions effectively. This shortfall limits their practical value and hinders their broader adoption in meteorological science and practice. In summary, current meteorological models need improvement in data utilization, collaboration, and generative intelligence. Future development must focus on leveraging larger-scale cross-modal datasets, adopting more efficient multi-task learning mechanisms, and advancing generative modeling techniques. Improvements are crucial for enhancing prediction accuracy, adaptability, and innovation, thereby providing stronger technological support for modern meteorological science.
In summary, GNNs and advanced network architectures have improved our understanding and prediction of complex meteorological phenomena. These models excel at leveraging the interconnected nature of atmospheric systems. GNN-based methods enhance model interpretability and reliability by integrating physical principles and domain-specific constraints. This makes them more aligned with established meteorological knowledge. Furthermore, incorporating multimodal data from remote sensing, weather stations, and NWP models has expanded our understanding of meteorological systems. This approach also helps address issues related to data sparsity and inconsistencies. These innovations can improve extreme weather prediction, climate modeling, and real-time monitoring. As a result, they will contribute to more resilient meteorological solutions for addressing global environmental challenges.
Despite these advancements, several challenges remain in applying graph-based methods to weather forecasting. One major limitation is the substantial computational resources required for complex graph-based models. This issue becomes more significant as data resolution increases. The challenge also grows as the scale of the data expands. These demands can restrict the real-time applicability of such models, particularly in resource-constrained environments. Additionally, GNNs often struggle with causal reasoning. They also have difficulty providing deeper physical interpretations. This limitation reduces their ability to generalize to extreme or unprecedented weather events. Another critical challenge arises from the dynamic nature of meteorological systems. Many graph-based models are designed for static or semi-dynamic graphs. However, meteorological applications require handling evolving graph structures. In these applications, nodes such as observation points are continuously added, removed, or changed. Edges that represent relationships between variables are also updated over time. Current network architectures struggle to adapt to these structural changes efficiently. This challenge highlights the need for continual learning techniques. These techniques help models evolve without requiring complete retraining.
Addressing these challenges is crucial for improving graph-based meteorological modeling. Future research should develop more computationally efficient architectures. It should also integrate physics-informed learning strategies. Additionally, models need better adaptability to dynamically changing data structures. Additionally, collaboration across different disciplines will be essential for improving these methods. The combined expertise of meteorologists and machine learning researchers will help refine these techniques. Overcoming these challenges will allow graph-based AI approaches to contribute to more accurate and reliable weather forecasting. This improvement will enhance disaster preparedness, ecological monitoring, and emergency response capabilities. It will also help address global environmental challenges.
Acknowledgement: Thanks to the anonymous reviewers and editors for their hard work.
Funding Statement: This work was supported by Key Laboratory of Smart Earth (KF2023ZD03-05), CMA Innovative and Development Program (CXFZ.20231035), National Key R&D Program of China (No. 2021ZD0111902), National Natural Science Foundation of China (Nos. 62472014, U21B2038) and the Scientific and Technological Project of China Meteorological Administration (CMAJBGS202505).
Author Contributions: The authors confirm contribution to the paper as follows: study conception and design: Xiaoni Sun, Yong Zhang; data collection: Jiming Li, Zhiqiang Zhao, Guodong Jing, Baojun Chen, Fei Wang; draft manuscript preparation: Xiaoni Sun, Yong Zhang, Jinrong Hu. All authors reviewed the results and approved the final version of the manuscript.
Availability of Data and Materials: The datasets analyzed during the current study are not publicly available but are available from the corresponding author on reasonable request.
Ethics Approval: Not applicable.
Conflicts of Interest: The authors declare no conflicts of interest to report regarding the present study.
References
1. Trok JT, Barnes EA, Davenport FV, Diffenbaugh NS. Machine learning-based extreme event attribution. Sci Adv. 2024;10(34):eadl3242. doi:10.1126/sciadv.adl3242. [Google Scholar] [PubMed] [CrossRef]
2. Palmer TN. Predicting uncertainty in forecasts of weather and climate. Rep Prog Phys. 2000;63(2):71. doi:10.1088/0034-4885/63/2/201. [Google Scholar] [CrossRef]
3. Das P, Posch A, Barber N, Hicks M, Duffy K, Vandal T, et al. Hybrid physics-AI outperforms numerical weather prediction for extreme precipitation nowcasting. npj Clim Atmosph Sci. 2024;7(1):282. doi:10.1038/s41612-024-00834-8. [Google Scholar] [PubMed] [CrossRef]
4. Mulia IE, Ueda N, Miyoshi T, Iwamoto T, Heidarzadeh M. A novel deep learning approach for typhoon-induced storm surge modeling through efficient emulation of wind and pressure fields. Sci Rep. 2023;13(1):7918. doi:10.1038/s41598-023-35093-9. [Google Scholar] [PubMed] [CrossRef]
5. Espeholt L, Agrawal S, Sønderby C, Kumar M, Heek J, Bromberg C, et al. Deep learning for twelve hour precipitation forecasts. Nat Commun. 2022;13:1–10. doi:10.1038/s41467-022-32483-x. [Google Scholar] [PubMed] [CrossRef]
6. Fathi M, Haghi Kashani M, Jameii SM, Mahdipour E. Big data analytics in weather forecasting: a systematic review. Arch Comput Methods Eng. 2022;29(2):1247–75. doi:10.1007/s11831-021-09616-4. [Google Scholar] [CrossRef]
7. Bauer P, Thorpe A, Brunet G. The quiet revolution of numerical weather prediction. Nature. 2015;525(7567):47–55. doi:10.1038/nature14956. [Google Scholar] [PubMed] [CrossRef]
8. Wang Y, Wu H, Zhang J, Gao Z, Wang J, Yu PS, et al. PredRNN: a recurrent neural network for spatiotemporal predictive learning. IEEE Trans Pattern Anal Mach Intell. 2022;45(2):2208–25. doi:10.1109/TPAMI.2022.3165153. [Google Scholar] [PubMed] [CrossRef]
9. Dewitte S, Cornelis JP, Müller R, Munteanu A. Artificial intelligence revolutionises weather forecast, climate monitoring and decadal prediction. Remote Sens. 2021;13(16):3209. doi:10.3390/rs13163209. [Google Scholar] [CrossRef]
10. Nguyen T, Shah R, Bansal H, Arcomano T, Maulik R, Kotamarthi V, et al. Scaling transformer neural networks for skillful and reliable medium-range weather forecasting. Adv Neural Inform Process Syst. 2024;37:68740–71. [Google Scholar]
11. Kurth T, Subramanian S, Harrington P, Pathak J, Mardani M, Hall D, et al. Fourcastnet: accelerating global high-resolution weather forecasting using adaptive fourier neural operators. In: Proceedings of the Platform for Advanced Scientific Computing Conference (PASC,23); Jun 26–28, 2023; Davos, Switzerland. New York, NY, USA: ACM; 2023. p. 1–11. doi:10.1145/3592979.3593412. [Google Scholar] [CrossRef]
12. Bonev B, Kurth T, Hundt C, Pathak J, Baust M, Kashinath K, et al. Spherical fourier neural operators: learningstable dynamics on the sphere. In: Proceedings of the 40th International Conference on Machine Learning; 2023; Honolulu, HI, USA. p. 2806–23. [Google Scholar]
13. Gao Z, Shi X, Han B, Wang H, Jin X, Maddix D, et al. Prediff: precipitation nowcasting with latent diffusion models. In: Proceedings of the 36th Annual Conference on Neural Information Processing Systems (NeurIPS ‘24); 2024 Dec 10–15; Vancouver, BC, Canada. Cambridge, MA, USA: MIT Press; 2024. Vol. 36. [Google Scholar]
14. Han K, Wang Y, Guo J, Tang Y, Wu E. Vision GNN: an image is worth graph of nodes. Adv Neural Inform Process Syst. 2022;35:8291–303. [Google Scholar]
15. Lam R, Sanchez-Gonzalez A, Willson M, Wirnsberger P, Fortunato M, Alet F, et al. Learning skillful medium-range global weather forecasting. Science. 2023;382(6677):1416–21. doi:10.1126/science.adi2336. [Google Scholar] [PubMed] [CrossRef]
16. Wu B, Chen W, Wang W, Peng B, Sun L, Chen I. WeatherGNN: exploiting meteo-and spatial-dependencies for local numerical weather prediction bias-correction. In: Proceedings of the 33rd International Joint Conference on Artificial Intelligence (IJCAI-24); 2024 Aug 3–9; Jeju Island, Republic of Korea. Menlo Park, CA, USA: International Joint Conferences on Artificial Intelligence Organization; 2024. p. 2433–41. [Google Scholar]
17. Sun X, Zhang Y, Piao X, Wu J, Jing G, Yin B. PN-HGNN: precipitation nowcasting network via hypergraph neural networks. IEEE Trans Geosci Remote Sens. 2024;62(6):1–12. doi:10.1109/TGRS.2024.3407157. [Google Scholar] [CrossRef]
18. Lin H, Gao Z, Xu Y, Wu L, Li L, Li SZ. Conditional local convolution for spatio-temporal meteorological forecasting. Proc AAAI Conf Artif Intell. 2022;36(7):7470–8. doi:10.1609/aaai.v36i7.20711. [Google Scholar] [CrossRef]
19. Nguyen T, Brandstetter J, Kapoor A, Gupta JK, Grover A. ClimaX: a 25 foundation model for weather and climate. In: Proceedings of the 40th International Conference on Machine Learning (ICML ‘23); 2023 Jul 23–29; Liverpool, UK. Chicago, IL, USA; 2023. p. 25904–38. [Google Scholar]
20. Chen Y, Li K, Yeo CK, Li K. Global-local feature learning via dynamic spatial-temporal graph neural network in meteorological prediction. IEEE Trans Knowl Data Eng. 2024;36(11):6280–92. doi:10.1109/TKDE.2024.3397840. [Google Scholar] [CrossRef]
21. Zhang C, Song D, Huang C, Swami A, Chawla NV. Heterogeneous graph neural network. In: Proceedings of the 25th ACM SIGKDD International Conference on Knowledge Discovery & Data Mining (KDD ‘19); 2019 Aug 4–8; Anchorage, AK, USA. New York, NY, USA: Association for Computing Machinery; 2019. p. 793–803. doi:10.1145/3292500.3330961. [Google Scholar] [CrossRef]
22. Varshney Y, Kumar V, Dubey DK, Sharma S. Forecasting precision: the role of graph neural networks and dynamic GNNs in weather prediction. J Big Data Technol Business Analyt. 2024;3(1):28–33. [Google Scholar]
23. Yin X, Lin W, Sun K, Wei C, Chen Y. A2 S2-GNN: rigging GNN-based social status by adversarial attacks in signed social networks. IEEE Trans Inf Forensics Secur. 2022;18:206–20. doi:10.1109/TIFS.2022.3219342. [Google Scholar] [CrossRef]
24. Yasunaga M, Ren H, Bosselut A, Liang P, Leskovec J. QA-GNN: reasoning with language models and knowledge graphs for question answering. In: North American Chapter of the Association for Computational Linguistics (NAACL); 2021 Jun 6–11; Online. doi: 10.18653/v1/2021.naacl-main.45. [Google Scholar] [CrossRef]
25. Rahmani S, Baghbani A, Bouguila N, Patterson Z. Graph neural networks for intelligent transportation systems: a survey. IEEE Trans Intell Transp Syst. 2023;24(8):8846–85. doi:10.1109/TITS.2023.3257759. [Google Scholar] [CrossRef]
26. Scarselli F, Gori M, Tsoi AC, Hagenbuchner M, Monfardini G. The graph neural network model. IEEE Trans Neural Netw. 2008;20(1):61–80. doi:10.1109/TNN.2008.2005605. [Google Scholar] [PubMed] [CrossRef]
27. Zhang S, Tong H, Xu J, Maciejewski R. Graph convolutional networks: a comprehensive review. Comput Soc Netw. 2019;6(1):1–23. doi:10.1186/s40649-019-0069-y. [Google Scholar] [PubMed] [CrossRef]
28. Alqudah M, Dokic T, Kezunovic M, Obradovic Z. Prediction of solar radiation based on spatial and temporal embeddings for solar generation forecast. In: Proceedings of the 53rd Hawaii International Conference on System Sciences (HICSS-53); 2020 Jan 7–10; Maui, HI, USA. Honolulu, HI, USA: University of Hawai‘i at Mānoa; 2020. [Google Scholar]
29. Grover A, Leskovec J. node2vec: scalable feature learning for networks. In: Proceedings of the 22nd ACM SIGKDD International Conference on Knowledge Discovery and Data Mining (KDD ‘16); 2016 Aug 13–17; San Francisco, CA, USA. New York, NY, USA: Association for Computing Machinery; 2016. p. 855–64. doi:10.1145/2939672.2939754. [Google Scholar] [PubMed] [CrossRef]
30. Ye Y, Ji S. Sparse graph attention networks. IEEE Trans Knowl Data Eng. 2021;35(1):905–16. doi:10.1109/TKDE.2021.3072345. [Google Scholar] [CrossRef]
31. European Centre for Medium-Range Weather Forecasts (ECMWF) [Internet]. [cited 2025 Apr 28]. Available from: https://www.ecmwf.int/. [Google Scholar]
32. Global Modeling and Assimilation Office (GMAO). NASA. Modern-era retrospective analysis for research and applications, Version 2 (MERRA-2) [Internet]. [cited 2025 Apr 28]. Available from: https://gmao.gsfc.nasa.gov/reanalysis/MERRA-2/. [Google Scholar]
33. Japan Meteorological Agency (JMA). JRA-55: Japanese 55-year reanalysis [Internet]. [cited 2025 Apr 28]. Available from: https://jra.kishou.go.jp/JRA-55/index_en.html. [Google Scholar]
34. National Centers for Environmental Information (NCEI). Integrated Surface Database (ISD) [Internet]. [cited 2025 Apr 28]. Available from: https://www.ncei.noaa.gov/products/land-based-station/integrated-surface-database. [Google Scholar]
35. Shi X, Gao Z, Lausen L, Wang H, Yeung D, Wong W, et al. Deep learning for precipitation nowcasting: a benchmark and a new model. In: Proceedings of the 30th International Conference on Neural Information Processing Systems (NeurIPS ‘17); 2017 Dec 4–9; Long Beach, CA, USA. Red Hook, NY, USA: Curran Associates, Inc.; 2017. Vol. 30. [Google Scholar]
36. Veillette M, Samsi S, Mattioli C. Sevir: a storm event imagery dataset for deep learning applications in radar and satellite meteorology. Adv Neural Inform Process Syst. 2020;33:22009–19. [Google Scholar]
37. National Centers for Environmental Information (NCEI). Next Generation Weather Radar (NEXRAD) [Internet]. [cited 2025 Apr 28]. Available from: https://www.ncei.noaa.gov/products/radar/next-generation-weather-radar. [Google Scholar]
38. Roberts CD, Senan R, Molteni F, Boussetta S, Mayer M, Keeley SPE. Climate model configurations of the ECMWF Integrated Forecasting System (ECMWF-IFS cycle 43r1) for HighResMIP. Geoscient Model Develop. 2018;11(9):3681–712. doi:10.5194/gmd-11-3681-2018. [Google Scholar] [CrossRef]
39. Lang S, Alexe M, Chantry M, Dramsch J, Pinault F, Raoult B, et al. AIFS-ECMWF’s data-driven forecasting system. arXiv:2406.01465. 2024. [Google Scholar]
40. Yuan Z, Wei N. Coupling a new version of the common land model (CoLM) to the global/regional assimilation and prediction system (GRAPESimplementation, experiment, and preliminary evaluation. Land. 2022;11(6):770. doi:10.3390/land11060770. [Google Scholar] [CrossRef]
41. Mikkola J, Sinclair VA, Bister M, Bianchi F. Daytime along-valley winds in the Himalayas as simulated by the Weather Research and Forecasting (WRF) model. Atmosph Chem Phy. 2023;23(2):821–42. doi:10.5194/acp-23-821-2023. [Google Scholar] [CrossRef]
42. Kiefer MT, Heilman WE, Zhong S, Charney JJ, Bian X, Skowronski NS, et al. Representing low-intensity fire sensible heat output in a mesoscale atmospheric model with a canopy submodel: a case study with ARPS-CANOPY (version 5.2.12). Geoscient Model Develop. 2022;15(4):1713–34. doi:10.5194/gmd-15-1713-2022. [Google Scholar] [CrossRef]
43. European centre for medium-range weather forecasts (ECMWF“Confluence,” ECMWF [Internet]. [cited 2025 Apr 28]. Available from: https://confluence.ecmwf.int. [Google Scholar]
44. National Centers for Environmental Information (NCEI). International Best Track Archive, NCEI [Internet]. [cited 2025 Apr 28]. Available from: https://www.ncei.noaa.gov/products/international-best-track-archive. [Google Scholar]
45. Copernicus Climate Data Store (CDS). Copernicus climate data store, copernicus [Internet]. [cited 2025 Apr 28]. Available from: https://cds.climate.copernicus.eu/. [Google Scholar]
46. NOAA Physical Sciences Laboratory. Gridded Data, NOAA physical sciences laboratory [Internet]. [cited 2025 Apr 28]. Available from: https://psl.noaa.gov/data/gridded/index.html. [Google Scholar]
47. Ebita A, Kobayashi S, Ota Y, Moriya M, Kumabe R, Onogi K, et al. The Japanese 55-year reanalysis “JRA-55”: an interim report. Sola. 2011;7:149–52. doi:10.2151/sola.2011-038. [Google Scholar] [CrossRef]
48. Global Modeling and Assimilation Office (GMAO). MERRA-2 Data Access, NASA GMAO [Internet]. [cited 2025 Apr 28]. Available from: https://gmao.gsfc.nasa.gov/reanalysis/MERRA-2/data. [Google Scholar]
49. Keisler R. Forecasting global weather with graph neural networks. arXiv:2202.07575. 2022. [Google Scholar]
50. Peng X, Li Q, Chen L, Ning X, Chu H, Liu J. A structured graph neural network for improving the numerical weather prediction of rainfall. J Geophys Res Atmosph. 2023;128(22):e2023JD039011. doi:10.1029/2023JD039011. [Google Scholar] [CrossRef]
51. Perkins-Kirkpatrick SE, Lewis SC. Increasing trends in regional heatwaves. Nat Commun. 2020;11(1):3357. doi:10.1038/s41467-020-16970-7. [Google Scholar] [PubMed] [CrossRef]
52. Jeon HJ, Kang JH, Kwon IH, Lee OJ. CloudNine: analyzing meteorological observation impact on weather prediction using explainable graph neural networks. arXiv:2402.14861. 2024. [Google Scholar]
53. Feik M, Lerch S, Stühmer J. Graph neural networks and spatial information learning for post-processing ensemble weather forecasts. arXiv:2407.11050. 2024. [Google Scholar]
54. Demaeyer J, Bhend J, Lerch S, Primo C, Van Schaeybroeck B, Atencia A, et al. The EUPPBench postprocessing benchmark dataset v1.0. Earth Syst Sci Data. 2023;15(6):2635–53. doi:10.5194/essd-15-2635-2023. [Google Scholar] [CrossRef]
55. Ejurothu PSS, Mandal S, Thakur M. Forecasting PM2. 5 concentration in India using a cluster based hybrid graph neural network approach. Asia Pac J Atmos Sci. 2022;59(5):545–61. doi:10.1007/s13143-022-00291-4. [Google Scholar] [CrossRef]
56. Jeon HJ, Kang J, Kwon IH, Lee OJ. Observation impact explanation in atmospheric state estimation using hierarchical message-passing graph neural networks. Mach Learn Sci Technol. 2024;5(4):045036. doi:10.1088/2632-2153/ad8981. [Google Scholar] [CrossRef]
57. Alexe M, Boucher E, Lean P, Pinnington E, Laloyaux P, McNally A, et al. GraphDOP: towards skilful data-driven medium-range weather forecasts learnt and initialised directly from observations. arXiv:2412.15687. 2024. [Google Scholar]
58. National Centers for Environmental Information (NCEI). Global historical climatology network daily, NCEI [Internet]. [cited 2025 Apr 28]. Available from: https://www.ncei.noaa.gov/products/land-based-station/global-historical-climatology-network-daily. [Google Scholar]
59. Li PW, Wong WK, Cheung P, Yeung HY. An overview of nowcasting development, applications, and services in the Hong Kong Observatory. J Meteorol Res. 2014;28(5):859–76. doi:10.1007/s13351-014-4048-9. [Google Scholar] [CrossRef]
60. Liu JNK, Hu Y, You JJ, Chan PW. Deep neural network based feature representation for weather forecasting. In: 2014 International Conference on Artificial Intelligence; 2014; Las Vegas, NV, USA. p. 105–10. [Google Scholar]
61. Corbus D, King J, Mousseau T, Zavadil R, Heath B, Hecker L, et al. Eastern wind integration and transmission study. In: 8th International Workshop on Large Scale Integration of Wind Power and on Transmission Networks for Offshore Wind Farms; 2009; Bremen, Germany. [Google Scholar]
62. Lira H, Martí L, Sanchez-Pi N. A graph neural network with spatio-temporal attention for multi-sources time series data: an application to frost forecast. Sensors. 2022;22(4):1486. doi:10.3390/s22041486. [Google Scholar] [PubMed] [CrossRef]
63. Li P, Yu Y, Huang D, Wang ZH, Sharma A. Regional heatwave prediction using graph neural network and weather station data. Geophys Res Lett. 2023;50(7):e2023GL103405. doi:10.1029/2023GL103405. [Google Scholar] [CrossRef]
64. Davidson M, Moodley D. ST-GNNs for weather prediction in South Africa. In: Southern African Conference for Artificial Intelligence Research; 2022; Cham, Switzerland: Springer Nature Switzerland. p. 93–107. doi:10.1007/978-3-031-22321-1_7. [Google Scholar] [CrossRef]
65. Wang S, Li Y, Zhang J, Meng Q, Meng L, Gao F. PM2.5-GNN: a domain knowledge enhanced graph neural network for PM2.5 forecasting. In: Proceedings of the 28th International Conference on Advances in Geographic Information Systems (SIGSPATIAL ’20); 2020; Seattle, WA, USA. p. 163–6. doi:10.1145/3397536.3422208. [Google Scholar] [CrossRef]
66. Liu H, Han Q, Sun H, Sheng J, Yang Z. Spatiotemporal adaptive attention graph convolution network for city-level air quality prediction. Sci Rep. 2023;13:13335. doi:10.1038/s41598-023-39286-0. [Google Scholar] [PubMed] [CrossRef]
67. Wu Q, Zheng H, Guo X, Liu G. Promoting wind energy for sustainable development by precise wind speed prediction based on graph neural networks. Renew Energy. 2022;199(15):977–92. doi:10.1016/j.renene.2022.09.036. [Google Scholar] [CrossRef]
68. Aykas D, Mehrkanoon S. Multistream graph attention networks for wind speed forecasting. In: Proceedings of the 2021 IEEE Symposium Series on Computational Intelligence (SSCI); 2021; Orlando, FL, USA. p. 1–8. doi:10.1109/SSCI50451.2021.9660040. [Google Scholar] [CrossRef]
69. Khodayar M, Wang J. Spatio-temporal graph deep neural network for short-term wind speed forecasting. IEEE Trans Sustain Energy. 2018;10(2):670–81. doi:10.1109/TSTE.2018.2844102. [Google Scholar] [CrossRef]
70. Ma M, Xie P, Teng F, Wang B, Ji S, Zhang J, et al. HiSTGNN: hierarchical spatio-temporal graph neural network for weather forecasting. Inf Sci. 2023;648(5746):119580. doi:10.1016/j.ins.2023.119580. [Google Scholar] [CrossRef]
71. Wilson T, Tan PN, Luo L. A low rank weighted graph convolutional approach to weather prediction. In: Proceedings on 2018 IEEE International Conference on Data Mining (ICDM); 2018; Singapore. p. 627–36. doi:10.1109/ICDM.2018.00078. [Google Scholar] [CrossRef]
72. National Centers for Environmental Information (NCEI). Integrated global radiosonde archive, NCEI [Internet]. [cited 2025 Apr 28]. Available from: https://www.ncei.noaa.gov/products/weather-balloon/integrated-global-radiosonde-archive. [Google Scholar]
73. National Oceanic and Atmospheric Administration (NOAA). Global surface summary of the day (GSODNOAA [Internet]. [cited 2025 Apr 28]. Available from: https://www.ncei.noaa.gov/access/metadata/landing-page/bin/iso?id=gov.noaa.ncdc:C00516. [Google Scholar]
74. Seol Y, Kim S, Jung M, Hong Y. A novel physics-aware graph network using high-order numerical methods in weather forecasting model. Knowl Based Syst. 2024;300(1):112158. doi:10.1016/j.knosys.2024.112158. [Google Scholar] [CrossRef]
75. Xu Z, Wei X, Hao J, Han J, Li H, Liu C, et al. DGFormer: a physics-guided station level weather forecasting model with dynamic spatial-temporal graph neural network. GeoInformatica. 2024;28(3):499–533. doi:10.1007/s10707-024-00511-1. [Google Scholar] [CrossRef]
76. Rasp S, Dueben PD, Scher S, Weyn JA, Mouatadid S, Thuerey N. WeatherBench: a benchmark data set for data-driven weather forecasting. J Adv Model Earth Syst. 2020;12(11):2672. doi:10.1029/2020MS002203. [Google Scholar] [CrossRef]
77. Ni Q, Wang Y, Fang Y. GE-STDGN: a novel spatio-temporal weather prediction model based on graph evolution. Appl Intell. 2022;52(7):7638–52. doi:10.1007/s10489-021-02824-2. [Google Scholar] [CrossRef]
78. Chen Q, Ding R, Mo X, Li H, Xie L, Yang J. An adaptive adjacency matrix-based graph convolutional recurrent network for air quality prediction. Sci Rep. 2024;14(1):4408. doi:10.1038/s41598-024-55060-2. [Google Scholar] [PubMed] [CrossRef]
79. Bhandari HC, Pandeya YR, Jha K. Innovating graph representation for dynamic weather forecasting. Ann Pure Appl Math. 2024;29(2):119–32. doi:10.22457/apam.v29n2a04938. [Google Scholar] [CrossRef]
80. Miao Z, Zhang Y, Wu J, Jing G, Piao X, Yin B. Multi-information aggregation and estrangement HyperGraph convolutional networks for spatio-temporal weather forecasting. IEEE Trans Geosci Remote Sens. 2024;62(3):1–13. doi:10.1109/TGRS.2024.3486684. [Google Scholar] [CrossRef]
81. Chen L, Xu J, Wu B, Huang J. Group-aware graph neural network for nationwide city air quality forecasting. ACM Trans Knowl Discov Data. 2023;18(3):1–20. doi:10.1145/3631713. [Google Scholar] [CrossRef]
82. Han J, Liu H, Zhu H, Xiong H, Dou D. Joint air quality and weather prediction based on multi-adversarial spatiotemporal networks. Proc AAAI Conf Artif Intellig. 2021;35(5):4081–9. doi:10.1609/aaai.v35i5.16529. [Google Scholar] [CrossRef]
83. Bién Data. KDD 2018 competition data, Bién data [Internet]. [cited 2025 Apr 28]. Available from: https://www.biendata.xyz/competition/kdd_2018/. [Google Scholar]
84. China National Environmental Monitoring Center (CNEMC). CNEMC-China National Environmental Monitoring Center, CNEMC [Internet]. [cited 2025 Apr 28]. Available from: http://www.cnemc.cn/en/. [Google Scholar]
85. Chen L, Cao Y, Ma L, Zhang J. A deep learning-based methodology for precipitation nowcasting with radar. Earth Space Sci. 2020;7(2):e2019EA000812. doi:10.1029/2019EA000812. [Google Scholar] [CrossRef]
86. Peng X, Li Q, Jing J. CNGAT: a graph neural network model for radar quantitative precipitation estimation. IEEE Trans Geosci Remote Sens. 2021;60(4):1–14. doi:10.1109/TGRS.2021.3120218. [Google Scholar] [CrossRef]
87. Ferchichi A, Chihaoui M, Ferchichi A. Spatio-temporal modeling of climate change impacts on drought forecast using Generative Adversarial Network: a case study in Africa. Expert Syst Appl. 2024;238(11):122211. doi:10.1016/j.eswa.2023.122211. [Google Scholar] [CrossRef]
88. Price I, Sanchez-Gonzalez A, Alet F, Andersson TR, El-Kadi A, Masters D, et al. Probabilistic weather forecasting with machine learning. Nature. 2025;637:84–90. doi:10.1038/s41586-024-08252-9. [Google Scholar] [PubMed] [CrossRef]
89. Bi K, Xie L, Zhang H, Chen X, Gu X, Tian Q. Accurate medium-range global weather forecasting with 3D neural networks. Nature. 2023;619(7970):533–8. doi:10.1038/s41586-023-06185-3. [Google Scholar] [PubMed] [CrossRef]
90. Wang X, Jiang H. Physics-guided deep learning for skillful wind-wave modeling. Sci Adv. 2024;10(49):eadr3559. doi:10.1126/sciadv.adr3559. [Google Scholar] [PubMed] [CrossRef]
91. Kochkov D, Yuval J, Langmore I, Norgaard P, Smith J, Mooers G, et al. Neural general circulation models for weather and climate. Nature. 2024;632(8027):1060–6. doi:10.1038/s41586-024-07744-y. [Google Scholar] [PubMed] [CrossRef]
92. Chen Y, Ding F, Zhai L. Multi-scale temporal features extraction based graph convolutional network with attention for multivariate time series prediction. Expert Syst Appl. 2022;200(1):117011. doi:10.1016/j.eswa.2022.117011. [Google Scholar] [CrossRef]
93. Huang Q, Yamada M, Tian Y, Singh D, Chang Y. Graphlime: local interpretable model explanations for graph neural networks. IEEE Trans Knowl Data Eng. 2022;35(7):6968–72. doi:10.1109/TKDE.2022.3187455. [Google Scholar] [CrossRef]
94. Zhang X, Jin Q, Yu T, Xiang S, Kuang Q, Prinet V, et al. Multi-modal spatio-temporal meteorological forecasting with deep neural network. ISPRS J Photogramm Remote Sens. 2022;188:380–93. doi:10.1016/j.isprsjprs.2022.03.007. [Google Scholar] [CrossRef]
95. Ektefaie Y, Dasoulas G, Noori A, Farhat M, Zitnik M. Multimodal learning with graphs. Nature Mach Intellig. 2023;5(4):340–50. doi:10.1038/s42256-023-00624-6. [Google Scholar] [PubMed] [CrossRef]
96. Wang X, Bo D, Shi C, Fan S, Ye Y, Yu PS. A survey on heterogeneous graph embedding: methods, techniques, applications and sources. IEEE Trans Big Data. 2022;9(2):415–36. doi:10.1109/TBDATA.2022.3177455. [Google Scholar] [CrossRef]
97. Wang Q, Mao Z, Wang B, Guo L. Knowledge graph embedding: a survey of approaches and applications. IEEE Trans Knowl Data Eng. 2017;29(12):2724–43. doi:10.1109/TKDE.2017.2754499. [Google Scholar] [CrossRef]
98. Wu Z, Pan S, Chen F, Long G, Zhang C, Yu PS. A comprehensive survey on graph neural networks. IEEE Trans Neural Netw Learn Syst. 2020;32(1):4–24. doi:10.1109/TNNLS.2020.2978386. [Google Scholar] [PubMed] [CrossRef]
99. Peng C, Xia F, Naseriparsa M, Osborne F. Knowledge graphs: opportunities and challenges. Artif Intell Rev. 2023;56(11):13071–102. doi:10.1007/s10462-023-10465-9. [Google Scholar] [PubMed] [CrossRef]
100. Janowicz K, Hitzler P, Li W, Rehberger D, Schildhauer M, Zhu R, et al. Know, know where, KnowWhereGraph: a densely connected, cross-domain knowledge graph and geo-enrichment service stack for applications in environmental intelligence. AI Magazine. 2022;43(1):30–9. doi:10.1002/aaai.12043. [Google Scholar] [CrossRef]
101. Zhang Y, Long M, Chen K, Xing L, Jin R, Jordan MI, et al. Skilful nowcasting of extreme precipitation with NowcastNet. Nature. 2023;619(7970):526–32. doi:10.1038/s41586-023-06184-4. [Google Scholar] [PubMed] [CrossRef]
102. Sønderby C, Espeholt L, Heek J, Dehghani M, Oliver A, Salimans T, et al. MetNet—a neural weather model for precipitation forecasting. arXiv:2003.12140. 2021. [Google Scholar]
103. Chen L, Zhong X, Zhang F, Cheng Y, Xu Y, Qi Y, et al. FuXi: a cascade machine learning forecasting system for 15-day global weather forecast. npj Clim Atmosph Sci. 2023;6(1):190. doi:10.1038/s41612-023-00512-1. [Google Scholar] [CrossRef]
104. Chen K, Han T, Gong J, Bai L, Ling F, Luo JJ, et al. Fengwu: pushing the skillful global medium-range weather forecast beyond 10 days lead. arXiv:2304.02948. 2023. [Google Scholar]
105. Zhang J, Howard K, Langston C, Kaney B, Qi Y, Tang L, et al. Multi-Radar Multi-Sensor (MRMS) quantitative precipitation estimation: initial operating capabilities. Bull Am Meteorol Soc. 2016;97(4):621–38. doi:10.1175/BAMS-D-14-00174.1. [Google Scholar] [CrossRef]
106. Zou X, Yan Y, Hao X, Hu Y, Wen H, Liu E, et al. Deep learning for cross-domain data fusion in urban computing: taxonomy, advances, and outlook. Inf Fusion. 2025;113(1):102606. doi:10.1016/j.inffus.2024.102606. [Google Scholar] [CrossRef]
107. Hadid A, Chakraborty T, Busby D. When geoscience meets generative AI and large language models: foundations, trends, and future challenges. Expert Syst. 2024;41(10):e13654. doi:10.1111/exsy.13654. [Google Scholar] [CrossRef]
Cite This Article
 Copyright © 2025 The Author(s). Published by Tech Science Press.
This work is licensed under a Creative Commons Attribution 4.0 International License , which permits unrestricted use, distribution, and reproduction in any medium, provided the original work is properly cited.
 Downloads
 Citation Tools