
 Submit a Paper
 Propose a Special lssue
 Open Access
ARTICLE
Research on Crop Image Classification and Recognition Based on Improved HRNet
School of Intelligent Manufacturing and Control Engineering, Shanghai Polytechnic University, Shanghai, 201209, China
* Corresponding Author: Min Ji. Email:
Computers, Materials & Continua 2025, 84(2), 3075-3103. https://doi.org/10.32604/cmc.2025.064166
Received 07 February 2025; Accepted 09 May 2025; Issue published 03 July 2025
 View Full Text
 Download PDF
Abstract
In agricultural production, crop images are commonly used for the classification and identification of various crops. However, several challenges arise, including low image clarity, elevated noise levels, low accuracy, and poor robustness of existing classification models. To address these issues, this research proposes an innovative crop image classification model named Lap-FEHRNet, which integrates a Laplacian Pyramid Super Resolution Network (LapSRN) with a feature enhancement high-resolution network based on attention mechanisms (FEHRNet). To mitigate noise interference, this research incorporates the LapSRN network, which utilizes a Laplacian pyramid structure to extract multi-level feature details from low-resolution images through a systematic layer-by-layer amplification and pixel detail superposition process. This gradual reconstruction enhances the high-frequency information of the image, enabling super-resolution reconstruction of low-quality images. To obtain a broader range of comprehensive and diverse features, this research employs the FEHRNet model for both deep and shallow feature extraction. This approach results in features that encapsulate multi-scale information and integrate both deep and shallow insights. To effectively fuse these complementary features, this research introduces an attention mechanism during the feature enhancement stage. This mechanism highlights important regions within the image, assigning greater weights to salient features and resulting in a more comprehensive and effective image feature representation. Consequently, the accuracy of image classification is significantly improved. Experimental results demonstrate that the Lap-FEHRNet model achieves impressive classification accuracies of 98.8% on the crop classification dataset and 98.57% on the rice leaf disease dataset, underscoring the model’s outstanding accuracy, robustness, and generalization capability.Keywords
Crops are the primary foundation of agricultural production activities [1]. By the end of 2024, China’s total crop output had reached 1.413 trillion pounds, exceeding 1.4 trillion pounds for the first time. The scale of cultivation of a variety of high-value-added cash crops has continued to expand, showing a clear trend of transformation towards high efficiency, greenness, and sustainability. Crop monitoring is a crucial area of research, facilitating effective crop management, including planting, irrigation, and yield estimation [2]. Accurate identification of crop species serves as the foundation for agricultural supervision and management [3], as determining crop species plays a vital role in subsequent crop breeding work [4]. For instance, during pesticide application and disease control, different crops require distinct chemicals and dosages. Accurately identifying crop categories ensures greater precision and timeliness in cultivation, underscoring the substantial agricultural value and practical benefits of precise crop classification.
Recognition studies for crops are usually performed using images for classification. However, when classifying and recognizing crop images, crop image characteristics need to be taken into account. Since crop image acquisition often takes place in open fields under various light and climatic conditions, it may be disrupted by other objects, pests, or limitations in acquisition equipment. Consequently, these factors contribute to small target features, high image noise, and complex background interference. Hence, crop images tend to be characterized by small target features, high image noise, and complex background interference, whereas in general object recognition, such as plant recognition based on accurate flower and leaf images, the image quality is relatively high and the target features are relatively clear [5]. Therefore, crop image classification often needs to be combined with advanced machine learning models to ensure high accuracy under complex conditions. In recent years, with the advent of deep learning technology, several studies have proposed deep learning fine-grained classification methods suitable for complex scenarios. Wang et al. [6] developed a deep learning framework for crop object classification and fine-grained cognition, which effectively solves the problem of insufficient target recognition accuracy in complex environments. This provides a valuable reference point for the present study.
In the past, traditional crop identification and classification methods came mainly from the biology field. The identification of plants was previously reliant on the experience and knowledge of agricultural experts, who would observe the local characteristics of the plant, including its roots, stems, and leaves, as well as its global factors, such as the environment in which it grew and the structure in which it was planted [7]. However, this process is time-consuming and costly in terms of labour, and the experts have a high level of knowledge and practical experience. Furthermore, the accuracy of manual crop identification can be affected by the complex and different growth environments of crops.
The advent of computer technology has led to the widespread adoption of machine learning methods in the field of crop classification. Early machine learning methods relied heavily on manually extracting image features, such as color histograms [8], and then feeding the extracted features into a classifier (e.g., Support Vector Machine SVM [9], Random Forest RF [10]) for crop classification. Fabiyi et al. [11] employed Linear Discriminant Analysis (LDA) to reduce the dimensionality and extract features from hyperspectral images of rice seeds. Then, a random forest classifier is utilized for classification. The results demonstrated that the classification accuracy of this method can reach 85.94%. Xie et al. [12] extracted multiple features from insect images by using techniques such as coloured histograms, histograms of oriented gradients (HOG), and scale-invariant feature transform (SIFT). These features were then processed using sparse coding, resulting in the generation of corresponding sparse coding histograms. Subsequently, the feature vectors were input into a Support Vector Machine (SVM) for classification, resulting in a significantly higher classification accuracy than other methods. In a separate study, Munisami et al. [13] collected leaves from 32 different plants and extracted features from both shape and color. The k-Nearest Neighbors (kNN) algorithm was used for classification, and it was able to maintain a high level of accuracy even when the number of species was increased. These researchers employ image analysis to extract features such as colour, texture, and shape from crop images. Subsequently, the image data is converted into quantifiable feature vectors, which are then entered into a machine-learning classifier for classification. These methods primarily depend on the accurate extraction and analysis of image features, enabling the classification of crops to a certain extent. However, these traditional methods often require a considerable amount of human input and a complex parameter optimization process. Additionally, the classification effects are susceptible to environmental influences.
In recent years, deep learning, as an advanced paradigm of machine learning, has demonstrated significant advantages in the field of crop image classification. In contrast to traditional machine learning, which relies on manually designed features, deep learning models such as convolutional neural networks (CNNs) can learn features from images independently [14]. Tao et al. [15] employed the Visual Geometry Group (VGG) model to extract features from rapeseed and four types of weeds, resulting in an average classification accuracy of 92.1%. Coulibaly et al. [16] fine-tuned the Google Inception Net (GoogleNet) network to classify crop pests by extracting relevant weights from the pre-trained ImageNet dataset, achieving an accuracy improvement of 6.22% compared to the latest method. Hema et al. [17] used RES34 to classify a dataset containing 14 plants and 38 diseases from approximately 150,000 leaf images, with an experimental accuracy of 97.77%. Elfatimi et al. [18] were able to achieve the automatic distinction of bean leaf diseases with Mobile Network (MobileNet), which can learn the corresponding features present within bean leaf images autonomously.
Although deep learning-based models are capable of automatically extracting deep semantic features from crop images by stacking convolutional layers with cascading downsampling and channel expansion operations, related studies have shown that there are significant limitations in this feature extraction paradigm: the successive spatial compression and channel expansion processes may introduce redundant channel responses and irrelevant spatial features. Therefore, appropriate attention modules need to be introduced to suppress irrelevant features and enhance relevant ones. For example, Stephen et al. [19] improved the Residual Neural Network-18 layer (RESNet-18) and Residual Neural Network-34 layers (RESNet-34) with a self-attention module, thereby enhancing the feature extraction process and elevating the accuracy of rice leaf disease recognition and classification. Zhang et al. [20] devised a dual pooling channel attention module (DPCA) that integrates two pooling operations (global max pooling and global average pooling) to establish a correlation between global and local information, thereby filtering discriminative features effectively. Zuo et al. [21] devised a multi-granularity feature aggregation module (MFA), comprising two sub-modules, the Pixel-level Feature Self-Attention module (P-FSA) and the Block-level Feature Self-Attention module (B-FSA). The aforementioned attention modules are divided into blocks according to the input feature map. The distinction lies in the granularity of the processing. The P-FSA operates on smaller blocks with finer granularity than the B-FSA, thereby capturing the relationships between pixels within the blocks and identifying fine features in the image. In contrast, the B-FSA processes larger blocks with coarser granularity. These blocks represent larger regions within the feature map and are employed to capture long-distance dependencies between different blocks, thereby facilitating the identification of global information within the image. The employment of two self-attention mechanisms enables the final features to encompass both local pixel-level information and global block-level information, thereby rendering the model more suitable for fine-grained crop disease classification tasks and more suitable for practical application in complex agricultural scenarios. Bi et al. [22] introduced the Convolutional Block Attention Module (CBAM), which enhances the key features of rice leaf disease images by weighting the two dimensions of channel and spatial, resulting in a final classification accuracy of 98.73%. The aforementioned studies demonstrate that by employing an attention module, the key features pertinent to classification can be enhanced, while irrelevant features can be effectively suppressed so that the classification accuracy and generalization performance of the model can be improved.
It should be noted, however, that the images utilized in the aforementioned research are all of high resolution and quality. Due to external factors such as equipment limitations, the images used for recognition are occasionally of a lower resolution than desired. Images of low resolution tend to blur details and introduce noise, which makes the features of the crop less obvious and more difficult to extract and distinguish. While the deployment of attention mechanisms can mitigate the influence of irrelevant pixels to a degree, an excess of image noise can still affect the accuracy of judgments and predictions. Consequently, low-resolution images must be upsampled to mitigate the adverse effects of noise on image quality. Sathya et al. [23] enhanced the efficiency in image classification by incorporating a super-resolution layer to reconstruct low-resolution rice plant disease images into super-resolution images. Zhou et al. [24] employed the Residual Dense Network (RDN) for super-resolution reconstruction and denoising of tomato leaf disease images, achieving an average recognition accuracy of 95%. In a related study, Maqsood et al. [25] introduced the SRGAN network for the classification of wheat stripe rust. This was achieved by using generative adversarial networks to generate high-resolution images, resulting in an 8% improvement in classification accuracy compared to low-resolution images. Although the above-mentioned crop image classification models have achieved certain results, they all extract global features and fail to effectively integrate feature information at different levels. Existing improvement schemes generally ignore the in-depth mining of the correlation between shallow and deep features. This state of separation between hierarchical features severely restricts the model’s ability to distinguish similar crops. At the same time, these studies have all used high-definition reconstruction networks, but the single-stage reconstruction mechanism has obvious defects and is prone to distortions such as blurry artifacts. Moreover, the increase in the number of network layers and the use of larger convolutional kernels have led to a significant increase in network computing, which may lead to problems such as longer training times. The specific research and analysis are shown in Table 1.

To address the classification issue with low-definition crop images in complex backgrounds, a novel approach is proposed. This involves the fusion of the Laplacian Pyramid Super-Resolution Network (LapSRN) and a feature enhancement high-resolution network based on attention mechanisms (FEHRNet) to create a crop image classification model. The primary contributions of this paper are as follows:
1. A LapSRN network is constructed to clarify and denoising the crop images. The objective of the network is to achieve high-quality image amplification by gradually restoring high-frequency details in the image, thereby enhancing the model’s resilience to interference from complex backgrounds and irrelevant pixels.
2. An FEHRNet model is constructed to perform feature extraction and image classification on the aforementioned reconstructed images. FEHRNet model integrates deep and shallow features through parallel multi-resolution branches and inter-branch feature exchange, enabling the model to extract a diverse range of features and preserve the image’s complete information. This approach prevents minor defective features from being obscured by the accumulation of network layers, thereby enhancing the model’s generalization capacity.
3. The enhancement of features was achieved through the implementation of modules designed for this purpose. A spatial attention module is incorporated into shallow features to accentuate significant spatial locations while simultaneously diminishing the relevance of other locations. Following the integration process, both the deep and shallow features undergo a fusion, which is then followed by the implementation of a channel attention mechanism. This mechanism enables the network to autonomously prioritize information features. The two attention mechanisms serve to enhance the network’s capacity for feature extraction at disparate levels, thereby improving the model’s capacity for discrimination and achieving more accurate image classification. Consequently, this model effectively addresses the issues of complex backgrounds, low overall resolution, and noise in crop images, thereby enhancing the robustness and accuracy of the model.
The remainder of this paper is organized as follows. Section 2 introduces the theoretical framework of the model and explains each module. Section 3 describes the overall architecture of the Lap-FEHRNet model proposed in this paper. Section 4 verifies the effectiveness and generalization ability of the model through model ablation experiments, comparison experiments, and generalization experiments. Section 5 provides discussions and conclusions of the research.
The Laplace pyramid super-resolution network (LapSRN) is a deep learning method that can reconstruct low-resolution images into high-resolution images [26]. The specific framework structure is illustrated in Fig. 1.
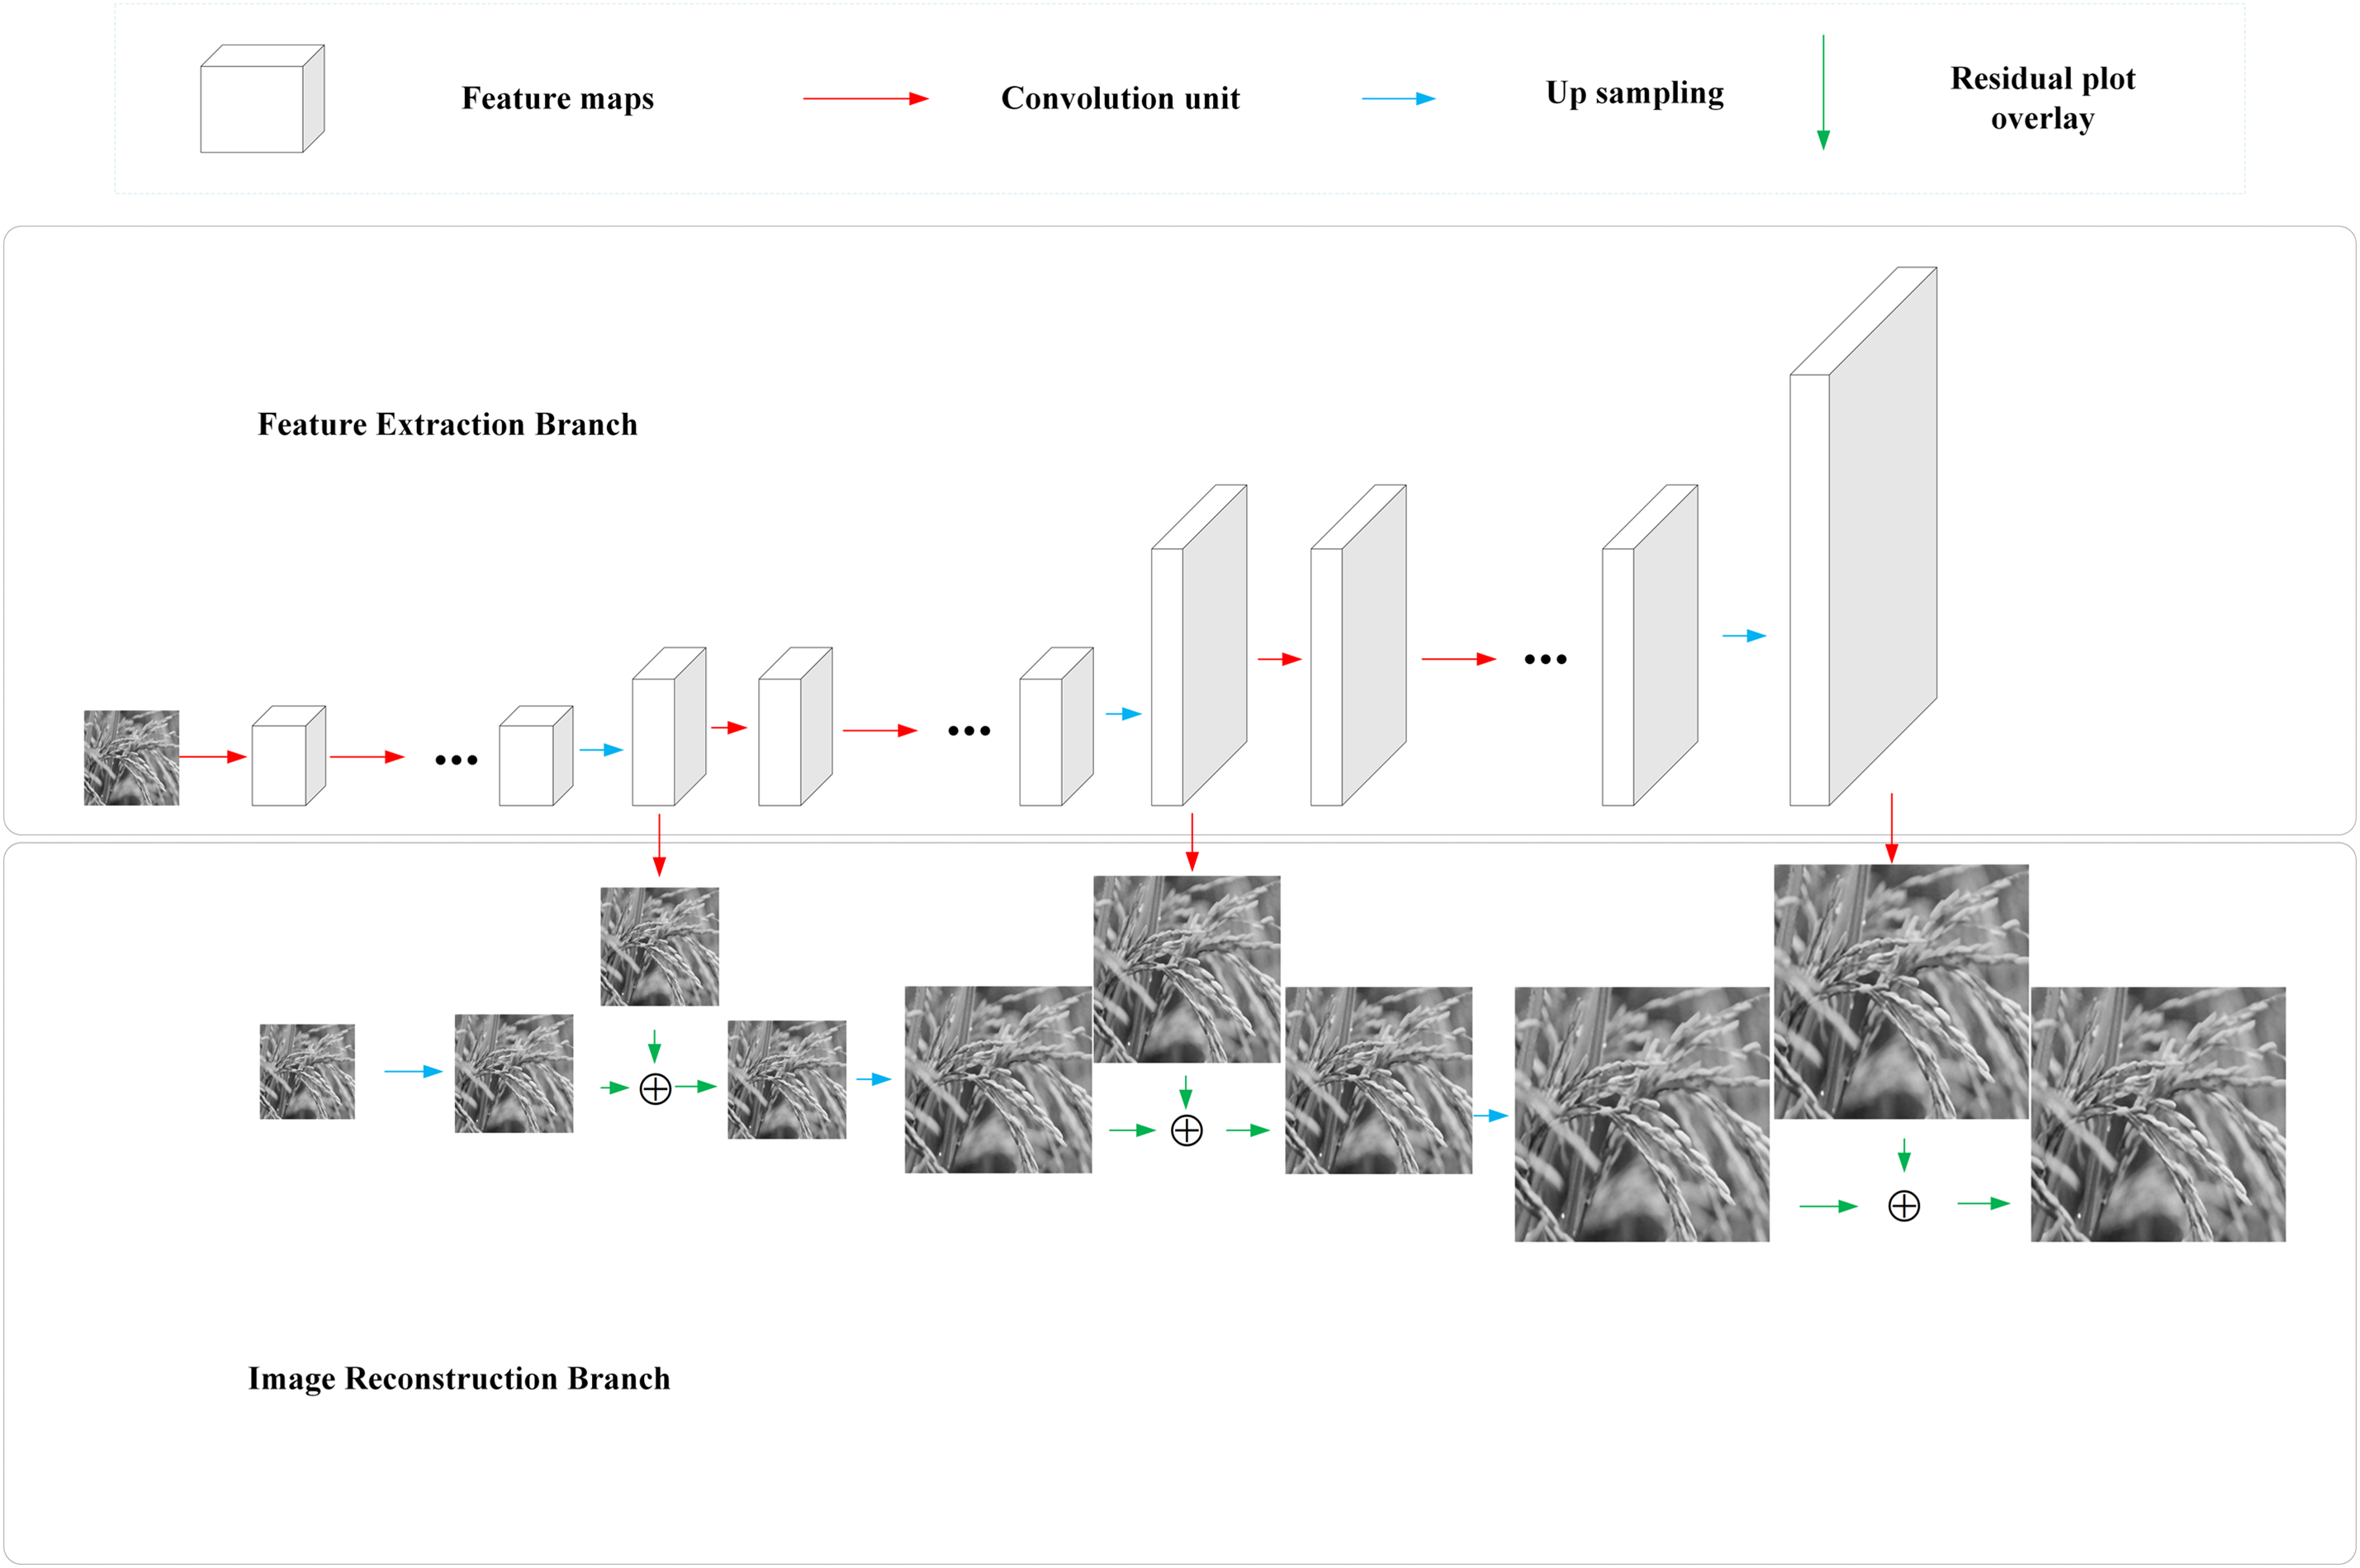
Figure 1: LapSRN architecture diagram
As shown in Fig. 1, the input to LapSRN is the luminance component (Y channel) of the original colour image. First, the image is converted into YCbCr colour space, and only the Y channel is used for reconstruction. After LapSRN enhances the Y channel, the result is combined with the original chrominance channels (Cb and Cr) to yield the final colour image. The LapSRN is primarily constituted of two principal branches, the Feature Extraction Branch and the Image Reconstruction Branch. The Feature Extraction Branch is primarily responsible for the extraction of multi-scale feature information from low-resolution images, thereby providing sufficient contextual semantics and details for subsequent image reconstruction. This branch is composed of multiple convolutional layers, each of which gradually captures the spatial structural features of the image through a specific convolutional kernel. The Image Reconstruction Branch progressively restores the high-resolution image in accordance with the feature information extracted by the feature extraction branch. The specific parameter map is shown in Fig. 2.
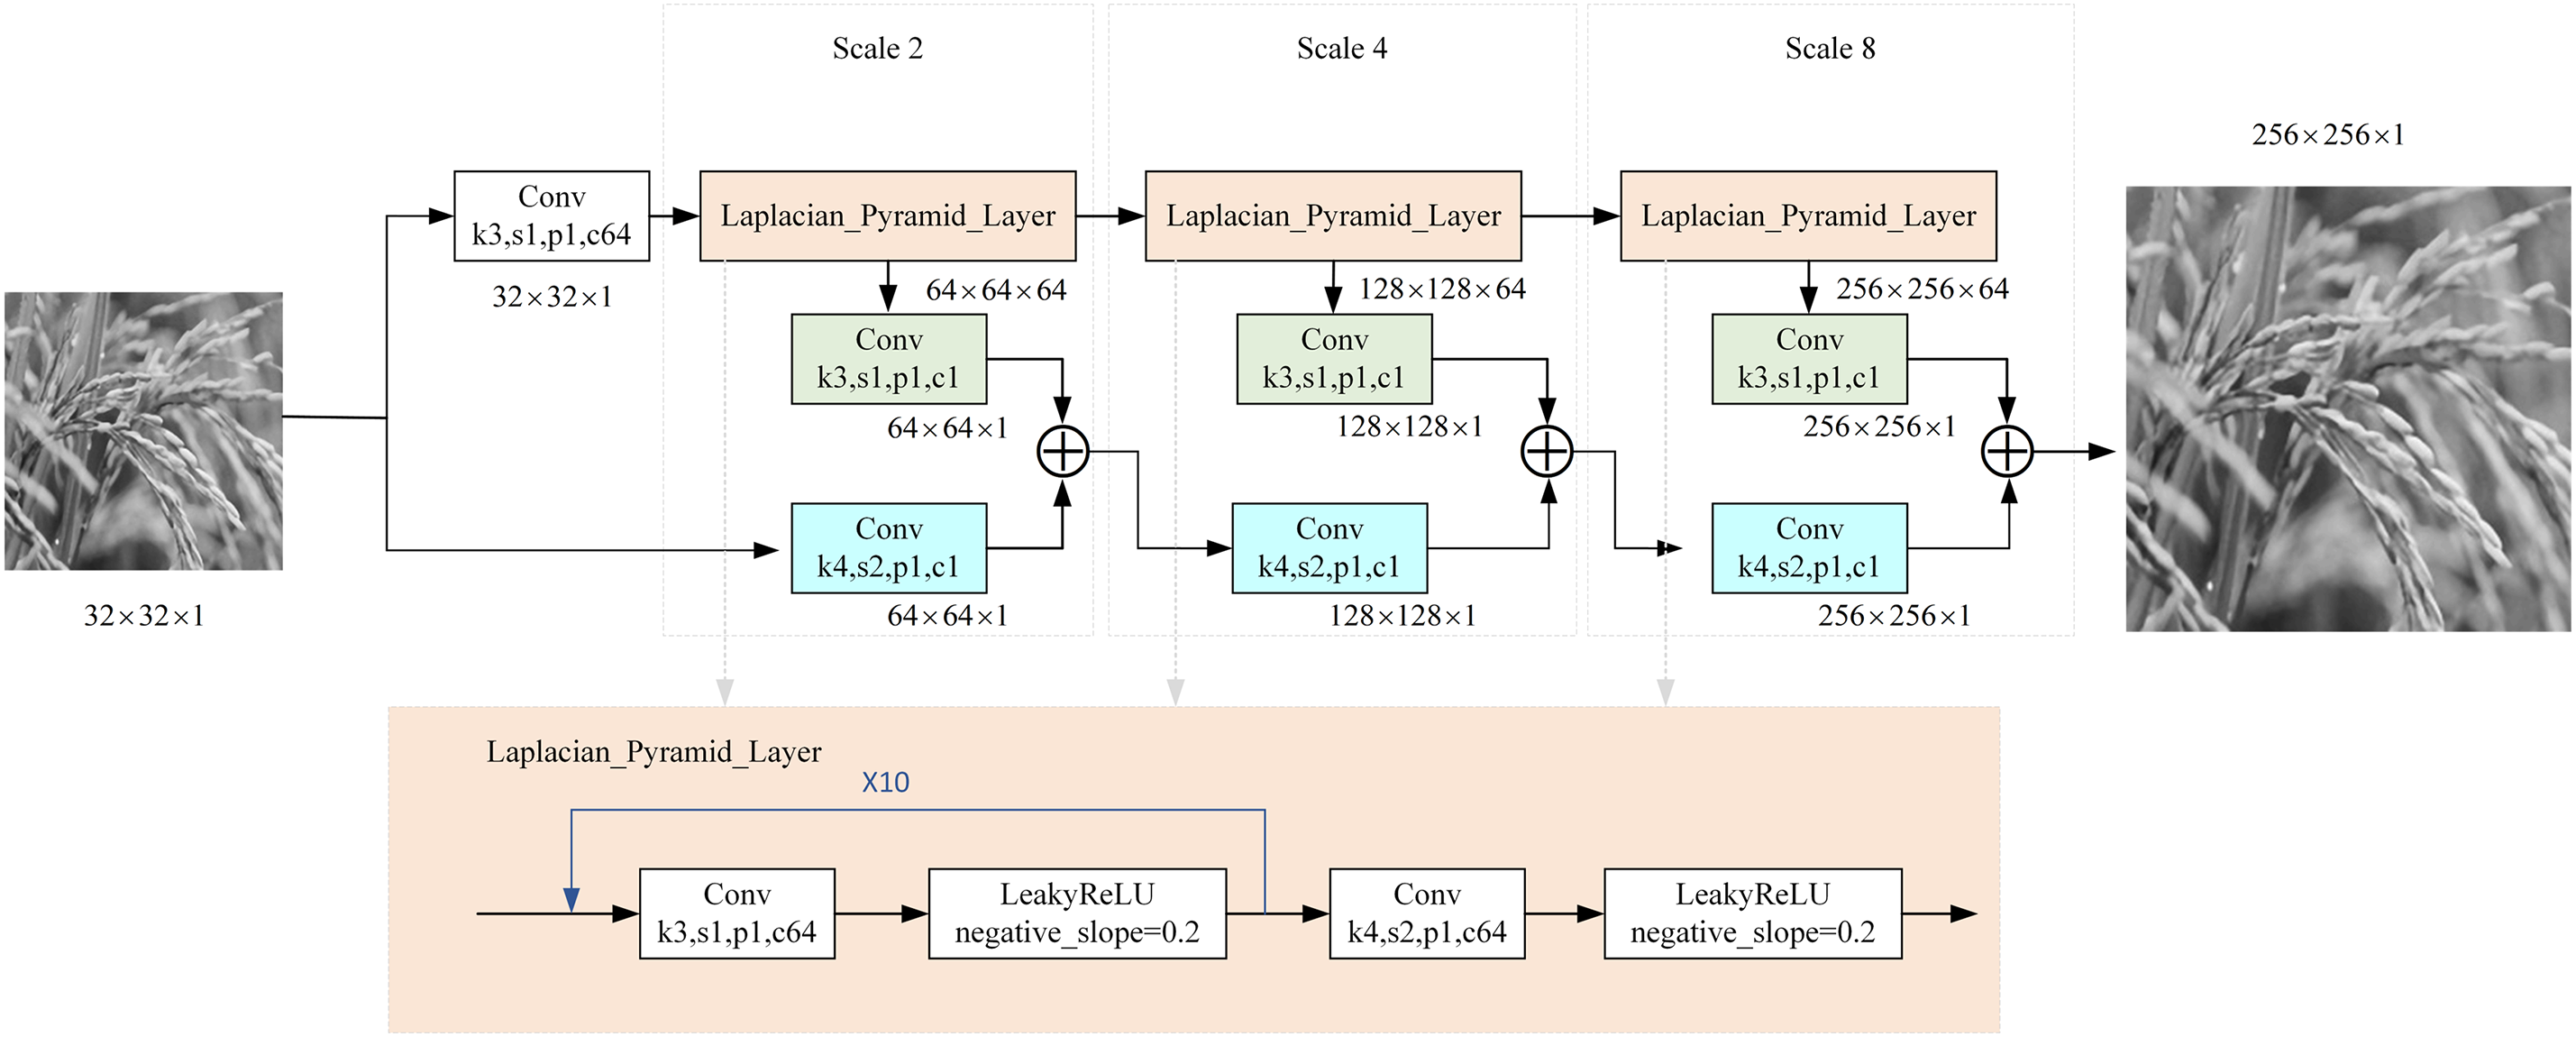
Figure 2: The LapSRN parameter map
As shown in Figs. 1 and 2, the LapSRN model uses a three-stage progressive upsampling structure to reconstruct low-resolution images (32 × 32) into high-quality output (256 × 256). Each scaling stage (2×, 4×, and 8×) employs a two-branch structure for feature extraction and spatial reconstruction. These two-branch outputs are fused by element-wise summation to preserve high-frequency details and spatial accuracy. The progressive reconstruction strategy effectively avoids artifacts caused by large-scale single-step upsampling, while the Laplace pyramid structure suppresses noise propagation. As a result, the model improves computational efficiency, reconstruction accuracy, and visual fidelity.
The formula utilized by LapSRN for the loss function is as follows:
where
The conventional approach to deep convolutional network structures is to gradually convolve from high resolution to low resolution, employing either max or average pooling to generate features. However, this approach may result in the loss of high-resolution spatial information. The high-resolution network (HRNet) [27,28] is capable of generating and parallelizing feature maps of varying scales, which can effectively retain the high-resolution information at each scale and prevent the loss of certain features. Additionally, HRNet facilitates the exchange of information between multi-resolution feature maps within the network, allowing for the effective fusion of low-resolution contextual information and high-resolution detailed information.
The backbone network used in this paper is HRNet V2, and the structure diagram is illustrated in Fig. 3.
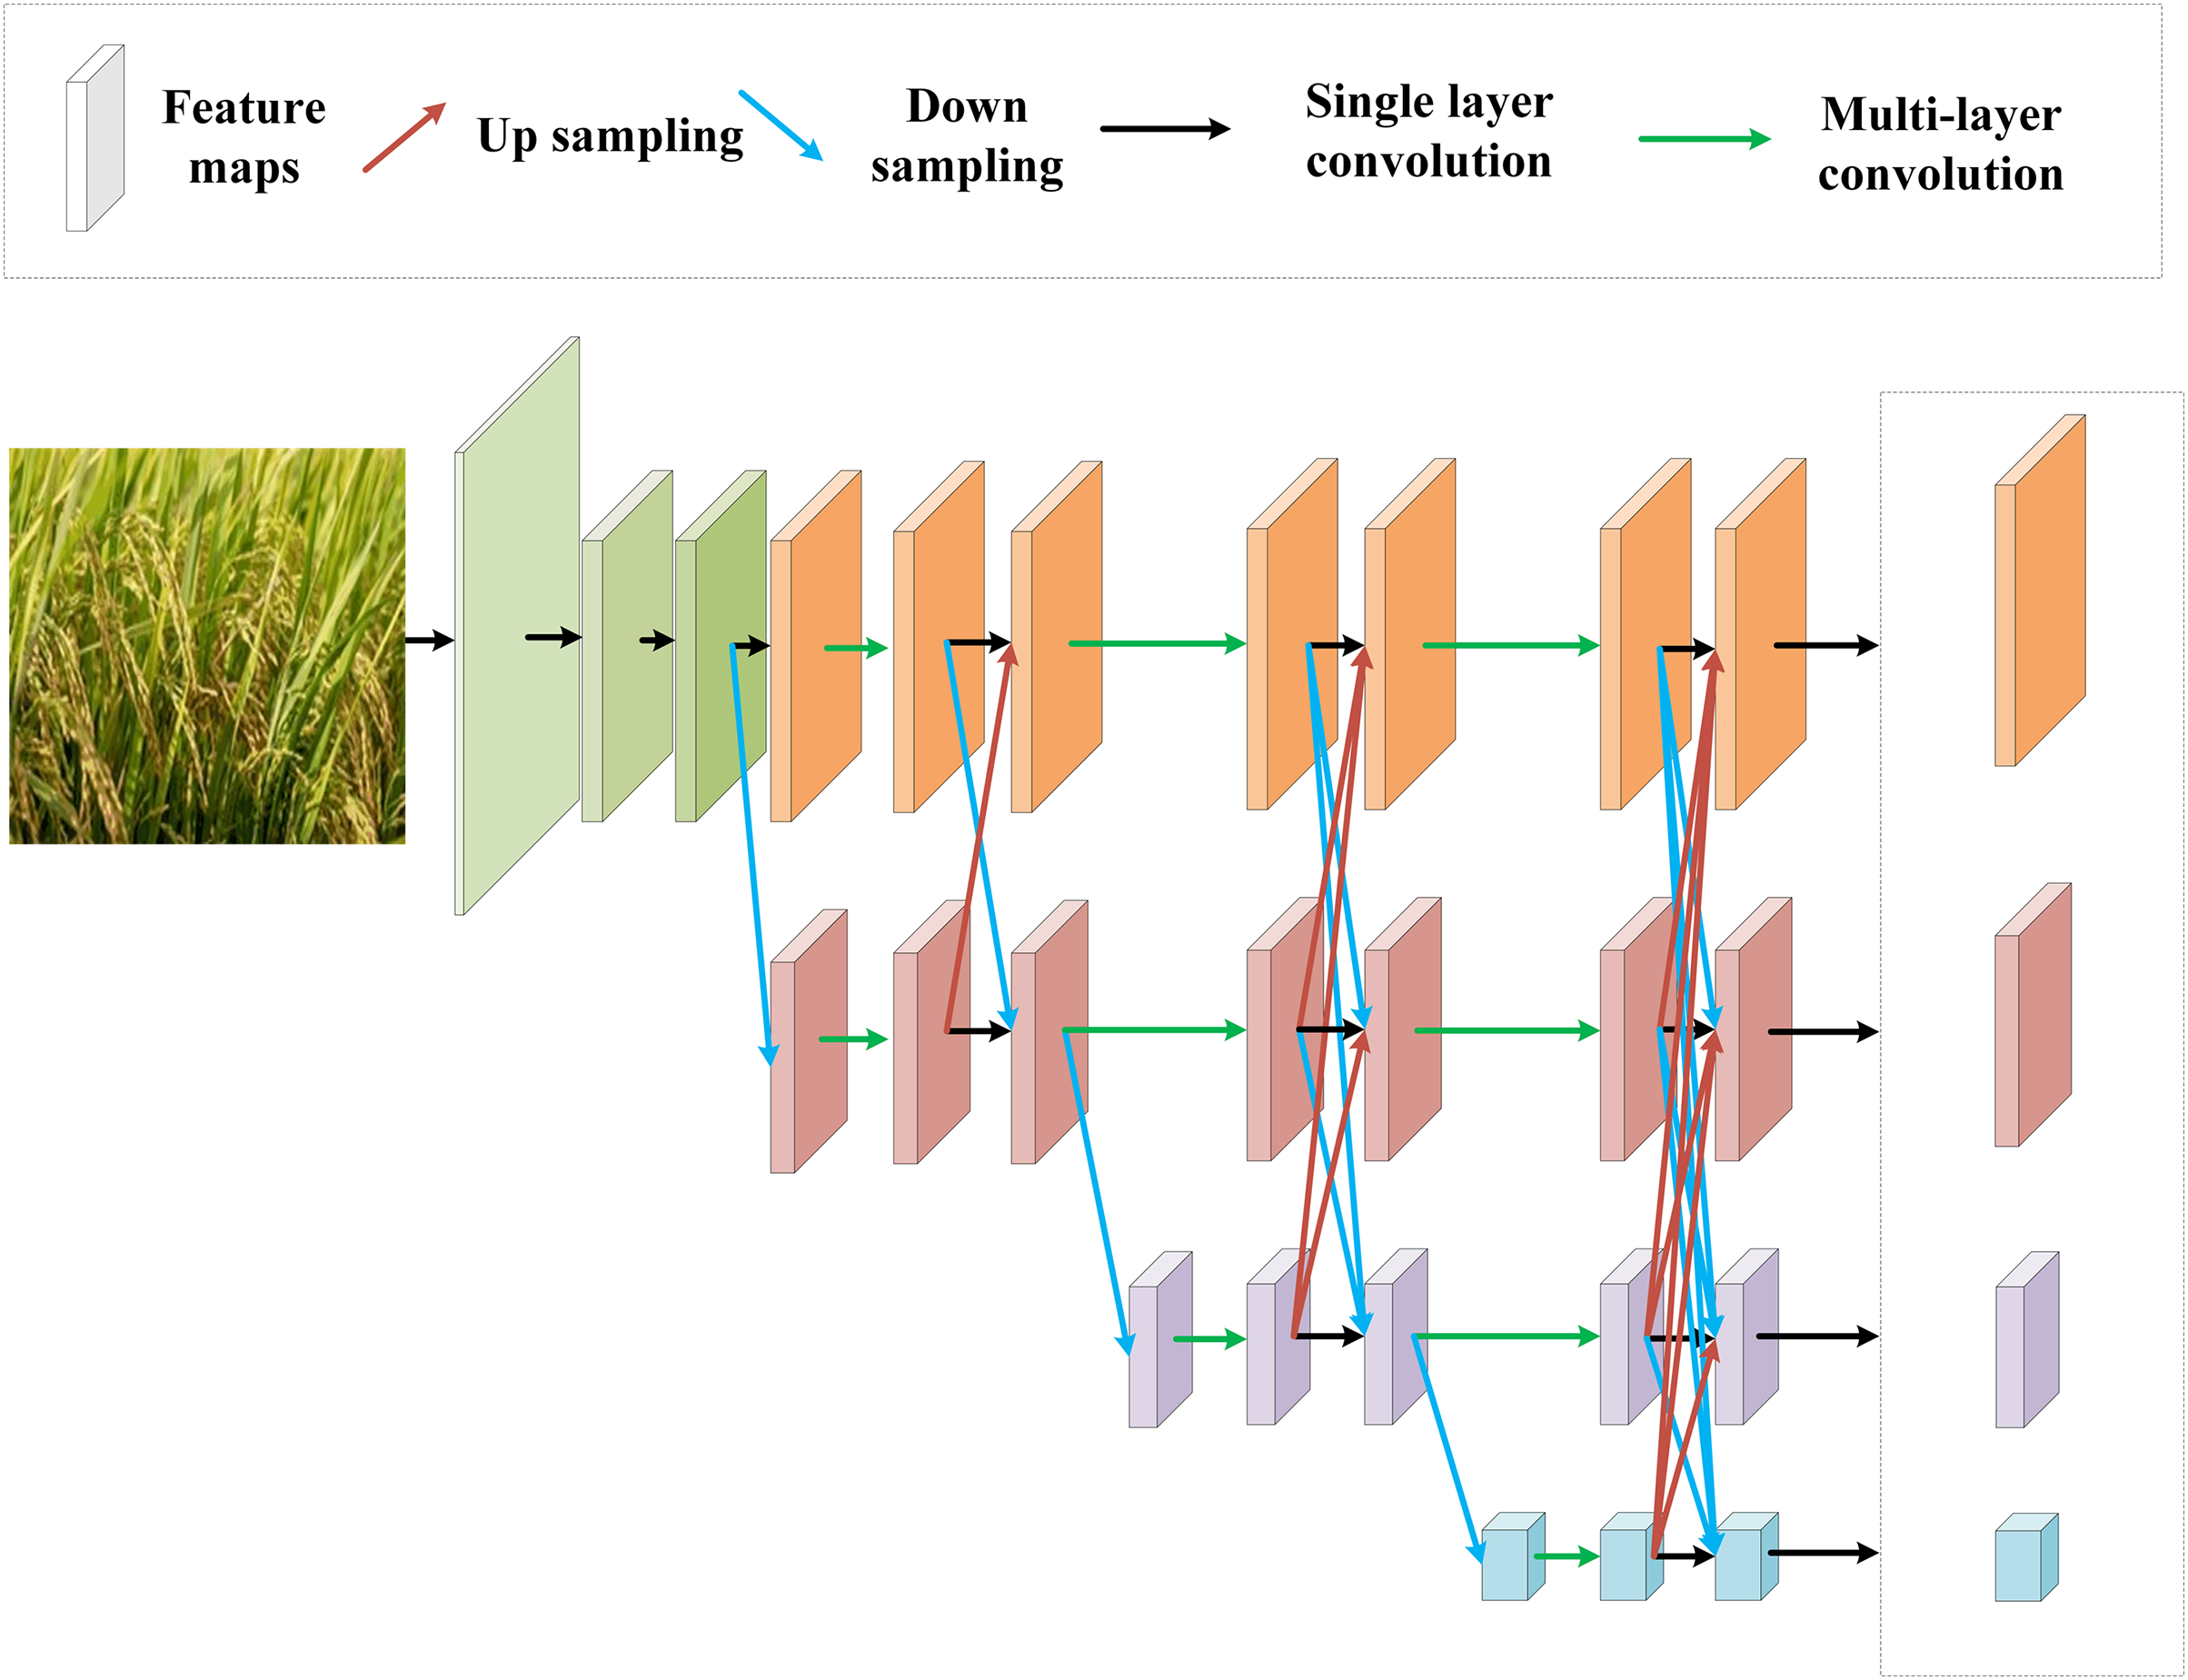
Figure 3: HRNet V2 architecture diagram
Although classical image classification models such as GoogLeNet and RESNet have achieved wide success, they still have certain shortcomings. GoogLeNet only does multi-scale feature fusion within the Inception module, and there is insufficient communication of deeper information across modules. RESNet deepens the network with a residual structure, but it is downsampled layer by layer along a single path, and the high-resolution spatial details are continuously weakened. In contrast, HRNet V2 proposes an optimized design to solve the above problems.
As shown in Fig. 3, firstly, the original three-scales are expanded to four-scales in parallel, and multi-resolution feature representations are always retained. Secondly, bi-directional exchanges are carried out between scales and all scales are directly outputted, so that spatial details and high-level semantics can be fully integrated. Therefore, it is significantly better than the traditional model in terms of classification accuracy, generalization ability, and capture of fine-grained features.
The HRNet V2 [29] employs a cross-entropy loss function that integrates the softmax and negative log-likelihood. This function initially applies a softmax operation to the model output, transforming the logits into a probability distribution. Subsequently, it computes the cross-entropy loss. The formula is as follows:
where
2.3 Channel Attention Mechanism
The channel attention mechanism is a technique that enables the neural network model to learn information from different channels and generate different weights, thereby enhancing its ability to attend to specific channel features. The Squeeze Excitation Network (SENet) is a representative network structure of the channel attention mechanism [30]. The channel attention mechanism is realized using two operations, squeeze and excitation, respectively. The specific structure is illustrated in Fig. 4.
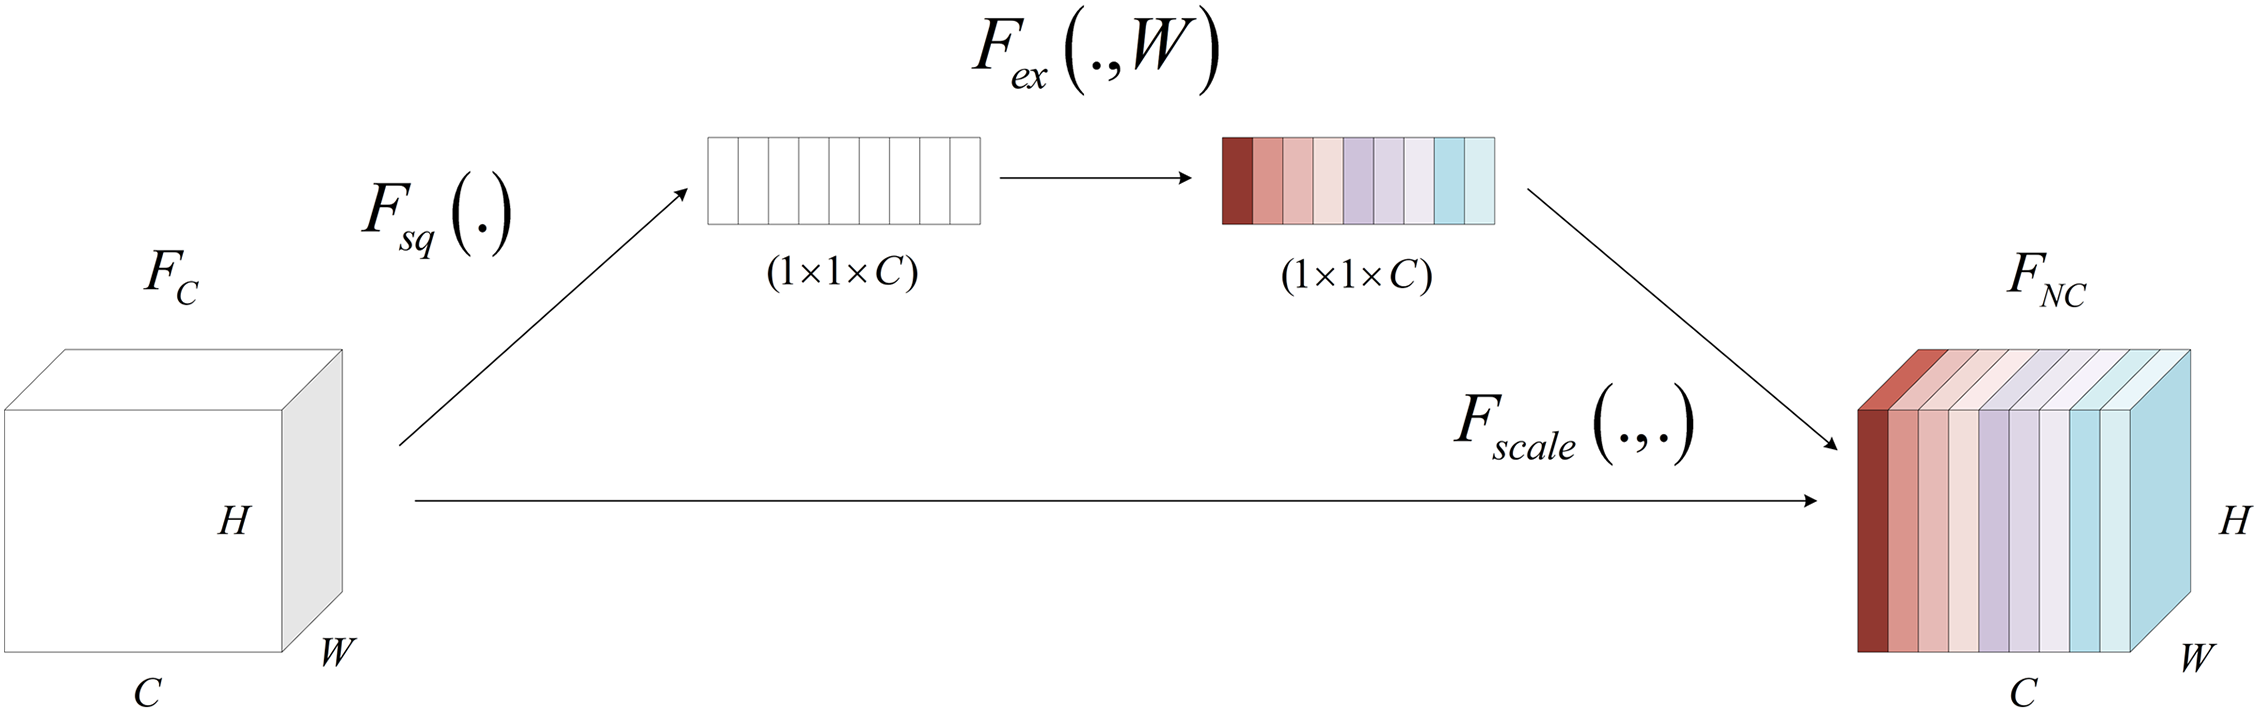
Figure 4: SENet structure diagram
The squeeze operation uses Global Average Pooling (GAP) to map all the features in each channel to a single feature, thereby obtaining global information. The formula is as follows:
where
The activation operation uses two continuous, fully connected layers to perform non-linear feature changes on the feature vector, thereby constructing channel feature weights that output higher weights for important features and lower weights for unimportant features. The formula is as follows:
where
In weighted operation, the input feature map is multiplied by the channel feature weight, resulting in a new feature map that exhibits enhanced sensitivity to salient features. The formula is as follows:
where
2.4 Spatial Attention Mechanism
The spatial attention mechanism is a technique that enhances the attention paid to specific spatial features in a neural network model. This is achieved by analyzing the spatial information in the feature map and providing different weight ratios for different spatial locations. Woo et al. [31] proposed the Convolutional Block Attention Module (CBAM), the structure of which is shown in Fig. 5.
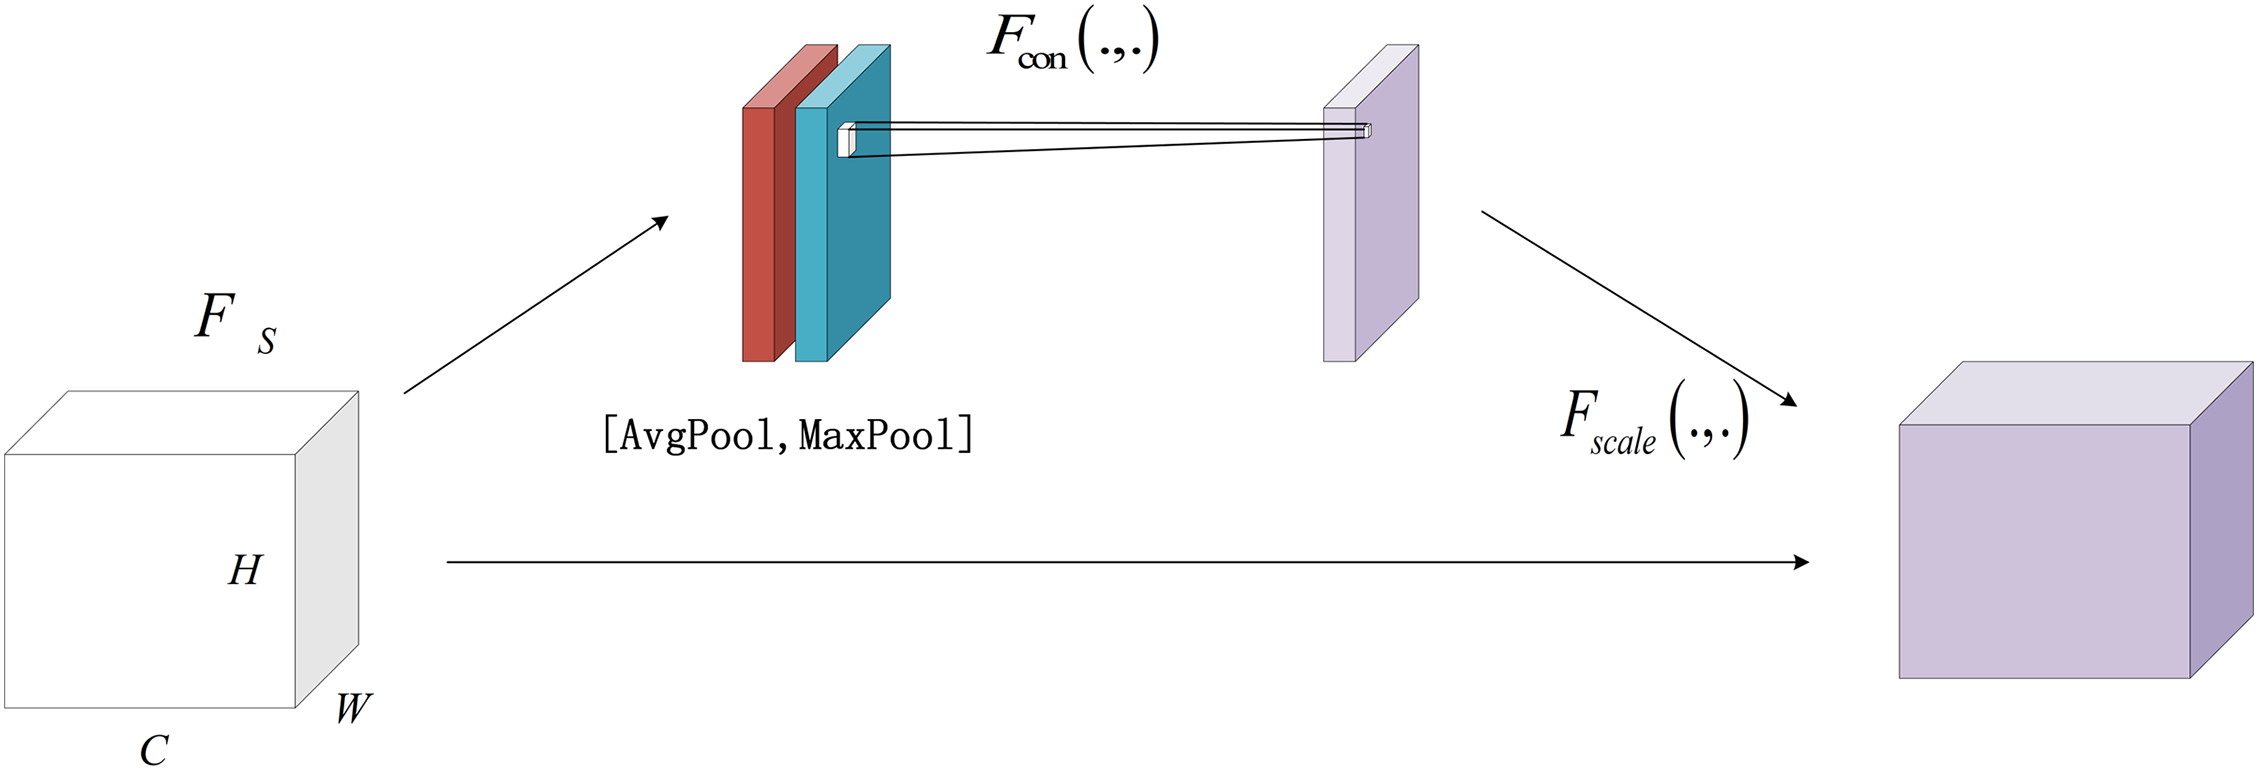
Figure 5: Spatial attention structure diagram
The channel dimension aggregation operation employs Global Average Pooling (GAP) and Global Maximum Pooling (GMP) to aggregate the feature maps in the channel dimension, thereby obtaining two single-channel feature maps. The formula is as follows:
where
The convolution operation takes two channel-wise aggregated feature maps as input and processes them through a convolutional layer followed by a nonlinear layer to generate a spatial feature weight map. Each location in this spatial feature weight map corresponds to a specific position in the original input feature map. The formula is as follows:
where
A weighted operation entails multiplying a spatial feature weight map by the original input feature map, thereby generating a new feature map. This new feature map is designed to enhance the focus on specific spatial positions. The formula is as follows:
where
3 Lap-FEHRNet Model for Crop Image Classification
This paper proposes a deep learning model that fuses a Laplacian Pyramid Super-Resolution Network (LapSRN) and a Feature Enhancement High-Resolution Network based on attention mechanisms (FEHRNet), as a solution to the problem of low-resolution crop image processing and classification. The structure of the model is illustrated in Fig. 6. The FEHRNet Parameters Map is illustrated in Fig. 7.
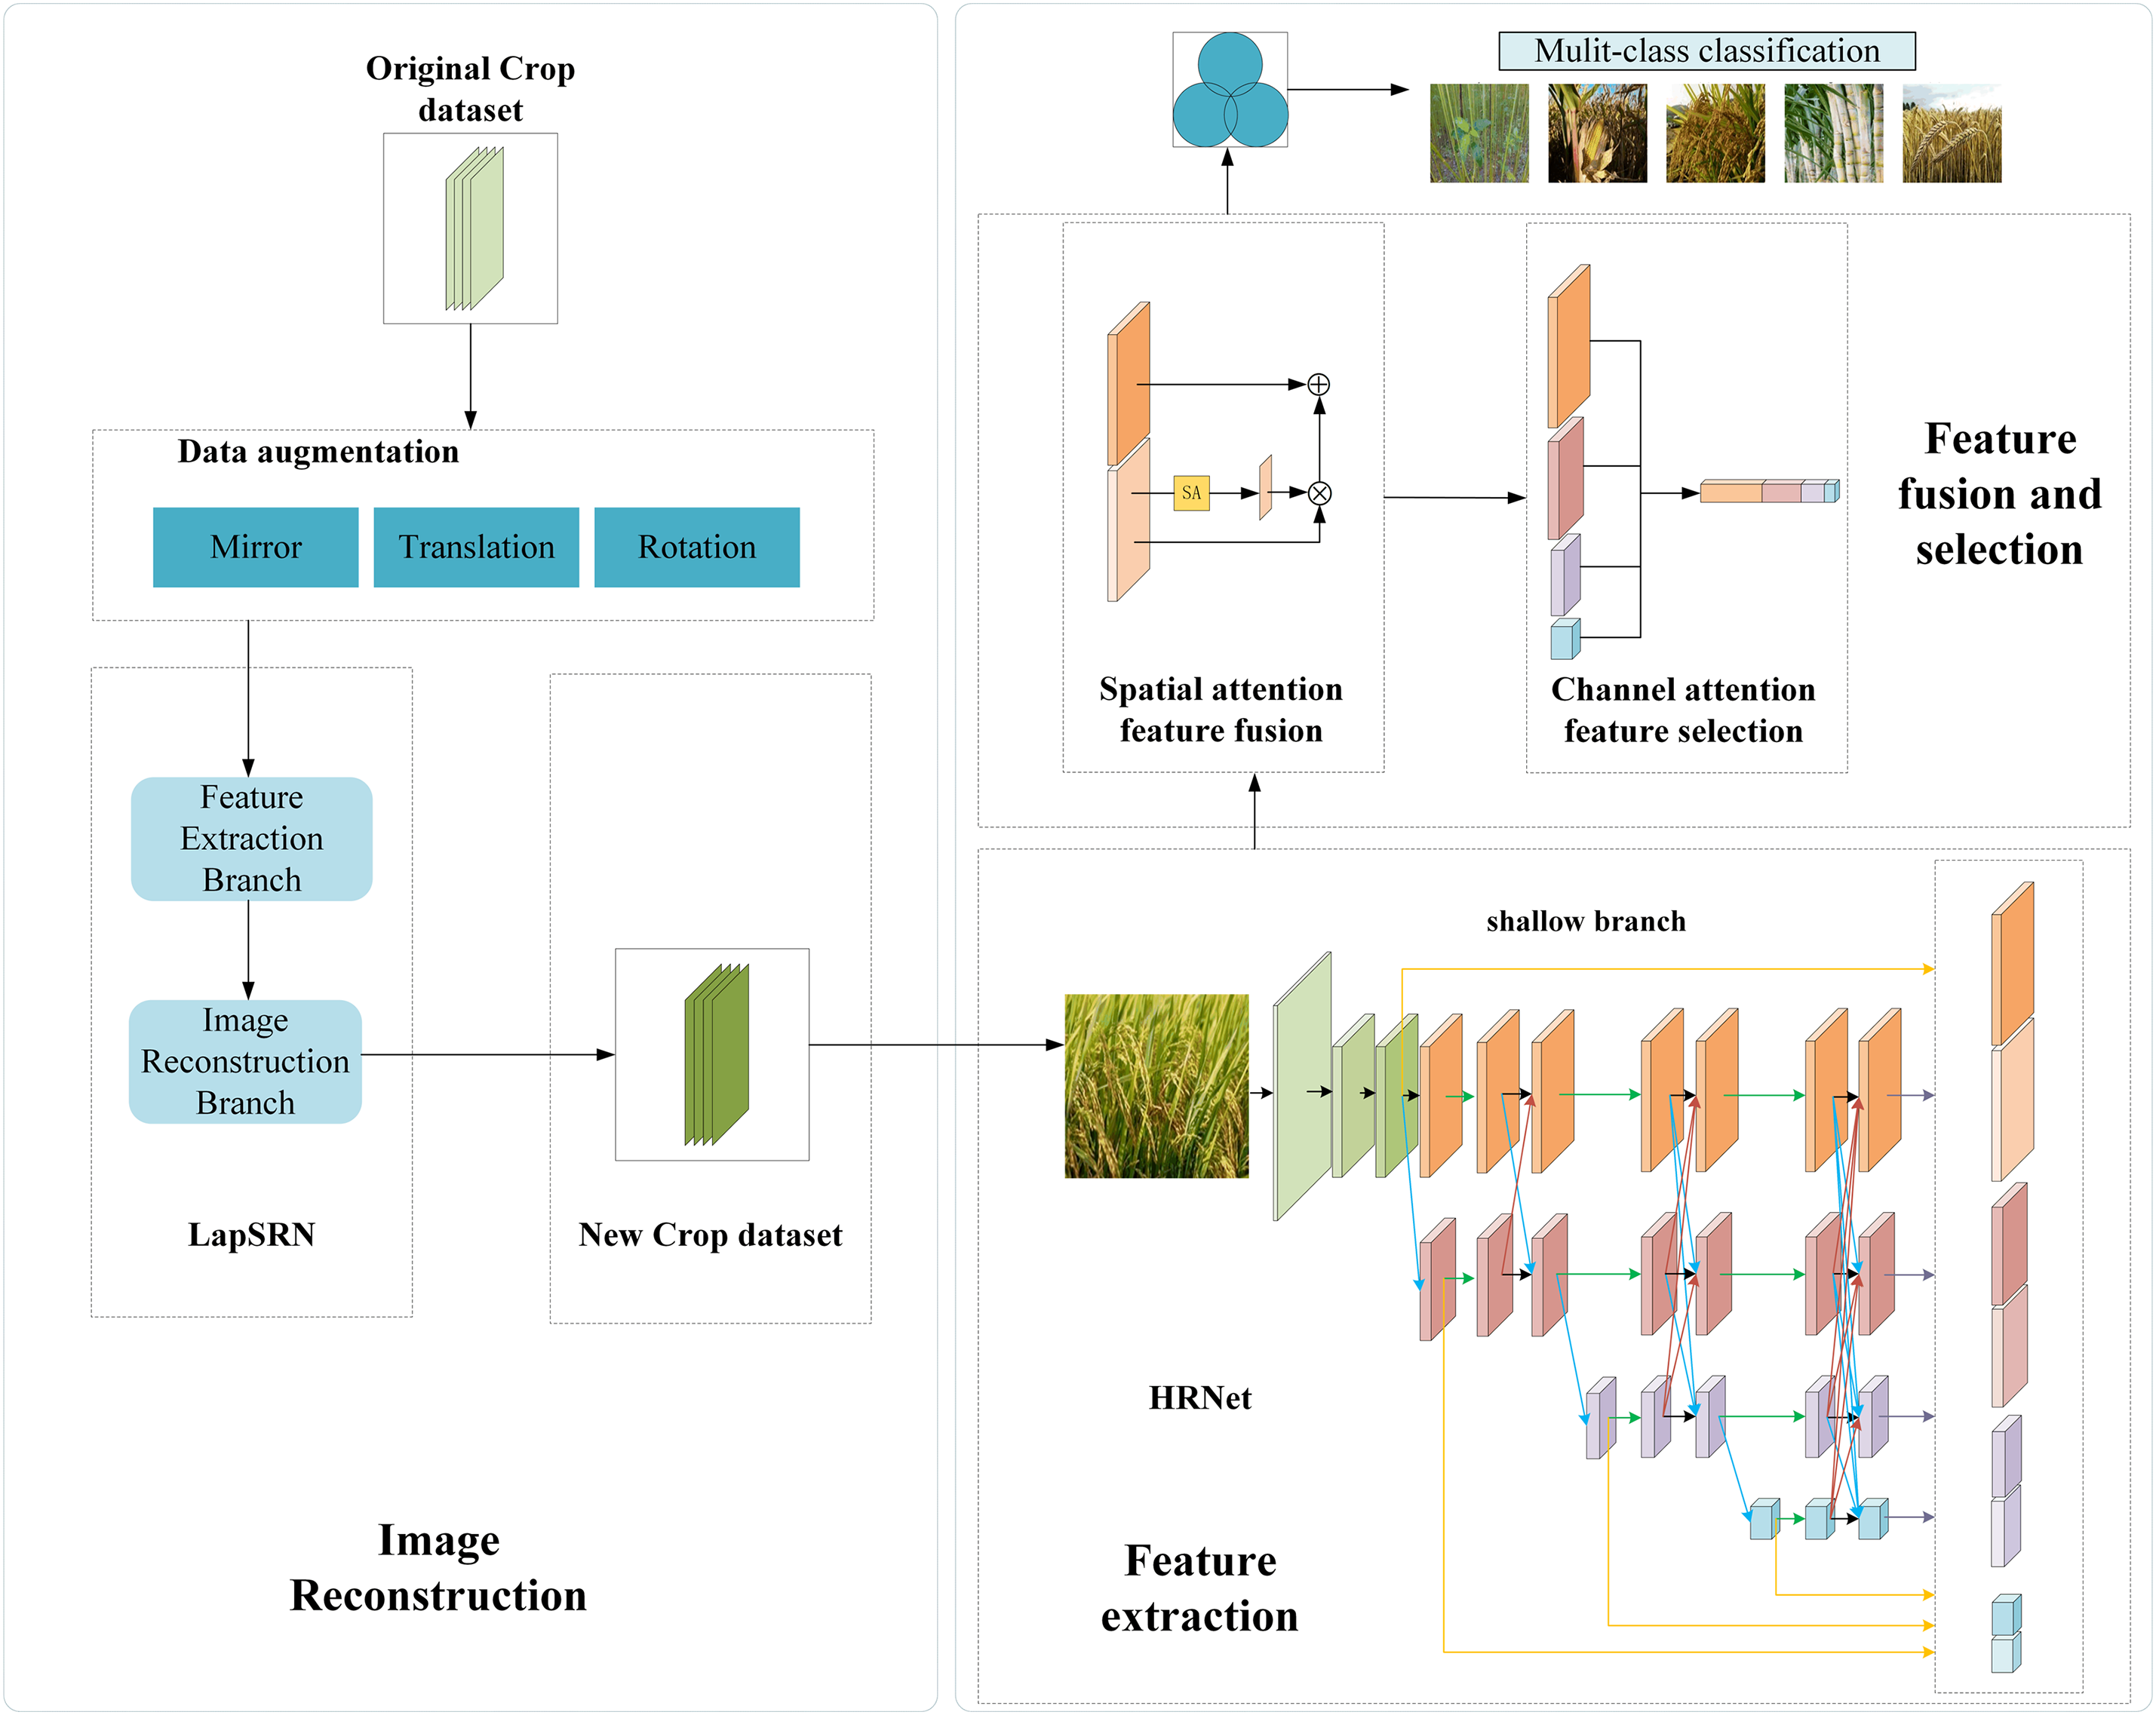
Figure 6: Lap-FEHRNet model architecture diagram
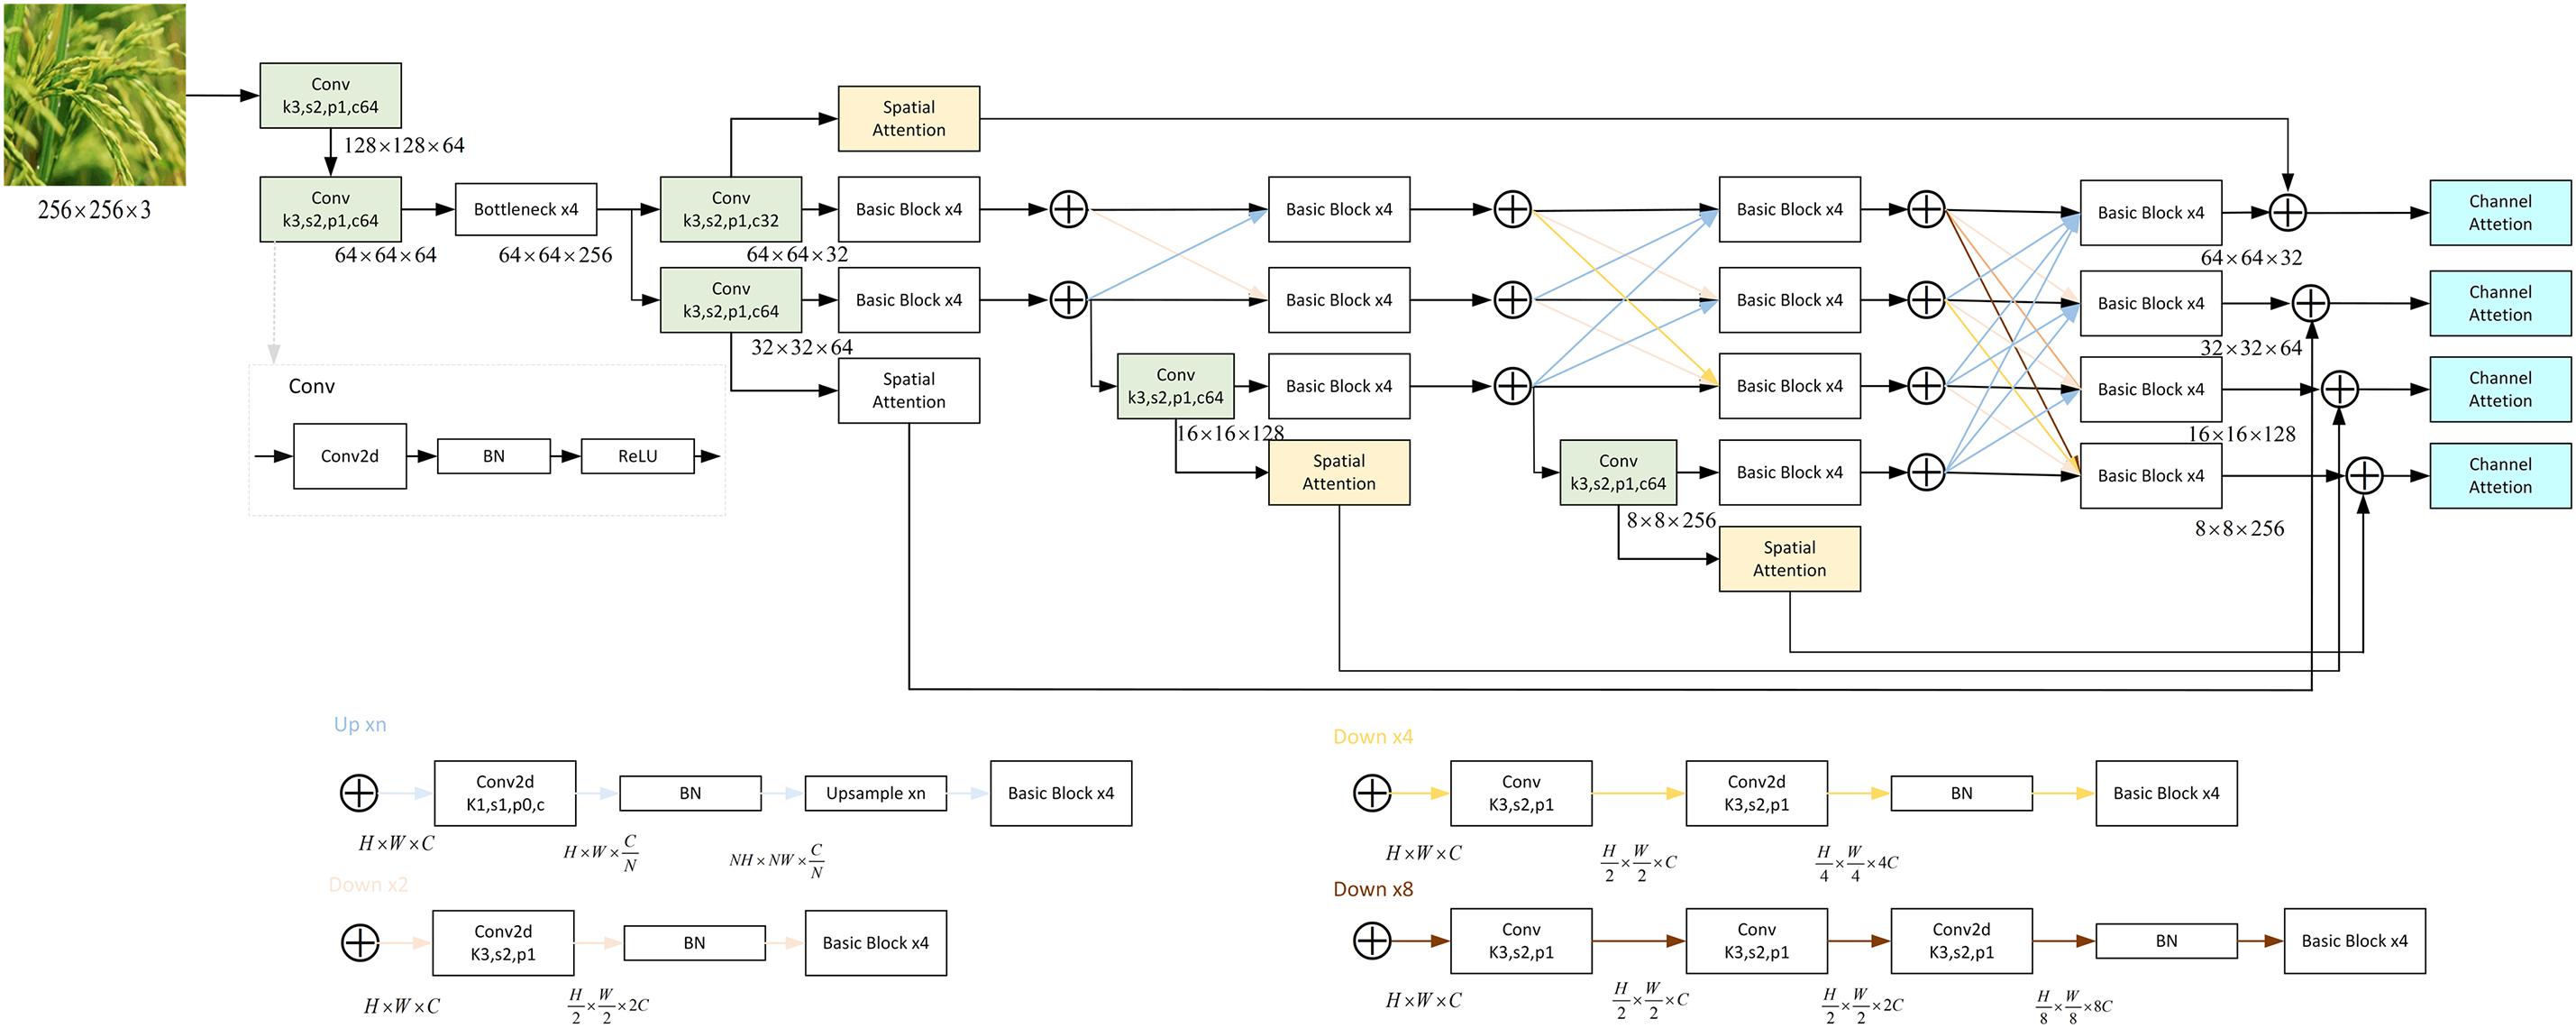
Figure 7: The FEHRNet parameters map
The overall architecture of the Lap-FEHRNet model proposed in this paper is demonstrated in Fig. 6. The architecture consists of two main modules: the image reconstruction module and the feature extraction module. The image reconstruction module uses LapSRN to denoise and super-resolution reconstruct the original low-resolution crop images, while the feature extraction module is based on the improved HRNet, which improves the classification performance by fusing shallow and deep features. The feature enhancement module is also introduced for feature selection and fusion to improve the ability of the model to focus on key information.
Fig. 7 shows the parameter structure of the FEHRNet module, which details the residual connection, attention mechanism, and branched network structure at different scales within the feature extraction module.
The following is the specific process of this research model:
In the initial stage, LapSRN is employed to denoise and reconstruct high-definition images of the collected low-resolution crop images. Given that low-resolution images result in the loss of image details, the LapSRN network is introduced to reconstruct high-definition images and denoise low-resolution images through multi-level detail recovery, effectively addressing the issues of detail loss and feature extraction difficulties caused by low-resolution crop images, and further enhancing the accuracy and robustness of the image classification model.
In the second step, feature extraction is performed on the reconstructed image. Given the diversity and complexity of the deep and shallow features of crop images, as well as the fact that they contain important details and global information, HRNet V2 is improved. When a downsampling branch appears, a shallow branch is also introduced. Finally, deep and shallow feature maps are output at each resolution scale.
In the third stage, the deep and shallow feature maps obtained from the previous stage are simultaneously fed into the attention mechanism-based feature enhancement module. The structure of this module is shown in Fig. 8. To cope with the differences in the relevance of different channels and spatial regions to the classification task, a feature fusion module and a feature selection module are designed. On the one hand, the feature fusion module based on spatial attention can highlight more discriminative regions in the image and fuse them with deep features to form a more discriminative spatial feature representation, effectively suppressing the interference of redundant information and noise in the background. On the other hand, the feature selection module based on channel attention weights the fused feature map in the channel dimension, so that the network can more adaptively emphasize the channel features that contribute most to classification. The specific parameter maps of the two modules are shown in Figs. 9 and 10, respectively.
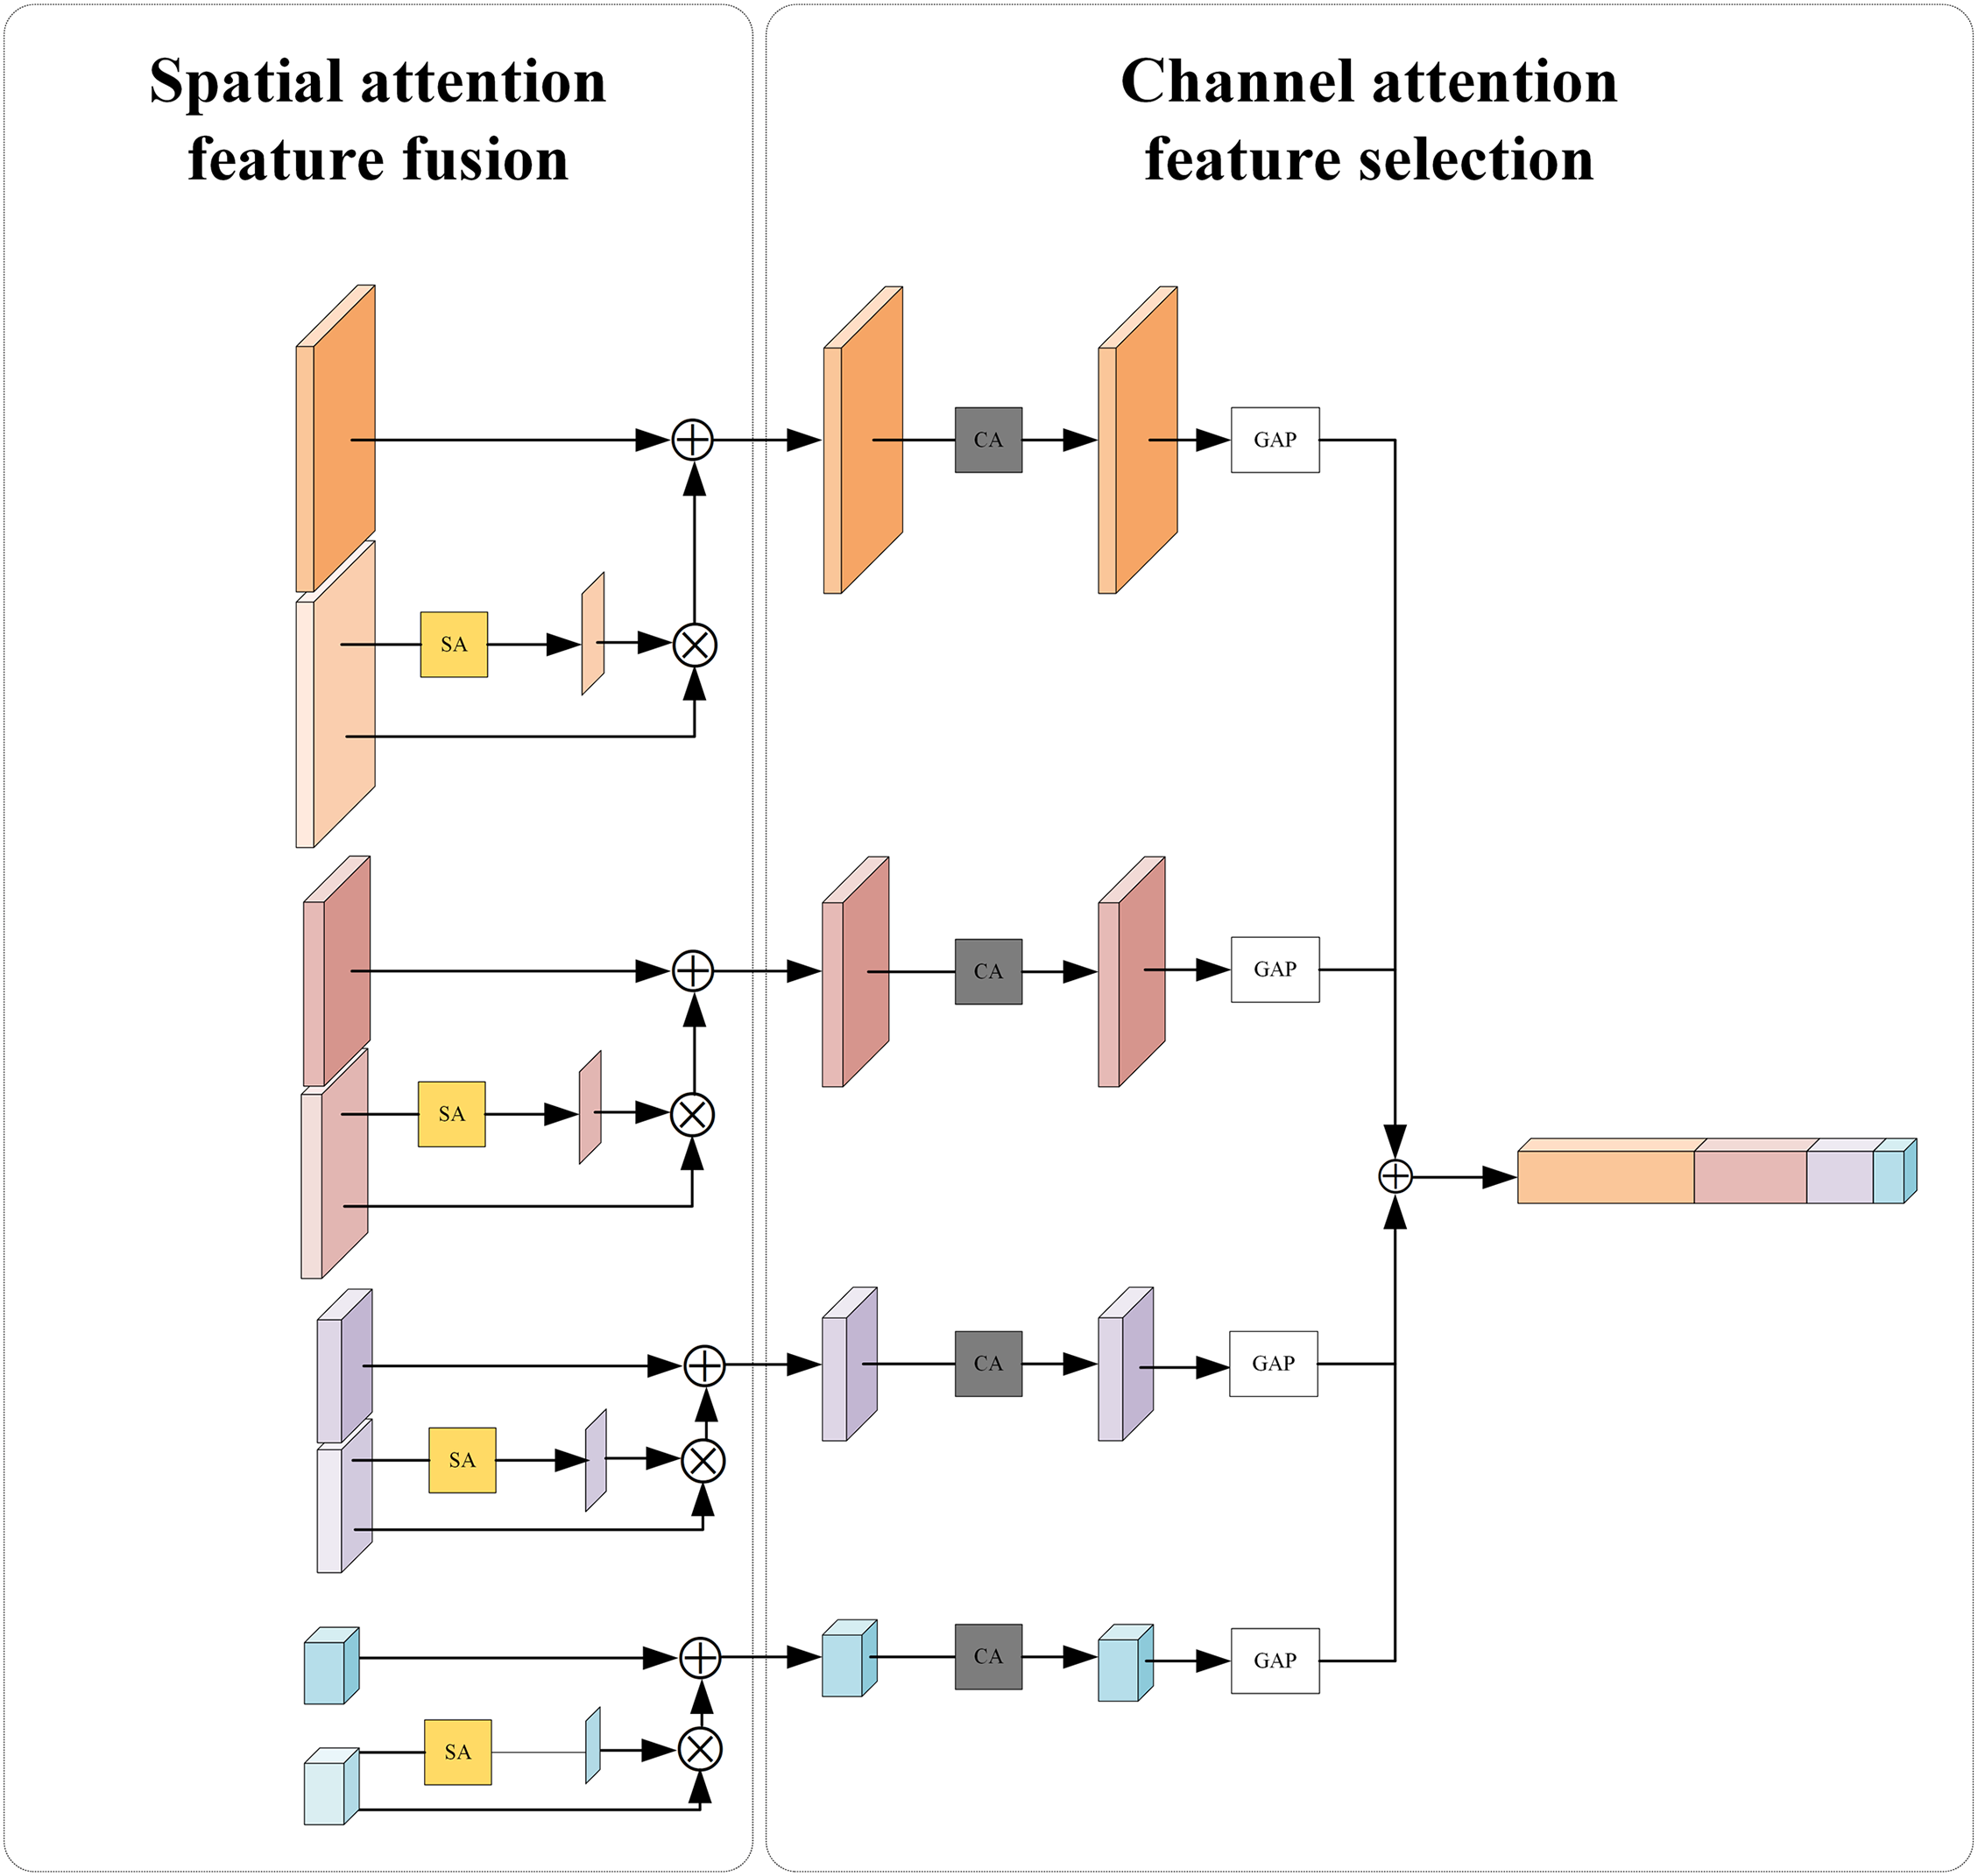
Figure 8: The attention-based feature enhancement module structural diagram
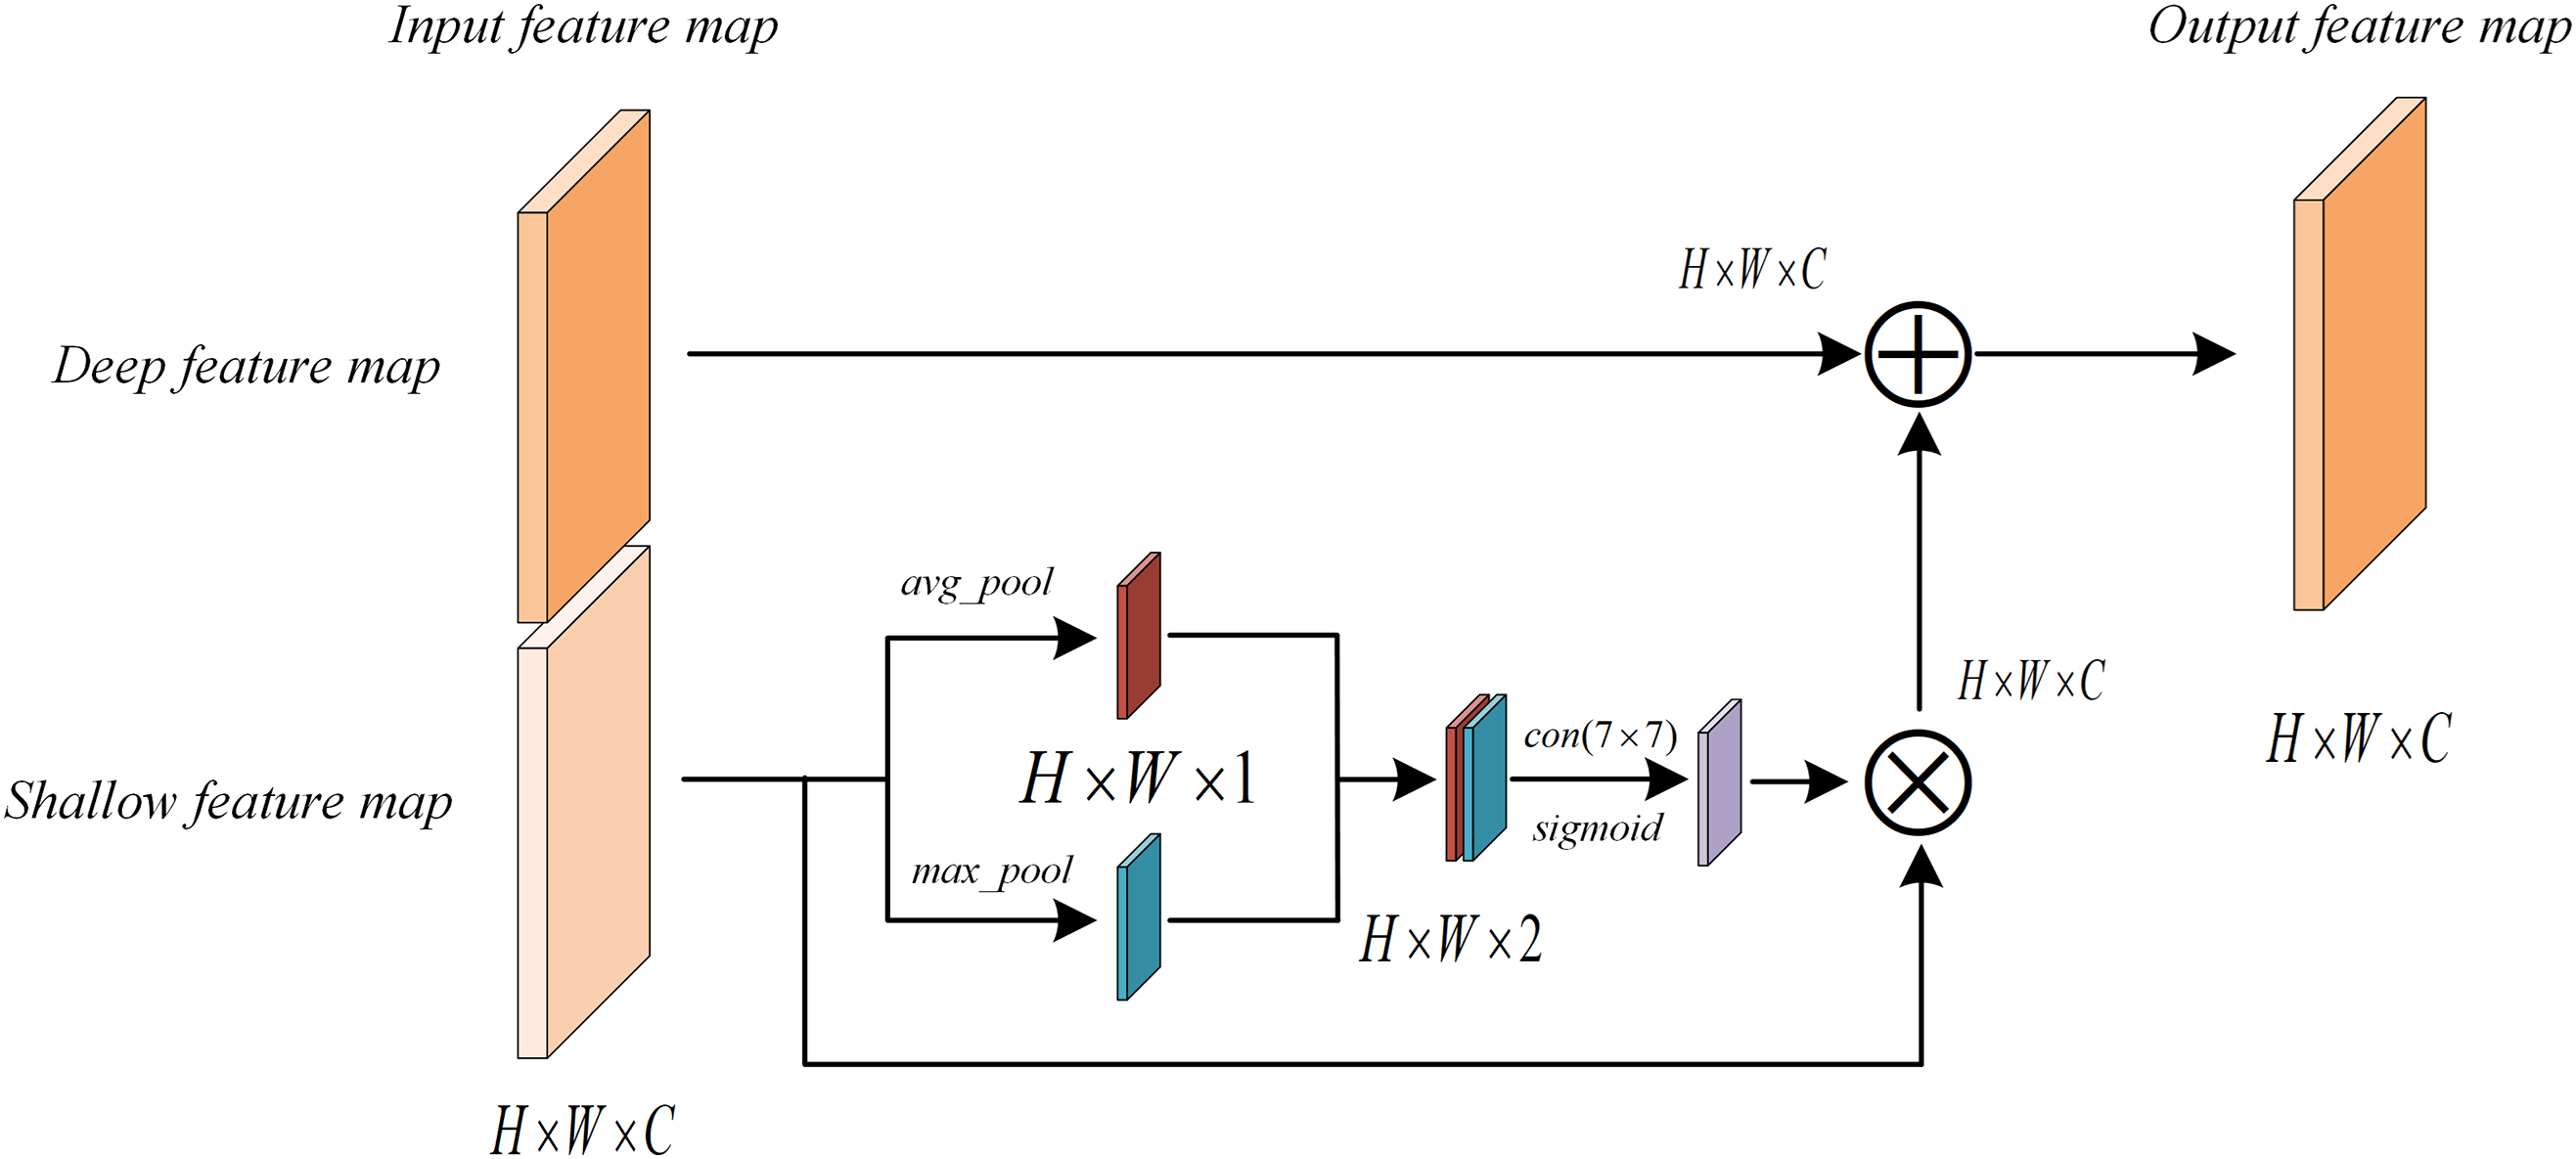
Figure 9: The deep and shallow feature fusion module
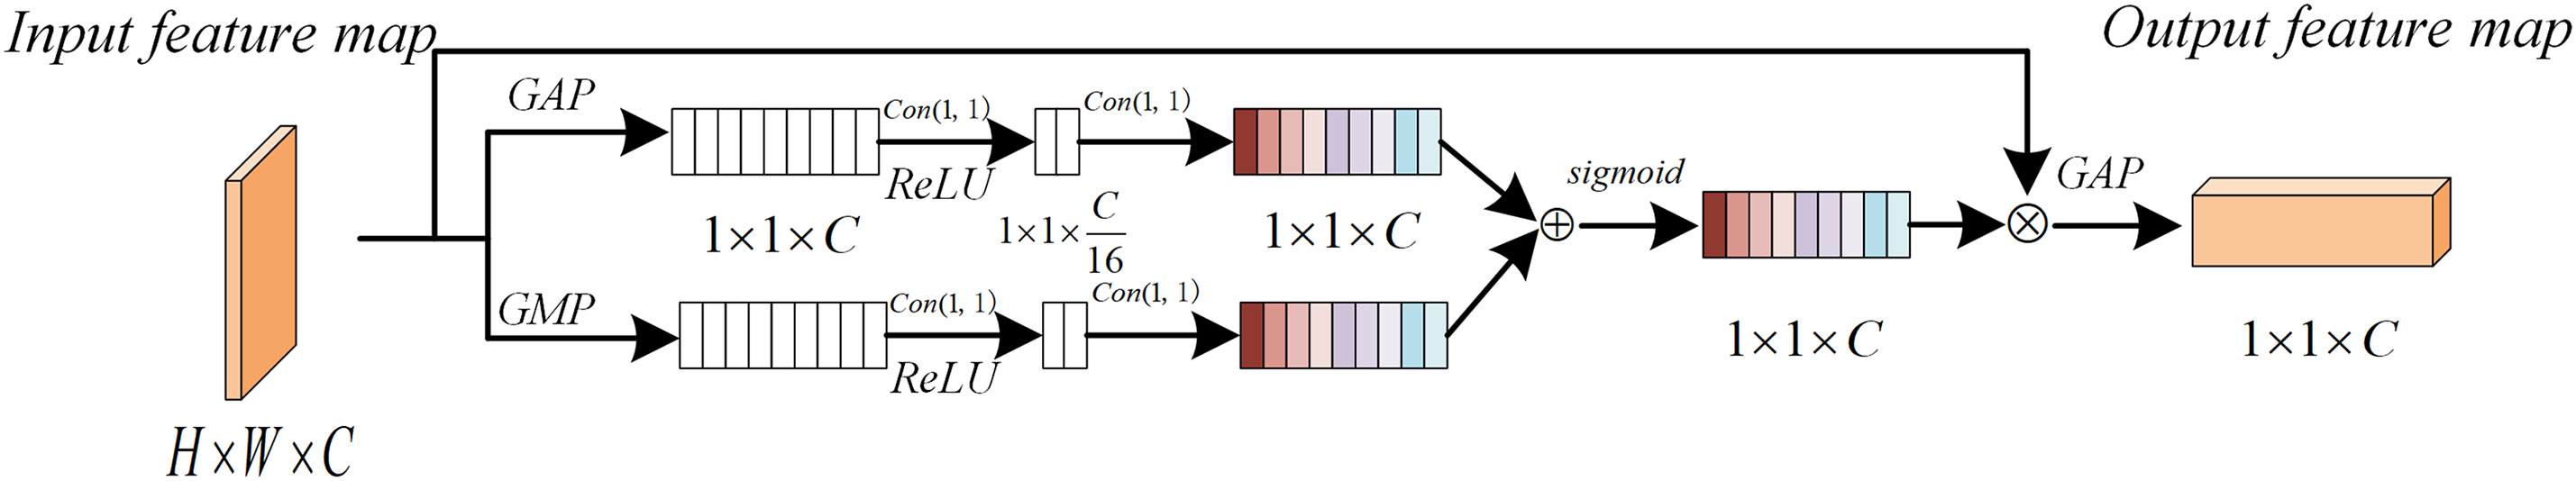
Figure 10: The feature selection module
The spatial attention mechanism is applied to a shallow feature map as shown in Fig. 9. The mechanism uses average pooling and max pooling operations along the channel direction to generate two spatial feature maps. These two spatial feature maps are connected and passed to a 7 × 7 convolutional layer and a sigmoid activation function to generate a spatial attention map. This map assigns a weight between 0 and 1 to each spatial location, thereby adaptively highlighting key areas and suppressing irrelevant or noisy areas. Subsequently, the spatially enhanced shallow features are fused with the deeper features to effectively combine the local spatial information with the global semantic context, thus realizing the complementarity and enhancement of multi-level information.
As shown in Fig. 10, this module employs channel attention by applying global average pooling (GAP) and global max pooling (GMP) to reduce the spatial dimension to 1 × 1 × C. The GAP and GMP outputs each pass through a 1 × 1 convolution (with ReLU), and are then combined by element-wise addition. A Sigmoid activation generates channel-wise weights, which multiply the original feature map to emphasize important channels and suppress less relevant ones. This selective emphasis enhances network efficiency and accuracy by focusing on critical information.
In the fourth step, the obtained features are utilized for classification tasks to achieve accurate image classification and recognition.
The training process of the Lap-FEHRNet deep learning model and image classification encompasses image pre-processing, network model construction, image training, and image classification. The following steps delineate the precise process:
1. Image pre-processing. The dataset is augmented through the application of image enhancement techniques, such as image mirroring, translation, and rotation, which increase the number of samples, effectively learn more diverse features, and reduce the risk of overfitting.
2. Construct LapSRN Model. LapSRN is employed for the reconstruction of low-resolution images, the enhancement of the expressiveness of crop image features, and the reduction of noise-induced interference, to ultimately output high-quality images. Regarding the specific structure of LapSRN, this study employs a three-layer progressive magnification reconstruction approach, wherein the image size of each layer is twice that of the previous layer. The magnified image is added to the residual image obtained from each layer based on the feature information output by the feature extraction branch. Following three layers of image reconstruction, the final output is an 8× reconstruction of the original image.
3. Construct the FEHRNet Model. Utilize HRNet V2 as the backbone network, incorporate a shallow branch with spatial attention, and integrate the features of the deep and shallow layers to enhance the diversity of feature information. Additionally, introduces channel attention to further select features, thereby optimizing the training effect and generalization ability of the model.
4. Joint training. Initially, low-resolution images are input into LapSRN for reconstruction, thus enhancing image resolution and reducing noise. The image reconstructed by LapSRN is then input into FEHRNet, where the network parameters are optimized through feature extraction and classification training.
5. Image classification: The image to be classified is input into the trained Lap-FEHRNet model, which then outputs a prediction of the crop category. This process enables the classification of crop images.
Based on the available evidence, including the sample size and multiple experimental results, the learning rate, the number of iterations, and the batch size have been set at 0.00005, 150, and 32, respectively. The model is trained using the Adam optimizer. The input image is set to 256 × 256.
This section presents the evaluation and verification of the Lap-FEHRNet model using two independent datasets. The effectiveness, diagnostic performance, robustness, and generalization ability of the model are verified through ablation experiments, comparison experiments, and generalization experiments. All experiments are conducted in Python 3.8 and PyTorch 2.2.1, with a NVIDIA GeForce RTX 4060 GPU, a Graphics card with 8 GB of memory, i7 processor.
4.1 Crop Classification Dataset
To ascertain the efficacy of Lap-FEHRNet in the classification of crop images, the publicly available crop image data released on the Kaggle official website is employed for model verification. This data is divided into five categories: jute, corn, rice, sugar cane, and wheat. The original data set is illustrated in Fig. 11.
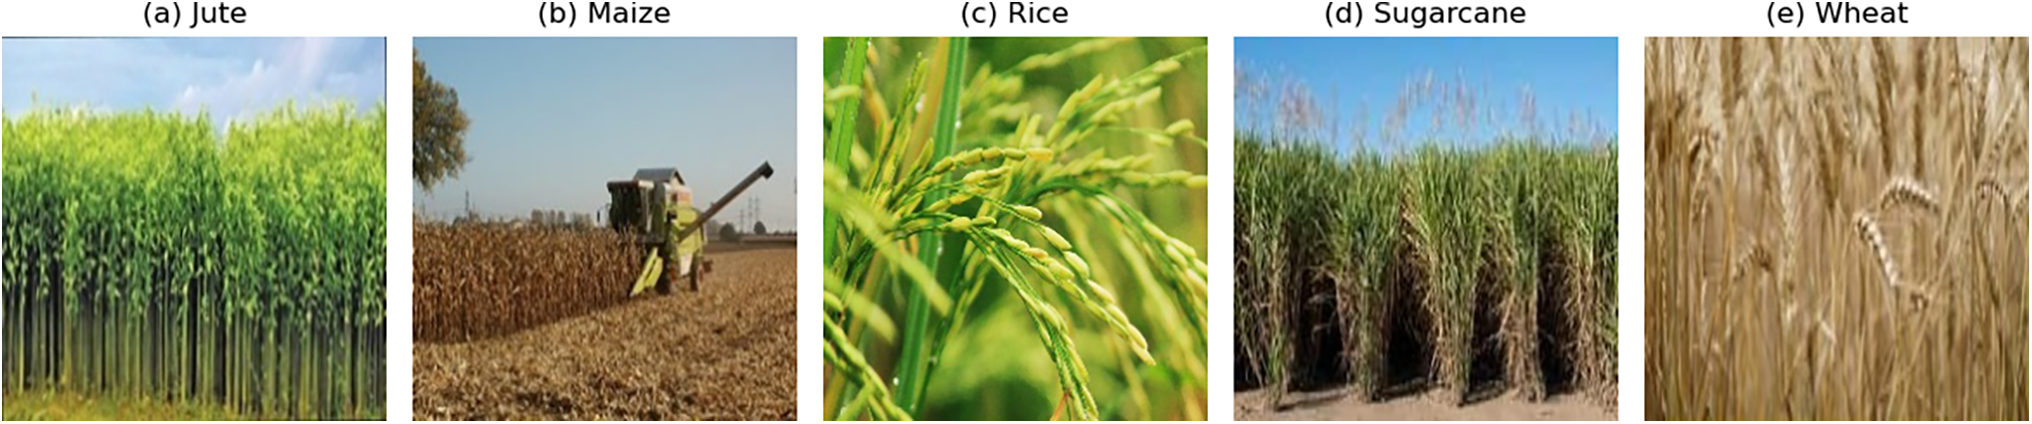
Figure 11: Original crop dataset
Due to the limited size of the original dataset, data enhancement was conducted to prevent overfitting and other issues. Operations such as mirroring, horizontal or vertical shifting, and rotation with random angles were performed to increase the number of images from 40 per category in the original dataset to 160.
In the image reconstruction section, the network performs reconstruction on the original crop images over a total of 150 iterations. Each iteration generates a corresponding loss of the validation set, with the validation set used solely for testing and not involved in training. The iteration with the lowest validation loss is selected, and the corresponding network parameters are saved. These weights are then utilized to reconstruct the experimental image dataset, achieving high-definition enhancement and denoising of low-resolution images. The evaluation of image quality is based on three indicators: Noise Variance, Signal to Noise Ratio (SNR), and Peak Signal to Noise Ratio (PSNR).
The formula for Noise Variance is:
where
SNR is used to quantify the ratio of signal to noise, indicating the relationship between the intensity of the image signal and the intensity of the noise. A higher SNR value corresponds to better image quality and reduced noise. The formula for SNR is:
where
PSNR measures the ratio of peak signal to noise in an image, commonly used to assess the quality of compressed or reconstructed images. The formula for PSNR is:
where
The formula for MSE is:
where
Using the rice image as an example, Fig. 12 illustrates the comparison between the original data image and the reconstructed data image. Table 2 presents a comparative summary of the original and reconstructed image data.
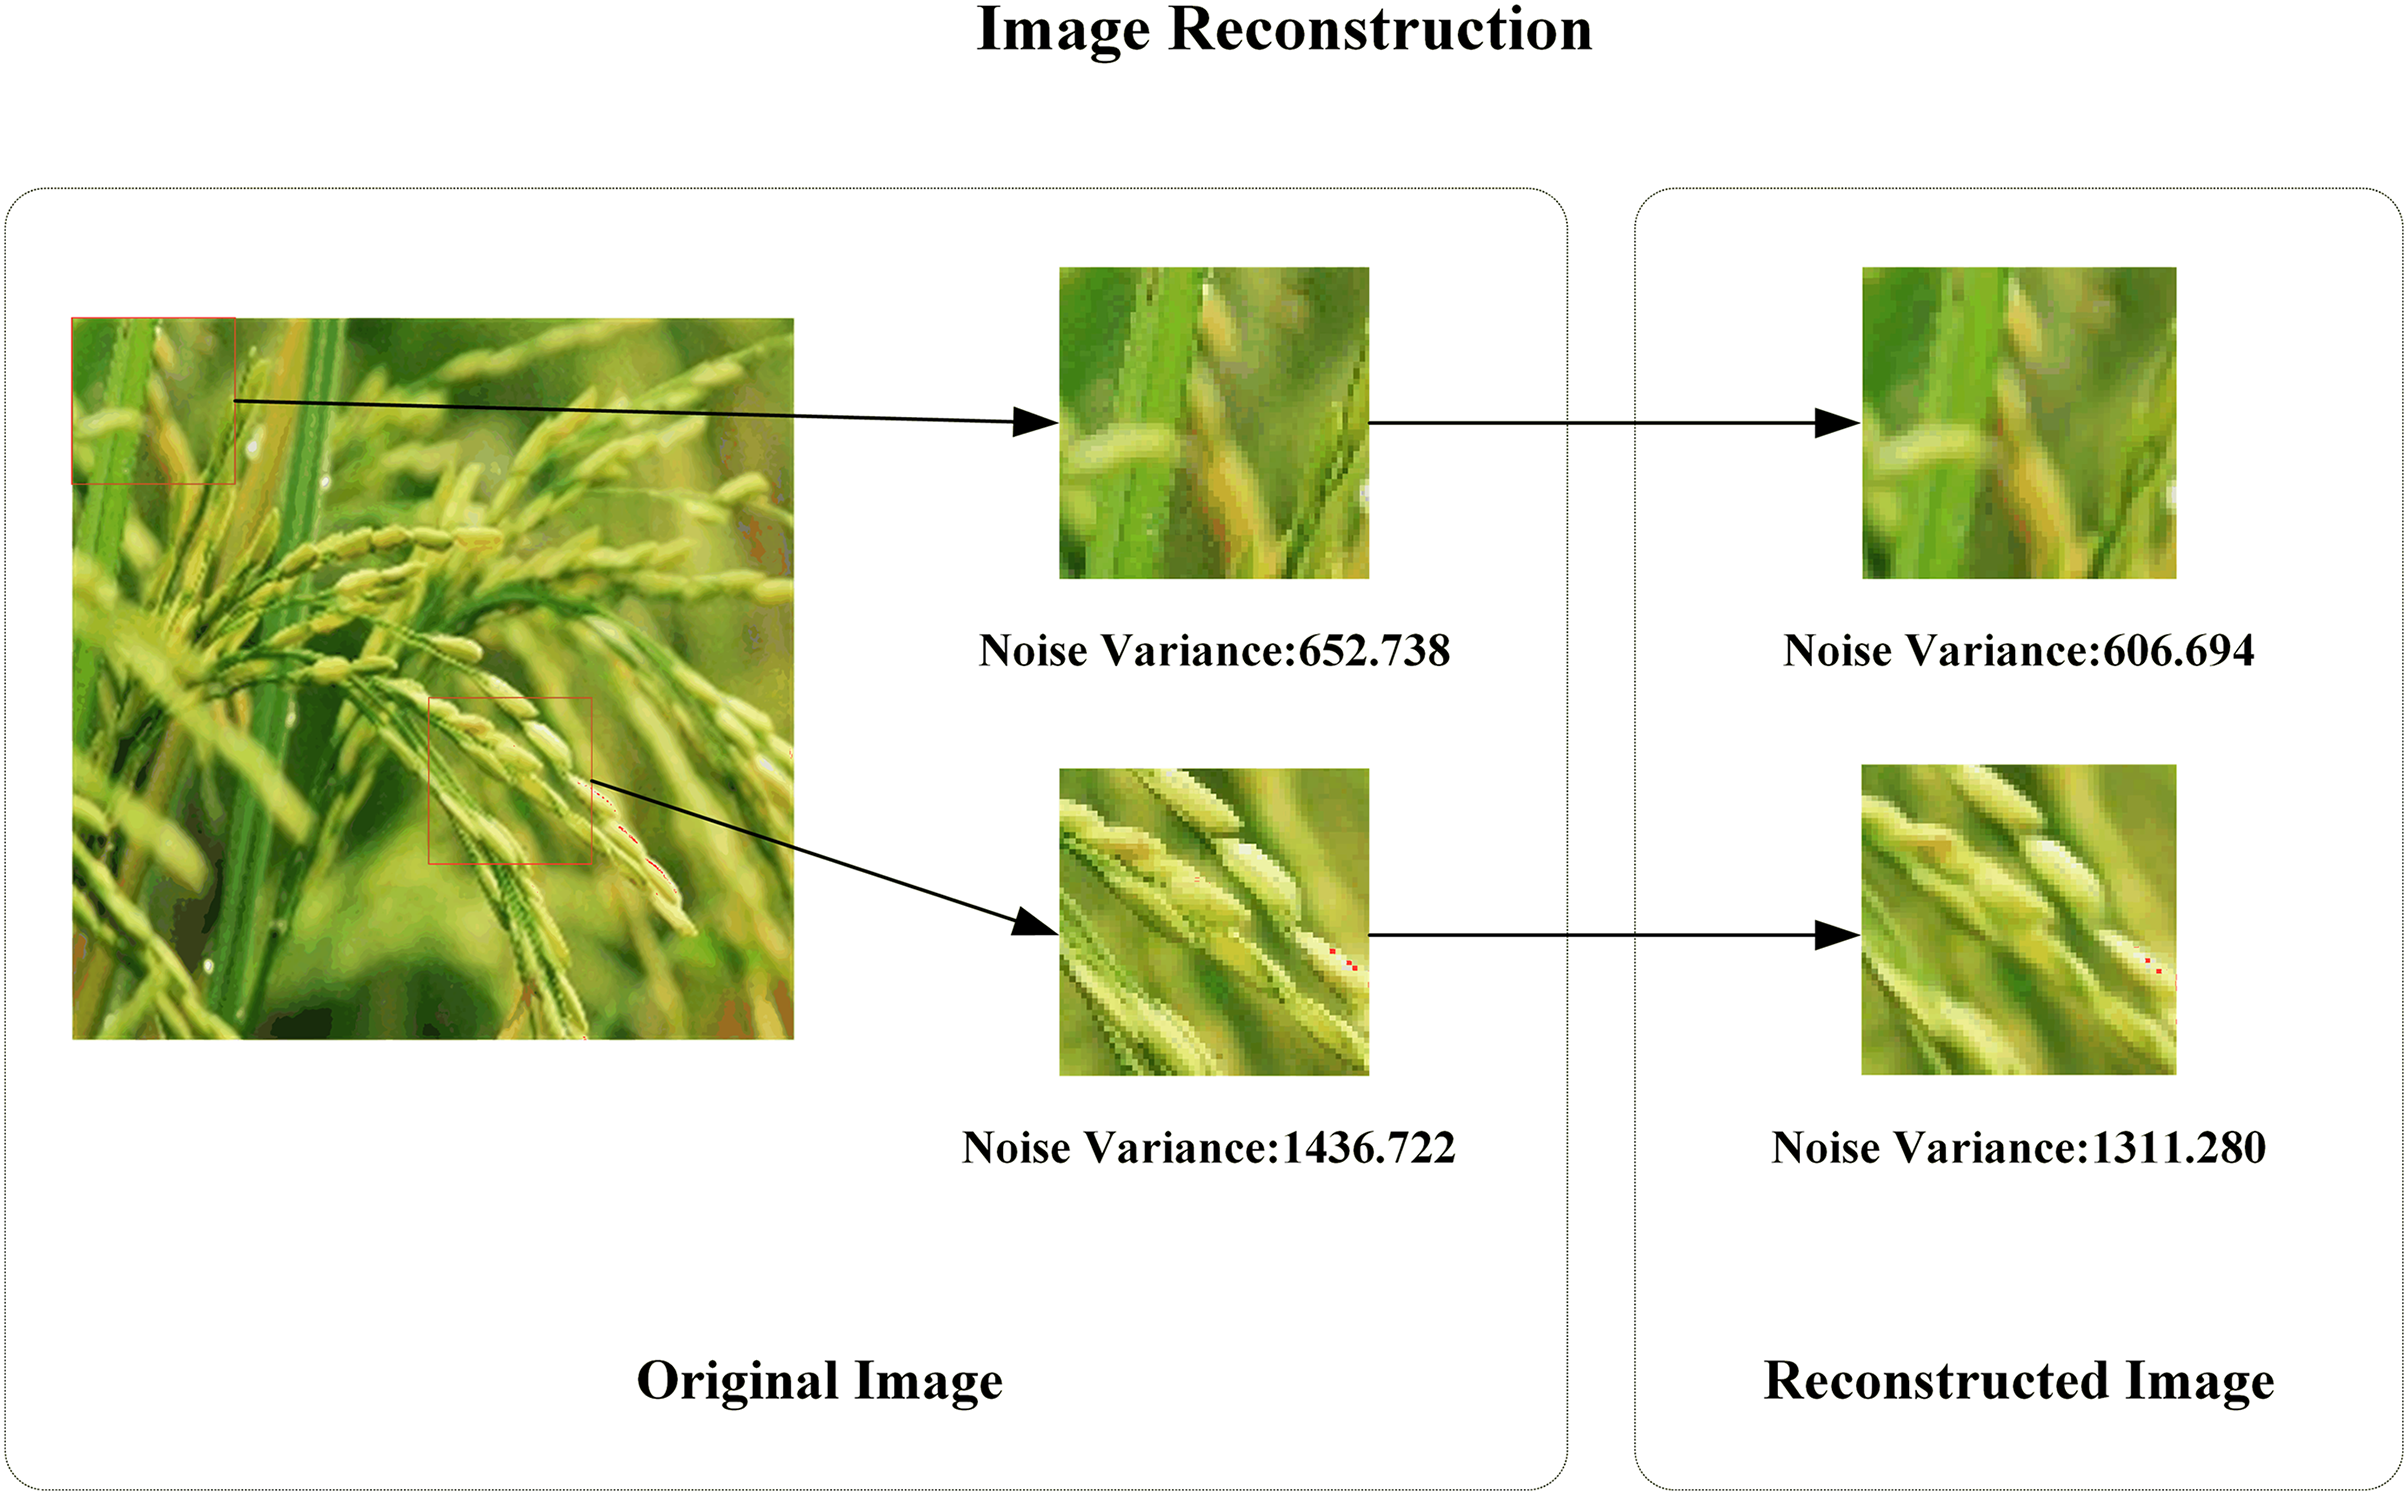
Figure 12: Comparison of the original crop image and the reconstructed image

As illustrated in Fig. 12 and Table 2, the overall image clarity will be enhanced, and the presence of noise will be diminished. From a local standpoint, the noise variance decreases after the original image is reconstructed, suggesting that the original image contains more noise. In contrast, the reconstructed image displays a reduction in noise and a relatively smoother appearance. Concerning the SNR indicator, the reconstructed image exhibits a slight increase in SNR compared to the original image. This suggests that the reconstructed image displays enhanced denoising and smoothness properties compared to the original image. The PSNR value greater than 30 dB signifies that the reconstructed image is of superior quality. Consequently, LapSRN is capable of effectively upscaling and denoising images, rendering image edges more natural and detail transitions smoother.
To evaluate the computational efficiency and reconstruction quality of the LapSRN model, a comparative experiment was conducted. The classical super-resolution reconstruction network SRCNN [32] and the Enhanced Deep Super-Resolution Network (EDSR) [33] were selected as reference models. Among them, SRCNN, as the earliest proposed deep learning super-resolution method, has a simple network structure, a small number of parameters, and a low computational complexity, which enables fast inference. EDSR, as a typical deep residual network model, learns richer and more detailed crop image texture information by removing the batch normalization (BN) layer, thus improving its reconstruction quality. The comparative experimental data of the reconstructed network are shown in Table 3.

From the evaluation metrics in Table 3, LapSRN shows obvious performance advantages over other models. Although SRCNN has a low parameter of 0.28 MB, its PSNR of 16.69 dB severely limits its practical application in high-quality super-resolution tasks. On the contrary, EDSR has the highest PSNR of 32.7 dB, but with high computational cost, a large number of model parameters, and increased inference time. LapSRN achieves a good balance between performance and computational efficiency. While significantly reducing the model complexity, the PSNR of LapSRN reaches 31.51 dB, which fully demonstrates its competitiveness in the task of super-resolution reconstruction of crop images. In addition, LapSRN achieves a prediction time of only 2.21 ms, reducing computational requirements by approximately 63.2% compared to EDSR. Consequently, in practical application scenarios, LapSRN offers a more favorable balance between image quality and processing speed. Furthermore, it requires fewer parameters, making it more suitable for deployment in real-world environments. Therefore, LapSRN is selected as the benchmark model for crop image reconstruction in this study.
To validate the rationality of the Lap-FEHRNet model, the contribution of its components to overall performance is explored. This section involves a reduction of the model’s components, resulting in a total of four different models.
Model 1: The Lap-FEHRNet model proposed in this paper.
Model 2: The LapSRN module is removed from Model 1, denoted as nHRNET_SA_CA in the experiment.
Model 3: The channel attention feature selection module is removed from Model 2, represented as nHRNET_SA in the experiment.
Model 4: The spatial attention-based shallow feature fusion module is removed from Model 3, referred to as HRNET in the experiment.
The ablation experiments were performed five times for each of the four classes of models, and the average experimental data was taken. The loss plots and accuracy curves for the four classes of models are shown in Fig. 13a,b. Fig. 14 and Table 4 show the average data from the five ablation experiments, which include the average accuracy, average overall accuracy, and standard deviation of each classification for the five experiments.
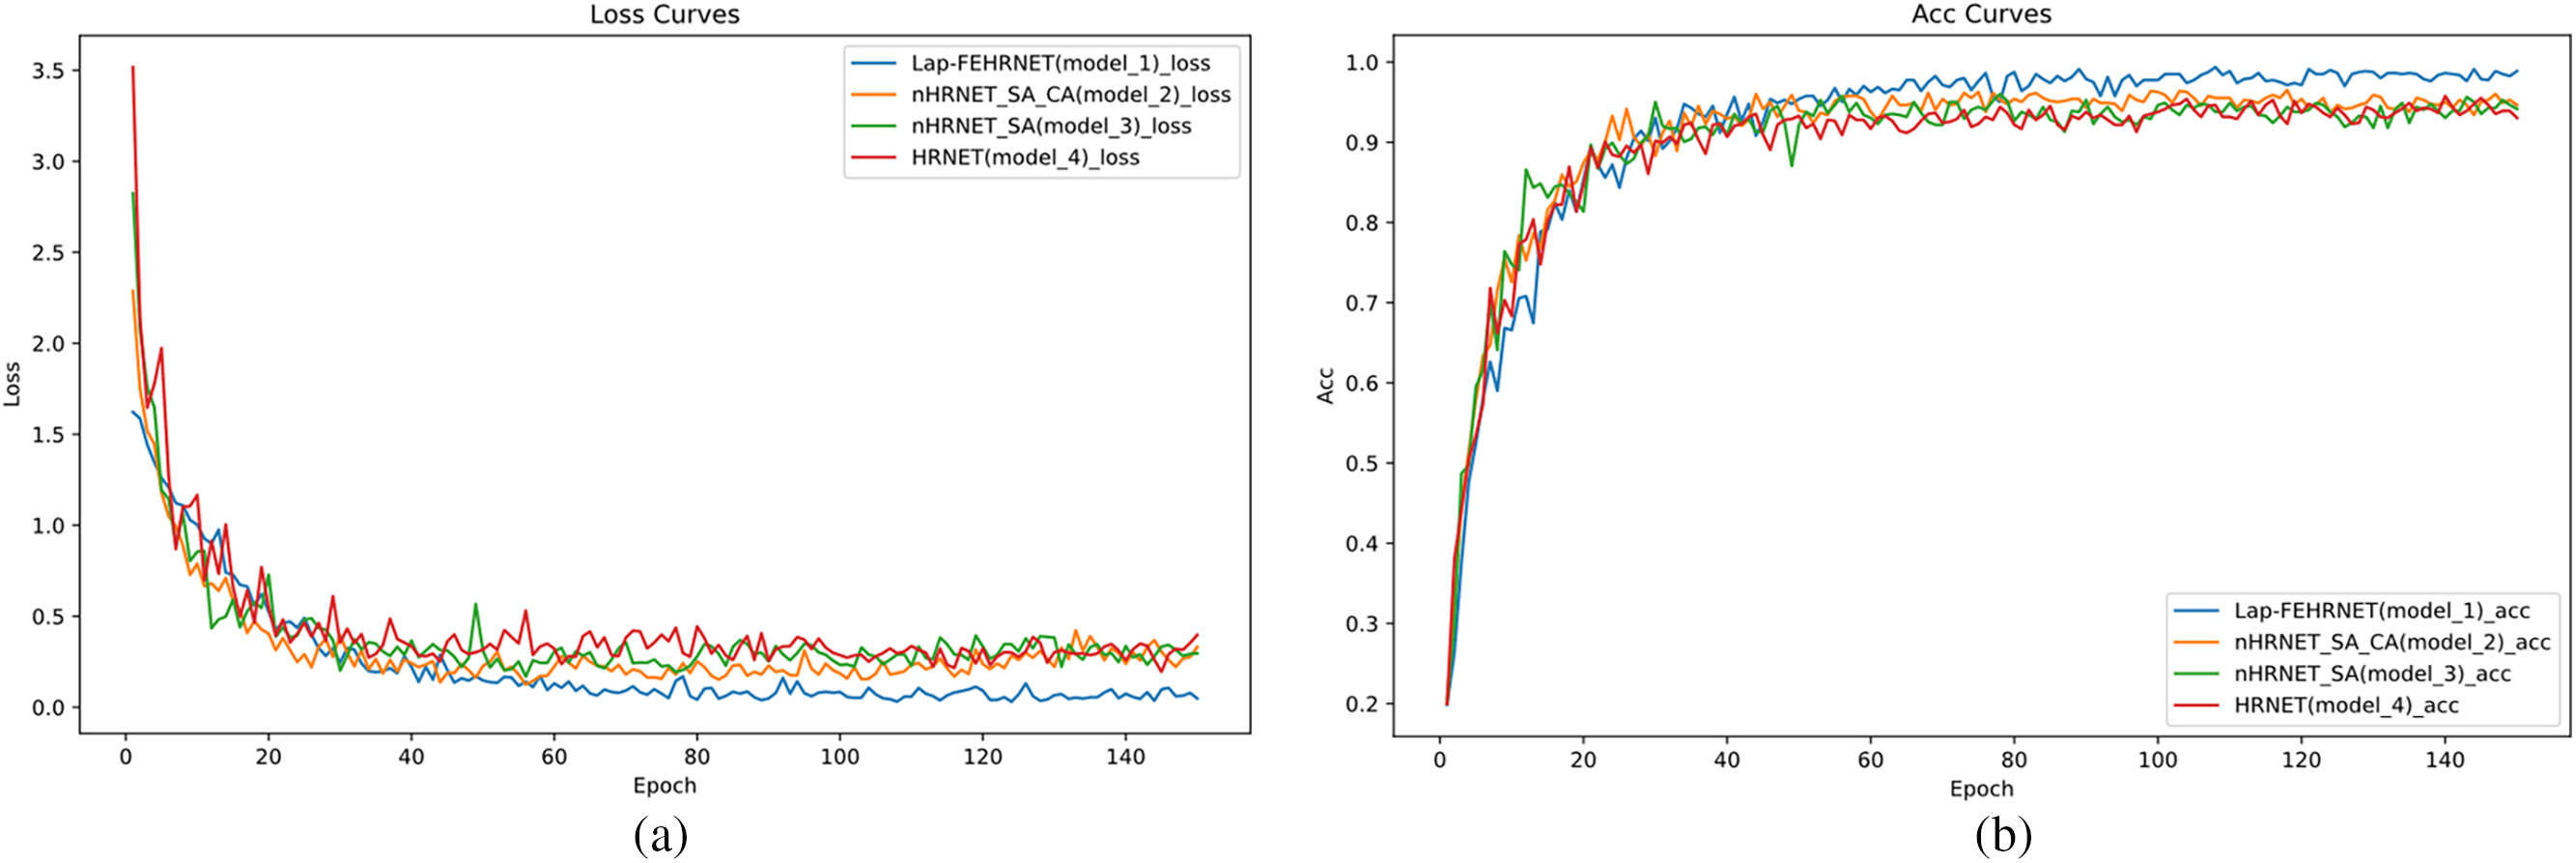
Figure 13: The loss and accuracy curves for the four models. (a) Loss; (b) Accuracy
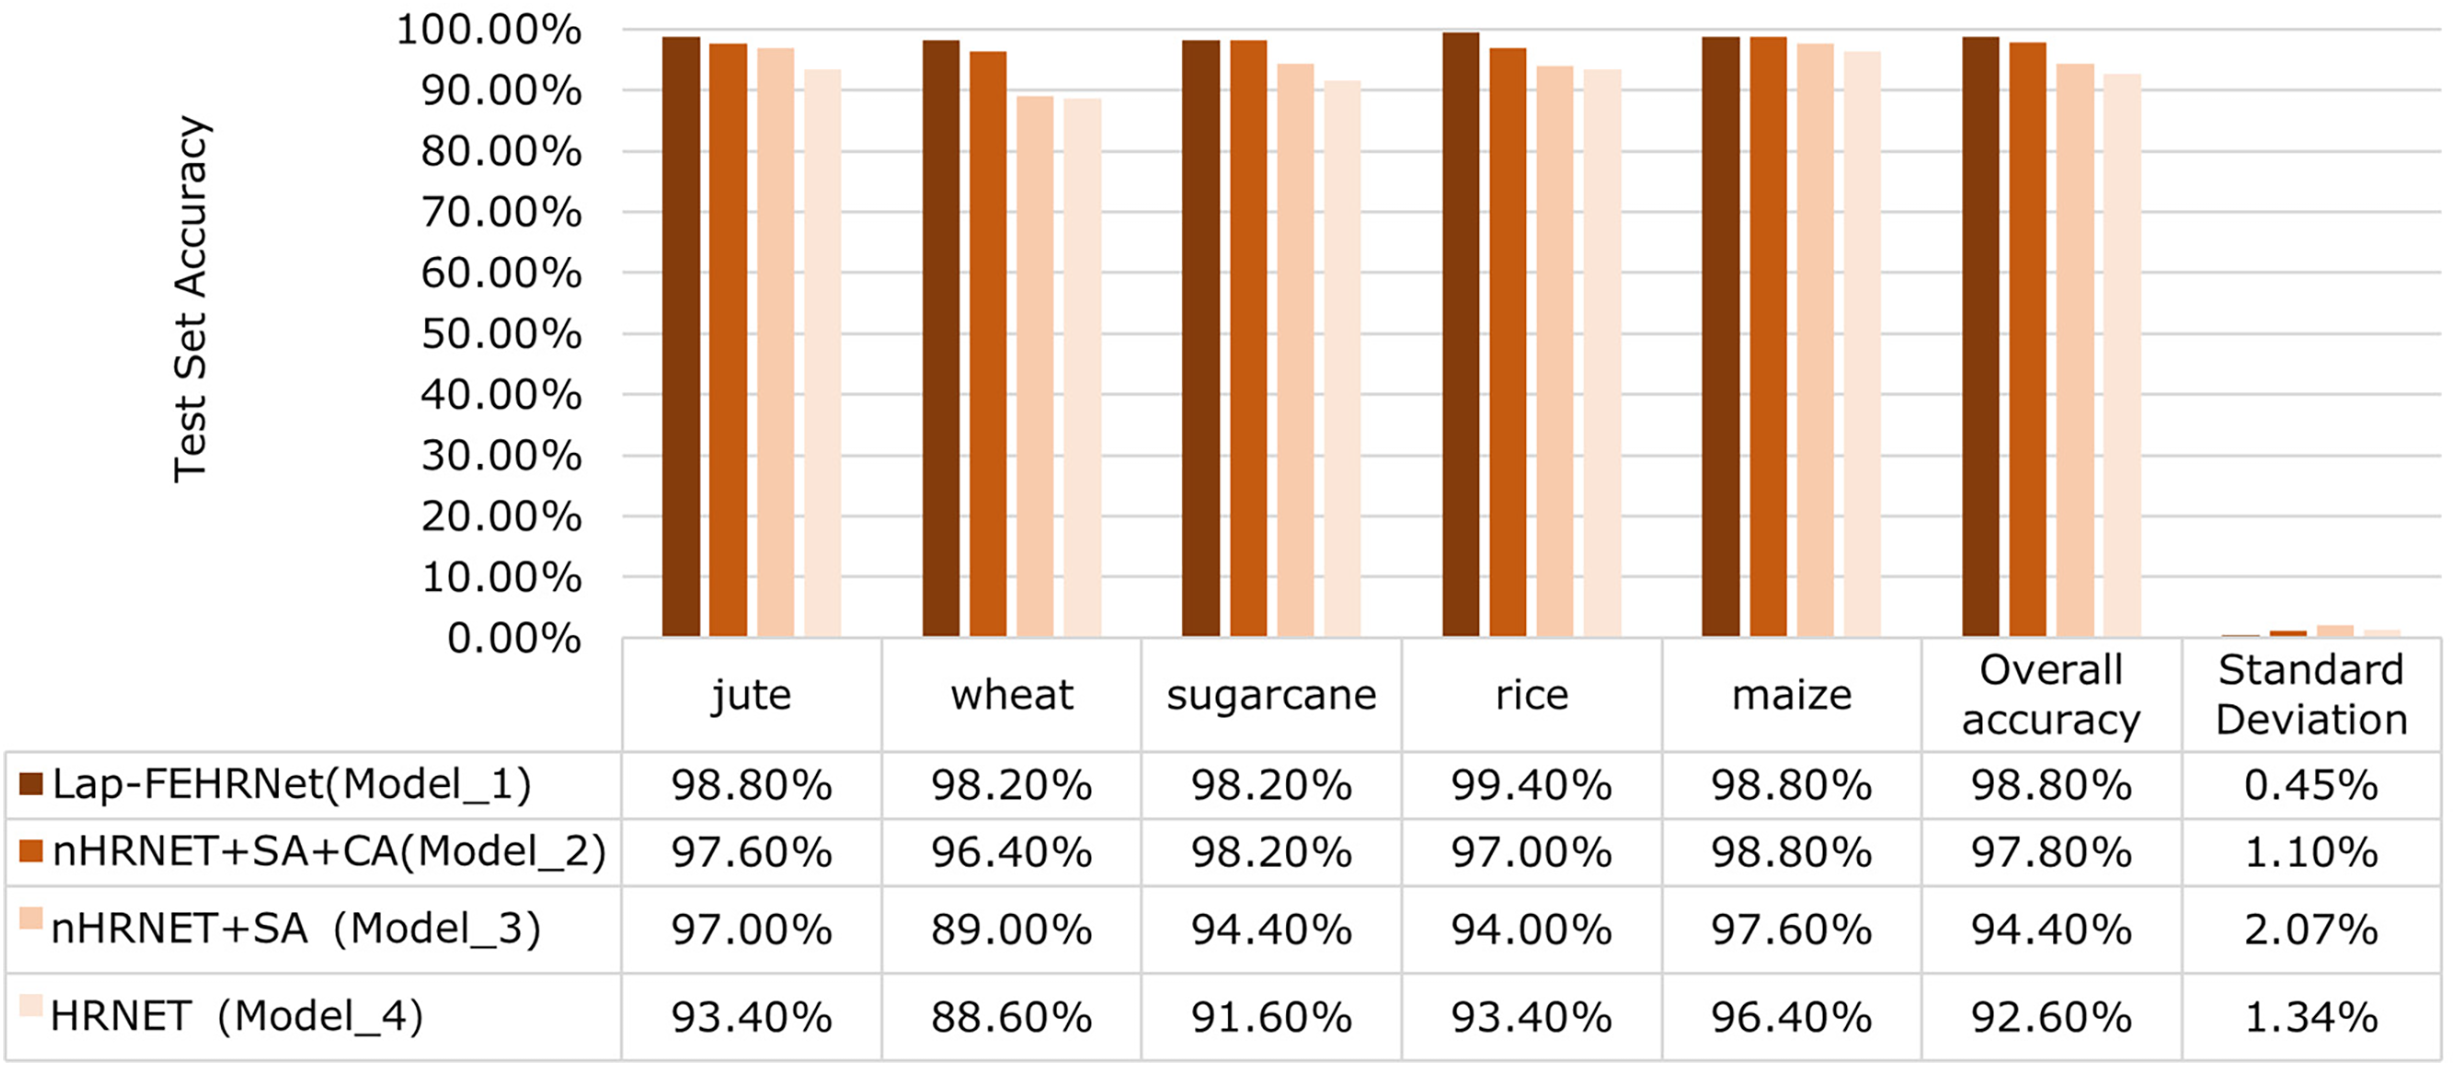
Figure 14: The average data from five ablation experiments

As shown in Figs. 13 and 14, and Table 4, Model 1 (Lap-FEHRNet) has smaller loss values and higher accuracy compared to other models, and the standard deviation is low, indicating that the model performance is relatively stable. The average accuracy of a single category in the five experiments can be maintained above 98%. These results show that the Lap-FEHRNet model proposed is reasonable and effective.
Comparing Model 1 (Lap-FEHRNet) and Model 2 (nHRNET_SA_CA), it can be seen that Model 1 has a higher classification accuracy on average than Model 2. After removing the image reconstruction module, the classification accuracy of Model 2 is about 1 percentage point lower than that of Model 1. In contrast, except for sugarcane and maize, Model 2’s classification accuracy is lower than Model 1. Specifically, its accuracy for rice is 2.4 percentage points lower. There was also a difference of 0.65% in the standard deviation, indicating that the stability of Model 2 was also worse than Model 1. Therefore, LapSRN has a positive effect on improving the model’s classification of low-resolution images.
Comparing Model 2 (nHRNET_SA_CA) with Model 3 (nHRNET_SA), it can be observed that Model 2 exhibits a more stable accuracy curve and superior performance compared to Model 3. The overall accuracy of Model 2 reaches 97.8%, while the standard deviation is reduced from 2.07% to 1.1%, demonstrating an improvement in stability over Model 3. In terms of single-category classification, Model 2 improves the classification accuracy of wheat and sugarcane to 96.4% and 98.2%, respectively, which is elevated by 7.4 percentage points and 3.8 percentage points, while the classification accuracies of Model 2 for other crops have remained high. It can be concluded that the channel attention module enhances the ability to extract image features, improves the model’s performance, and significantly impacts the overall classification task.
The comparison of Model 3 (nHRNET_SA) and Model 4 (HRNET) reveals that while Model 3 demonstrates diminished stability, there is a discernible enhancement in the overall accuracy. As illustrated in the loss curve, the decline in performance of Model 3 occurs faster than that of Model 4. About the accuracy curve, the overall accuracy is enhanced, although fluctuations are still evident, with slight increases and decreases in the curve in the vicinity of saturation. In terms of individual category classification, Model 3 has significantly improved the classification accuracy of jute from 93.4% to 97%, while the others are not much different from Model 4. It can be observed that the spatial attention module is effective for specific images, resulting in an overall improvement in accuracy.
Comparing and contrasting Model 1 (Lap-FEHRNet) and Model 4 (HRNET), it is evident that the performance of Model 4 is inferior to that of Model 1. Training accuracies and losses of Model 4 are more unstable, with a standard deviation of 1.34%, which is significantly higher than that of Model 1, and shows greater fluctuations in the curves than Model 1. Moreover, Model 4’s accuracy varies greatly by crop, especially for wheat and sugarcane, where it falls well below Model 1’s performance. This indicates inconsistent category-level results and certain limitations. Consequently, the integration of LapSRN, the channel attention module, and the spatial attention module together provides comprehensive improvements, significantly enhancing both the model’s stability and generalization.
To fully demonstrate the superiority and effectiveness of the proposed Lap-FEHRNet model a series of classic classification network models, namely Visual Geometry Group 16 (VGG16) [34], Google Inception Net (GoogleNet) [35], Residual Neural Network-18 layers (RESNet-18) [36], Residual Network-34 layers (RESNet-34) [36], Mobile Network (MobileNet) [37], etc., are selected for comparative experiments.
The specific descriptions of each model are given below:
The VGG16 model is a convolutional neural network model for image recognition tasks. The number “16” indicates that the model has 16 weighting layers. VGG16 achieves high classification accuracy by stacking small convolutional filters and max-pooling layers to extract image features layer by layer. Its small convolutional kernel stacking design makes it sensitive to detail changes and suitable for fine-grained feature extraction, such as crop disease spots and leaf texture.
The GoogleNet model is an image classification model that uses Inception modules to achieve multi-scale feature learning. Although GoogleNet has a depth of 22 layers, the 1 × 1 convolution operation in the Inception module greatly reduces the dimension of the feature map, thereby reducing the amount of computation and the number of parameters. At the same time, because different sizes of convolution kernels are used in parallel, multi-scale information can be captured in the same layer, and the recognition ability of the network is improved effectively. Therefore, it has an excellent performance in the field of image classification. As a result, the model is highly adaptable to the situation of complex backgrounds and morphological similarities among crops in field images.
The RESNet-18 model is a special neural network model that introduces residual blocks and skip connections. The number “18” indicates that the residual network has a total of 18 depth layers. The residual network uses residual blocks to pass the input directly to the output through shortcut connections, allowing the network to learn the residual between the input and output, effectively avoiding the problem of gradient disappearance and degradation in deep networks [38]. The RESNet-34 model only increases the depth to 34 layers, while the others remain the same as RESNet-18. In the crop image classification task, RESNet can effectively transfer feature information by introducing residual connections, helping the network learn deeper features as a way to classify crop images with complex backgrounds [39].
The MobileNet model is a lightweight convolutional neural network that can efficiently classify images. The V3 version was used in this comparative experiment, which further improves the efficiency and performance of the model by introducing neural architecture search, inverted residual blocks, SE modules, and h-swish activation functions. Therefore, the model is suitable for real-time crop identification tasks in resource-constrained environments.
In summary, VGG16, GoogleNet, RESNet-18, RESNet-34, and MobileNet-V3 represent the classical feature extraction model, structural innovation model, deep residual learning model, and lightweight deployment model in deep network architecture, respectively. They each have their advantages in terms of structural complexity, feature learning ability, and adaptation to deployment scenarios, and can evaluate the performance of the Lap-FEHRNet model in the crop image classification task from multiple dimensions. Therefore, in this study, these four representative convolutional neural network models are selected for comparative experiments, so that the advantages and disadvantages of different network structures in the scenario of agricultural image recognition can be comprehensively analyzed, and a basis can be provided for subsequent model optimization and practical deployment.
Through repeated experiments and parameter adjustments, the performance of each model was optimized. The crop dataset was used for model training, validation, and testing. The loss curves, accuracy curves, and comparative experimental data for each model are shown in Figs. 15 and 16, respectively. The specific comparison model parameters are shown in Tables 5 and 6.
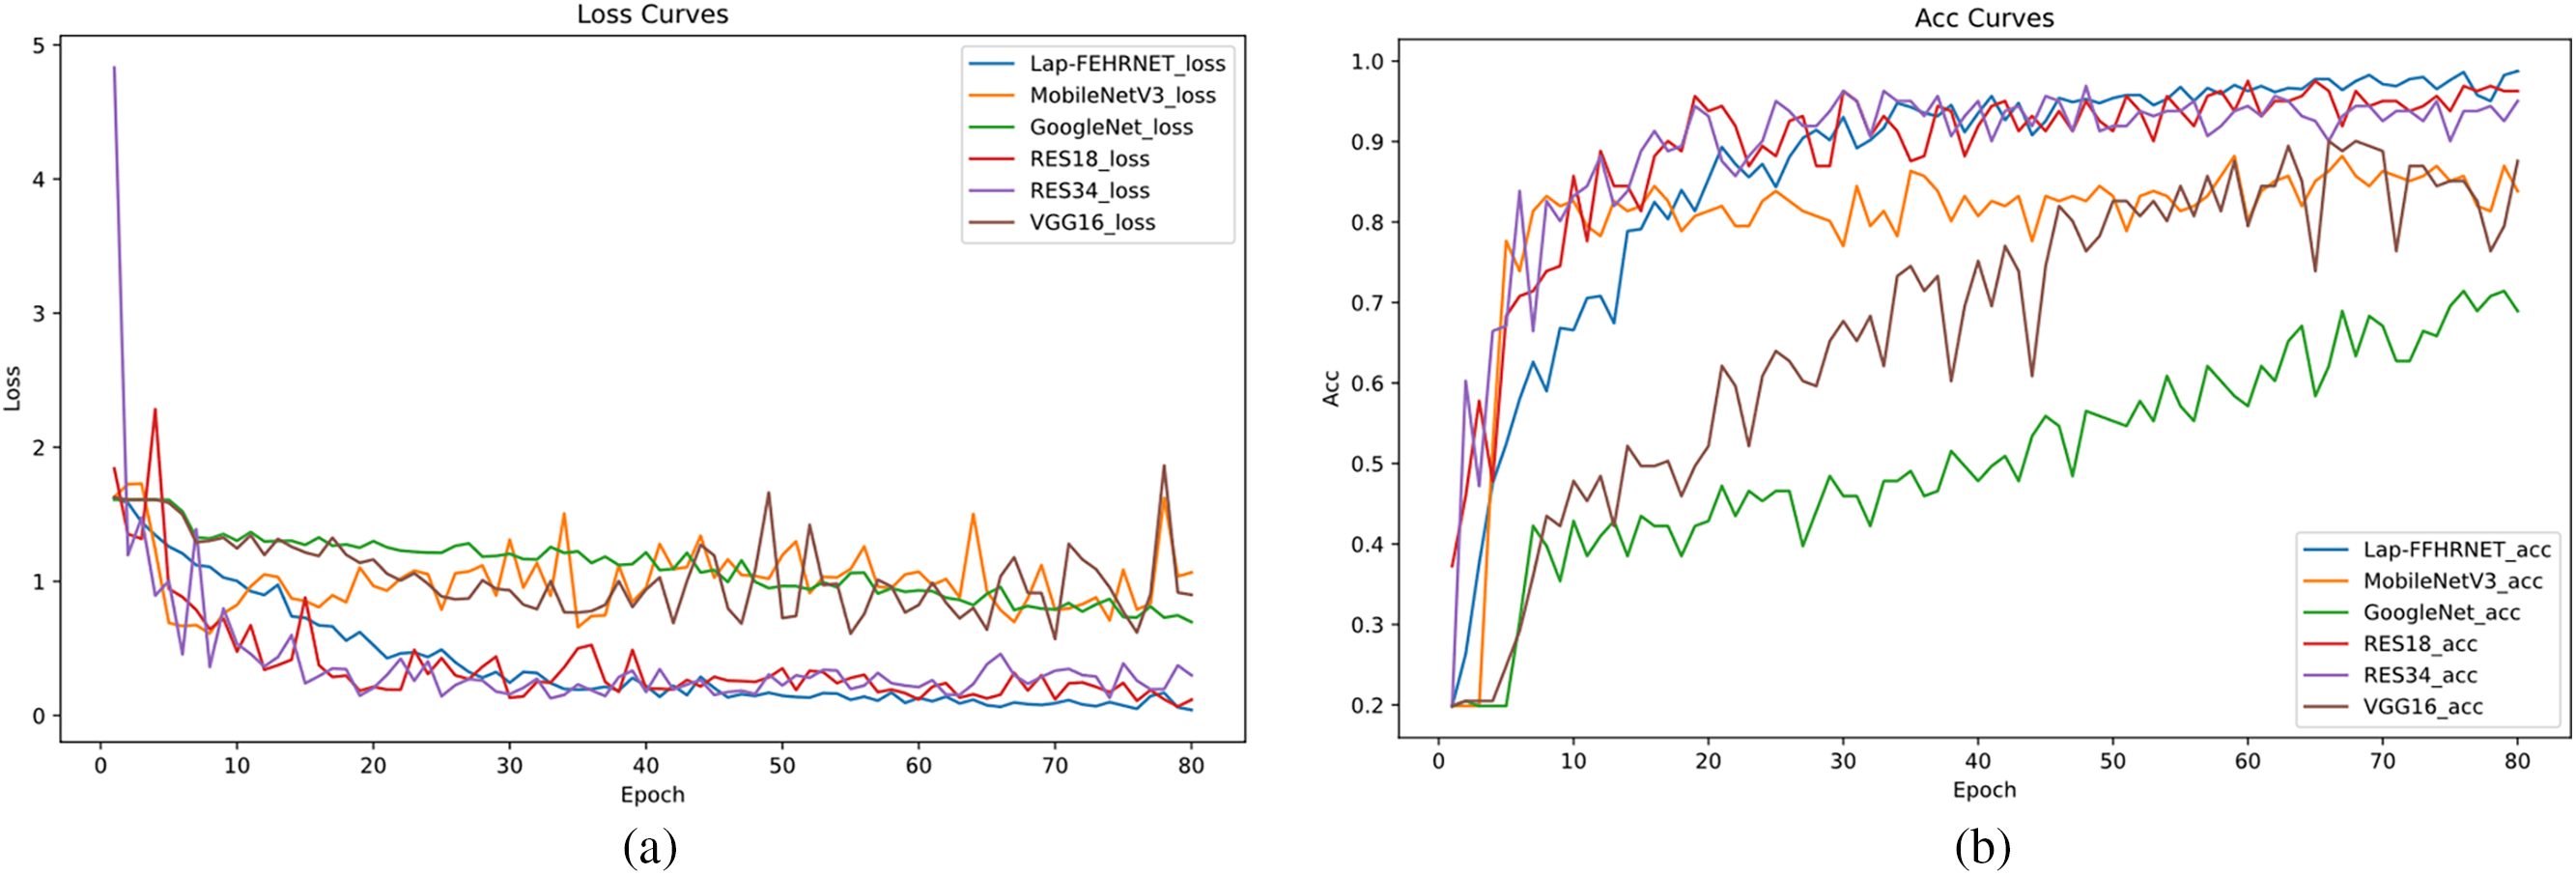
Figure 15: The loss and accuracy curves for comparison experiments. (a) Loss; (b) Accuracy
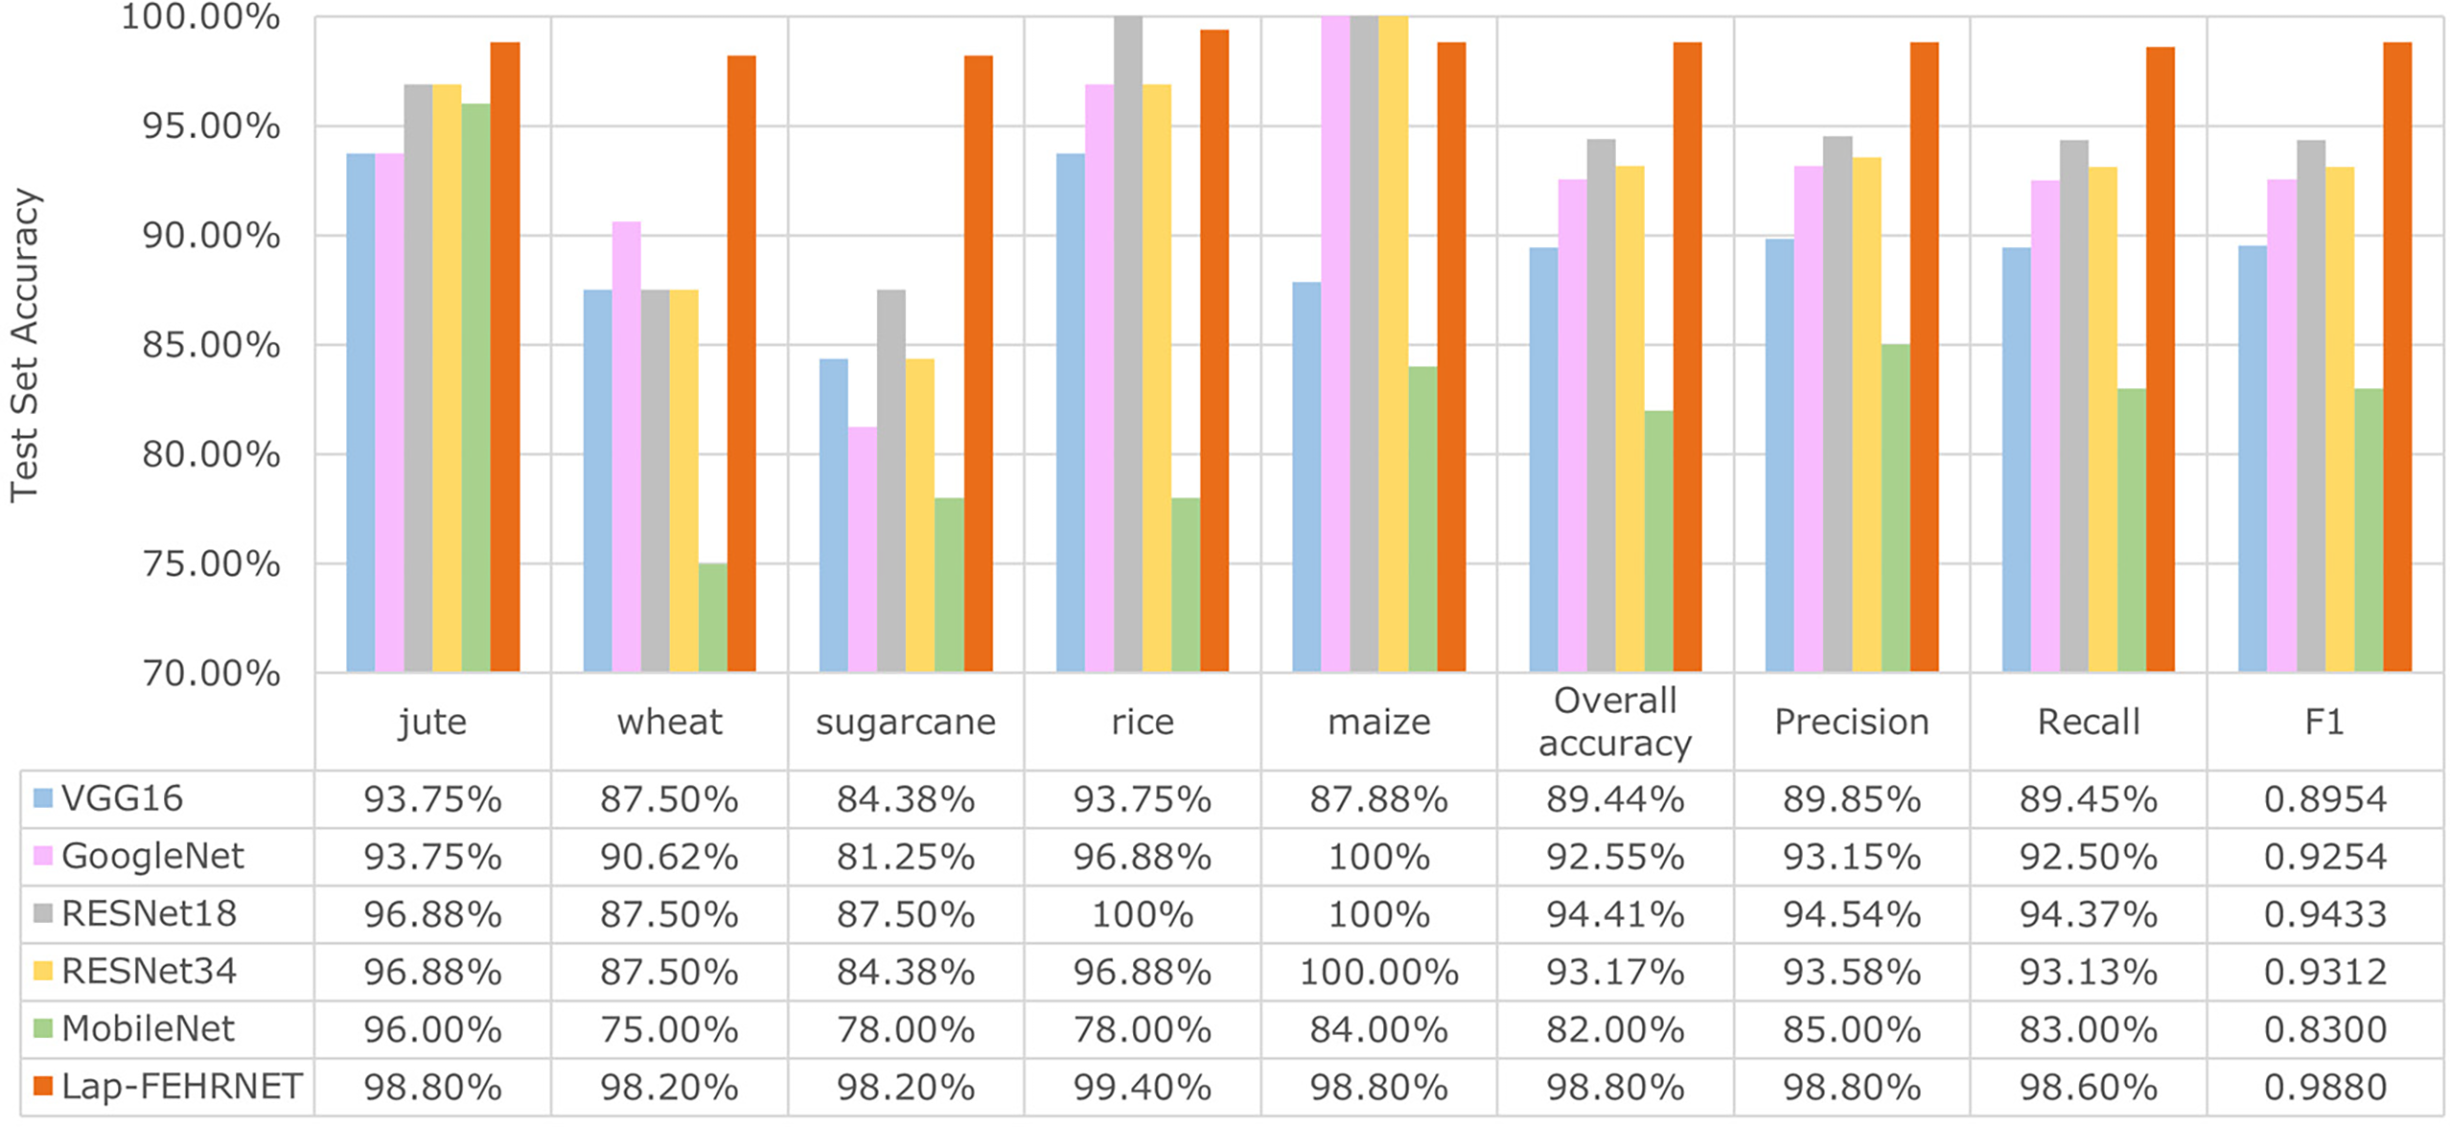
Figure 16: Comparison of experimental data


Figs. 15 and 16 demonstrate that the proposed Lap-FEHRNet model achieves fast convergence, high accuracy, and robust stability at each stage of training. Although the loss curves of RESNet18 and RESNet34 dropped very rapidly at the beginning, they fluctuated slightly in the later stages of training and were not as stable as the Lap-FEHRNet model. As shown in Fig. 16, the Lap-FEHRNet model achieves an accuracy of over 98% for each category, with evaluation indexes consistently at 0.98. These results indicate that the proposed Lap-FEHRNet model outperforms other models in terms of stability and accuracy.
As shown in Table 5, FEHRNet achieves superior performance compared to the classical convolutional neural network model in the crop image classification task when using original input images. In terms of accuracy, FEHRNET has the highest classification accuracy of 97.8%, which is significantly better than other models. Although the parameter size of FEHRNet is slightly larger than that of MobileNet and GoogleNet, it remains significantly smaller than that of large-scale models such as VGG16 and RESNet-34. This result indicates a well-achieved balance between model complexity and accuracy. In terms of prediction speed, the prediction time of FEHRNet is better than that of RESNet34 and VGG16, it can meet the requirements of some real-time applications.
As shown in Table 6, Lap-FEHRNet also outperforms the classical convolutional neural network model when reconstructed input images are used in the crop image classification task. Lap-FEHRNet demonstrated high accuracy (98.80%), moderate model size (43.47 MB), and reasonable prediction time (2.62 ms). Thus, Lap-FEHRNet provides a favorable integrated solution for crop classification scenarios requiring high accuracy and moderate computational power.
4.5.1 Rice Leaf Disease Dataset
To thoroughly investigate the model’s performance under different data sizes and complexities, generalization experiments were designed spanning two stages: from the initial five-category crop images to the more challenging ten-category rice disease images. Detailed information on the dataset comparisons is provided in Table 7.

As shown in Table 7, the crop classification dataset was augmented to 160 samples per class using a series of augmentation strategies such as mirroring, panning, and rotating. In the generalization experiment, a highly complex dataset containing images of rice leaf diseases with 10 categories was introduced. Compared with the crop classification dataset, the number of categories in this new dataset has doubled, and the amount of data has expanded tenfold. In addition, it poses greater challenges in terms of image quality, inter-category similarity, and related factors. The specific categories and their corresponding symbols are shown in Fig. 17.
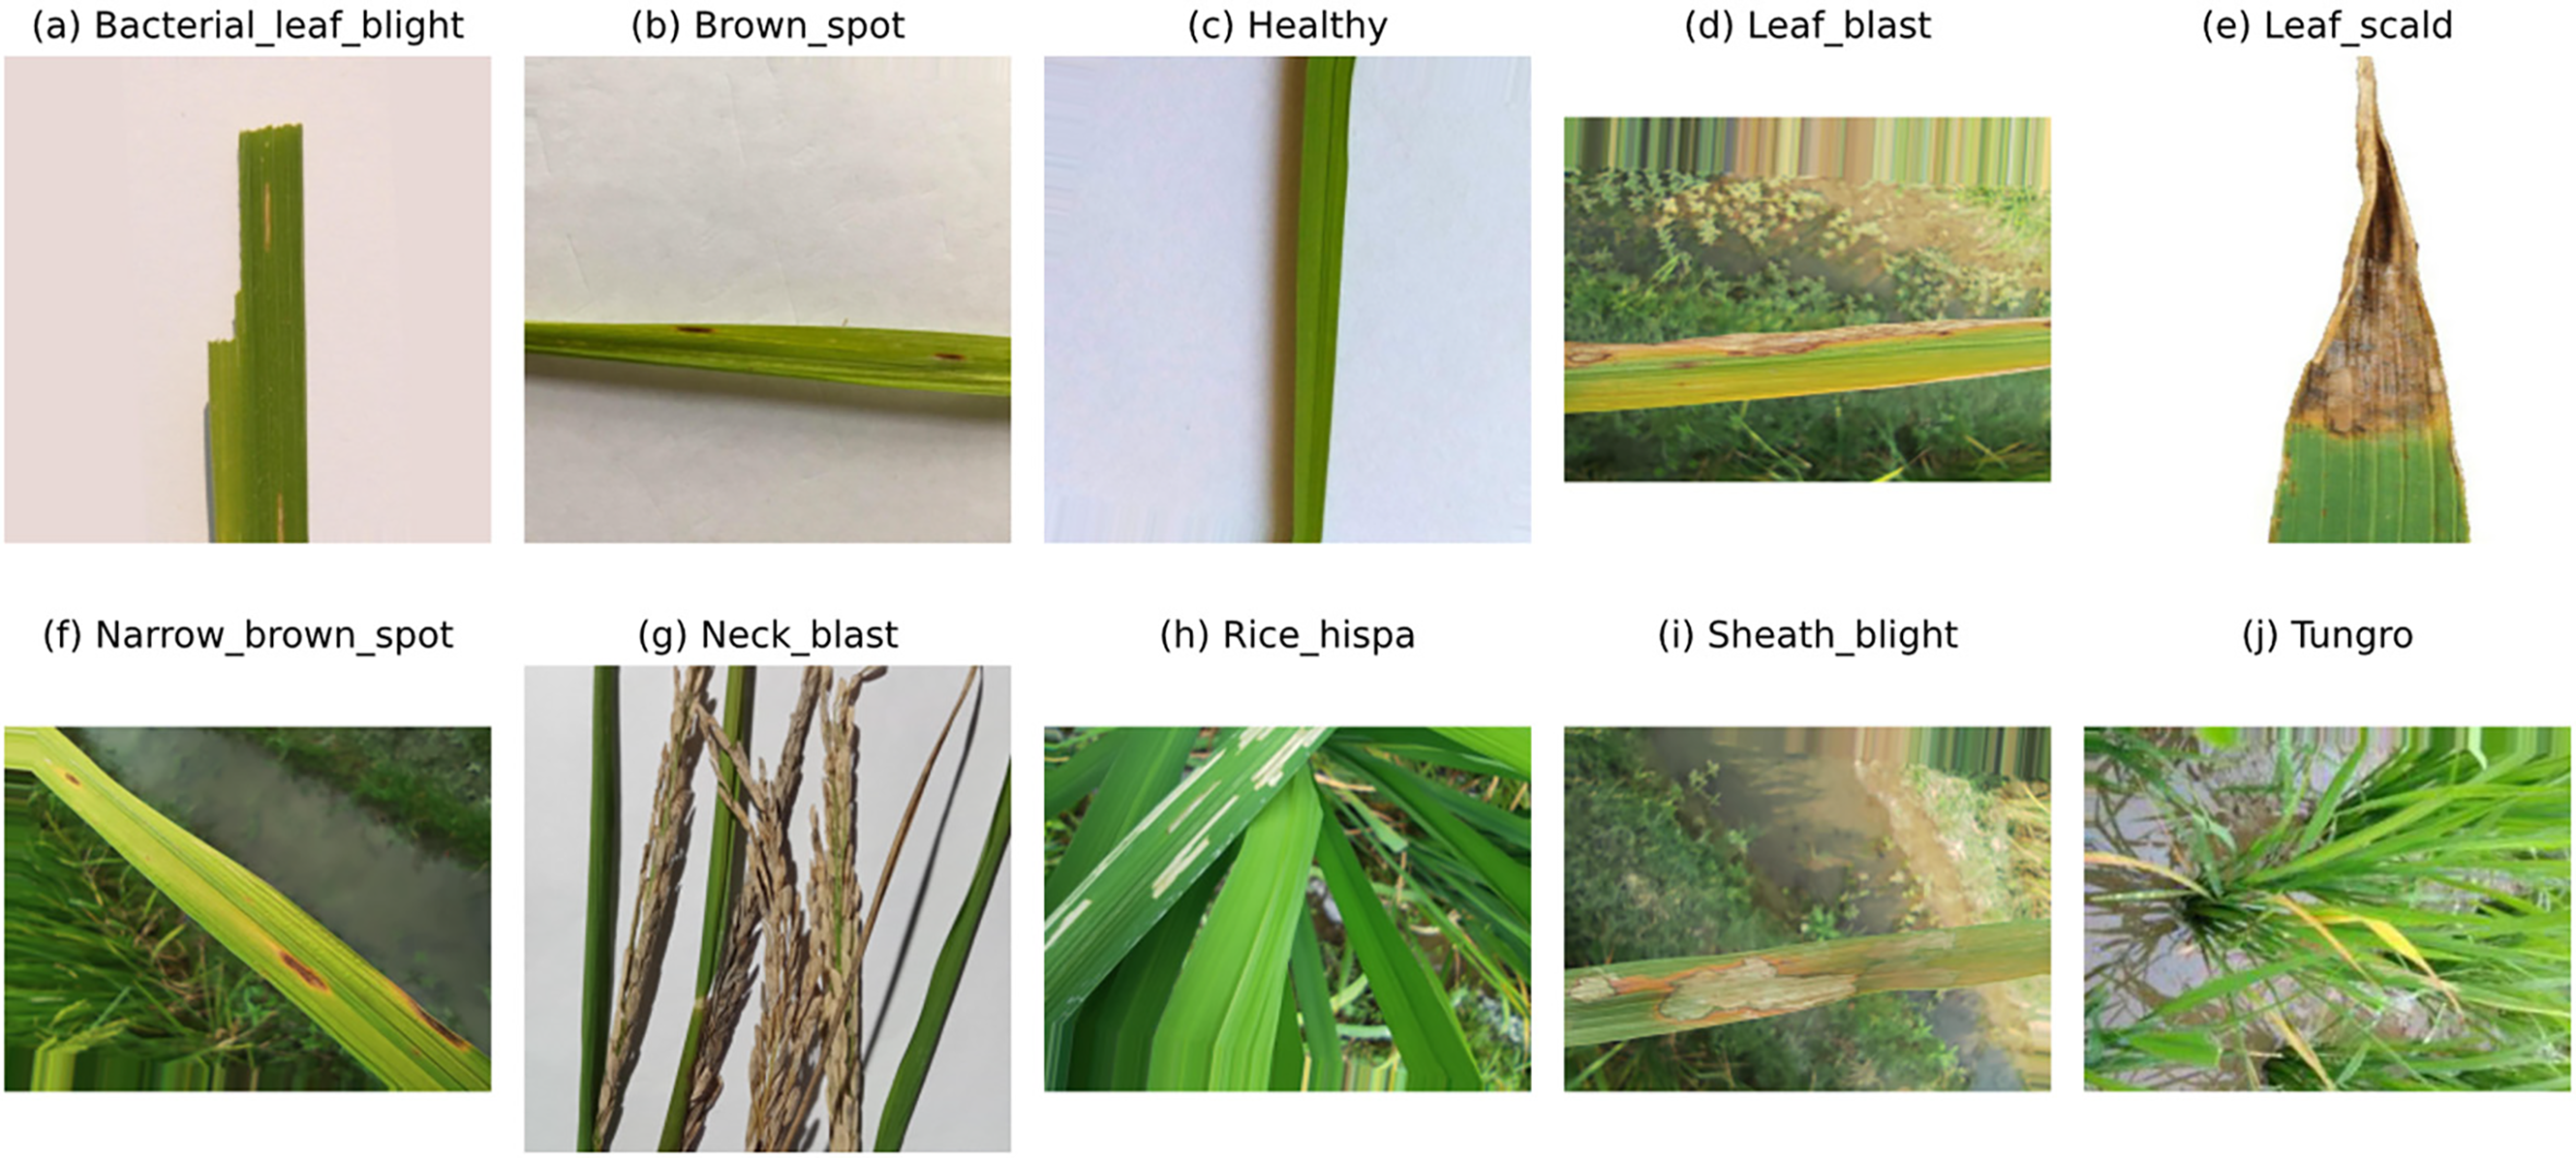
Figure 17: Rice leaf disease dataset
As can be seen in Fig. 17, the image quality of this dataset varies, with both high and low-resolution images. A closer look at the data graph shows that some categories have very similar features, such as “Brown_spot” Fig. 17b and “Narrow_brown_spot” Fig. 17f.
4.5.2 Generalization Experiment
The comparative experiments compare the advantages and disadvantages of the proposed Lap-FEHRNet model with other models. The loss curves, accuracy curves, and generalization experiment data of each model are shown in Figs. 18 and 19, respectively.
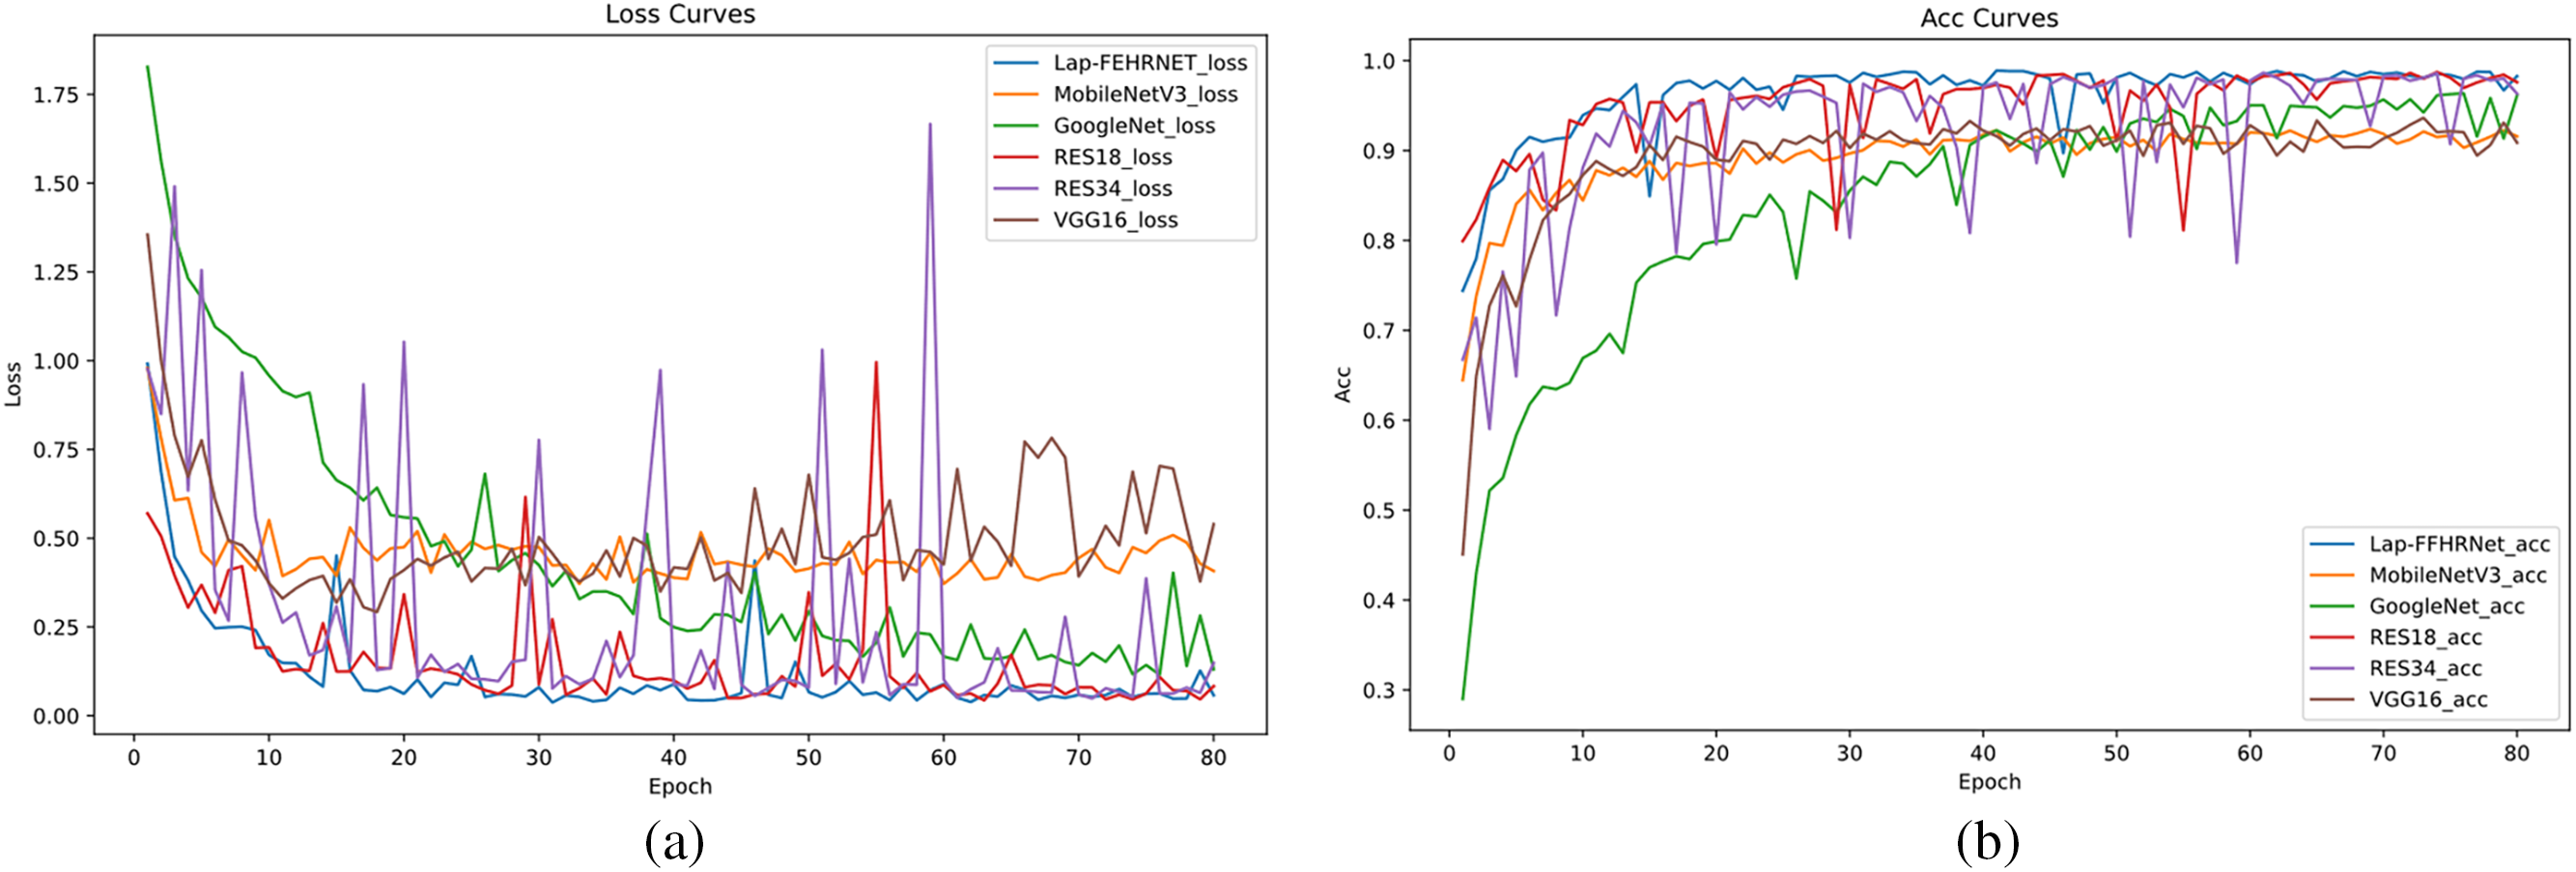
Figure 18: The loss and accuracy curves for generalization experiments. (a) Loss; (b) Accuracy
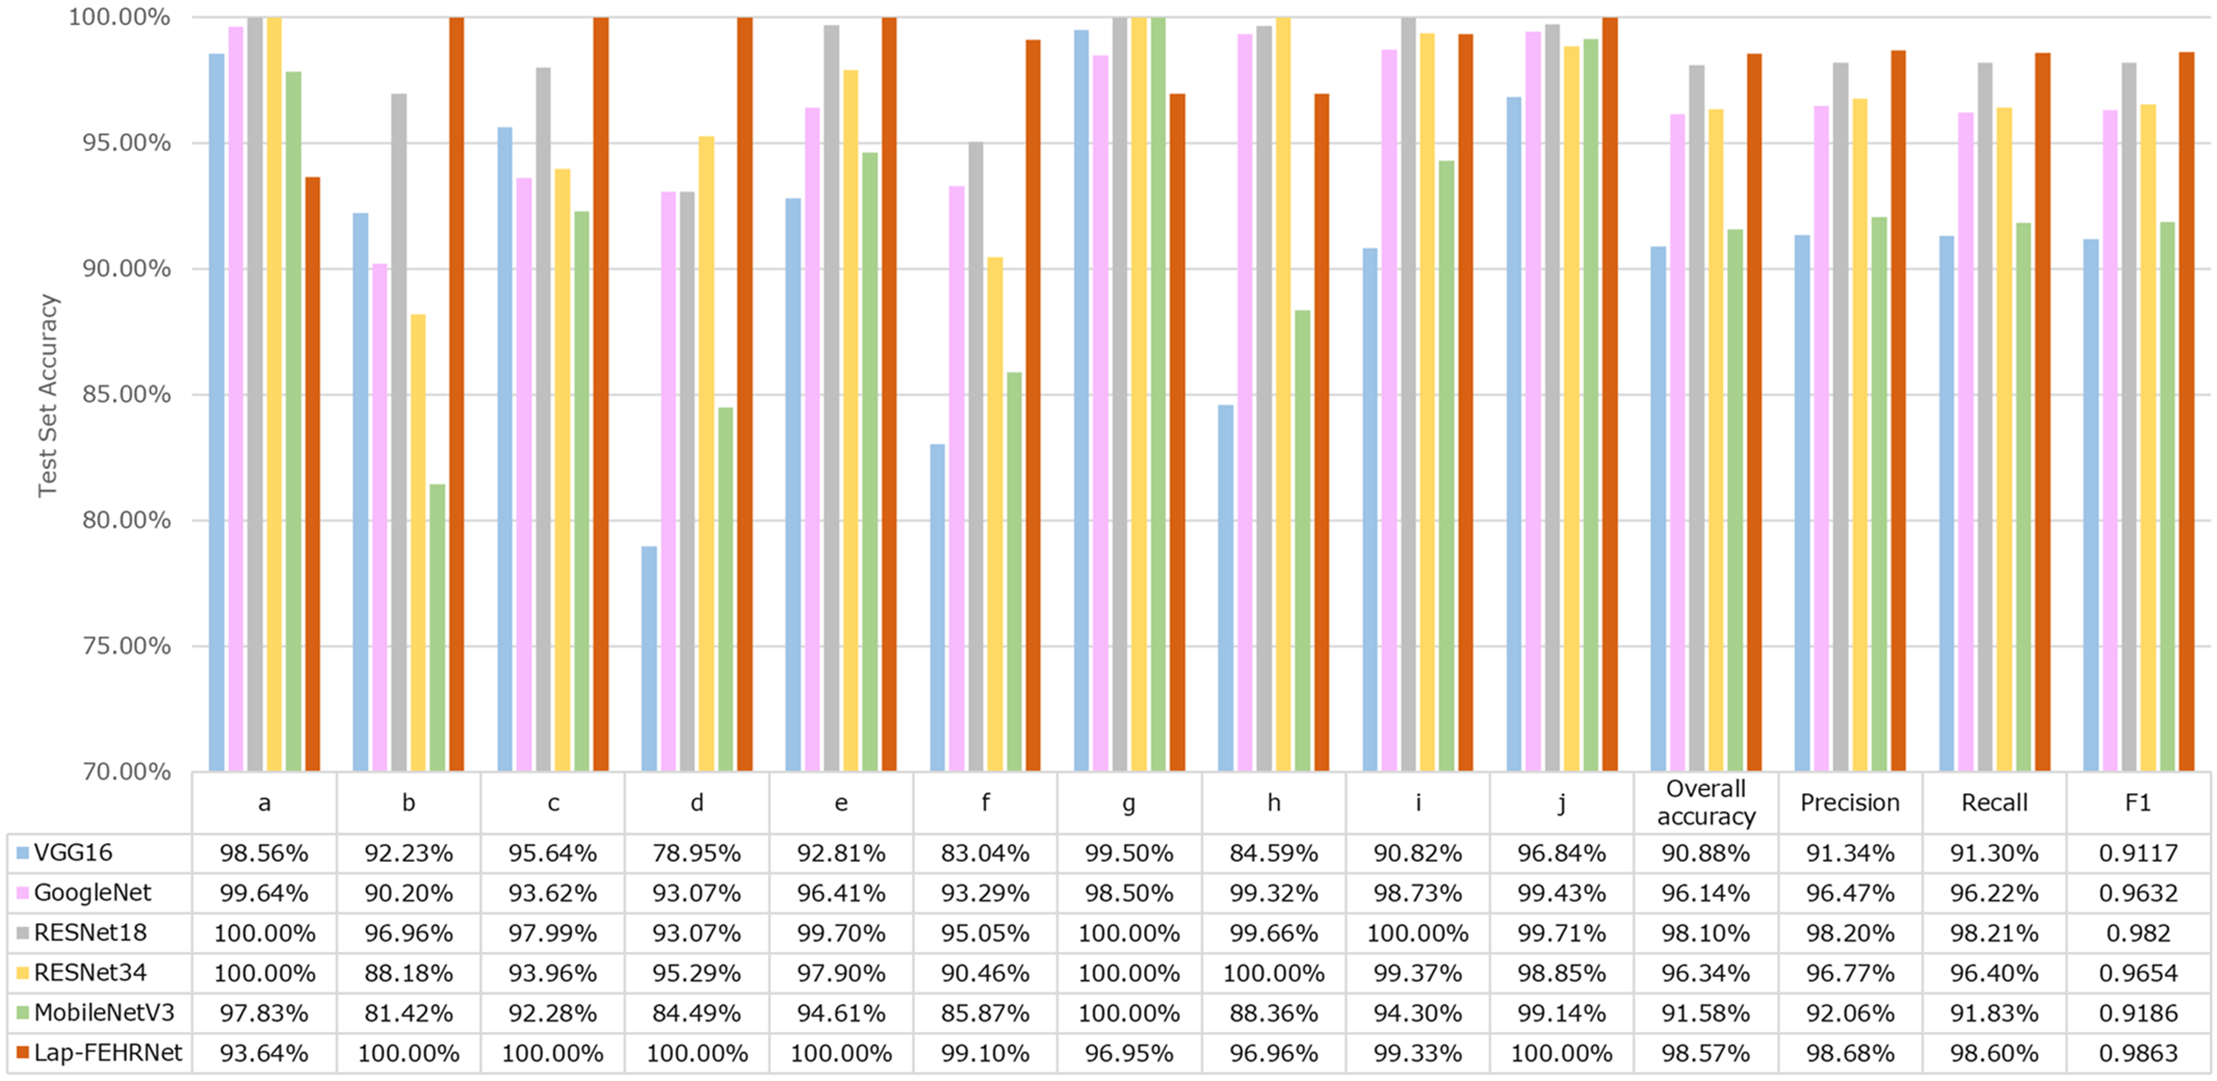
Figure 19: Generalized experimental data
As shown in Fig. 18a, the loss value of the proposed Lap-FEHRNet model remains at a low level throughout the training process. The loss curve decreases rapidly, converges quickly, and stays stable. Although the RESNet18 and RESNet34 models demonstrate comparable performance to the Lap-FEHRNet model in terms of loss rate and overall accuracy, there are more fluctuations during the training process.
As illustrated in Fig. 18b, the classification accuracy of the Lap-FEHRNet model reaches close to 1.0 in the early stages of training and maintains relatively high accuracy throughout. This indicates more stable and efficient performance compared to the other models.
Fig. 19 reveals that, although the proposed Lap-FEHRNet model slightly reduces the classification accuracy of individual categories, such as “Bacterial_leaf_blight” (a), “Neck_blast” (g) and “Rice_hispa” (h), the overall classification accuracy can still be maintained at a high level, especially, the classification accuracies of “Brown_spot” (b), “Leaf_blast” (d) and “Narrow_brown_spot” (f), which are difficult to be classified by other models, reach 100%, 100% and 99.1%, respectively.
The experimental results show that the Lap-FEHRNet model can maintain excellent stability and high accuracy even when the dataset has problems such as inconsistent image resolution, high image noise, and high image similarity. The above experiments demonstrate the versatility and stability of the model under different conditions. In summary, the Lap-FEHRNet model has achieved excellent performance in both image classification under different crop conditions and leaf disease classification under the same crop.
The Lap-FEHRNet classification model aims to solve the problems of low image clarity, image noise, low model classification accuracy, and poor robustness in crop image classification. Based on the experimental results and analysis, the following main conclusions are obtained:
1. The Lap-FEHRNet model introduces LapSRN, which can perform high-resolution reconstruction of low-resolution images through step-by-step feature extraction and pixel superposition to obtain high-resolution images, thereby reducing the interference of noise, creating better conditions for the model to perform subsequent feature extraction, and giving the model stronger robustness.
2. The Lap-FEHRNet model enhances HRNet v2 by incorporating shallow feature extraction. This enrichment of output features improves the model’s generalization capability.
3. The Lap-FEHRNet model also adds an attention-based feature enhancement module. By introducing a spatial attention module and a channel attention module, the importance of each space and channel is independently adjusted, and the model’s attention to features related to the current task is improved, thereby improving the model’s classification ability.
4. Compared to other deep learning models, the Lap-FEHRNet model demonstrates clear advantages in image classification accuracy and stability. It achieves over 98% accuracy on two distinct datasets and rapidly attains high accuracy and low loss early in training. Meanwhile, it maintains strong stability, reflecting good convergence and robust feature learning capabilities.
5. By comparing the experimental results of two different datasets, the performance trend of the Lap-FEHRNet model is revealed when subjected to expanding data scales and increasing task complexity. In the crop image classification experiments, Lap-FEHRNet still has good characterization ability and stability under the limited sample conditions, which reflects its adaptability to the increase of data size. When it comes to the rice leaf disease dataset, which is more complicated in terms of both category size and data size, Lap-FEHRNet still maintains better classification accuracy and stability than the comparison model in this high-complexity task, which indicates that it still has robust feature extraction capability and discrimination ability in the face of the challenges of multi-classes, fine-grained variance, and high intra-class heterogeneity. In summary, the model is not only suitable for small-sample scenarios but also has the potential to maintain stable performance under larger-scale and more complex tasks.
In conclusion, the Lap-FEHRNet model has a high application potential and research value in the field of crop image classification, providing strong support for actual crop production activities. In future research, the Lap-FEHRNet model will be further simplified by using a lighter network, and LapSRN will be optimized to improve the image resolution and noise removal ability while reducing reconstruction time.
Although the proposed Lap-FEHRNet model has shown decent performance on both the crop classification and rice leaf disease datasets, with classification accuracies of 98.8% and 98.57%, respectively, there are still some challenges to applying it more widely to real-world agricultural scenarios. In the current experiments, the model is mainly tested on datasets that vary in category and resolution, but the main recognition targets are relatively clear. However, field agricultural images typically suffer from motion blur, background clutter, and sensor-generated noise, all of which can severely impact the model’s performance. In addition, there is the issue of the practical deployment of the models.
To cope with the above, future work will be divided into three parts:
1. Evaluating the performance of Lap-FEHRNet under noisy and low-resolution conditions and exploring strategies to enhance robustness, such as incorporating noise enhancement into the training process and integrating denoising submodules into existing architectures.
2. To enhance the reliability of the model for real agricultural applications, the dataset will be extended to more diverse and realistic scenarios. The data will be collected under various natural conditions, using different types of equipment, and across diverse agricultural environments to validate the model’s generalization capability and enhance its practical applicability.
3. The computational efficiency and model size of Lap-FEHRNet will be further optimized to better adapt to the practical applications of mobile devices or edge computing devices. The number of parameters and computational complexity of the model will be effectively reduced by model compression techniques such as pruning. Meanwhile, the effects of different lightweighting strategies on model accuracy and computational resource consumption are deeply analyzed based on comparative experiments, to construct the best trade-off model between performance and resource consumption. In addition to addressing the characteristics of computational power and memory constraints of edge devices, this study will optimize the inference pipeline of Lap-FEHRNet and explore the feasibility of the model for real-time image processing on edge devices. Based on this, comprehensive tests will also be conducted on several different types of edge computing platforms to verify the versatility and adaptability of Lap-FEHRNet in different hardware environments. Ultimately, the reliability and practical value of the proposed technology will be further verified through the deployment of real applications in agricultural production scenarios.
Acknowledgement: Not applicable.
Funding Statement: The authors received no specific funding for this study.
Author Contributions: The authors confirm contribution to the paper as follows: study conception and design: Min Ji, Shucheng Yang; data collection: Min Ji, Shucheng Yang; analysis and interpretation of results: Min Ji, Shucheng Yang; draft manuscript preparation: Min Ji, Shucheng Yang. All authors reviewed the results and approved the final version of the manuscript.
Availability of Data and Materials: All data used in this study are freely available and accessible.
Ethics Approval: All data used in the article complies with ethical standards, and informed consent was obtained from all individual participants included in the study.
Conflicts of Interest: The authors declare no conflicts of interest to report regarding the present study.
References
1. Qu Y, Yuan ZL, Zhao WZ, Chen XH, Chen JG. Crop classification based on multi-temporal features and convolutional neural network. Remote Sens Technol Appl. 2021;36(2):304–13. (In Chinese). doi:10.11873/j.issn.1004-0323.2021.2.0304. [Google Scholar] [CrossRef]
2. Zhang F, Yin J, Wu N, Hu X, Sun S, Wang Y. A dual-path model merging CNN and RNN with attention mechanism for crop classification. Eur J Agron. 2024;159(1):127273. doi:10.1016/j.eja.2024.127273. [Google Scholar] [CrossRef]
3. Maolan K, Rusuli Y, Zhang X, Kuluwan Y. Sentinel-2 image based smallholder crops classification and accuracy assessment by UAV data. Geocarto Int. 2024;39(1):2361733. doi:10.1080/10106049.2024.2361733. [Google Scholar] [CrossRef]
4. Yu F, Zhang Q, Xiao J, Ma Y, Wang M, Luan R, et al. Progress in the application of CNN-based image classification and recognition in whole crop growth cycles. Remote Sens. 2023;15(12):2988. doi:10.3390/rs15122988. [Google Scholar] [CrossRef]
5. Muruganantham P, Wibowo S, Grandhi S, Samrat NH, Islam N. A systematic literature review on crop yield prediction with deep learning and remote sensing. Remote Sens. 2022;14(9):1990. doi:10.3390/rs14091990. [Google Scholar] [CrossRef]
6. Wang Y, Li S, Cai H, Deng L, Lin Y. AGSPNet: a framework for parcel-scale crop fine-grained semantic change detection from UAV high-resolution imagery with agricultural geographic scene constraints. Comput Electron Agric. 2025;231:109973. doi:10.1016/j.compag.2025.109973. [Google Scholar] [CrossRef]
7. Wang YC, Wan HW, Gao JX, Hu ZW, Sun CX, Lü N, et al. Identification of common native grassland plants in northern China using deep learning. Biodivers Sci. 2024;32(4):60–9. (In Chinese). doi:10.17520/biods.2023435. [Google Scholar] [CrossRef]
8. Wu F, Yang Z, Zhu H, Zheng L, Liao S, Shan C, et al. A review of research on the application of color features for image classification and recognition of agricultural crops. China Agric Sci Technol Bull. 2003;5(2):76–80. (In Chinese). [Google Scholar]
9. Kok ZH, Shariff ARM, Alfatni MSM, Khairunniza-Bejo S. Support vector machine in precision agriculture: a review. Comput Electron Agric. 2021;191(9):106546. doi:10.1016/j.compag.2021.106546. [Google Scholar] [CrossRef]
10. Wang Z, Zhao Z, Yin C. Fine crop classification based on UAV hyperspectral images and random forest. ISPRS Int J Geo Inf. 2022;11(4):252. doi:10.3390/ijgi11040252. [Google Scholar] [CrossRef]
11. Fabiyi SD, Vu H, Tachtatzis C, Murray P, Harle D, Dao TK, et al. Comparative study of PCA and LDA for rice seeds quality inspection. In: 2019 IEEE AFRICON [Internet]. [cited 2024 Nov 10]. Available from: https://ieeexplore.ieee.org/abstract/document/9134059/. [Google Scholar]
12. Xie C, Zhang J, Li R, Li J, Hong P, Xia J, et al. Automatic classification for field crop insects via multiple-task sparse representation and multiple-kernel learning. Comput Electron Agric. 2015;119(2):123–32. doi:10.1016/j.compag.2015.10.015. [Google Scholar] [CrossRef]
13. Munisami T, Ramsurn M, Kishnah S, Pudaruth S. Plant leaf recognition using shape features and colour histogram with K-nearest neighbour classifiers. Procedia Comput Sci. 2015;58(4):740–7. doi:10.1016/j.procs.2015.08.095. [Google Scholar] [CrossRef]
14. Hossen MS, Haque I, Islam MS, Ahmed MT, Nime MJ, Islam MA. Deep learning based classification of Papaya disease recognition. In: 2020 3rd International Conference on Intelligent Sustainable Systems (ICISS); 2020 Dec 3–5; Thoothukudi, India. p. 945–51. doi:10.1109/iciss49785.2020.9316106. [Google Scholar] [CrossRef]
15. Tao T, Wei X. A hybrid CNN-SVM classifier for weed recognition in winter rape field. Plant Methods. 2022;18(1):29. doi:10.1186/s13007-022-00869-z. [Google Scholar] [PubMed] [CrossRef]
16. Coulibaly S, Kamsu-Foguem B, Kamissoko D, Traore D. Explainable deep convolutional neural networks for insect pest recognition. J Clean Prod. 2022;371:133638. doi:10.1016/j.jclepro.2022.133638. [Google Scholar] [CrossRef]
17. Hema MS, Sharma N, Sowjanya Y, Santoshini C, Durga RS, Akhila V. Plant disease prediction using convolutional neural network. Emit Int J Eng Technol. 2021;9(2):283–93. doi:10.24003/emitter.v9i2.640. [Google Scholar] [CrossRef]
18. Elfatimi E, Eryigit R, Elfatimi L. Beans leaf diseases classification using MobileNet models. IEEE Access. 2022;10(2):9471–82. doi:10.1109/access.2022.3142817. [Google Scholar] [CrossRef]
19. Stephen A, Punitha A, Chandrasekar A. Designing self attention-based ResNet architecture for rice leaf disease classification. Neural Comput Appl. 2023;35(9):6737–51. doi:10.1007/s00521-022-07793-2. [Google Scholar] [CrossRef]
20. Zhang X, Gao H, Wan L. Classification of fine-grained crop disease by dilated convolution and improved channel attention module. Agriculture. 2022;12(10):1727. doi:10.3390/agriculture12101727. [Google Scholar] [CrossRef]
21. Zuo X, Chu J, Shen J, Sun J. Multi-granularity feature aggregation with self-attention and spatial reasoning for fine-grained crop disease classification. Agriculture. 2022;12(9):1499. doi:10.3390/agriculture12091499. [Google Scholar] [CrossRef]
22. Bi X, Wang H. Double-branch deep convolutional neural network-based rice leaf diseases recognition and classification [Internet]. [cited 2024 Nov 10]. Available from: https://www.agroengineering.org/jae/article/view/1544. [Google Scholar]
23. Sathya K, Rajalakshmi M. RDA-CNN: enhanced super resolution method for rice plant disease classification. Comput Syst Sci Eng. 2022;42(1):33–47. doi:10.32604/csse.2022.022206. [Google Scholar] [CrossRef]
24. Zhou C, Zhou S, Xing J, Song J. Tomato leaf disease identification by restructured deep residual dense network. IEEE Access. 2021;9:28822–31. doi:10.1109/access.2021.3058947. [Google Scholar] [CrossRef]
25. Maqsood MH, Mumtaz R, Haq IU, Shafi U, Zaidi SMH, Hafeez M. Super resolution generative adversarial network (SRGANs) for wheat stripe rust classification. Sensors. 2021;21(23):7903. doi:10.3390/s21237903. [Google Scholar] [PubMed] [CrossRef]
26. Lai WS, Huang JB, Ahuja N, Yang MH. Deep laplacian pyramid networks for fast and accurate super-resolution [Internet]. [cited 2024 Nov 10]. Available from: http://openaccess.thecvf.com/content_cvpr_2017/html/Lai_Deep_Laplacian_Pyramid_CVPR_2017_paper.html. [Google Scholar]
27. Zhao X, Song C, Zhang H, Sun X, Zhao J. HRNet-based automatic identification of photovoltaic module defects using electroluminescence images. Energy. 2023;267:126605. doi:10.1016/j.energy.2022.126605. [Google Scholar] [CrossRef]
28. Wang J, Sun K, Cheng T, Jiang B, Deng C, Zhao Y, et al. Deep high-resolution representation learning for visual recognition. IEEE Trans Pattern Anal Mach Intell. 2021;43(10):3349–64. doi:10.1109/TPAMI.2020.2983686. [Google Scholar] [PubMed] [CrossRef]
29. Sun K, Xiao B, Liu D, Wang J. Deep high-resolution representation learning for human pose estimation. In: Proceedings of the IEEE/CVF Conference on Computer Vision and Pattern Recognition [Internet]. Long Beach, CA, USA. [cited 2024 Nov 10]. Available from: http://openaccess.thecvf.com/content_CVPR_2019/html/Sun_Deep_High-Resolution_Representation_Learning_for_Human_Pose_Estimation_CVPR_2019_paper.html [Google Scholar]
30. Hu J, Shen L, Sun G. Squeeze-and-excitation networks. In: Proceedings of the IEEE Conference on Computer Vision and Pattern Recognition [Internet]. Salt Lake City, UT, USA. [cited 2024 Dec 24]. Available from: http://openaccess.thecvf.com/content_cvpr_2018/html/Hu_Squeeze-and-Excitation_Networks_CVPR_2018_paper.html [Google Scholar]
31. Woo S, Park J, Lee JY, Kweon IS. Cbam: convolutional block attention module. In: Proceedings of the European Conference on Computer Vision (ECCV) [Internet]. Munich, Germany. [cited 2024 Nov 10]. Available from: http://openaccess.thecvf.com/content_ECCV_2018/html/Sanghyun_Woo_Convolutional_Block_Attention_ECCV_2018_paper.html [Google Scholar]
32. Dong C, Loy CC, He K, Tang X. Image super-resolution using deep convolutional networks. IEEE Trans Pattern Anal Mach Intell. 2016;38(2):295–307. doi:10.1109/tpami.2015.2439281. [Google Scholar] [PubMed] [CrossRef]
33. Lim B, Son S, Kim H, Nah S, Lee KM. Enhanced deep residual networks for single image super-resolution. In: 2017 IEEE Conference on Computer Vision and Pattern Recognition Workshops (CVPRW); 2017 Jul 21–26; Honolulu, HI, USA. p. 1132–40. doi:10.1109/cvprw.2017.151. [Google Scholar] [CrossRef]
34. Simonyan K. Very deep convolutional networks for large-scale image recognition. arXiv:1409.1556. 2014. [Google Scholar]
35. Szegedy C, Liu W, Jia Y, Sermanet P, Reed S, Anguelov D, et al. Going deeper with convolutions. In: Proceedings of the IEEE Conference on Computer Vision and Pattern Recognition [Internet]. Boston, MA, USA. [cited 2024 Nov 10]. Available from: https://www.cv-foundation.org/openaccess/content_cvpr_2015/html/Szegedy_Going_Deeper_With_2015_CVPR_paper.html [Google Scholar]
36. He K, Zhang X, Ren S, Sun J. Deep residual learning for image recognition. In: Proceedings of the IEEE Conference on Computer Vision and Pattern Recognition [Internet]. Las Vegas, NV, USA. [cited 2024 Nov 10]. Available from: http://openaccess.thecvf.com/content_cvpr_2016/html/He_Deep_Residual_Learning_CVPR_2016_paper.html [Google Scholar]
37. Howard A, Sandler M, Chu G, Chen LC, Chen B, Tan M, et al. Searching for MobileNetV3. In: Proceedings of the IEEE/CVF International Conference on Computer Vision; 2019; Seoul, Republic of Korea. [cited 2024 Nov 10]. Available from: http://openaccess.thecvf.com/content_ICCV_2019/html/Howard_Searching_for_MobileNetV3_ICCV_2019_paper.html [Google Scholar]
38. Feng Z, Ji H, Daković M, Cui X, Zhu M, Stanković L. Cluster-CAM: cluster-weighted visual interpretation of CNNs’ decision in image classification. Neural Netw. 2024;178(9):106473. doi:10.1016/j.neunet.2024.106473. [Google Scholar] [PubMed] [CrossRef]
39. Hu W, Chen T, Lan C, Liu S, Yin L. SkipResNet: crop and weed recognition based on the improved ResNet. Land. 2024;13(10):1585. doi:10.3390/land13101585. [Google Scholar] [CrossRef]
Cite This Article
 Copyright © 2025 The Author(s). Published by Tech Science Press.
This work is licensed under a Creative Commons Attribution 4.0 International License , which permits unrestricted use, distribution, and reproduction in any medium, provided the original work is properly cited.
 Downloads
 Citation Tools