
 Submit a Paper
 Propose a Special lssue
 Open Access
ARTICLE
An Improved Aluminum Surface Defect Detection Algorithm Based on YOLOv8n
School of Mechanical and Power Engineering, Nanjing Tech University, Nanjing, 211800, China
* Corresponding Author: Shoudong Ni. Email:
Computers, Materials & Continua 2025, 84(2), 2677-2697. https://doi.org/10.32604/cmc.2025.064629
Received 20 February 2025; Accepted 28 April 2025; Issue published 03 July 2025
 View Full Text
 Download PDF
Abstract
In response to the missed and false detections that are easily caused by the large variety of and significant differences among aluminum surface defects, a detection algorithm based on an improved You Only Look Once (YOLO)v8n network is proposed. First, a C2f_DWR_DRB module is constructed by introducing a dilation-wise residual (DWR) module and a dilated reparameterization block (DRB) to replace the C2f module at the high level of the backbone network, enriching the gradient flow information and increasing the effective receptive field (ERF). Second, an efficient local attention (ELA) mechanism is fused with the high-level screening-feature pyramid networks (HS-FPN) module, and an ELA_HSFPN is designed to replace the original feature fusion module, enhancing the ability of the network to cope with multiscale detection tasks. Moreover, a lightweight shared convolutional detection head (SCDH) is introduced to reduce the number of parameters and the computational complexity of the module while enhancing the performance and generalizability of the model. Finally, the soft intersection over union (SIoU) replaces the original loss function to improve the convergence speed and prediction accuracy of the model. Experimental results show that compared with that of the original YOLOv8n model, the mAP@0.5 of the improved algorithm is increased by 5.1%, the number of parameters and computational complexity are reduced by 33.3% and 32.1%, respectively, and the FPS is increased by 4.9%. Compared with other mainstream object detection algorithms, the improved algorithm still leads in terms of core indicators and has good generalizability for surface defects encountered in other industrial scenarios.Keywords
With the vigorous development of new-energy vehicle industry, the proportion of aluminum being used in this domain has increased annually. However, during the production and transportation processes, surface defects caused by material characteristics and processing technology will severely affect the performance and lifespan of the aluminum [1]. Therefore, the correct and rapid identification of defects on aluminum surfaces is particularly important in actual production and life scenarios.
In the realm of industrial defect detection, owing to the swift progress of artificial intelligence (AI), manual detection and traditional detection methods have been gradually substituted with detection approaches grounded in deep learning [2]. These approaches can be categorized into two primary types: two-stage detection algorithms, which are represented by the region-based convolutional neural network (R-CNN) [3] and Faster R-CNN [4], and single-stage detection algorithms, which are represented by SSD [5] and YOLO series [6–10]. Although two-stage algorithms have excellent detection accuracy, their models are large, and their real-time performance is weak. While single-stage algorithms deliver faster detection speeds, their accuracy performance (exemplified by SSD architectures) tends to be marginally lower, but YOLO can achieve real-time detection without sacrificing too much detection accuracy, becoming the mainstream approach today. Yin et al. [11] proposed a combined network consisting of deep random kernel convolutional extreme learning machine (DRKCELM) and double hidden layer extreme learning machine auto-encoder (DLELM-AE) to substitute Darknet-53 as the feature extractor; their approach not only extracted richer features but also simplified the network training process and improved the efficiency of training. Gui et al. [12] introduced a new spatial pyramid pooling module, namely, cross stage partial network with average spatial pyramid pooling-fast block (ASPPFCSPC), to enable their model to handle global and local features simultaneously, enhance the model’s capacity to represent the fine granularity in the complex background of a metal surface, and thus boost the model’s precision and universality. Gao et al. [13] introduced a diverse branch block (DBB) to C2f to build the C2fDBB module. They replaced the single series design scheme of standard convolution with a four-branch design to achieve improved feature extraction capabilities. Deng et al. [14] proposed the strengthening feature extraction (SFE) module, which improved upon the Adown [15] convolutional module, and introduced GhostModule and space-to-depth convolution (SPD-Conv) to lower the parameter count and reduce the loss of key information, respectively. Tian et al. [16] incorporated bilevel routing attention (BRA) into the YOLOv8 network, and its dual-layer routing mechanism made better use of multiscale feature information and independently allocated attention weights by learning the connections among various tasks, thus enhancing the detection accuracy. Lu et al. [17] introduced a dynamic snake convolution (DSC) into C2f to make the model more flexible to adapt to defects of varying scales and shapes, consequently boosting the model’s robustness. Yang et al. [18] introduced the FastDet structure, which enables the model to extract and utilize feature information more efficiently and significantly improve inference speed while maintaining accuracy.
In summary, these improvements based on YOLO algorithms facilitate a noticeable improvement in predictive accuracy. However, the detection accuracies achieved for different types of defects on aluminum surfaces greatly differ, and small defects and long block defects easily cause missed detections, misdetection sand other problems. For superior accuracy in aluminum defect detection, an improved YOLOv8n algorithm is proposed in this paper. The contributions of this study are organized into the following aspects.
(1) A C2f_DWR_DRB module is designed to enrich the gradient flow information and increase the model’s effective receptive field.
(2) An ELA_HSFPN (efficient local attention_high-level screening-feature pyramid networks) feature fusion module is designed to improve the model’s performance to cope with multi-scale detection tasks.
(3) A shared convolutional detection head (SCDH) module is designed to improve the model’s capability and generalizability while retaining its lightweight characteristics.
(4) The SIoU (soft intersection over union) loss function is applied to enhance the model’s convergence speed and prediction accuracy.
YOLOv8 was optimized and upgraded on the basis of YOLOv5 model. The new improvements have led to better performance and enable the model to more accurately and efficiently complete various detection tasks. It is divided into five versions, namely, n, s, m, l and x, and the numbers of parameters and calculations of these variants increase in turn. Considering that applications in industrial production demand fast operation, minimal resource waste, and high real-time performance, this paper selects the relatively small-sized YOLOv8n as the benchmark model to balance the accuracy and speed of the detection process.
The network structure of YOLOv8 is shown in Fig. 1. The backbone is responsible for feature extraction, and the neck network and head are responsible for feature fusion. The backbone incorporates cross-stage partial (CSP) connections. This integration serves to decrease the amount of required computations and enhance the gradient. Regarding the neck component, the convolution structure of the path aggregation network with feature pyramid network (PAN-FPN) upsampling stage in YOLOv5 is deleted, and features from multiple network stages are immediately utilized for upsampling operations. The C2f module supersedes the C3 architecture through split-merge feature fusion, enabling dynamic scale adaptation with only a 0.3M parameter increase. The head part employs a decoupled head structure. This not only cuts down on parameter quantity and computational complexity but also improves the model’s generalizability and robustness. YOLOv8 pioneers an anchor-free paradigm shift in the YOLO lineage, replacing legacy anchor-based coordinate prediction with direct center-offset regression. This strategic redesign eliminates predefined aspect ratio constraints while reducing detection head parameters by 38%. Regarding the loss function design, the classification loss of YOLOv8 is the varifocal loss (VFL), and the regression loss is CIoU+distributional focal loss (CIoU+DFL). These improvements effectively improve the detection performance of the model.
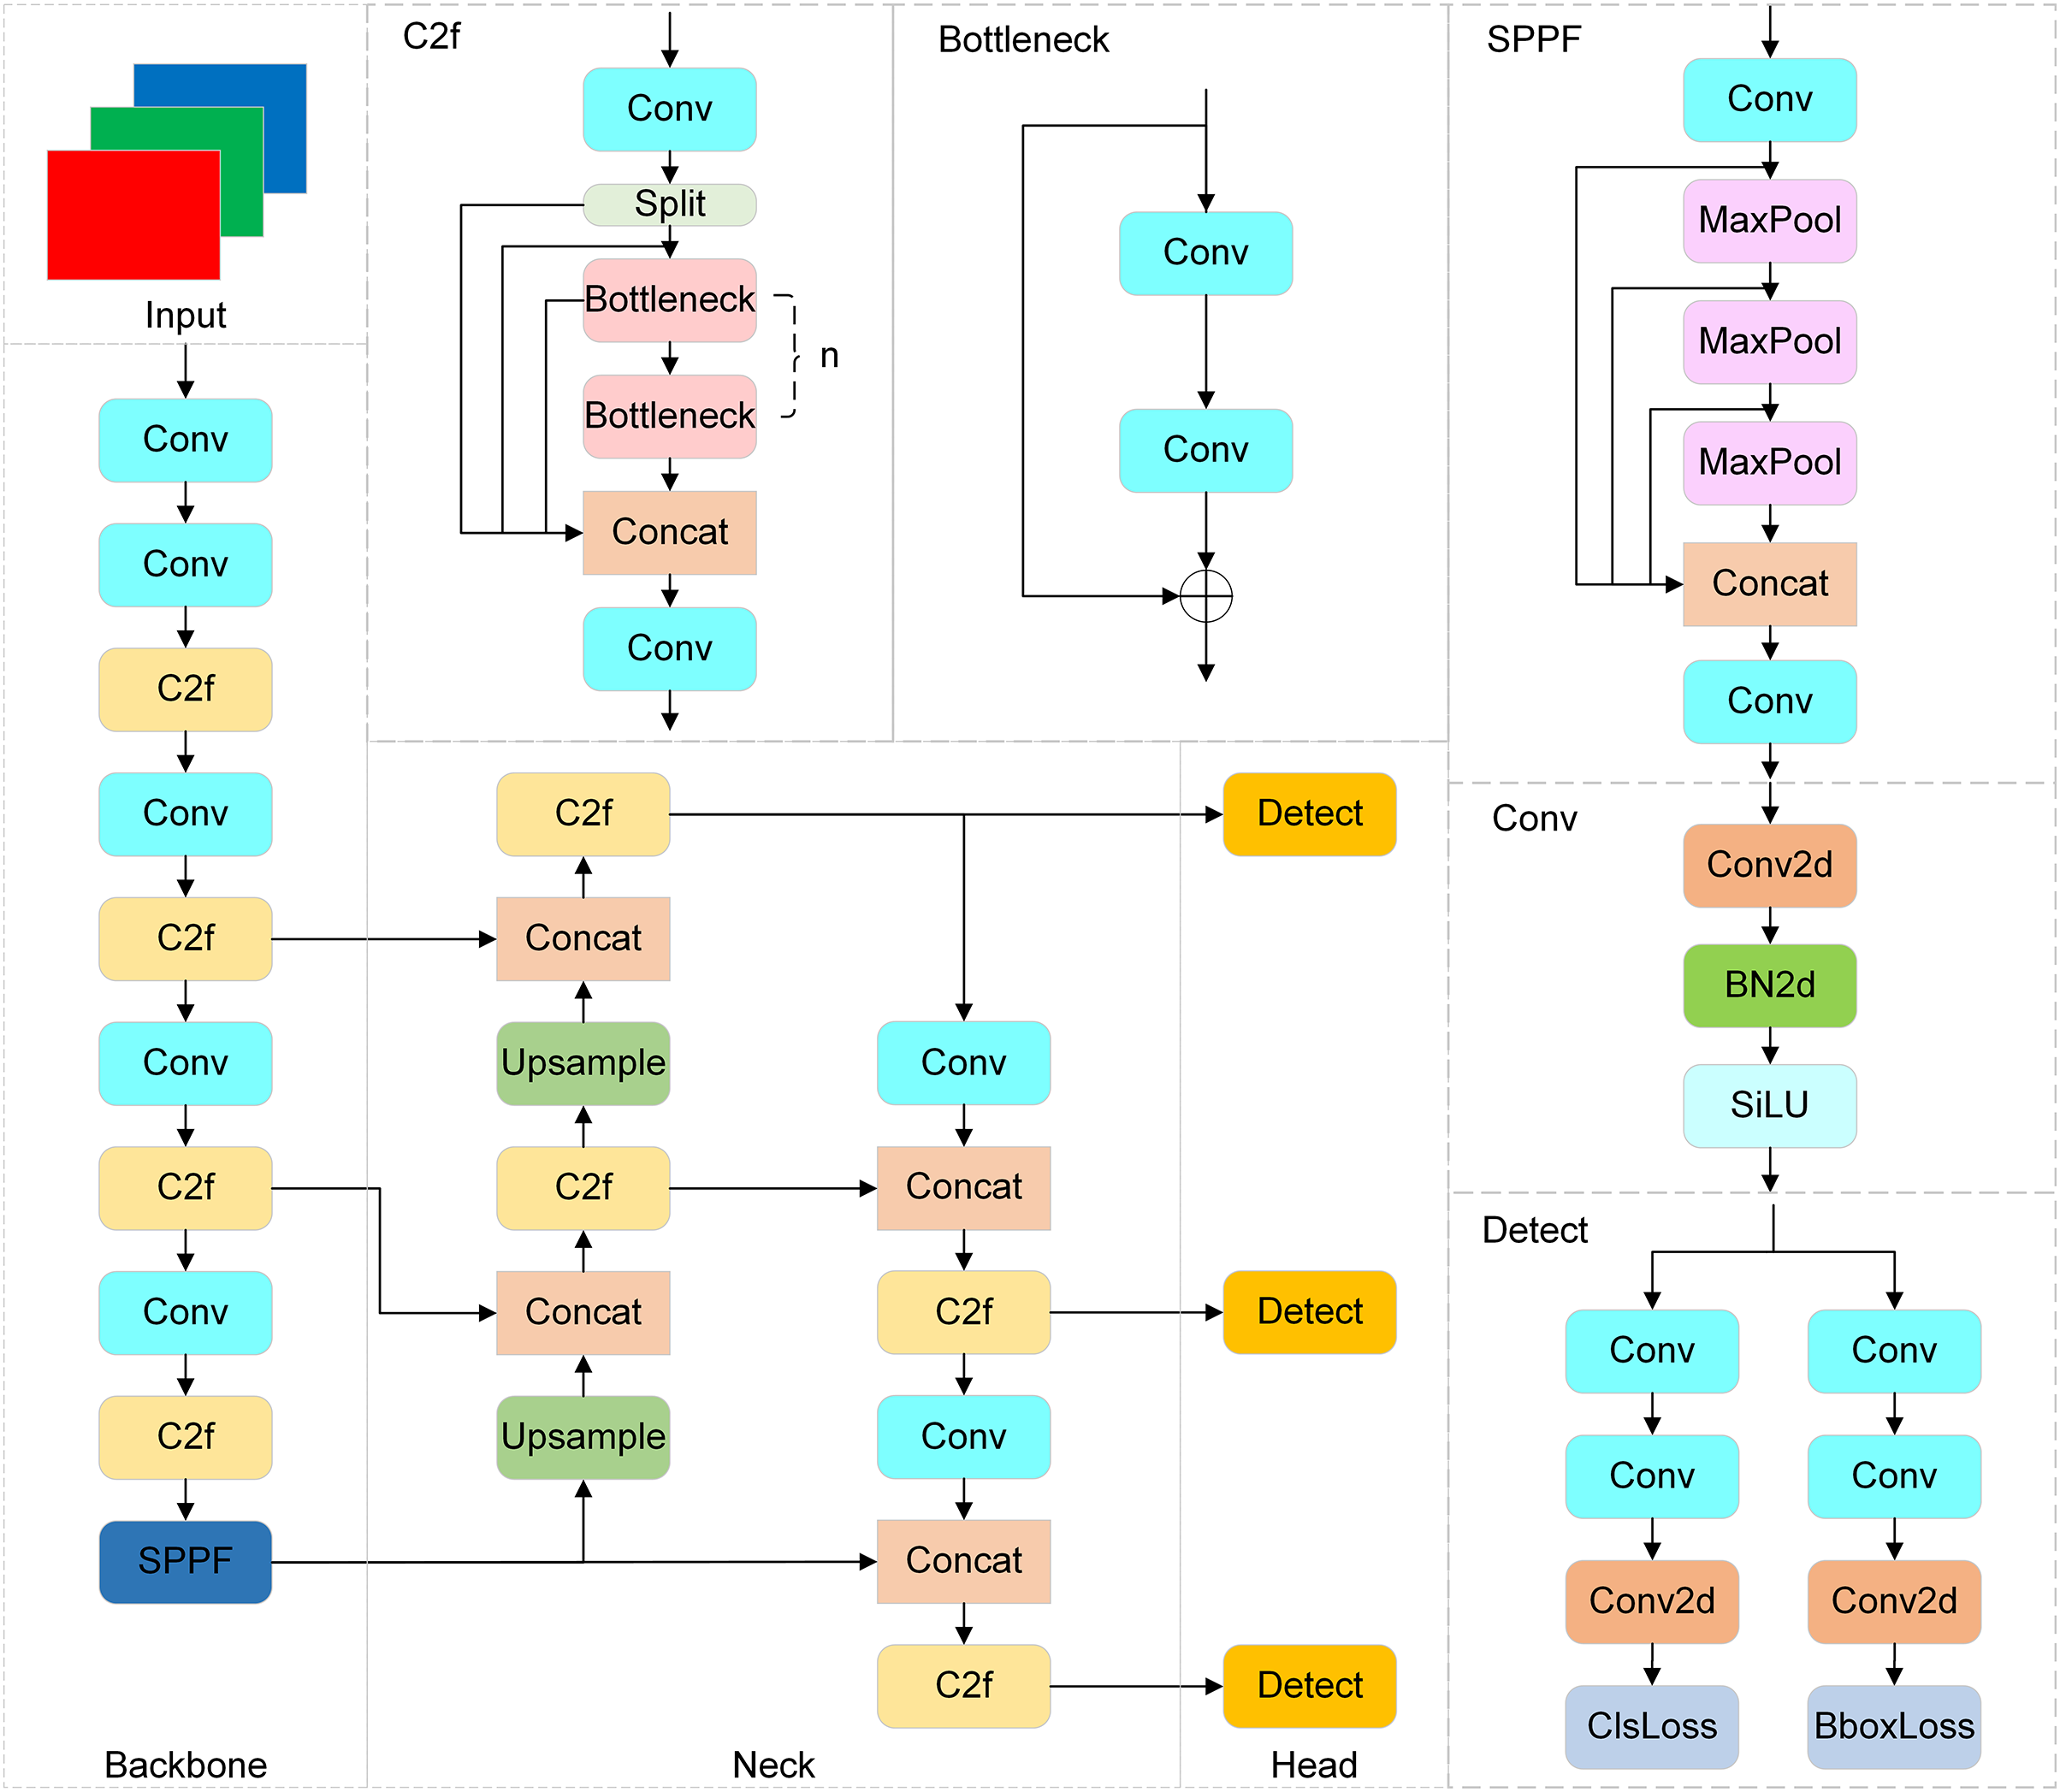
Figure 1: Diagram of the YOLOv8 network architecture
Many types of aluminum surface defects may be encountered, and the YOLO model performs poorly in terms of addressing elongated large-target strip defects and small-target point defects. To address this difficulty, this paper fuses the dilationwise residual (DWR) module [19] and the dilated reparameterization block (DRB) [20] and incorporates them into C2f. As shown in Fig. 2, DWR module adopts a two-step feature extraction method, which decomposes the traditional single-step multiscale feature extraction process into two steps: region resampling (RR) and semantic resampling (SR) steps. During the initialization phase, i.e., regional residual reduction, the input is first convolved with a 3 × 3 convolution, and then batch normalization (BN) and the rectified linear unit (ReLU) activation function are used to generate concise feature maps with different regional expressions, which provide the basis for the second step, namely, morphological filtering. This process is the RR part of Fig. 2. In the second step, i.e., semantic resampling, three 3 × 3 convolutions featuring varying dilation rates are used to learn features with different receptive fields, and a single expected receptive field is applied to conduct morphological filtering on each regional feature map to avoid redundancy. This process is the SR part of the figure. Then, a 1 × 1 convolution operation is utilized. It compresses the concatenated features back to the initial channel count and cuts down on the necessary number of calculations. Finally, a residual connection helps alleviate the gradient vanishing issue during network training. The above parts enable DWR to boost the model’s generalizability by reusing and enhancing features and finally achieve a combination of high performance and a low weight. In summary, the formulas for the DWR module are as follows:

Figure 2: DWR structural diagram
where
The DRB module, introduced from universal perception large-kernel convolutional neural network (UniRepLKNet), exploits large-kernel convolutions to improve the performance achieved on various tasks. The DRB employs large-kernel convolutional layers and is enhanced by parallel small-kernel convolutions with different dilation rates. Dilated convolutions allow the model to extract both local and distant patterns within the input data, and the dilation rate effectively expands the receptive fields of small-kernel convolutions without greatly expanding the number of required parameters. As shown in Fig. 3, the outputs of the large-kernel convolution and the parallel small-kernel dilated convolution are combined during training. After training, these multiple convolutional layers are reparameterized into a single large-kernel convolutional layer. This ensures that only one convolution operation is used per DRB during the inference step, thus reducing the incurred computational cost while preserving the benefits gained from different receptive fields during training. Furthermore, the transformation of dilated convolutional layers that capture sparse patterns into nondilated convolutions with equivalent larger sparse kernels is achieved by inserting zero entries into the convolution kernels, which enables the dilated convolutions to be efficiently incorporated into the large-kernel convolutions. The DRB module can also flexibly select the kernel size and dilation rate of the parallel convolution, ensure an efficient convolution operation, and enable the network to achieve a larger effective receptive field (ERF) with fewer layers to save computing resources while still capturing complex patterns. In summary, the DRB module enables the model to effectively balance the need for large receptive fields and high computational efficiency, thus improving the performance achieved in different tasks, especially in areas where large-kernel convolutions have advantages.

Figure 3: DRB structural diagram
After the above DWR module is fused with the DRB module, the two dilated convolutions on the right side of the SR part in the original DWR module are replaced by 5 × 5 and 7 × 7 DRB modules. As shown in Fig. 4, the bottleneck in C2f is replaced by the fused DWR_DRB module. This replacement leads to the formation of the C2f_DWR_DRB module. Finally, since the DWR module is applied mainly to the high-level stage of the network, this integrated module is positioned in the high layer of the backbone network; that is, the last two C2f modules are replaced. Inheriting the advantages of the two fusion modules, the C2f_DWR_DRB module enriches the gradient flow information and increases the ERF, which improves the model’s proficiency in detecting aluminum surface defects without sacrificing its lightweight characteristics.

Figure 4: C2f_DWR_DRB structural diagram
The neck part of YOLOv8 fuses the features obtained from the backbone, which includes a PAN [21] for bottom-up feature fusion and an FPN [22] for top-down feature fusion. Aluminum surface defects exhibit differences not only between different types but also between the same types. In the face of such multiscale challenges encountered in images, this feature fusion strategy is not flexible enough to fully fuse the shallow and deep features. As a consequence, detailed information vanishes, ultimately impacting the model’s ability. With the aim of overcoming this challenge, this paper fuses the ELA [23] mechanism and the HS-FPN [24] to replace the original feature fusion component.
The HS-FPN consists of a channel attention (CA)-based feature selection module and a selective feature fusion (SFF) module. As shown in Fig. 5, the CA module first processes the input feature maps through global maximum pooling and global average pooling, and then the sum of the results is used by the sigmoid function to get the weight of each channel to determine their representative features. The CA module is responsible for screening feature maps with different scales, it can apply its attention mechanism to the channel and spatial dimensions simultaneously and help the model focus on more valuable channel information by learning adaptive channel weights.
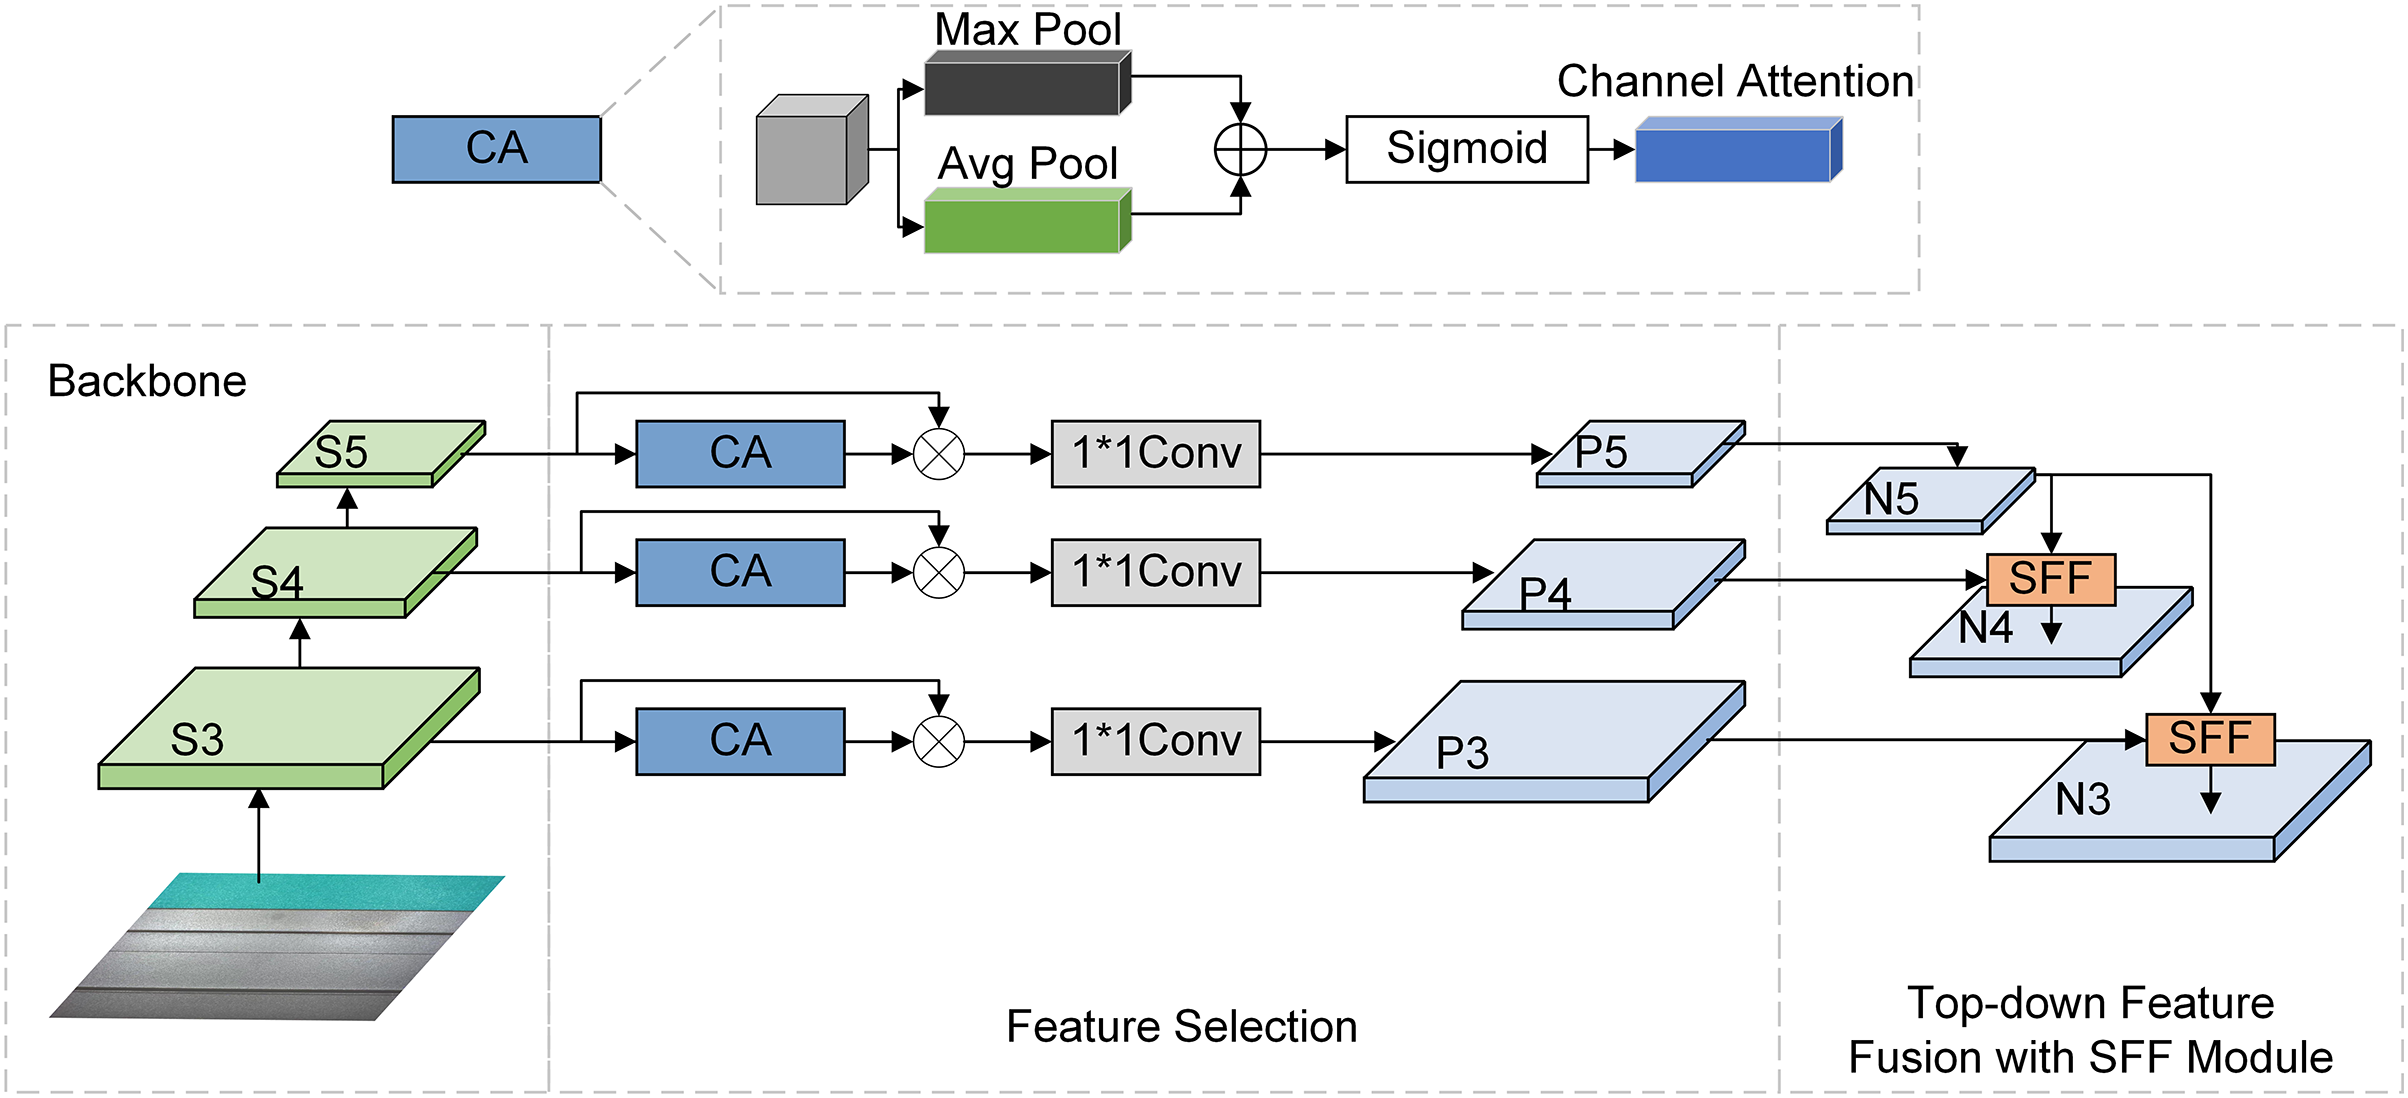
Figure 5: HS-FPN structural diagram
The SFF module takes the deep features as weights to filter the necessary semantic information contained in the shallow features and combines the filtered features with the deep semantic features in a point-by-point manner to achieve multiscale feature fusion. As shown in Fig. 6, the deep features are sampled via a transposed convolution and bilinear interpolation in turn, and the dimensions of the deep and shallow features are unified. Then, the CA module transforms shallow features into attention weights to filter them. Eventually, the filtered shallow features are integrated with high-level features. This process enhances the model’s ability for feature expression.
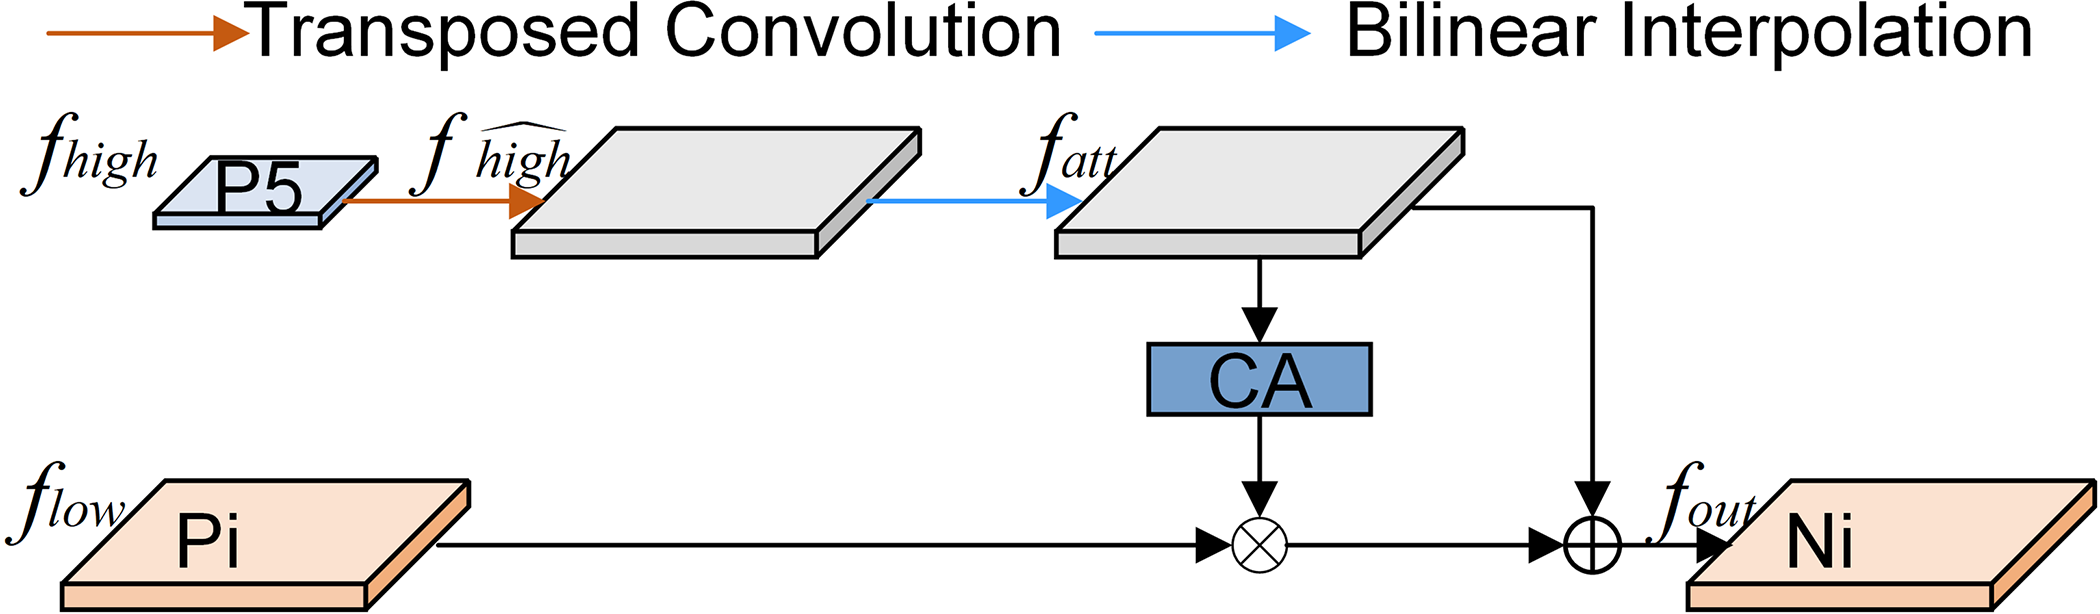
Figure 6: The framework of the SFF model
The formulas for the SFF module are as follows:
where
The ELA module can effectively capture the region of interest’s position and maintain the model’s lightweight property. Fig. 7 illustrates that the spatial ELA module uses strip-like pooling to capture horizontal and vertical features. First, average pooling is used to prevent irrelevant regions from affecting the label prediction process while obtaining information, thus generating abundant target location features in their corresponding directions. Next, a 1D convolution is used to interact with the two generated features, and the convolution kernel size can be optionally modified to control the scope of interaction. Then, group normalization (GN) and a sigmoid function are used to process the generated features to acquire location attention predictions in two directions. Finally, these two predictions are multiplied to obtain the final location attention values. Compared with commonly used 2D convolutions, 1D convolutions are more suitable for handling sequential signals and are lighter and faster. GN outperforms BN with respect to performance and generalizability. In summary, the ELA module makes accurately locating the region of interest easier with its lightweight and straightforward design, which improves the resulting performance.
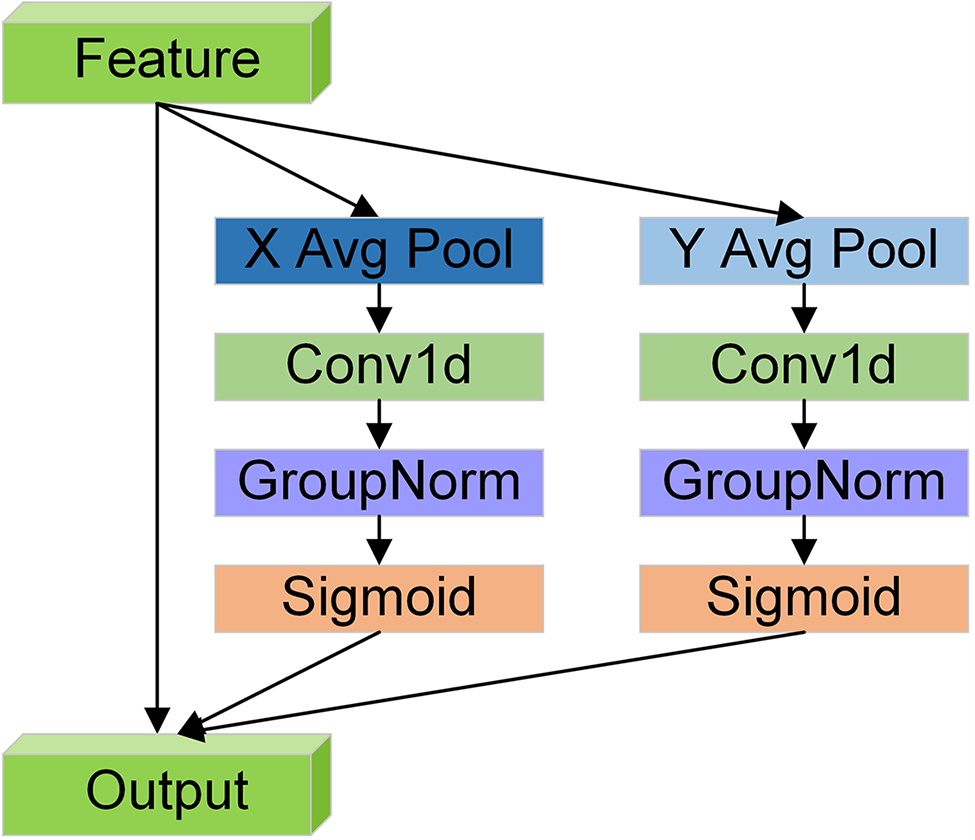
Figure 7: ELA structural diagram
The corresponding formulas are as follows:
where
Since the CA module needs to calculate the attention weight of the entire feature map and long-distance dependencies cannot be captured, which affects the model’s detection accuracy, this paper replaces the CA module with the ELA module to obtain ELA_HSFPN. Through this fusion module, the model can effectively address multiscale detection tasks and attain improved performance.
The number of parameters required by the YOLOv8n detection head is much greater than that of the YOLOv5 version, accounting for nearly 1/3 of the whole model. The reason for this is that YOLOv8n adopts a decoupling head structure to split regression and classification tasks. For multiclass defect detection cases, the use of a decoupling head can significantly improve the model’s feature extraction ability because during the multiclass training process, the classification (Cls) branch is related to the class, and the bounding box (Bbox) regression branch is unrelated to the class. In the one-class detection case, the Cls branch and the Bbox regression branch are related to the class, so it is often better to use a coupling head with shared parameters. The YOLOv8 detection head uses two 3 × 3 convolutions and one 1 × 1 convolution in each branch, which greatly increases the number of required parameters. To make the detection head lightweight and mitigate the loss of detection accuracy, an SCDH is designed to replace the original detection head, and its structure is shown in Fig. 8.
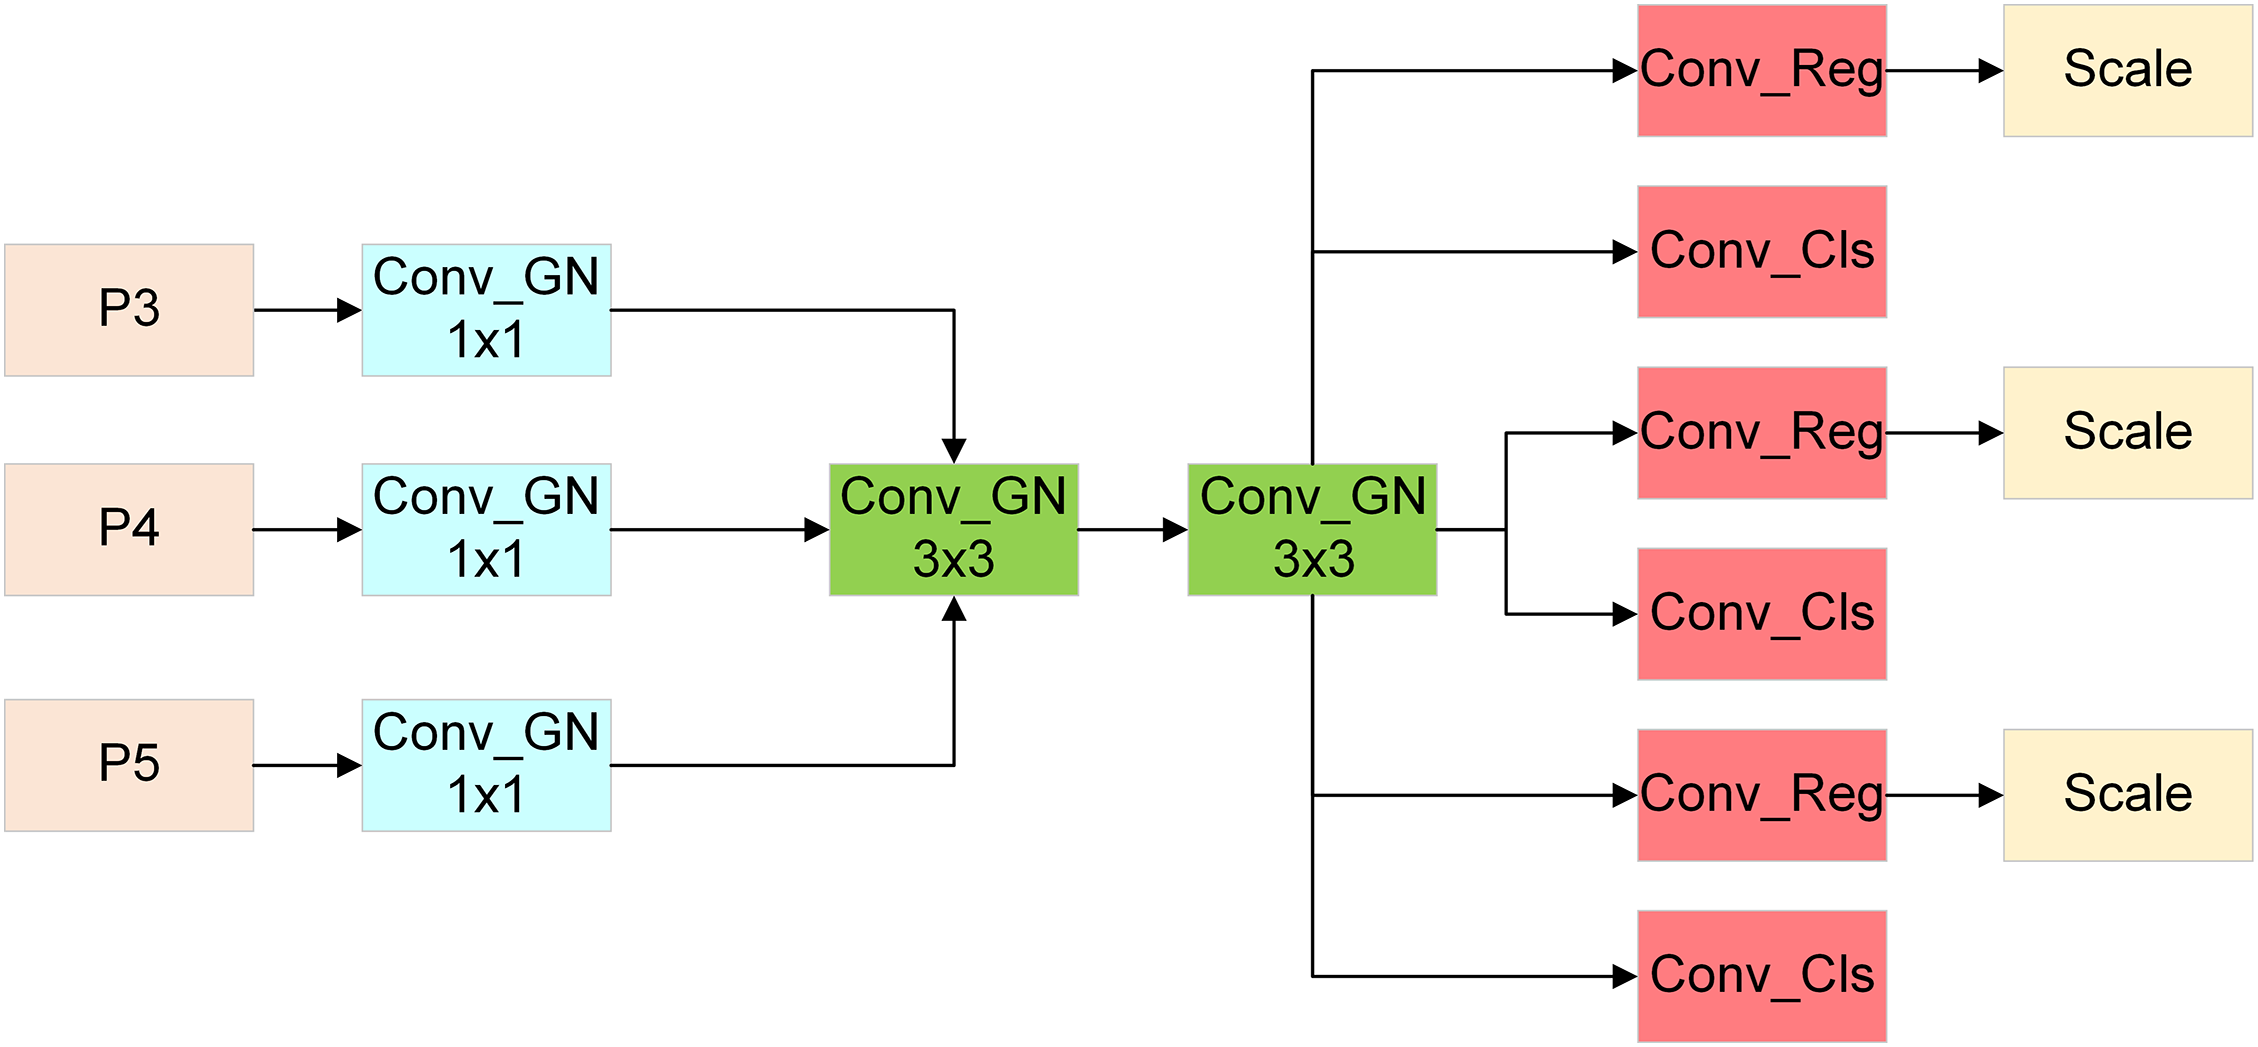
Figure 8: SCDH structural diagram
The three feature layers begin by modifying the channel count through a 1 × 1 convolution performed on the extracted features. Next, the number of parameters is significantly decreased by two simultaneous 3 × 3 shared convolutions, making the model more lightweight. Finally, we separate the regression and classification branches. Moreover, the detection head’s feature extraction capability weakens after its weight is reduced; thus, GN is introduced to supplant the BN operation within the original convolution module as a remedy for preventing significant performance degradation. As mentioned in the section concerning the previous improvement module, GN outperforms BN in terms of performance and generalizability. In addition, GN was proven to enhance the detection head’s localization and classification performance in fully convolutional one-stage object detection (FCOS) [25]. A scale layer is applied after the regression branch to scale the features, thus solving the problem that the target scales detected by each detection head is different when using a shared convolution. In summary, through the SCDH, the numbers of parameters and calculations needed by the whole model can be greatly reduced, and the generalizability and robustness of the model can be enhanced while retaining its lightweight characteristics.
The intersection over union (IoU) is a measure of how well a given object is detected in a dataset and is calculated as the union of the predicted and true boxes divided by the intersection between the predicted and true boxes. YOLOv8 uses the CIoU in its regression loss, which is an improvement upon the generalized IoU (GIoU) and distance IoU (DIoU) because of their shortcomings. It increases the loss of the detection box scale and the length and width losses to make the predicted box more consistent with the true box, but its aspect ratio is described by a relative value, which involves some ambiguity. When the predicted box matches the real box in aspect ratio, the penalty effect disappears, and the loss function is difficult to optimize. Thus, this paper substitutes the CIoU with the SIoU, which contains four cost functions: an angle cost, a distance cost, a shape cost, and an IoU cost.
The angle cost uses angles to perceive losses, as shown in Fig. 9, which helps to enhance the model’s training speed and accuracy. It also helps mitigate model complexity, especially in terms of solving the “wandering” problem when predicting distance-related variables. Its formula is as follows:
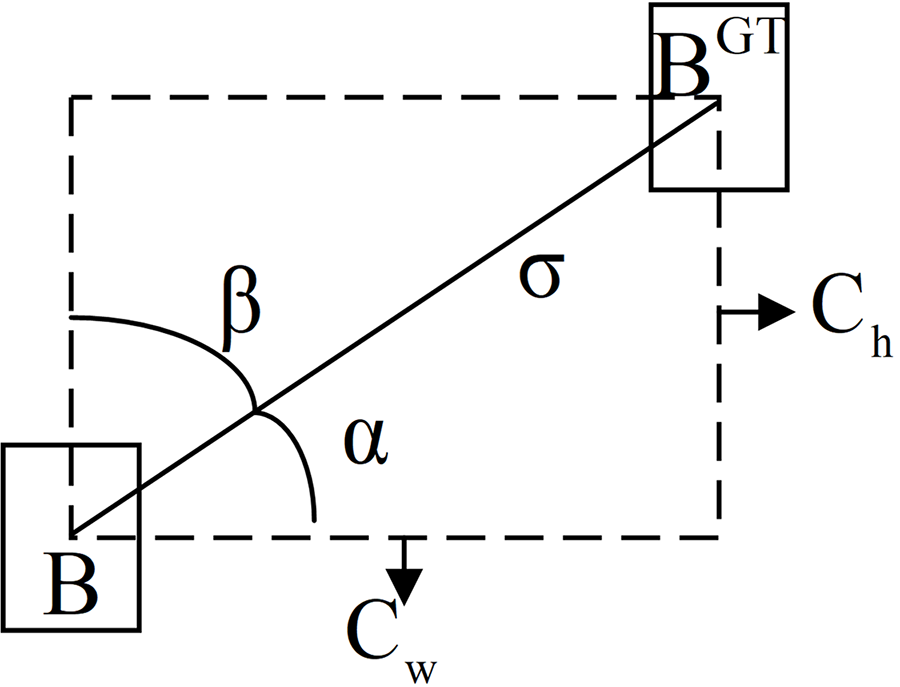
Figure 9: Angle cost diagram
where
The distance cost is an optimization of the angle cost. As shown in Fig. 10, the core idea is that as the angle difference between the predicted box and the true box increases, the contribution of the distance error to the overall loss should be significantly reduced, making the predicted box closer to the true box regarding their spatial positions.
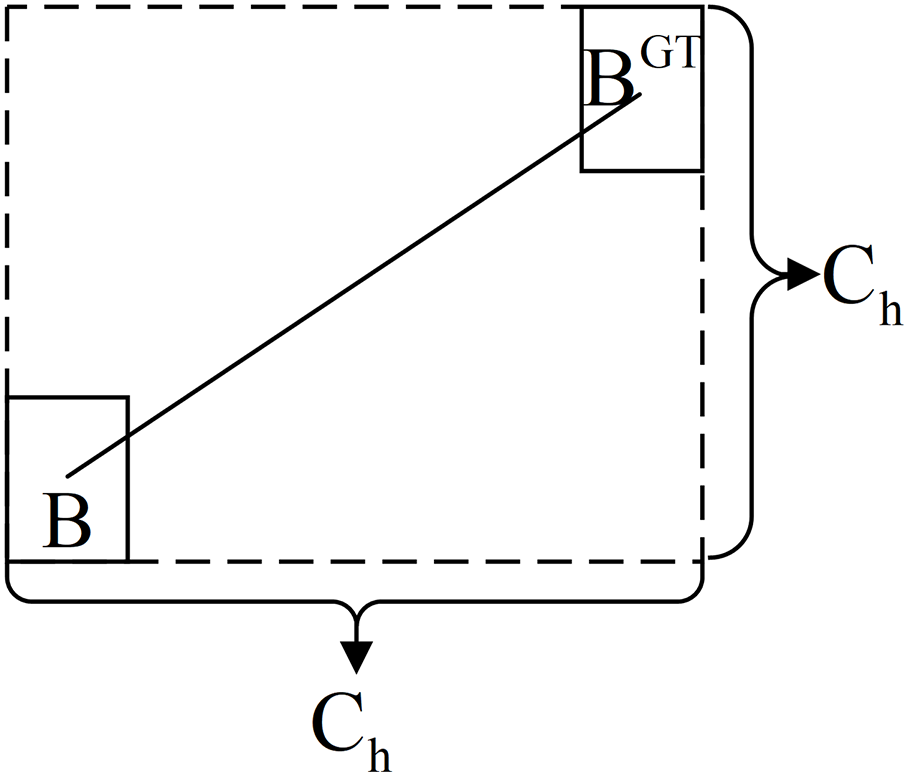
Figure 10: Distance cost diagram
Its formula is as follows:
where
The shape cost is the part of the loss function that is responsible for handling aspect ratio mismatches, that is, judging the similarity in shape between the predicted box and the true box. Its formula is as follows:
where
The IoU cost is simply 1 minus the ratio between the intersection and union of the two boxes, as shown in Fig. 11, which is intended to emphasize the nonoverlap between the two. Its formula is as follows:

Figure 11: IoU diagram
In summary, the formula for the SIoU is as follows:
The SIoU is an improved IoU loss that aims to provide a smoother gradient to enhance the convergence speed and prediction accuracy of the constructed model. It considers the angle, distance and shape costs of the bounding box on the basis of calculating the IoU to enhance the accuracy and robustness of the localization results. The improved YOLOv8 network structure is shown in Fig. 12.

Figure 12: Diagram of the improved YOLOv8 network architecture
4 Experimental Results and Discussion
In this work, the APSPC aluminum defect detection dataset is used to confirm the effectiveness of improvements presented herein. The pictures in the APSPC dataset are derived from the innovation competition held by Tianchi Laboratory. This dataset contains 1885 images with a resolution of 2560 × 1960, and the images cover 10 categories: depression, nonconductive, scratch, orange peel, reveal, bruise, pit, coating cracking, embossing powder and dirty spot defects. Examples of various types of defects are shown in Fig. 13.
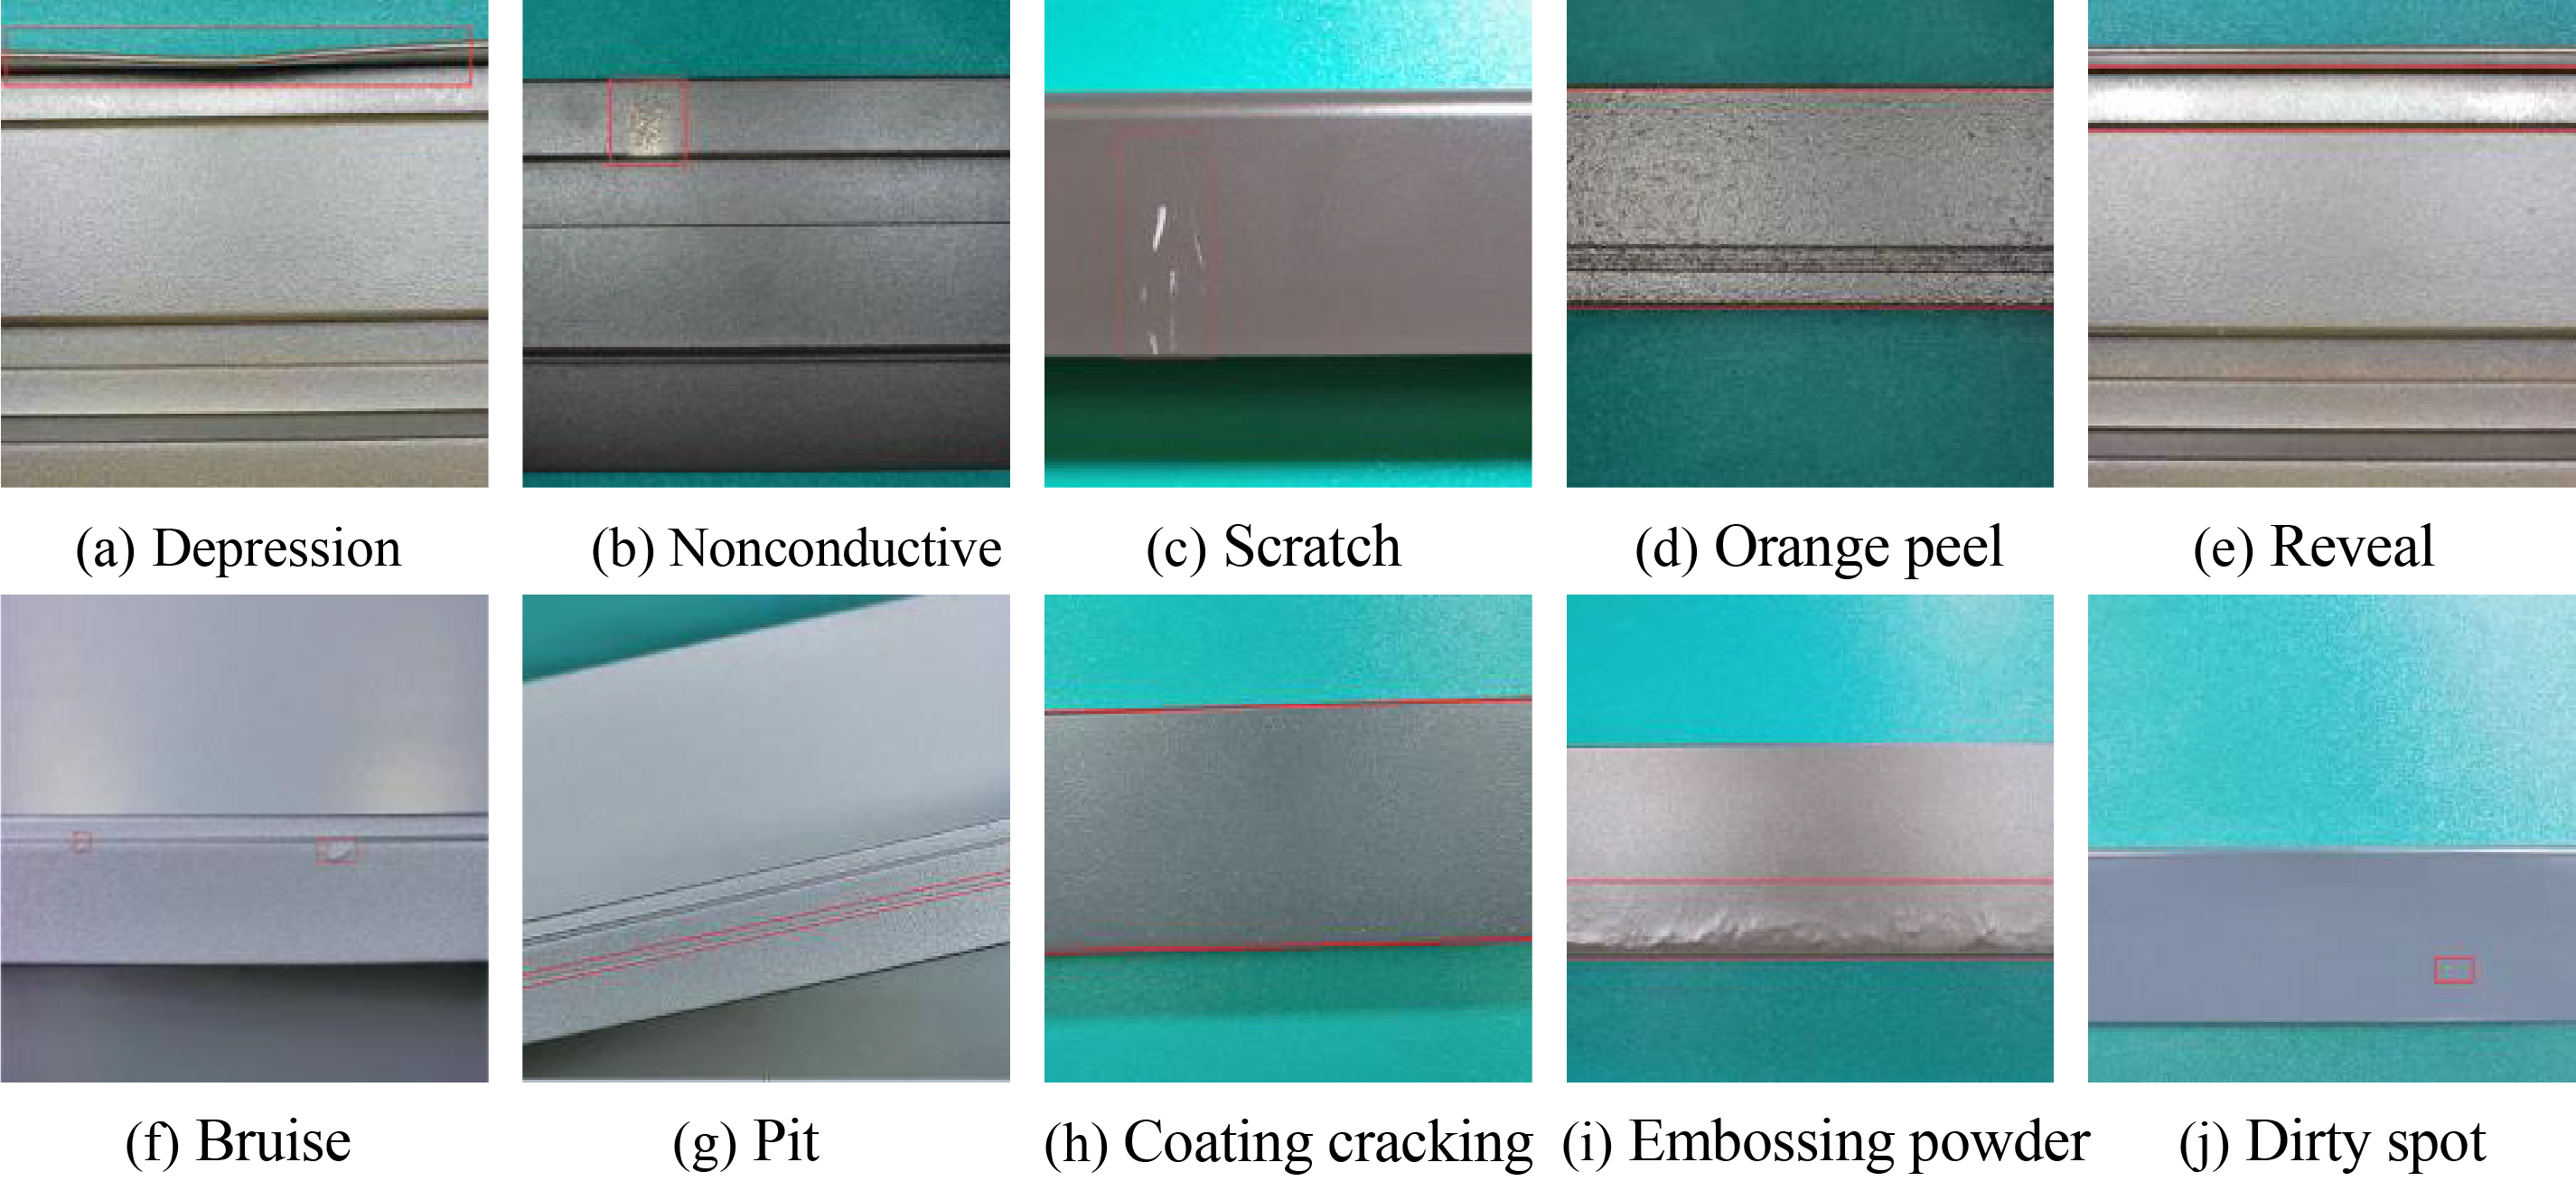
Figure 13: Defect example diagram
When the amount of sample data is insufficient, overfitting easily occurs, which affects the training process and reduces the model’s generalizability. Therefore, it is crucial to enhance the dataset before starting the experiment. In terms of an online enhancement, the initial YOLOv8 model has Mosaic turned on by default. For offline enhancement purposes, this experiment adopts the method of first performing division and then applying the enhancement because the method of first applying the enhancement and then performing division will cause data leakages; this leads to enhanced images of the pictures in the validation set appearing in the training set, which leads to the evaluation results produced by the model being too optimistic. Although this strategy can improve the core indicators after training, it affects the actual detection effect. Therefore, this paper first divides the dataset at a ratio of 8:2 and then expands the training set with horizontal, vertical and horizontal-vertical flipping, resulting in a final training set consisting of 4131 images and a validation set containing 360 images.
4.2 Experimental Environment and Parameter Settings
The hardware environment used for the experiment is as follows: the CPU is an Intel Core i9-13980HX, the GPU is an NVIDIA GeForce RTX 4080, and the memory is 32 GB. The software environment includes Windows 11 (version number 23H2), the programming language is Python 3.11.9, and the deep learning framework is PyTorch 2.3.0, with CUDA version 12.6. The experimental parameters are kept constant throughout the training process. The specific parameters are shown in Table 1.

In this experiment, we assess the performance of the proposed model via the precision (P), recall (R), mean average precision at IoU = 0.5 (mAP@0.5), mAP@0.5:0.95, number of parameters (Params), giga floating-point operations per second (GFLOPs), and frames per second (FPS) metrics. The relevant calculation formulas are provided below:
where true positives (
To verify the effectiveness of each improved module, this paper conducts a series of ablation experiments on the APSPC dataset for testing YOLOv8n. The results are shown in Table 2.

Experiment 1 uses the benchmark data before applying the improvement for comparison purposes in the subsequent experiments. In experiment 2, only the last two C2f modules in the high-level part of the backbone are replaced by the C2f_DWR_DRB. This module increases the ERF without increasing the burden imposed on the model, which increases the mAP@ 0.5 and mAP@ 0.5:0.95 by 0.9% and 0.6%, respectively, reduces the number of parameters and calculations by 6.7% and 3.7%, respectively, and increases the FPS by 7.5%. In experiment 3, ELA_HSFPN is used to replace the feature fusion part of the original model, as it can more effectively address multiscale detection tasks. The mAP@ 0.5 and mAP@ 0.5:0.95 are increased by 3.6% and 1.4%, respectively, and the number of parameters and number of calculations are reduced by 16.7% and 14.8%, respectively. In experiment 4, the SCDH is used to replace the original detection head, which can enhance the generalization ability and robustness of the model while retaining its lightweight characteristics. The mAP@ 0.5 and mAP@ 0.5:0.95 are increased by 3.5% and 1.2%, respectively, and the number of parameters and number of calculations are reduced by 20% and 19.8%, respectively, while a high number of detection frames is maintained. In experiment 5, the SIoU is used to provide a smoother gradient for enhancing the convergence speed and prediction accuracy of the model, and doing so increases the mAP@0.5 and mAP@ 0.5:0.95 by 1.7% and 1.0%, respectively. In experiments 6 to 14, any two or three improvement modules are combined; the mAP@0.5 values of the each model improve upon that of the baseline, and all variants reduce the model size. Finally, in experiment 15, these four modules are integrated into the model together; the P, R and FPS metrics are increased by 4.4%, 4% and 4.9%, respectively; mAP@0.5 and mAP@0.5:0.95 are increased by 5.1% and 2.4%, respectively; and the numbers of parameters and calculations are reduced by 33.3% and 32.1%, respectively, to achieve the goal of achieving improved detection performance while maintaining a low weight. However, when experiment 15 reaches the highest P, R decreases compared with the previous experiments, because P and R are typically in a trade-off relationship. In some cases, in order to improve P, the model will become more conservative, that is, only when the sample is very certain will the model predict it to be positive. This may lead to some samples that could be predicted as positive being judged as negative, thus reducing R.
Ablation experiments demonstrate that, within the aluminum surface defect dataset, the four improvements developed in this paper and their combinations are helpful for improving the resulting detection performance, which proves the effectiveness of each module.
4.5.1 Loss Function Comparison Experiments
To verify the superiority of the SIoU loss function in aluminum surface defect detection tasks over other mainstream loss functions, the loss function is replaced based that of the YOLOv8n model on the APSPC dataset to complete a comparison experiment.
As shown in Table 3, the mAP@0.5 of the SIoU outperforms those of the other mainstream loss functions, such as efficient IoU (EIoU). Compared with the CIoU used by the model before applying the improvement, although the SIoU decreases by 2.28% in terms of FPS, it still maintains a high detection speed and increases by R 2.1%, which reduces the missed detection rate of the model; it also increases the mAP@0.5 by 1.7%, which represents a detection accuracy improvement. Although the GIoU and inner-CIoU losses have the highest precision and recall values, respectively, they lag behind the SIoU in terms of other metrics as well as the most important mAP@0.5 measure. Through this experiment, it can be proven that the SIoU has the best comprehensive performance and positioning accuracy on the aluminum surface defect dataset.

4.5.2 Algorithm Comparison Experiments
To vlidate the superiority of the proposed algorithm in aluminum surface defect detection tasks over other mainstream YOLO algorithms and recent scholar’s improved algorithm YOLOv8-FD [26], comparative experiments are performed on the APSPC dataset under identical experimental conditions and parameter configuration.
As shown in Table 4, the improved algorithm outperforms other algorithms regarding detection accuracy, model parameter quantity and calculation quantity. The proposed algorithm provides a 2.4% mAP@0.5 increase over YOLOv5n, and the model parameters and calculations are decreased by 20% and 22.5%. Compared with those of the newer YOLOv11n and YOLOv12n models, the mAP@0.5 of the proposed algorithm is 3.5% and 4.2% higher, respectively, and it has the highest detection speed with the smallest numbers of parameters and calculations. Compared with YOLOv8-FD, the mAP@0.5 of the proposed algorithm is 2.0% higher, which proves its outstanding performance in addressing multiscale detection task. Although the YOLOv8-FD algorithm makes the network lightweight by using dynamic unsampling feature pyramid network (DUFPN) at the neck, it causes a significant drop in FPS, while the proposed algorithm strikes a superior balance between lightweight and detection performance through SCDH. This experiment demonstrates that on the aluminum surface defect dataset, the proposed algorithm can carry out the detection task most efficiently.

4.6 Generalization Experiments
To vlidate the generalizability of the proposed algorithm to other industrial scenarios, the basic algorithm and the improved algorithm are tested in the same experimental environment and under the same parameter configuration on the open NEU-DET dataset; additionally, YOLOv5n and YOLOv11n, which perform well in the comparative experiment, are selected as controls. The dataset is a steel strip surface defect dataset containing 1800 images with a resolution of 200 × 200, covering 6 categories: crazing, inclusion, patches, pitted surfaces, rolled-in scales and scratches. The number of epochs is set to 300 to achieve a fit.
Although these two datasets respectively focus on the surface defects of aluminum materials and steel materials, there are certain similarities in the types of defects they involve. For example, defects such as scratches and cracks may occur on the surfaces of both materials, only that their manifestations may be slightly different. From the perspective of materials science, there are certain commonalities in the formation mechanisms of surface defects of metallic materials, which provides a certain foundation for the model to recognize surface defects on different materials. Secondly, the model learns the general features of defects, such as edges, textures, and shapes, rather than the features specific to the surface defects of a certain material.
As shown in Table 5, our algorithm still achieves the greatest detection accuracy on this dataset. The mAP@0.5 improves by 2.2%, and the FPS increase by 11.4%. Although YOLOv11n in the control group achieves the highest recall rate and FPS in this dataset comparison, the proposed algorithm is still 7.9% and 0.5% ahead of YOLOv11n in terms of the accuracy rate and the key mAP@0.5 indicator, respectively. This experiment clearly shows that the proposed algorithm also exhibits strong detection performance for other defect types, which demonstrates the generalizability of the improved model.

To visually demonstrate the performance enhancement of the improved model, we employ Gradient-weighted Class Activation Mapping (Grad-CAM) heatmap. The heatmap tool helps visualize the detection effects both before and after applying the improvement. The regions that the algorithm focuses on are also darker and redder in color. In this experiment, layers 8 and 10 of the algorithm are selected for heatmap generation, as these layers provide both adequate spatial resolution for object localization and rich semantic information for category identification.
As shown in Fig. 14b, in addition to the defect area, the algorithm without the improvement also pays extra attention to the top side of the image and the bottom border of the aluminum material, and after this interference, the attention paid to the embossing powder defect is also low. Fig. 14c shows that the improved algorithm focuses only on the embossing powder area, eliminates other interference, and detects the defects suffered by slender large strip targets. In Fig. 14e, the original algorithm fails to find the dirty spot and generates a wide range of invalid attention values around it. However, as shown in Fig. 14f, the improved algorithm accurately focuses on the defects and detects point-like small target defects. Through this experiment, it can be proven that the C2f_DWR_DRB and ELA_HSFPN module can effectively enhance model attention.
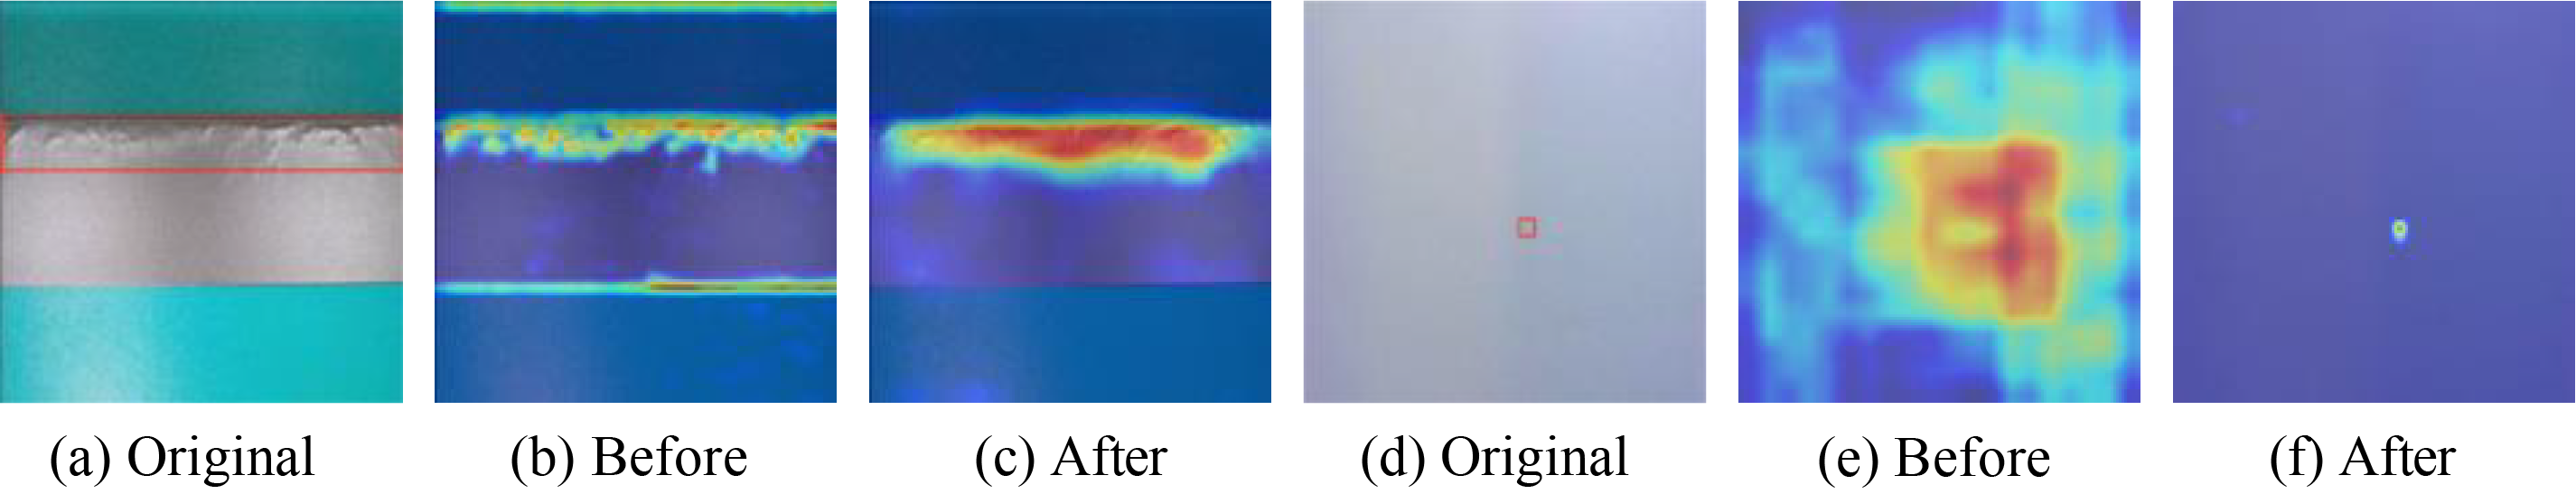
Figure 14: Heatmap comparison
4.7.2 Visual Analysis of P-R Curves
To visually demonstrate the performance enhancement of the improved model for various defect types, P-R curves are employed to visualize the detection effects both before and after applying the improvement. The area under the curve represents the mAP@0.5 for detecting each type of defect.
As shown in Fig. 15, except for a slight decrease in the mAP@0.5 for the scratch and reveal defect types, the mAP@0.5 of other defect types has been improved to varying degrees, demonstrating the improved model’s ability to cope with multi-scale detection tasks.
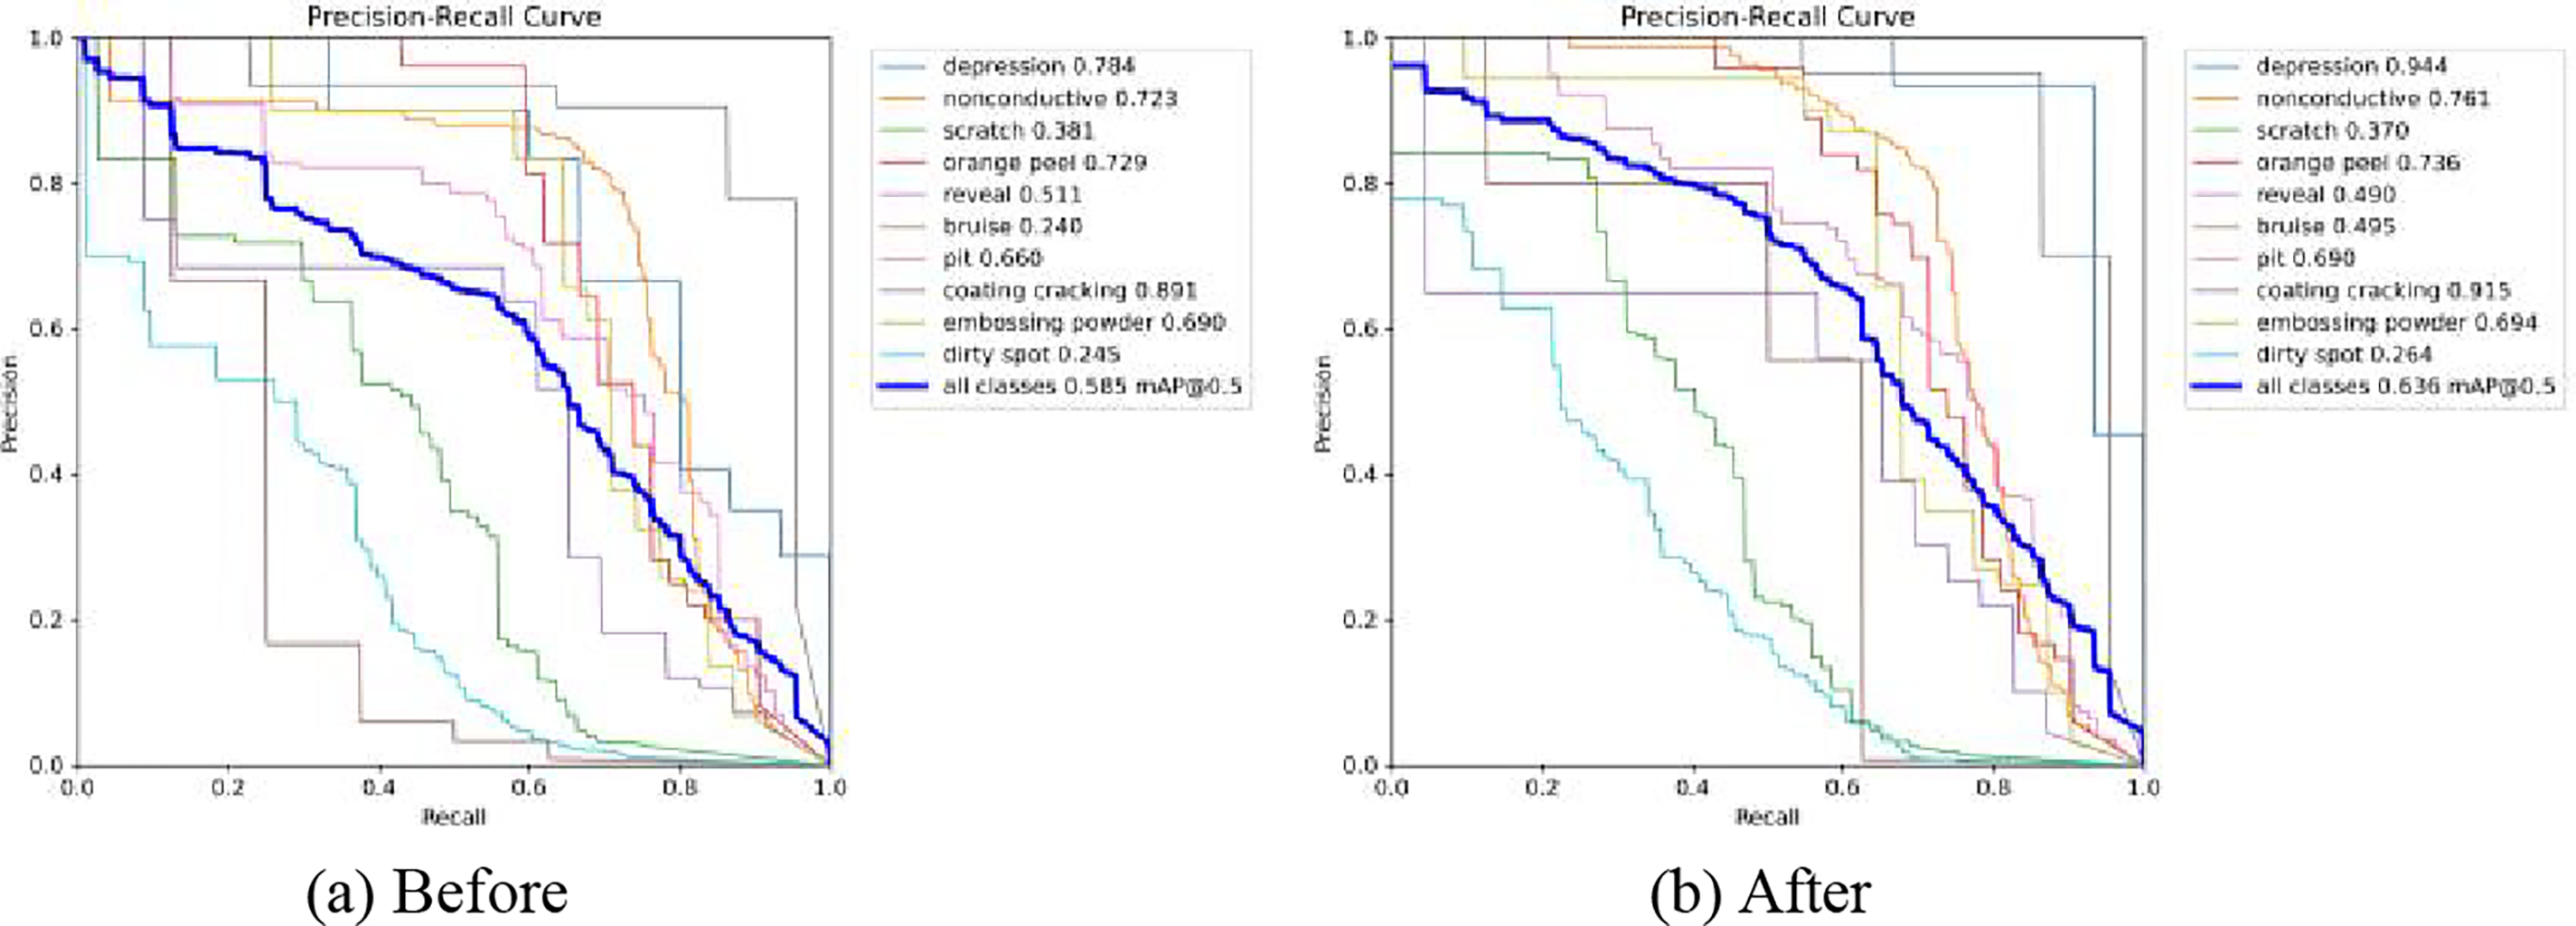
Figure 15: Comparison of P-R curves
4.7.3 Visual Analysis of the Detection Results
For a more comprehensive view of the improved model’s performance gains, we deploy both the improved and original models to detect various defects on the surfaces of aluminum materials, and the results are shown in Fig. 16.
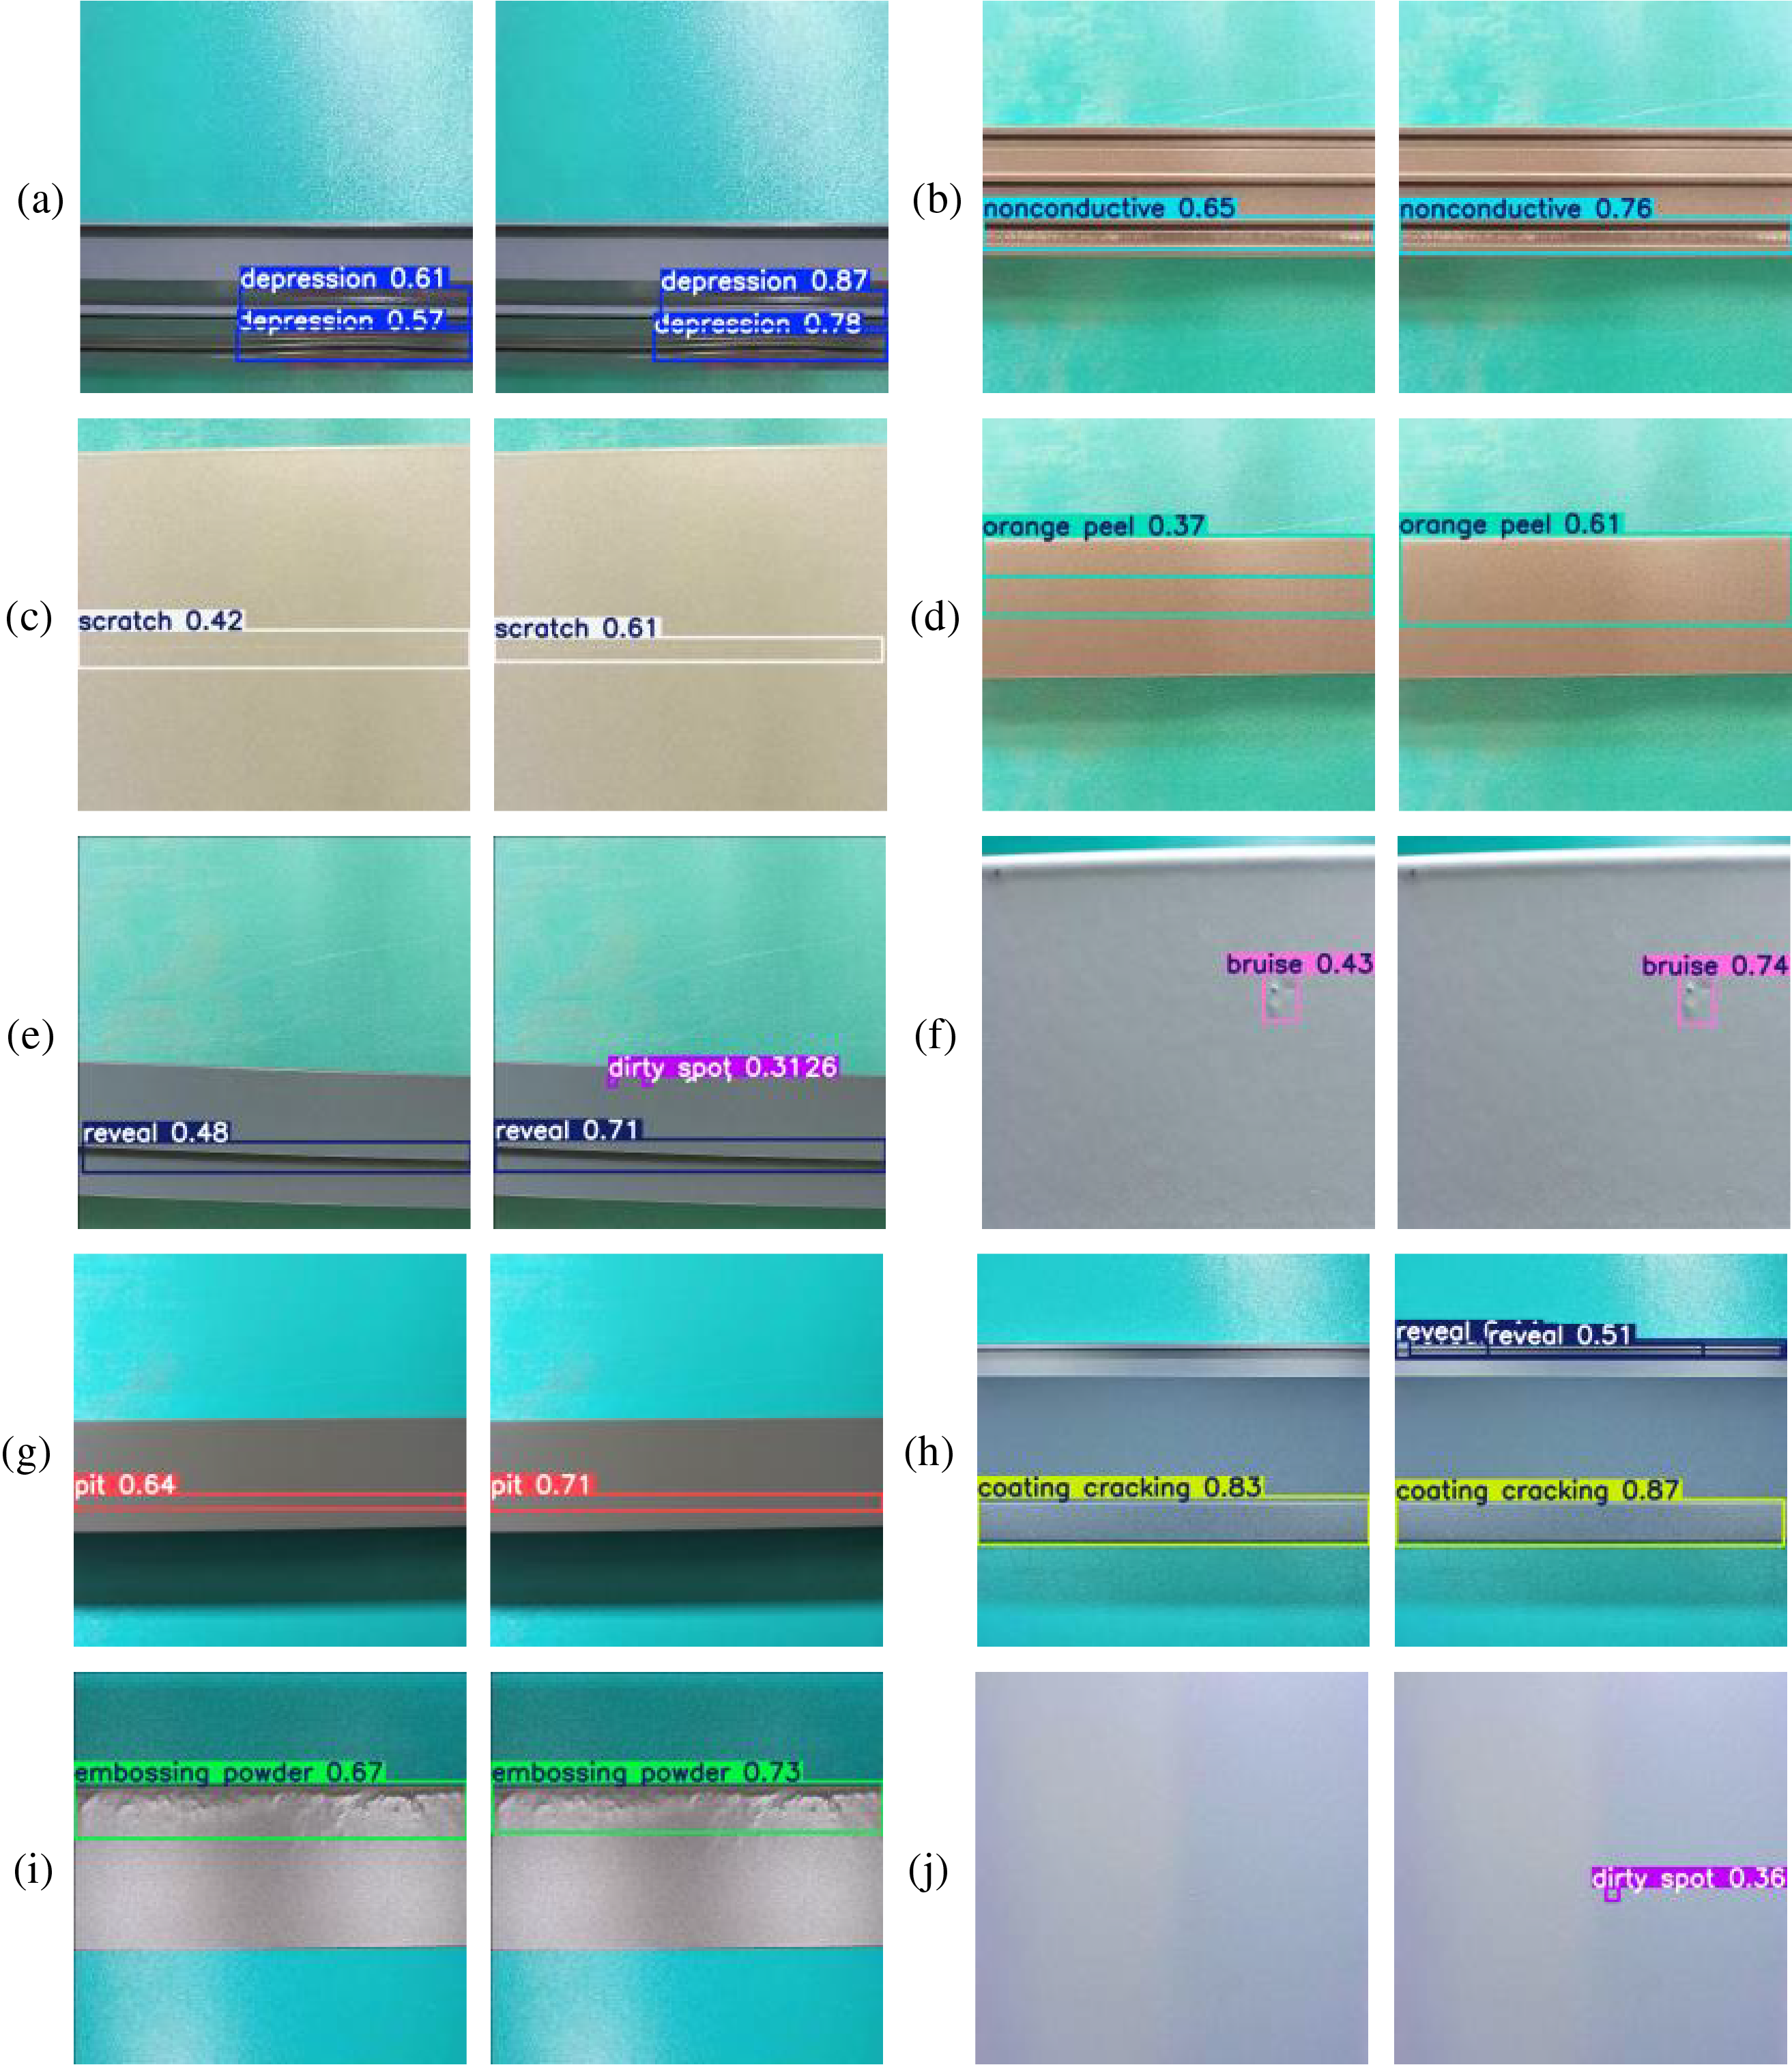
Figure 16: Comparison among the produced detection results
The defects shown in Fig. 16a–j of the above figure are depression, nonconductive, scratch, orange peel, reveal, bruise, pit, coating cracking, embossing powder and dirty spot, respectively. The detection confidence of each picture is improved after the model is improved. In Fig. 16e,j, the original model had weak detection ability for small targets such as dirty spots, and missed detection occurred, but the improved model successfully detected them. In Fig. 16h, the new model not only boosts the detection confidence for large target defects such as coating cracking but also correctly detects the revealed defects. In summary, this visual experiment intuitively shows that the improved model enhances the detection accuracy, has stronger robustness, and can significantly lower the model’s missed detection rate.
To address the aluminum surface defect detection task in actual production processes, this paper proposes an improved YOLOv8n algorithm. First, a DWR module and a DRB are fused and incorporated into C2f, and the C2f_DWR_DRB module is designed to substitute the C2f module at the high level of the backbone network, which enriches the gradient flow information and increases the ERF. Second, the ELA mechanism is used to improve the HSFPN, and an ELA_HSFPN is designed to substitute the original feature fusion module so that the model can more effectively address multiscale detection tasks. An SCDH is then designed to substitute the initial detection head, which enhances the model’s capability and generalizability while retaining its lightweight characteristics. Finally, the SIoU is introduced to substitute the initial loss function to provide a smoother gradient for improving the convergence speed and prediction accuracy of the model. The experimental results show that the improved algorithm achieves improvements in all respects. Compared with those achieved before applying the improvement, the mAP@0.5 is increased by 5.1%, the number of parameters and calculations is decreased by 33.3% and 32.1%, respectively, and the FPS is increased by 4.9%. This approach is lightweight and enhances both the detection accuracy and speed of the constructed model. Compared with other mainstream algorithms, the proposed method demonstrates superior performance in terms of model size and detection accuracy. Moreover, it maintains its performance advantage when applied to other defect types, thereby validating the generalizability of the model. However, our experiment still has some limitations, such as a single dataset source, insufficient sample size, and poor annotation quality. Moreover, the improved algorithm may also have generalizability issues when facing different scenarios, devices, and materials. In future research, on the one hand, we need to enhance further detection accuracy for small targets such as bruises and dirty spots, and for slender strip targets such as scratches, to elevate the overall accuracy level. On the other hand, we need to expand the source and scale of the dataset and improve the consistency of annotation to enhance the generalization ability and accuracy of the model.
Acknowledgement: The authors express their gratitude for the valuable feedback and suggestions provided by all the anonymous reviewers and the editorial team.
Funding Statement: This work was supported by the Jiangsu Province Science and Technology Policy Guidance Program (Industry-University-Research Cooperation)/Forward-Looking Joint Research Project (BY2016005-05).
Author Contributions: The authors confirm their contributions to the paper as follows. Study conception and design: Hao Qiu; data collection: Hao Qiu; analysis and interpretation of the results: Hao Qiu, Shoudong Ni; draft manuscript preparation: Hao Qiu. All authors reviewed the results and approved the final version of the manuscript.
Availability of Data and Materials: The datasets that support the findings of this study are openly available from the APSPC at https://tianchi.aliyun.com/dataset/148297 (accessed on 07 September 2024) and from NEU-DET at http://faculty.neu.edu.cn/songkechen/zh_CN/zdylm/263270/list/ (accessed on 26 March 2025).
Ethics Approval: Not applicable.
Conflicts of Interest: The authors declare no conflicts of interest to report regarding the present study.
References
1. Tao X, Hou W, Xu D. A survey of surface defect detection methods based on deep learning. Acta Autom Sin. 2021;47(5):1017–34. (In Chinese). doi:10.16383/j.aas.c190811. [Google Scholar] [CrossRef]
2. Cardellicchio A, Nitti M, Patruno C, Mosca N, di Summa M, Stella E, et al. Automatic quality control of aluminium parts welds based on 3D data and artificial intelligence. J Intell Manuf. 2024;35(4):1629–48. doi:10.1007/s10845-023-02124-1. [Google Scholar] [CrossRef]
3. Girshick R, Donahue J, Darrell T, Malik J. Rich feature hierarchies for accurate object detection and semantic segmentation. In: 2014 IEEE Conference on Computer Vision and Pattern Recognition; 2014 Jun 23–28; Columbus, OH, USA; 2014. p. 580–7. doi:10.1109/cvpr.2014.81. [Google Scholar] [CrossRef]
4. Ren S, He K, Girshick R, Sun J. Faster R-CNN: towards real-time object detection with region proposal networks. IEEE Trans Pattern Anal Mach Intell. 2017;39(6):1137–49. doi:10.1109/TPAMI.2016.2577031. [Google Scholar] [PubMed] [CrossRef]
5. Liu W, Anguelov D, Erhan D, Szegedy C, Reed S, Fu CY, et al. SSD: single shot MultiBox detector. In: Leibe B, Matas J, Sebe N, WellingM, editors. Computer vision—ECCV 2016. Cham, Switzerland: Springer International Publishing; 2016. p. 21–37. doi: 10.1007/978-3-319-46448-0_2. [Google Scholar] [CrossRef]
6. Redmon J, Divvala S, Girshick R, Farhadi A. You only look once: unified, real-time object detection. In: 2016 IEEE Conference on Computer Vision and Pattern Recognition (CVPR); 2016 Jun 27–30; Las Vegas, NV, USA; 2016. p. 779–788. doi:10.1109/cvpr.2016.91. [Google Scholar] [CrossRef]
7. Redmon J, Farhadi A. YOLO9000: better, faster, stronger. In: 2017 IEEE Conference on Computer Vision and Pattern Recognition (CVPR); 2017 Jul 21–26; Honolulu, HI, USA; 2017. p. 6517–25. doi: 10.1109/CVPR.2017.690. [Google Scholar] [CrossRef]
8. Redmon J, Farhadi A. YOLOv3: an incremental improvement. arXiv:1804.02767. 2018. [Google Scholar]
9. Bochkovskiy A, Wang CY, Liao HM. YOLOv4: optimal speed and accuracy of object detection. arXiv:2004.10934. 2020. [Google Scholar]
10. Li CY, Li LL, Jiang HL, Weng KH, Geng YF, Li L. YOLOv6: a single-stage object detection framework for industrial applications. arXiv:2209.02976. 2022. [Google Scholar]
11. Yin Y, Li H, Fu W. Faster-YOLO: an accurate and faster object detection method. Digit Signal Process. 2020;102(6):102756. doi:10.1016/j.dsp.2020.102756. [Google Scholar] [CrossRef]
12. Gui Z, Geng J. YOLO-ADS: an improved YOLOv8 algorithm for metal surface defect detection. Electronics. 2024;13(16):3129. doi:10.3390/electronics13163129. [Google Scholar] [CrossRef]
13. Gao DY, Chen TD, Miao L. Improved road object detection algorithm for YOLOv8n. Comput Eng Appl. 2024;60(16):186–97. (In Chinese). [Google Scholar]
14. Deng TM, Chen YT, Yu Y, Xie PF, Li QY. Pavement disease detection algorithm focusing on shape features. Comput Eng Appl. 2024;60(24):291–305. (In Chinese). [Google Scholar]
15. Wang CY, Yeh IH, Liao HM. YOLOv9: learning what you want to learn using programmable gradient information. Comput Vis Pattern Recognit. 2024;2402:13616. [Google Scholar]
16. Tian P, Mao L. Improved YOLOv8 object detection algorithm for traffic sign target. Comput Eng Appl. 2024;60(8):202–12. (In Chinese). [Google Scholar]
17. Lu M, Sheng W, Zou Y, Chen Y, Chen Z. WSS-YOLO: an improved industrial defect detection network for steel surface defects. Measurement. 2024;236(3):115060. doi:10.1016/j.measurement.2024.115060. [Google Scholar] [CrossRef]
18. Yang M, Fan X. YOLOv8-lite: a lightweight object detection model for real-time autonomous driving systems. IECE Trans Emerg Top Artif Intell. 2024;1(1):1–16. doi:10.62762/tetai.2024.894227. [Google Scholar] [CrossRef]
19. Wei H, Liu X, Xu S, Dai Z, Dai Y, Xu X. DWRSeg: rethinking efficient acquisition of multi-scale contextual information for real-time semantic segmentation. arXiv:2212.01173. 2022. [Google Scholar]
20. Ding X, Zhang Y, Ge Y, Zhao S, Song L, Yue X, et al. UniRepLKNet: a universal perception large-kernel ConvNet for audio, video, point cloud, time-series and image recognition. arXiv:2311.15599. 2024. [Google Scholar]
21. Zhou L, Rao X, Li Y, Zuo X, Qiao B, Lin Y. A lightweight object detection method in aerial images based on dense feature fusion path aggregation network. ISPRS Int J Geo Inf. 2022;11(3):189. doi:10.3390/ijgi11030189. [Google Scholar] [CrossRef]
22. Ghiasi G, Lin TY, Le QV. NAS-FPN: learning scalable feature pyramid architecture for object detection. In: 2019 IEEE/CVF Conference on Computer Vision and Pattern Recognition (CVPR); 2019 Jun 15–20; Long Beach, CA, USA; 2019. p. 7029–38. doi:10.1109/cvpr.2019.00720. [Google Scholar] [CrossRef]
23. Xu W, Wan Y. ELA: efficient local attention for deep convolutional neural networks. arXiv:2403.01123. 2024. [Google Scholar]
24. Chen Y, Zhang C, Chen B, Huang Y, Sun Y, Wang C, et al. Accurate leukocyte detection based on deformable-DETR and multi-level feature fusion for aiding diagnosis of blood diseases. Comput Biol Med. 2024;170(1):107917. doi:10.1016/j.compbiomed.2024.107917. [Google Scholar] [PubMed] [CrossRef]
25. Tian Z, Shen CH, Chen H, He T. FCOS: fully convolutional one-stage object detection. arXiv:1904.01-355. 2019. [Google Scholar]
26. Ma L, Li Y, Wang YX. YOLOv8-FD: YOLOv8 improved method for detecting surface defects on steel plates. Comput Eng Appl. 2024;60(24):211–21. (In Chinese). [Google Scholar]
Cite This Article
 Copyright © 2025 The Author(s). Published by Tech Science Press.
This work is licensed under a Creative Commons Attribution 4.0 International License , which permits unrestricted use, distribution, and reproduction in any medium, provided the original work is properly cited.
 Downloads
 Citation Tools