
 Submit a Paper
 Propose a Special lssue
 Open Access
ARTICLE
Image-Based Air Quality Estimation by Few-Shot Learning
1 Faculty of Artificial Intelligence, Posts and Telecommunications Institute of Technology, Nguyen Trai, Ha Noi, 100000, Viet Nam
2 Faculty of Information Technology, Posts and Telecommunications Institute of Technology, Nguyen Trai, Ha Noi, 100000, Viet Nam
3 Young Innovation Research Laboratory on Digital Technology (YIRLoDT), Posts and Telecommunications Institute of Technology, Nguyen Trai, Ha Noi, 100000, Viet Nam
* Corresponding Author: Hoai Nam Vu. Email:
Computers, Materials & Continua 2025, 84(2), 2959-2974. https://doi.org/10.32604/cmc.2025.064672
Received 21 February 2025; Accepted 06 May 2025; Issue published 03 July 2025
 View Full Text
 Download PDF
Abstract
Air quality estimation assesses the pollution level in the air, supports public health warnings, and is a valuable tool in environmental management. Although air sensors have proven helpful in this task, sensors are often expensive and difficult to install, while cameras are becoming more popular and accessible, from which images can be collected as data for deep learning models to solve the above task. This leads to another problem: several labeled images are needed to achieve high accuracy when deep-learning models predict air quality. In this research, we have three main contributions: (1) Collect and publish an air quality estimation dataset, namely PTIT_AQED, including environmental image data and air quality; (2) Propose a deep learning model to predict air quality with few data, called PTIT_FAQE (PTIT Few-shot air quality estimation). We build PTIT_FAQE based on EfficientNet-a CNN architecture that ensures high performance in deep learning applications and Few-shot Learning with Prototypical Networks. This helps the model use only a few training data but still achieve high accuracy in air quality estimation. And (3) conduct experiments to prove the superiority of PTIT_FAQE compared to other studies on both PTIT_AQED and APIN datasets. The results show that our model achieves an accuracy of 0.9278 and an F1-Score of 0.9139 on the PTIT_AQED dataset and an accuracy of 0.9467 and an F1-Score of 0.9371 on the APIN dataset, which demonstrate a significant performance improvement compared to previous studies. We also conduct detailed experiments to evaluate the impact of each component on model performance.Keywords
Air quality is one of the most important factors affecting the environment and public health. Poor air quality can lead to serious health problems such as respiratory diseases, cardiovascular diseases and increased mortality. According to the World Health Organization (WHO), outdoor air pollution causes about 4.2 million deaths each year, mainly related to PM2.5. Some reports indicate that this number could be as high as 8.8 million if pollution from both man-made and natural sources is included [1].
Traditional air quality monitoring methods often use physical sensors, which are expensive and have limited coverage. In addition, these sensors require regular maintenance and must be installed in fixed locations, reducing flexibility. With the development of the Internet of Things (IoT) and smart cities, sensor systems have become more diverse and familiar. A modern and highly efficient approach is to utilize unmanned aerial vehicles (UAVs). Ref. [2] proposes a UAV-based monitoring system equipped with sensors to measure atmospheric components and generate high-resolution air pollution maps. The UAV operates autonomously, collecting data on a citywide scale, identifying pollution sources, and analyzing the impact of transportation on air quality. To improve the accuracy and consistency of air pollution mapping, [3] introduces a network that extends monitoring coverage beyond the limitations of a single UAV, by involving subdividing the target area and conducting simultaneous measurements across different atmospheric layers, which helps increases coverage by over 30% and reduce the required number of UAVs by 25%. In a different approach, many research groups have come up with the idea of combining machine learning techniques with sensor data to monitor and predict air quality, using complex computational models between AQI and other influencing factors such as temperature, humidity and wind speed to train a model to predict air quality [4], the most popular of which is the neural network [5]. These include optimizing backpropagation neural networks [6], long short-term memory networks (LSTMs) [7], or convolutional neural networks (CNNs) [8] to predict the concentrations of pollutants such as
In recent years, advances in computer vision and deep learning have opened up new avenues for air quality estimation from images. Because camera networks are becoming denser and more accessible, studies using camera images to predict air quality are gaining attention. Solutions of using sensor-based statistical models or combining with UAVs would achieve high precision, but they also require relatively large investment in operation and maintenance, while utilizing images would be more economical and flexible. In this paper, we introduce a dataset of air quality images to supplement the training data for studies on air quality estimation from images. We also propose a new model called PTIT_FAQE (PTIT Few-shot air quality estimation), based on Few-shot Learning [9] with Prototypical Networks [10] to overcome the limitation of requiring a large amount of data during training of CNN models. Few-shot learning is chosen for air quality estimation due to the absence of pretrained models specifically designed for this task. Traditional transfer learning approaches depend on pretrained models from related domains; however, no suitable source model currently exists for air quality estimation from images. Furthermore, certain air quality categories, such as “Very Unhealthy” or “Severe,” are rarely observed in many regions, resulting in a scarcity of labeled training data for these classes. By enabling models to generalize from a limited number of examples, few-shot learning provides a more effective solution in this context. PTIT_FAQE shows a significant improvement in accuracy compared to other deep learning models when trained with a small amount of data. The experimental results show that PTIT_FAQE achieves an accuracy of 0.9278 and an F1-Score of 0.9139 on our published dataset, and an accuracy of 0.9467 and an F1-Score of 0.9371 on the available dataset. These results demonstrate that performance has improved significantly compared to previous studies. The main contributions of this paper include:
• We present a new dataset of air quality images that can be used for many related problems in the same domain.
• We propose a new model that can learn efficiently with a small amount of training data.
• We conduct experiments to demonstrate that the proposed model outperforms other methods, and evaluate in detail the influence of each factor on the model’s performance.
The rest of the paper consists of the following sections. Section 2 introduces the research related to air quality estimation using sensor data and image data. In Section 3, we describe the data collection process to create a new dataset for training and testing tasks and introduce a deep learning model for air quality estimation based on Few-shot Learning with Prototypical Networks. The experimental results and evaluation of the proposed method are presented in Section 4. Finally, in Section 5, we give some conclusions and future directions.
2.1 Sensor-Based Air Quality Prediction
The traditional method for air quality monitoring is still based on sensors. Research on the use of low-cost sensors (LCS) has received increasing attention due to its economic, flexible deployment, and efficiency in air quality monitoring. However, the accuracy, reliability, and optimization of sensors are still major challenges.
The use of low-cost sensor networks for air quality monitoring in urban areas has been demonstrated, specifically at Heathrow Airport, London [11]. This network helps to clearly distinguish the emission sources from the airport and other sources and provides data to improve the air quality model (ADMS-Airport). Liang et al. [12] developed a low-cost sensor network calibrated through an artificial neural network to predict daily PM2.5 concentrations. In addition to integrating data from multiple sources (such as satellite images, or LiDAR data), the research also uses geostatistical kriging to create a pollution background model and detect local pollution events. This is a novel approach to improve the accuracy and applicability in analyzing and processing multi-source data, contributing to solving air pollution problems at local and regional scales.
A survey of the performance of low-cost sensors through the synthesis of data from 112 studies was conducted [13], the results showed that the sensors had better performance when deployed in stable environmental conditions, compared with non-standard reference devices, or when using advanced regression models to calibrate the data. Recently, a calibration model for low-cost sensors was proposed by Ionascu et al. [14], to improve the accuracy of measuring pollutants such as
2.2 Image-Based Air Quality Estimation
Currently, there are various methods using deep learning and images to estimate and predict air quality, especially PM2.5 pollution levels. These methods range from using static images and images from unmanned aerial vehicles (UAVs), to satellite images and multi-source data.
Some studies focus on extracting features from images based on CNN network architecture. Elbaz et al. [15] used a 3D-CNN model combined with GRU and attention mechanism to improve the accuracy of multi-temporal forecasting from images of Shanghai city. Zhang et al. [16] proposed a deep learning model combined with self-supervised learning to enhance the representativeness of image features, achieving high performance when evaluated on the NWNU-AQI dataset. Another trend is to exploit non-traditional image features to improve pollution estimation, emphasizing the importance of image feature extraction based on saturation and contrast to optimize PM2.5 concentration estimation [17,18].
Spatial and temporal factors are also exploited for air quality estimation. One research showed that the performance of the model deteriorates when applied to data-poor areas by evaluating the generalization ability of an image-based model for pollution estimation in Ghana [19]. To scale up the problem, another research integrated spatial and temporal learning with satellite imagery and multi-dimensional temporal data with the M2-APNet model [20].
Drone-based studies are also widely applied. One example is the AQMon system [21] that monitors air quality in smart cities with high resolution, minimizing data transmission latency and computational complexity. Similarly, a Federated Learning-based framework has been developed to ensure data security, providing 3D air quality forecasts using UAVs, contributing to improving environmental pollution management in urban areas [22]. Along with the development of smart cities, air quality estimation from fixed camera images has also been proposed [23], taking advantage of dense camera systems placed at many locations and providing diverse camera angles.
Utomo’s research [24] presents an effective CNN model for air quality classification in India. The Eff-AQI model is designed to minimize the number of required features while still achieving high accuracy upto 89.38%. Mahajan et al. [25] studied using the VGG16 model for feature extraction from images, then combined it with a custom neural network to classify air quality. The experimental results showed that the model achieved the accuracy of 87.44% on evaluation dataset. These studies have proved the potential of applying deep learning in the problem of classifying air quality from images.
In practice, implementing air quality estimation systems is relatively difficult. Possible problems include expensive air sensors and maintenance after a long period of use. Only air monitoring cameras are a better choice because cameras are usually affordable and have superior durability compared to air sensors. Using surveillance cameras leads to another problem with air quality estimation systems. That is, the system’s performance is often affected by the amount of data used to train the prediction model. This is a difficulty because although image data can be collected easily, labeling them requires relying on nearby air sensor stations. Therefore, there is usually very little data available to train the model.
To address the above challenge, we propose a few-shot learning hybrid model, called PTIT_FAQE, which helps deep learning models to be trained more effectively with less data. During the training phase, our model performs multiple tasks, each task requires image data from the training set, divided into support samples and query samples. The model predicts the label of the query samples based on the support samples, then calculates the loss and updates the parameters accordingly. After the training phase, the model is evaluated using tasks, each task requires support samples and query samples from the evaluation set. An overview of this process is illustrated in Fig. 1.


Figure 1: Flowchart of our proposed approach
3.2 Air Quality Estimation Task
When performing each task, support samples S and query samples Q are randomly selected from the training or evaluation set. Support samples are responsible for supporting the model in the task of predicting the query samples, which are usually taken in very small numbers (1, 5, or 10 images from each layer). Query samples are fed into the prediction model, then the predicted layer is produced, the loss is calculated and the weights for the model are updated during the training process. Query samples are also taken in equal numbers from each layer so that they are different from the images in the support samples, and in large numbers to increase the training efficiency or the accuracy of the evaluation results.
The goal of this section is to generate feature vectors from sample images. We use the EfficientNet CNN architecture with variant B1 to perform this task. EfficientNet is a family of deep learning networks designed based on the compound scaling strategy, allowing simultaneous optimization of the depth, width, and resolution of the model, thereby achieving superior performance with low computational resources. Variant B1 extends the network with higher depth and resolution than B0, allowing the model to learn more complex features from the input image without significantly increasing the computational cost. We also modify the fully connected layer of EfficientNetB1 to obtain the output of a 128-dimensional feature vector representing the input image. This process is shown as follows:
where
We use the Prototypical networks technique in few-shot learning to train the CNN model more efficiently. We assume that each layer has a prototype
where
• Stability: The cosine distance measures the angle between two vectors, which is not affected by the length of the vectors. Meanwhile, the Euclidean distance can be affected by the length of the vectors, making vectors with longer lengths more influential in calculating the similarity. Therefore, the cosine distance helps the model avoid being dominated by unimportant features and focus on the truly discriminative features.
• Generalization ability: When the training data is very small, using the cosine distance helps the model to be less prone to overfitting and can generalize better than using the Euclidean distance because it does not depend on the change of individual features.
The formula for calculating the distance between feature
where
During training, we will update the weights for the CNN so that
To achieve this goal, we use a cross-entropy loss function, where
where
There are very few datasets on air quality prediction. Therefore, evaluating the performance of deep learning models using these datasets is not easy. In this study, we designed an air quality dataset in Vietnam, called PTIT_AQED (PTIT Air quality estimation dataset), which is collected by traffic cameras and air monitoring stations. Each image collected from a traffic camera will be accompanied by air quality indicators from a nearby monitoring station, such as PM2.5, PM10, and other environmental parameters including weather. Through the dataset, we expect to promote the development of deep learning models that can accurately predict air quality based on images.
Vietnam has a diverse range of air quality levels, ensuring that the dataset captures a wide spectrum of conditions. Additionally, the model has been tested in India and Nepal, where it performed well, suggesting that it can generalize beyond Vietnam. The dataset also includes data from Hanoi and Ho Chi Minh City, which have distinct temperature and humidity variations. This difference helps improve the model’s adaptability to different climatic conditions, making it more applicable to regions with differing air quality patterns, such as drier or more humid environments.
The PTIT_AQED dataset is designed for research and application purposes in automatic air quality monitoring systems, helping to predict air pollution quality. The dataset is built with a focus on urban traffic, because urban air is often affected by traffic density, and air data in specific urban traffic areas are often of more interest than other areas. Moreover, the dataset can also be used to evaluate the correlation between traffic density and air quality at monitoring points. In addition to building the dataset, we also built a framework that can automatically collect data from surveillance cameras and monitoring stations. Data will be continuously collected, increasing the diversity of the dataset.
In this dataset, each data point represents an air image, recorded from a traffic camera. The images are recorded with a resolution of 1280 × 720. We use data from the nearest air monitoring station within a 1 km radius to collect information about air quality such as PM2.5, PM10, and other environmental parameters. We use a total of 8 cameras corresponding to 8 measuring stations, collecting data for 1 year at a frequency of 1 data point/1 camera/1 hour. Since air monitoring stations update hourly and air quality does not change rapidly, we do not encounter delays in synchronization between images and sensor readings. In cases where air monitoring station updates are missing, we discard the collected data until the sensor data becomes available again. The dataset can be used in regression problems, however, in this study, we only focus on predicting air quality by level, so we divide these images into 6 classes depending on the PM2.5 index as follows:
•
•
•
•
•
•
The data also removes images taken at night or in bad weather conditions to ensure the quality and uniformity of the dataset, which helps improve the accuracy of model training and air quality assessment from images. The data distribution for each air quality level is depicted in Fig. 2. In addition, Fig. 3 presents representative images for each air quality level, depicting typical environmental conditions associated with varying degrees of air quality.

Figure 2: Data Distribution of PTIT_AQED
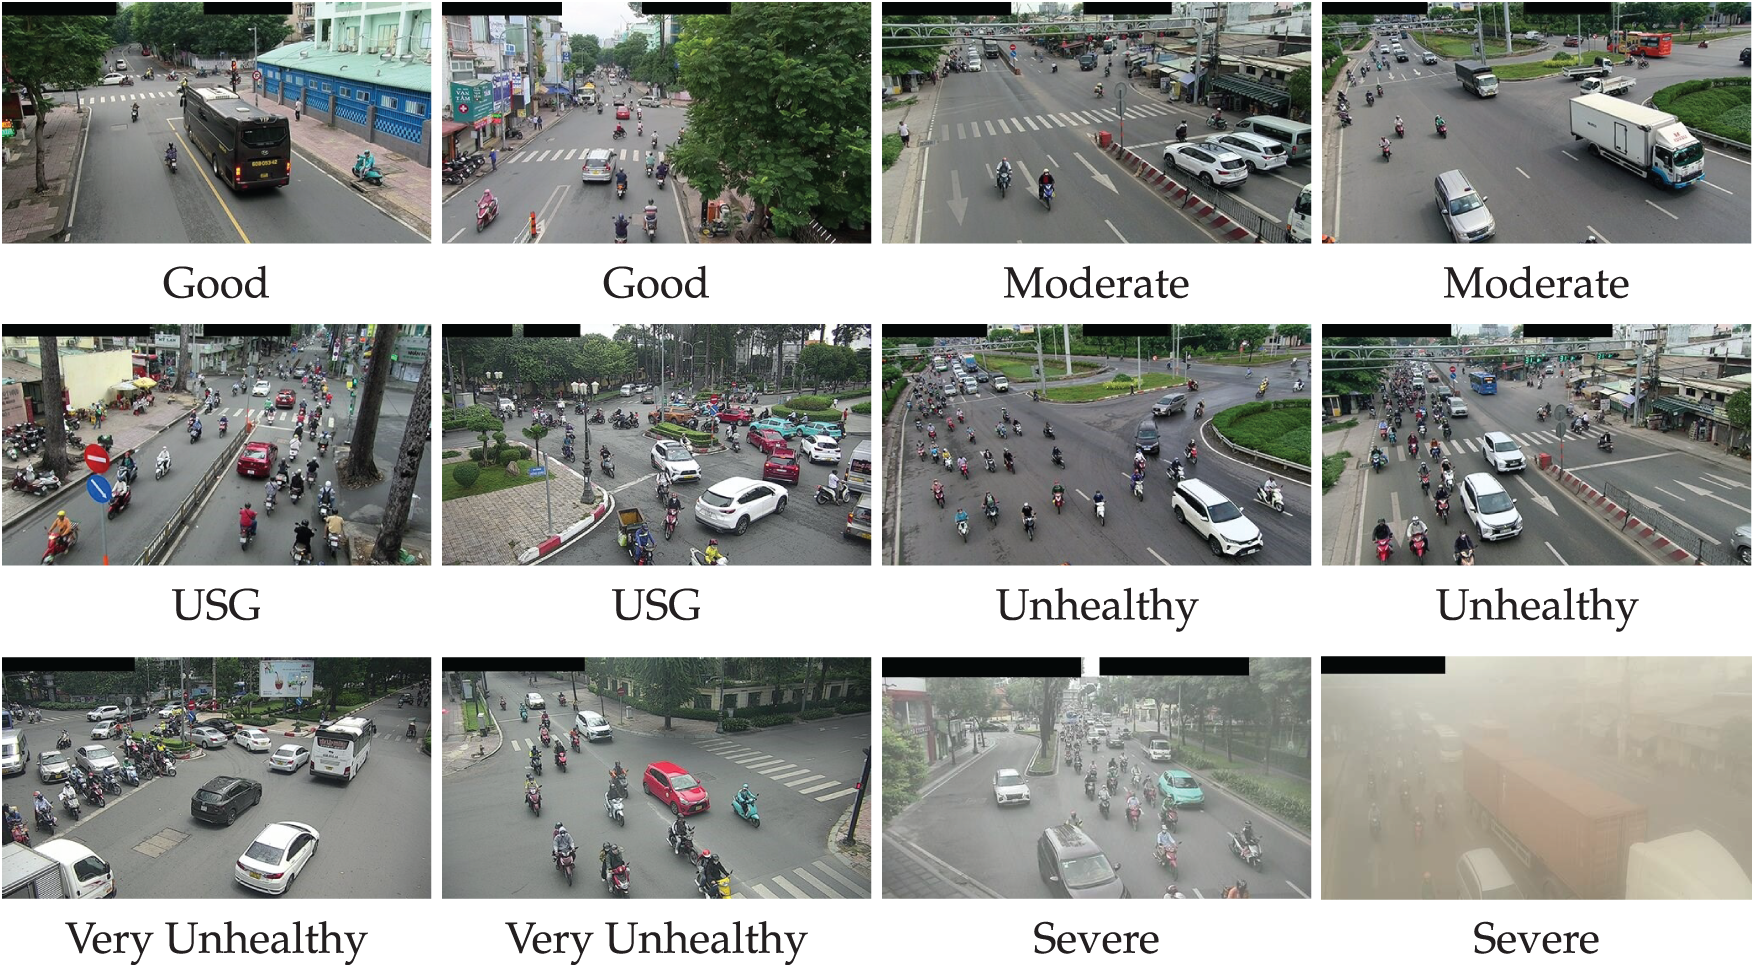
Figure 3: Example images for each air quality class
We also use the Air Pollution Image Dataset from India and Nepal (APIN) [26] dataset in our experiments. APIN is a dataset collected to study and predict air pollution levels based on images. This dataset contains images taken from two countries, India and Nepal, with different levels of air pollution. This dataset can be used in computer vision research, especially in problems such as predicting air quality from images. The APIN dataset consists of 12,240 JPG images, 224 × 224 resolution and is divided into 6 classes corresponding to air quality levels.
We train the proposed model and all the previous methods, and then compare the performance on our proposed PTIT_AQED dataset and the APIN dataset. Before training, we perform data preprocessing steps. Our PTIT_AQED dataset has been processed to remove nighttime or bad weather images because these images will disturb the model. Additionally, the images in the dataset are also reduced to 224 × 224 resolution.
Our PTIT_FAQE model is implemented using PyTorch 2.4.1 and Python 3.11.10, and trained on an NVIDIA GeForce RTX 3070 GPU with 8 GB memory and an Intel Xeon E5-2680 v4 processor clocked at 2.4 GHz. We evaluate the PTIT_FAQE model and all previous methods based on accuracy and F1-Score criteria.
In this section, our experiments are designed to answer four questions about the proposed method.
Q1: How do different CNN architectures affect the prediction performance?
Q2: How do the PTIT_FAQE model and other methods perform on the datasets?
Q3: How much does the prediction performance improve compared to different distance functions?
Q4: How does the number of support samples affect the prediction results?
In air quality prediction problems, the accuracy index is often used as an evaluation index to compare performance. The accuracy index indicates the proportion of data samples that are correctly predicted, including both positive and negative samples. Accuracy allows for the overall evaluation of the effectiveness of the methods. In addition, we use the F1-Score index. F1-Score is a combined index of precision and recall, which comprehensively evaluates the predictive ability of the model, especially in cases of data imbalance.
Our model is trained and evaluated by tasks. Each training task randomly selects several support samples and query samples from the classes in the training set. The training process predicts the class of the query sample based on the information of the support sample, and then calculates the cross-entropy loss function based on the predicted class and the actual class of the query sample. This loss value is used to update the model parameters with the Adam optimizer. The model accuracy is calculated by averaging this value over all evaluation tasks, each task randomly selecting several support samples and a different query sample from each class in the evaluation set. The selected support samples are different in each task. Since the number of query samples of each class is the same in each evaluation task, the F1-Score for each class is multiplied by a coefficient

4.3.1 Performance under Different CNN Architectures (Q1)
To prove the decision of the EfficientNet-B1 CNN architecture for the Feature extraction step of the AQFN model mentioned earlier in Section B1, we conduct experiments by comparing the performance of 5 CNN architectures VGG-16, ResNet-50, DenseNet-121, EfficientNet-B1 and ViT-B on two datasets PTIT_AQED and APIN. We chose these architectures because they have the most balanced performance and speed among the variants. We trained the PTIT_FAQE model using these architectures on a computer with the following configuration:
• CPU: Intel Xeon E5-2680 v4
• GPU: NVIDIA GeForce RTX 3070
• RAM: 32 GB
Distance functions and the number of support samples do not significantly affect the inference and training speed of the model. Therefore, the training time and the inference time in the Table 2 are calculated with the distance function set to Cosine and the number of support samples set to 5.

We split the training and evaluation datasets into 20% of the total data of the respective datasets. At the same time, during the training process, the number of tasks is fixed at 1000, each task takes 5 support samples and 100 query samples from the training dataset for each class. The evaluation process is performed on 100 tasks, each task takes 5 support samples and 100 query samples from the evaluation dataset for each class. The distance function is also fixed as Cosine for easy comparison. The results in Table 2 show that the ViT-B model achieves the highest accuracy and F1-Score, but the difference is not significant compared to EfficientNet-B1 while the execution time is 5 times higher. EfficientNet-B1 achieves very high accuracy with the lowest execution time. Therefore, our choice of CNN architecture is justified.
4.3.2 Model PTIT_FAQE and Other Methods (Q2)
To compare the performance of the PTIT_FAQE model with other methods, we conduct experiments with the proposed method and three other methods, which are the studies of Utomo et al., 2023 [27], Mahajan et al., 2024 [25] and Zhang et al., 2022 [28]. The dataset is divided into a training and evaluation ratio of 8:2. While other methods use the entire training data, our method only uses 25% of this data.
Table 3 details the results of accuracy and F1-Score on the two datasets. From this table, it can be seen that the PTIT_FAQE model achieves superior performance despite using less training data than other methods. This result is mainly due to the integration of Prototypical Networks, which helps the model learn more effectively from a limited number of samples, thereby improving its generalization ability. This result shows the potential application of the PTIT_FAQE model in air quality prediction problems.

4.3.3 Performance with Distance Functions (Q3)
To measure the effect of the distance function that Prototypical Networks use in the proposed model, we conduct experiments on the PTIT_FAQE model with four popular distance functions: Manhattan, Euclidean, Chebyshev, and Cosine. The experimental results presented in the Table 4 show that, on the APIN dataset, the Cosine distance function achieves superior performance compared to the remaining functions, with an Accuracy of 0.9467 and an F1-Score of 0.9371. Meanwhile, the Euclidean distance function also gives relatively good results with an Accuracy of 0.9260 and an F1-Score of 0.9134, significantly higher than Manhattan and Chebyshev.

This is achieved by the Cosine function’s ability to measure the angular correlation between feature vectors, instead of just relying on the magnitude of the vectors like other distance functions. Using the Cosine distance function helps the model to distinguish more clearly between classes, especially in feature spaces with dispersion and direction. This result emphasizes the importance of choosing the appropriate distance function in the PTIT_FAQE model.
4.3.4 Number of Support Samples and Prediction Results (Q4)
We also evaluate the impact of the number of supporting samples on the prediction results of the model. Table 5 details the results of different numbers of supporting samples, including 1, 3, 5, 7, and 10, on the two datasets. The experimental results show that the number of supporting samples equal to 5 gives the best results, with the highest accuracy and F1-Score. This can be explained because with 5 supporting samples, the model has enough information to calculate the correct prototype, which improves the prediction ability for query samples.

When the number of supporting samples increases to 7 or 10, although the model has more data, the results slightly decrease compared to when using only 5 samples. This can be explained by the “data overload” effect in Prototypical Networks. As the number of supporting examples increases too much, the prototypes may be “noisy” with examples that are not truly representative of the class, making the prediction model less accurate. Therefore, although Prototypical Networks can handle a large number of supporting examples, there is a limit to the optimal number of supporting examples for effective prototype construction.
On the contrary, when the number of supporting examples is too small, only 1 or 3 examples, the prediction results of the model are significantly reduced. When there is only 1 supporting example, the model cannot build an accurate prototype because it only relies on a single point to represent the class, leading to inaccurate predictions. Similarly, with 3 supporting examples, although there is more information, it is still not enough for the model to create a stable and accurate prototype. Therefore, the accuracy and F1-Score when using 1 and 3 supporting examples are lower than those with higher numbers of supporting examples, such as 5, 7, or 10.
However, the dataset includes visually similar air quality images that fall into different classes, possibly because their PM2.5 index are close to the classification threshold between two air quality levels. This leads to mispredictions when the model selects support or query samples from these images. As illustrated in Fig. 4, the images belonging to the “Good” and “Moderate” classes appear very similar.
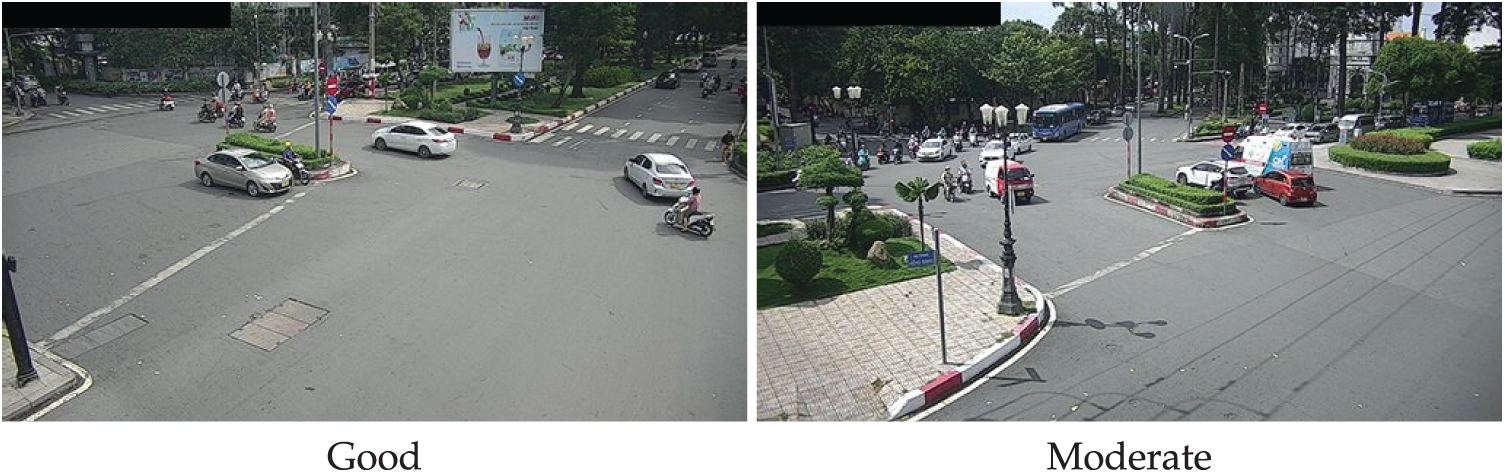
Figure 4: Similar air quality images
The proposed model is designed for real-time deployment and can be seamlessly integrated with existing air monitoring infrastructure. It processes image inputs at a speed suitable for real-time applications and provides an API for efficient system connectivity. Since the dataset is derived from traffic cameras and monitoring stations, integration with current monitoring networks is straightforward.
Removing nighttime and bad weather images improves clarity but may limit the model’s ability to generalize to real-world conditions where air quality estimation is needed in diverse environments. To address this, we plan to experiment with infrared cameras for nighttime scenarios, which could provide useful information even in low-light conditions. Additionally, bad weather can affect not only image clarity but also the accuracy of sensor measurements. We are researching methods to mitigate this issue, including haze removal techniques to reduce the impact of rain and improve model robustness in adverse weather conditions.
Variations in lighting and atmospheric conditions, such as glare, rain, and fog, can significantly affect the accuracy of air quality estimation from traffic camera images. To address this challenge, we incorporated preprocessing techniques such as haze removal to reduce visual artifacts before making predictions. Specialized noise reduction models are employed to enhance image quality, thereby improving the reliability of air quality estimations under adverse weather conditions.
PTIT_FAQE enhances robustness by analyzing multiple images within a short time window and selecting the most reliable frame for air quality estimation. This strategy mitigates the impact of occlusions, extreme lighting, and temporary visual obstructions, ensuring more stable and accurate predictions. In addition, we are investigating advanced enhancement techniques to further improve the model’s performance in challenging visual conditions, ultimately increasing its applicability in real-world deployment scenarios.
However, the proposed method is subject to several notable limitations that may affect its accuracy and generalizability in practical deployments. A primary concern pertains to the spatial incongruity between the sources of image data and the ground truth air quality measurements. Specifically, the air quality labels are obtained from fixed monitoring stations, which are frequently situated at locations that are spatially distant from the camera viewpoints used for image acquisition. This geographic separation introduces a potential source of noise, as the environmental conditions captured in the images may not accurately reflect the conditions measured at the station. Such spatial mismatches are particularly problematic in urban contexts, where air pollution levels can exhibit substantial local variability due to traffic patterns, microclimates, and built environment features.
In addition to spatial inconsistencies, the dataset employed in this study exhibits significant class imbalance across the air quality categories, which are defined as Good, Moderate, USG, Unhealthy, Very Unhealthy, and Severe/Hazardous. In practice, the majority of collected samples tend to fall within the Good and Moderate categories, which represent common atmospheric conditions in many urban areas. In contrast, instances of Very Unhealthy and Severe/Hazardous air quality are relatively rare, resulting in a skewed class distribution. This imbalance poses a considerable challenge for the model, as it may become biased toward the majority classes during training, thereby compromising its ability to accurately detect and classify rare but critical pollution events. Such limitations are particularly concerning in the context of public health monitoring, where timely and precise identification of severe air quality conditions is essential for issuing alerts and mitigating health risks.
Finally, employing a prototype-based few-shot learning model, though advantageous in low-data regimes, introduces certain methodological constraints. The accuracy of the model is heavily influenced by the representativeness and distinctiveness of the selected support samples. When support images from different classes share similar visual characteristics, such as background context, lighting conditions, or atmospheric effects, the model may struggle to construct clearly distinguishable prototypes. As a consequence, class boundaries can become ambiguous, increasing the risk of misclassification. These challenges are particularly pronounced in visually complex environments where the differences between classes are subtle, while variations within a single class remain significant.
In this paper, we have solved the problem of insufficient data for air quality prediction by disclosing a set of air quality images. We also propose the PTIT_FAQE model to learn more effectively with a small amount of data in the air quality prediction problem. Experimental results show that the PTIT_FAQE model outperforms other methods in the PTIT_AQED and APIN datasets.
Our next research direction will focus on optimizing and improving the accuracy of the proposed model, especially enhancing its predictive capabilities in complex real-world scenarios. At the same time, we will study methods for air quality prediction under adverse weather conditions, which can significantly affect forecasting accuracy. In addition, we will expand the PTIT_AQED dataset by integrating data from drones equipped with air sensors, increasing dataset diversity and improving analysis and prediction across different environments. This will provide deep learning models with richer and more varied data sources, thereby enhancing the efficiency of air quality prediction in real-world applications. Moreover, as our model is already based on few-shot learning, we aim to further refine its ability to handle rare air quality conditions by enhancing prototype representation and optimizing feature extraction techniques. This will improve its performance on underrepresented categories such as “Very Unhealthy” or “Severe”, ensuring better generalization despite the limited number of training samples for these conditions. By integrating these improvements with an expanded dataset and advanced data processing methods, we seek to develop a more resilient air quality estimation system adaptable to a wide range of environmental conditions.
Acknowledgement: We are grateful for the invaluable support provided by the Young Innovation Research Laboratory on Digital Technology (YIRLoDT), Posts and Telecommunications Institute of Technology (PTIT, Vietnam) throughout the research process. The facilities and resources offered were extremely helpful and have been instrumental in completing this research project successfully.
Funding Statement: The authors received no specific funding for this study.
Author Contributions: The authors confirm contribution to the paper as follows: study conception and design: Duc Cuong Pham, Hoai Nam Vu; data collection: Duc Cuong Pham, Tien Duc Ngo; analysis and interpretation of results: Duc Cuong Pham, Hoai Nam Vu; draft manuscript preparation: Duc Cuong Pham, Hoai Nam Vu. All authors reviewed the results and approved the final version of the manuscript.
Availability of Data and Materials: The data that support the findings of this study are available from the corresponding author, Hoai Nam Vu, upon reasonable request.
Ethics Approval: Not applicable.
Conflicts of Interest: The authors declare no conflicts of interest to report regarding the present study.
Nomenclature
| FSL | Few-shot Learning |
| PTIT_FAQE | PTIT Air Quality Few-shot Learning |
| PTIT_AQED | PTIT Air Quality Estimation Dataset |
| CNN | Convolutional Neural Network |
| RNN | Recurrent Neural Network |
| LSTM | Long Short Term Memory Networks |
References
1. Roser M. Data review: how many people die from air pollution? Our World in Data; 2021 [cited 2025 Mar 30]. Available from: https://ourworldindata.org/data-review-air-pollution-deaths. [Google Scholar]
2. Bakirci M. Enhancing air pollution mapping with autonomous UAV networks for extended coverage and consistency. Atmos Res. 2024;306(6):107480. doi:10.1016/j.atmosres.2024.107480. [Google Scholar] [CrossRef]
3. Bakirci M. Smart city air quality management through leveraging drones for precision monitoring. Sustain Cities Soc. 2024;106(6):105390. doi:10.1016/j.scs.2024.105390. [Google Scholar] [CrossRef]
4. Liu Q, Cui B, Liu Z. Air quality class prediction using machine learning methods based on monitoring data and secondary modeling. Atmos. 2024;15(5):553. doi:10.3390/atmos15050553. [Google Scholar] [CrossRef]
5. Iskandaryan D, Ramos F, Trilles S. Air quality prediction in smart cities using machine learning technologies based on sensor data: a review. Appl Sci. 2020;10(7):2401. doi:10.3390/app10072401. [Google Scholar] [CrossRef]
6. Liu Y, Zhu Q, Yao D, Xu W. Forecasting urban air quality via a back-propagation neural network. In: Ferrández Vicente J, Álvarez-Sánchez J, de la Paz López F, Toledo Moreo J, Adeli H, editors. Biomedical applications based on natural and artificial computing. Cham: Springer International Publishing; 2017. pp. 232–9. doi:10.1007/978-3-319-59773-7_24. [Google Scholar] [CrossRef]
7. Esteban P, Norberto M. Air quality forecasting in Madrid using long short-term memory networks. In: International Work-Conference on the Interplay between Natural and Artificial Computation; 2017; Cham: Springer. p. 232–9. doi:10.1007/978-3-319-59773-7_24. [Google Scholar] [CrossRef]
8. Du S, Li T, Yang Y, Horng SJ. Deep air quality forecasting using hybrid deep learning framework. IEEE Transact Knowl Data Eng. 2019;33(6):2412–24. doi:10.1109/tkde.2019.2954510. [Google Scholar] [CrossRef]
9. Parnami A, Lee M. Learning from few examples: a summary of approaches to few-shot learning; 2022 [cited 2025 Mar 30]. Available from: https://arxiv.org/abs/2203.04291. [Google Scholar]
10. Snell J, Swersky K, Zemel RS. Prototypical networks for few-shot learning; 2017 [cited 2025 Mar 30]. Available from: https://arxiv.org/abs/1703.05175. [Google Scholar]
11. Popoola OAM, Carruthers D, Lad C, Bright VB, Mead MI, Stettler MEJ, et al. Use of networks of low cost air quality sensors to quantify air quality in urban settings. Atmosph Environ. 2018;194:58–70. doi:10.1016/j.atmosenv.2018.09.030. [Google Scholar] [CrossRef]
12. Liang L, Daniels J, Bailey C, Hu L, Phillips R, South J. Integrating low-cost sensor monitoring, satellite mapping, and geospatial artificial intelligence for intra-urban air pollution predictions. Environ Pollut. 2023;331(12):121832. doi:10.1016/j.envpol.2023.121832. [Google Scholar] [PubMed] [CrossRef]
13. Kang Y, Aye L, Ngo TD, Zhou J. Performance evaluation of low-cost air quality sensors: a review. Sci Total Environ. 2022;818:151769. doi:10.1016/j.scitotenv.2021.151769. [Google Scholar] [PubMed] [CrossRef]
14. Ionascu M-E, Marcu M, Bogdan R, Darie M. Calibration of NO, SO2, and PM using Airify: a low-cost sensor cluster for air quality monitoring. Atmos Environ. 2024;339(5):120841. doi:10.1016/j.atmosenv.2024.120841. [Google Scholar] [CrossRef]
15. Elbaz K, Shaban WM, Zhou A, Shen S-L. Real time image-based air quality forecasts using a 3D-CNN approach with an attention mechanism. Chemosphere. 2023;333(10):138867. doi:10.1016/j.chemosphere.2023.138867. [Google Scholar] [CrossRef]
16. Zhang Q, Fu F, Tian R. A deep learning and image-based model for air quality estimation. Sci Total Environ. 2020;724:138178. doi:10.1016/j.scitotenv.2020.138178. [Google Scholar] [PubMed] [CrossRef]
17. Yue G, Gu K, Qiao J. Effective and efficient photo-based PM2.5 concentration estimation. IEEE Transact Instrument Measure. 2019;68(10):3962–71. doi:10.1109/tim.2018.2886091. [Google Scholar] [CrossRef]
18. Fang X, Li Z, Yuan B, Chen Y. Image-based PM2.5 estimation from imbalanced data distribution using prior-enhanced neural networks. IEEE Sens J. 2024;24(4):4677–93. doi:10.1109/jsen.2023.3343080. [Google Scholar] [CrossRef]
19. Nathvani R, Vishwanath D, Clark S, Alli A, Muller E, Coste H, et al. Beyond here and now: evaluating pollution estimation across space and time from street view images with deep learning. Sci Total Environ. 2023;903:166168. doi:10.1016/j.scitotenv.2023.166168. [Google Scholar] [PubMed] [CrossRef]
20. Swetha G, Reddy DR, Vishnu C, Mohan C. M2-APNet: a multimodal deep learning network to predict major air pollutants from temporal satellite images. J Appl Remote Sens. 2023;18(01). doi:10.1117/1.jrs.18.012005. [Google Scholar] [CrossRef]
21. Xia S, Xing T, Wu C, Liu G, Yang J, Li K. AQMon: a fine-grained air quality monitoring system based on UAV images for smart cities. ACM Trans Sens Netw. 2023;20(2):1–20. doi:10.1145/3638766. [Google Scholar] [CrossRef]
22. Liu Y, Nie J, Li X, Ahmed SH, Lim WYB, Miao C. Federated learning in the sky: aerial-ground air quality sensing framework with UAV swarms. IEEE Int Things J. 2021;8(12):9827–37. doi:10.1109/jiot.2020.3021006. [Google Scholar] [CrossRef]
23. Song S, Li VOK, Lam JCK, Wang Y. Personalized ambient pollution estimation based on stationary-camera-taken images under cross-camera information sharing in smart city. IEEE Int Things J. 2023;10(17):15420–30. doi:10.1109/jiot.2023.3263949. [Google Scholar] [CrossRef]
24. Utomo S, Rouniyar A, Hsu HC, Hsiung PA. Federated adversarial training strategies for achieving privacy and security in sustainable smart city applications. Future Internet. 2023;15(11):371. [Google Scholar]
25. Mahajan A, Mate S, Kulkarni C, Sawant S. Predicting lung disease severity via image-based AQI analysis using deep learning techniques; 2024 [cited 2025 Mar 30]. Available from: https://arxiv.org/abs/2405.03981. [Google Scholar]
26. Rouniyar A, Utomo S, A. J, Hsiung PA. Air pollution image dataset from India and Nepal. Kaggle; 2023 [cited 2025 Mar 30]. Available from: https://www.kaggle.com/ds/3152196. [Google Scholar]
27. Utomo S, Rouniyar A, Jiang G, Chang C, Tang K, Hsu HC, et al. Eff-AQI: an efficient CNN-based model for air pollution estimation: a study case in India. In: Proceedings of the 2023 ACM Conference on Information Technology for Social Good; 2023; New York, NY, USA: Association for Computing Machinery. p. 165–72. doi:10.1145/3582515.3609531. [Google Scholar] [CrossRef]
28. Tony Z, Robert D. Image-based air quality forecasting through multi-level attention. 2022, pp. 686–90. doi:10.1109/ICIP46576.2022.9897241. [Google Scholar] [CrossRef]
Cite This Article
 Copyright © 2025 The Author(s). Published by Tech Science Press.
This work is licensed under a Creative Commons Attribution 4.0 International License , which permits unrestricted use, distribution, and reproduction in any medium, provided the original work is properly cited.
 Downloads
 Citation Tools