
 Submit a Paper
 Propose a Special lssue
 Open Access
ARTICLE
E-GlauNet: A CNN-Based Ensemble Deep Learning Model for Glaucoma Detection and Staging Using Retinal Fundus Images
1 Department of Computer Science, Lahore College for Women University, Lahore, 44444, Pakistan
2 Department of Computer Science and Engineering, University of Engineering and Technology Lahore, Narowal Campus, Narowal, 51600, Pakistan
3 Department of Computer Science, University of Hertfordshire, Hatfield, AL10 9AB, UK
4 School of IT & Engineering (SiTE), Kazakh-British Technical University, Almaty, 050005, Kazakhstan
5 Department of Robotics and Mechatronics Engineering, Kennesaw State University, Marietta, GA 30060, USA
* Corresponding Author: Razvan Cristian Voicu. Email:
(This article belongs to the Special Issue: Cutting-Edge Machine Learning and AI Innovations in Medical Imaging Diagnosis)
Computers, Materials & Continua 2025, 84(2), 3477-3502. https://doi.org/10.32604/cmc.2025.065141
Received 05 March 2025; Accepted 04 June 2025; Issue published 03 July 2025
 View Full Text
 Download PDF
Abstract
Glaucoma, a chronic eye disease affecting millions worldwide, poses a substantial threat to eyesight and can result in permanent vision loss if left untreated. Manual identification of glaucoma is a complicated and time-consuming practice requiring specialized expertise and results may be subjective. To address these challenges, this research proposes a computer-aided diagnosis (CAD) approach using Artificial Intelligence (AI) techniques for binary and multiclass classification of glaucoma stages. An ensemble fusion mechanism that combines the outputs of three pre-trained convolutional neural network (ConvNet) models–ResNet-50, VGG-16, and InceptionV3 is utilized in this paper. This fusion technique enhances diagnostic accuracy and robustness by ensemble-averaging the predictions from individual models, leveraging their complementary strengths. The objective of this work is to assess the model’s capability for early-stage glaucoma diagnosis. Classification is performed on a dataset collected from the Harvard Dataverse repository. With the proposed technique, for Normal vs. Advanced glaucoma classification, a validation accuracy of 98.04% and testing accuracy of 98.03% is achieved, with a specificity of 100% which outperforms state-of-the-art methods. For multiclass classification, the suggested ensemble approach achieved a precision and sensitivity of 97%, specificity, and testing accuracy of 98.57% and 96.82%, respectively. The proposed E-GlauNet model has significant potential in assisting ophthalmologists in the screening and fast diagnosis of glaucoma, leading to more reliable, efficient, and timely diagnosis, particularly for early-stage detection and staging of the disease. While the proposed method demonstrates high accuracy and robustness, the study is limited by the evaluation of a single dataset. Future work will focus on external validation across diverse datasets and enhancing interpretability using explainable AI techniques.Keywords
Glaucoma, characterized by elevated intraocular pressure (IOP) and gradual impairment of the optic nerve, is recognized as “the silent thief of sight” as it results in permanent and irreversible visual impairment. The increased IOP causes damage to the optic nerve. Fluid accumulation within the eye raises IOP. Elevated IOP is triggered by either an abnormality in the drainage process or an excess of fluid, leading to optic nerve damage. It can be defined by the damage to retinal ganglion cells (RGCs) which are crucial for vision. Diabetic retinopathy (DR), age-related macular degeneration, cataracts, and glaucoma are the most common causes of severe visual impairment and blindness [1]. As glaucoma is irreversible, timely intervention during the initial stage has been observed to significantly mitigate the potential for permanent vision impairment [2]. Nearly 60 million people are affected by glaucoma, globally, every year. It has been observed that the prevalence of the disease is higher among adults aged 40 and older. According to research, it is estimated that glaucoma will affect roughly 80 million people by 2020 [3]. Similarly, in 2013, it was anticipated that 64.3 million individuals globally would be suffering from glaucoma. However, estimations indicate that the number would increase by 74% to 111.8 million in 2040 [4].
Glaucoma is commonly diagnosed using three main tests: optic nerve head (ONH) assessment, IOP measurement, and visual field testing [5]. Among these, the ONH examination is widely regarded as the most effective method [6,7]. Additional diagnostic tools include pachymetry (corneal thickness), gonioscopy (angle assessment), tonometry (IOP), perimetry (visual field), and ophthalmoscopy (optic nerve evaluation).
All of these procedures, however, are manual, time-consuming, laborious, and susceptible to varying opinions among specialists. As a result, CAD systems are required to assist ophthalmologists in obtaining more precise and unbiased assessments. These sophisticated systems analyze data using AI techniques, specifically Deep Learning (DL) techniques, enhancing diagnosis accuracy, standardizing methods, minimizing subjectivity, and handling large datasets efficiently, such as optic nerve images, visual field tests, IOP, and other important data. CAD systems consist of three fundamental phases: Pre-processing, Segmentation, and Classification [8]. Retinal Fundus Images (RFIs) are eye images captured using a special camera (fundus camera) to detect eye diseases such as glaucoma. These images provide key morphological characteristics for early glaucoma diagnosis and typically include retinal vessels, fovea, optic cup (OC), and optic disc (OD). Ophthalmologists often use hand-contouring of the cup and disc in RFIs to assess the cup-to-disc ratio (CDR) and disc damage likelihood scale (DDLS). A high CDR–typically above 0.65–is a key indicator of glaucoma [9]. Normal eyes usually have a CDR range from 0.3 to 0.5. A CDR value of 0.8 or higher leads to complete vision loss.
In recent decades, many CDR-based segmentation methods have been proposed for glaucoma detection [10–12], but they often lack sensitivity and rely heavily on precise segmentation, ignoring other key metrics. In contrast, feature-based methods–particularly those using ML–have shown better performance but still require manual feature selection and are time-consuming on large datasets. DL overcomes these limitations by automating feature extraction and improving diagnostic accuracy [13,14]. This paper introduces a novel DL-based approach for early glaucoma detection and stage classification. By leveraging DL architectures and ensemble methods, the proposed system offers high accuracy, reduced computational cost, and practical value for clinical use. The key contributions of this work are:
1. Unlike conventional methods, this approach does not necessitate the use of OD and OC segmentation for early glaucoma detection, simplifying the process and potentially reducing the time and computational load.
2. The research focuses on binary classification for early diagnosis of glaucoma and multiclass classification to identify different stages of the disease. This approach enhances the utility of the model in clinical settings by providing comprehensive diagnostic information.
3. It utilizes four distinct image class combinations, facilitating the detection of both early and advanced stages of glaucoma. This approach broadens the scope of the model’s applicability and enhances its diagnostic capabilities.
4. This study employs an ensemble learning approach by integrating three pre-trained ConvNet architectures (ResNet-50, VGG-16, and InceptionV3) for feature fusion and classification. The averaging-based ensemble enhances diagnostic accuracy and robustness in staging glaucoma, achieving state-of-the-art performance. The proposed ensemble method combines the strengths of multiple models to achieve superior performance.
5. The proposed method achieves high classification accuracy without relying on extensive preprocessing techniques. This not only enhances the reliability of the diagnosis but also saves computational time, making it a more efficient solution for real-world clinical application.
The novelty of the proposed E-GlauNet ensemble approach lies in several key aspects: (i) the use of customized and fine-tuned versions of ResNet-50, VGG-16, and InceptionV3 models specifically adapted for glaucoma staging tasks; (ii) the adoption of an averaging-based fusion mechanism at the probability output level, which differs from traditional majority voting or feature-level concatenation methods; (iii) minimal reliance on extensive preprocessing steps, such as OC/disc segmentation, making it more suitable for clinical deployment; and (iv) the achievement of significantly improved specificity and classification accuracy compared to recent studies. These aspects collectively distinguish our work from existing ensemble-based glaucoma detection methods.
Recent research studies have investigated various approaches for the automated detection of glaucoma. Early methods relied on traditional image processing techniques, e.g., Zhu et al. [15] utilized the Hough transform to identify localized OD borders. He employed Sobel operators to detect its edges and achieved an accuracy of 90% on the DRIVE database. Abdullah et al. [16] presented a strategy for glaucoma detection using morphological operations, circular Hough transformation, and the grow-cut algorithm. This approach eliminated ocular diseases and enhanced the OD using morphological operations. Subsequently, the OD border was segmented using the grow-cut technique, with the OD center estimated using the circular Hough transform. Lu [17] utilized circular-based transformation methods to detect the edges of the OD. The authors integrated segmentation and circular transformation into a unified framework for effective OD identification.
Fink et al. [18] employed a k-nearest neighbor classifier (KNN) and utilized independent component analysis (ICA) to extract features from color fundus images. ICA translated the detected retinal images of the papilla into basis images that represent independent feature characteristics. Matching coefficients of images were learned from a training batch of data, and the KNN classifier performed the classification using the L2 norm. This method achieved an accuracy of 90.8% in accurately categorizing 250 images with a resolution of 256
Nayak et al. [19] introduced ECNet, a non-handcrafted feature mining approach using RCGA to optimize convolutional, compression, summation, and ReLU layers for feature extraction. Among various classifiers, RCGA + ECNet with SVM achieved the highest accuracy of 97.20%. Parashar and Agrawal [20] proposed a CAD system using Image Empirical Mode decomposition (IEMD) to break down images into Intrinsic Mode Functions (IMFs), capturing pixel variations. Classification with LS-SVM resulted in 94.45%. Bock et al. [21] applied PCA and SVM for glaucoma classification, using OD fine lines in pre-processed images. They introduced the Glaucoma Risk Index (GRI) by combining FFT, B-spline, and PCA. Another study [22] used logistic classification to distinguish Normal vs. Early Glaucoma, Normal vs. (Early + Advanced Glaucoma), and Normal vs. Advanced Glaucoma cases.
Chen et al. [23] described a DNN based approach for glaucoma detection that utilizes a 6-layered deep CNN. Al-Bander et al. [24] used an SVM classifier to determine whether the retinal image was normal or abnormal. For feature extraction, the Alexnet model with 23 convolutional layers, maxpooling, fully connected, softmax, and dense layer was employed. The weights of the model were adjusted to match the weights that Alexnet had taught it. According to the experimental results, the accuracy was 88.2%. Juneja et al. [25] suggested a DL-based CoG-NET (Classification of Glaucoma Network) in 2022 to identify RFIs as glaucoma or normal. Features and gradient activation maps were employed to establish its concentration in the OD and OC. With 85 layers, the suggested model is an updated version of Xception. A logistic regression strategy was used to categorize the data. Benzebouchi et al. [26] introduced a DL-based CNN for glaucoma investigation. It employed two sets of CNNs, the first with an RGB-colored RFIs and the second with an Otsu thresholded grayscale retinal image. The accuracy was 95.6% based on CNN1’s evaluation utilizing 25 epochs and 10 iterations. CNN2 was supposed to achieve 96.95% accuracy across 25 epochs and 5 iterations.
Joshi et al. [27] developed an ensemble technique on three publically avaliable data sets and one private data set (PSGIMSR, DRISHTI-GS, DRIONS-DB, and HRF). Three alternative ConvNet designs were employed in this study, including ResNet-50, VGG-16, and GoogLeNet. Trained NNs produce output by merging them into a prediction vector, and a decision was decided by a majority vote. Juneja et al. [28] presented a CNN model with 76 layers. Logistic regression was used for classification purpose of images. Drishti and RIM-ONE datasets were used for this model. Cropping, augmentation, and denoising were used for the pre-processing of input images. It gained an accuracy of 97.51%. The researcher [29] suggested a 13-layer CNN trained to extract features from HRF, Origa, Drishti, and fundus images. De Sales Carvalho et al. [30] offered an automated glaucoma diagnostic system based on 3DCNNs.This strategy does not impose the use of OD segmentation or data augmentation. Even without data augmentation, the model produced good results. The grayscale volume set yields the best results.
In 2024, Xavier [31] employed the Retinex method for image enhancement, followed by Modified DeepLabV3 segmentation to extract Regions of Interest and detect anomalies. The DeepLabV3 parameters were optimised with the Improved Rain Optimisation Algorithm (IROA). ODMNet, a hybrid DenseNet-MobileNet model optimised with IROA, was employed to classify glaucoma. Sujithra and Jerome [32] performed blood vessel segmentation on RFIs. They used the Grey Wolf Optimization approach to improve a ResNet-50 DL-based model. Recently, Elmannai et al. [33] proposed an improved DL framework for automated OD localization and glaucoma detection, achieving notable performance through enhanced feature extraction strategies. Such advancements highlight the growing role of DL in ophthalmic image analysis and motivate the exploration of ensemble approaches like the proposed E-GlauNet.
While feature-based ML methods have provided initial advances, they often require extensive preprocessing and handcrafted feature extraction. DL models have improved automatic feature learning but can still suffer from overfitting and dataset dependency. Ensemble learning approaches have demonstrated performance improvements but often lack clinical interpretability or require heavy preprocessing. The proposed E-GlauNet model addresses these gaps by integrating multiple lightweight CNN architectures through simple probability fusion, achieving high accuracy without the need for complex preprocessing, while maintaining potential for future explainability enhancements. The proposed model is particularly beneficial in the early risk assessment of glaucoma, which is crucial for intervention during its initial phases.
The datasets used in this research, the proposed methodology and its implemented are presented in this section.
The dataset used in this research was obtained from the publicly available repository of Harvard Dataverse, accessible through the DOI [34]. The data was collected at Kim’s Eye Hospital in Seoul, South Korea. Researchers employed a specialized non-mydriatic auto fundus camera to capture the images. The dataset contains 1544 RFIs. Table 1 presents details of the dataset, while sample RFIs are presented in Fig. 1.
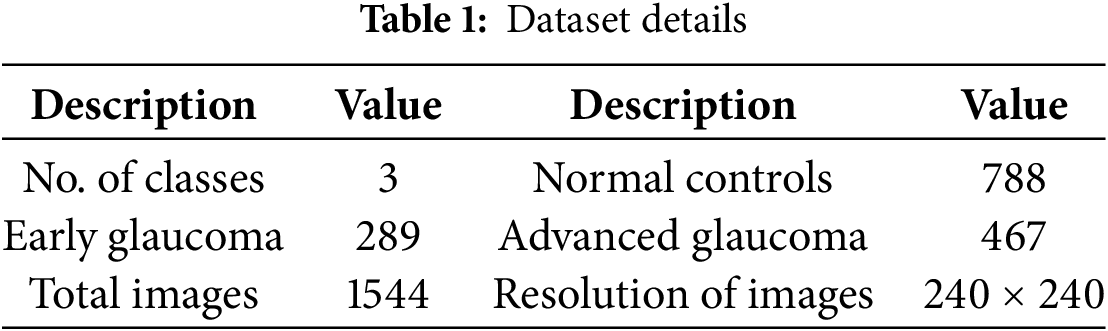

Figure 1: Sample retinal fundus images from dataset [34]
3.2 Image Preprocessing and Augmentation
To address class imbalance and enhance generalization, various image augmentation techniques were applied. The proposed approach begins by resizing images to dimensions of 224

Figure 2: Various augmentation steps applied on a sample retinal fundus image [34]
Three pre-trained architecture, namely ResNet-50, VGG-16 and InceptionV3, are selected for feature extraction after customizations done to these models. Details of these architectures are provided below.
3.3.1 ResNet-50 Configuration and Customization
Residual networks, such as ResNet-50, comprises of convolution, pooling, activation, and fully connected (FC) layers that are connected to each other via identity connections. This is represented by Eq. (1), where f(a) is a function of the residual block using identity mapping between input and output. The underlying architecture diagram of ResNet-50 is shown in Fig. 3, whereas the building blocks of ResNet-50 [35] are presented in Fig. 4.

Figure 3: ResNet-50 architecture

Figure 4: Building blocks of ResNet-50, Ref. [35]
In this study, several customizations and enhancements are applied to the ResNet-50 model to tailor it for the specific task of glaucoma staging and prediction. Custom layers are added to improve the feature extraction capabilities of the base ResNet-50 model. A dense layer with a ReLU activation function is incorporated after the global average pooling layer. The dense layer helps in reducing the dimensionality of the feature vector while at the same time capturing more abstract and higher-level features relevant to glaucoma detection.
To facilitate the binary and multiclass classification tasks, the output layer of the model is customized. The dense layer has one neuron with a sigmoid activation function for binary classification, and the output is a probability score indicating the presence of glaucoma. In contrast, a dense layer with multiple neurons corresponding to the number of classes and a softmax activation function is used for glaucoma staging. In this configuration, the model outputs probabilities for each class, facilitating accurate stage prediction. As the ResNet-50 model is pre-trained on the ImageNet dataset, it provides a strong base of general features. The RFI dataset is used to fine-tune the pre-trained weights of the model during training to better capture features specific to glaucoma detection.
3.3.2 VGG-16 Configuration and Customization
VGG-16 is a deep neutral network comprises of 16 layers. It consists of 13 convolutional layers and 3 FC layers. In the modified version of VGG-16 architecture, a global average pooling layer is added, while the flatten layer and the first FC layer are removed to make it lightweight and reduce the risk of overfitting. In the start, the network uses smallest filter of size 64. the filter size is gradually increased by a factor of 2 after each max-pool layer. The final size of the filter is 512. The input layer of the network takes 224
This customized configuration captures the intricate features from the images. After the images are passed through the convolutional layers, max pooling layers are applied with a filter size of 2

Figure 5: VGG-16 architecture
3.3.3 InceptionV3 Configuration and Customization
InceptionV3 model is a 48 layers deep architectural model. It comprises convolutional layers, max-pooling layers with a 3

Figure 6: InceptionV3 architecture
3.4 Proposed Ensemble Learning Method
To leverage the strengths of different ConvNet architectures, an ensemble model was created using averaging fusion of output probabilities. Ensemble approaches in ML and statistics combine several learning algorithms to get better predicted results than could be achieved with just one of the individual learning algorithms [36]. The proposed ensemble method for multiclass classification is presented in this section and illustrated in Fig. 7. The proposed ensemble approach integrates three different ConvNet models: ResNet-50, VGG-16, and InceptionV3. Initially the RFIs are divided into three subsets: training, testing, and validation with a split of 70%, 10% and 20%, respectively.

Figure 7: Proposed ensemble model architecture
To address the class imbalance, image augmentation techniques such as zoom, shear, horizontal flip, random distortion, and brightness adjustment are applied to the fundus images, resulting in balanced classes. Three distinct ConvNet architectures (ResNet-50, VGGNet-16, and InceptionV3) pre-trained on the ImageNet dataset are utilized. Features are extracted considering the deep structural characteristics of the fundus images using the three pre-trained ConvNet architectures. The proposed ensemble method integrates three distinct pre-trained ConvNet architectures–ResNet-50, VGG-16, and InceptionV3.
Features extracted from each model are combined using an averaging fusion mechanism to produce a unified prediction. This fusion approach capitalizes on the diversity of the base models, reducing overfitting and improving the robustness of predictions. Based on the ensemble model’s decision, RFIs are classified into three categories: early-stage glaucoma, advanced stage glaucoma, and normal eye. The mathematical representation of the ensemble model is given in Eq. (2).
In this equation
4 Experimental Results and Discussion
The evaluation parameters, experimental design and results achieved from all experiments are presented in this section. For implementation of the proposed approach, a system with 32 GB RAM and a 1 THz processor is used. A comparative analysis of the proposed approach results are also conducted with the state-of-the-arts techniques in this domain.
The evaluation parameters used for this research include accuracy, precision, recall, and F1 score to analyze the performance of the proposed approach. The mathematical representations of these parameters are illustrated in Eqs. (3) to (6).
The proposed research work is focused on both binary and multi-class classification of RFIs for glaucoma identification and its staging. The research is divided into a number of experiments each targeting either binary or multi-class classification tasks. Four experiments are performed for binary classification, and two experiments for multi-class classification. Experiments 1–5 are carried out using three deep models: ResNet-50, VGG-16, and InceptionV3, whereas experiment 6 is performed through the proposed ensemble DL model. The selection of ResNet-50, VGG-16, and InceptionV3 was based on their established performance, ease of fine-tuning, and proven effectiveness in fundus image classification tasks. These architectures offer a favorable trade-off between performance, training complexity, and interpretability, which are critical for clinical adoption.
1. Experiment-1: Binary Classification (Normal Control vs. (Early + Advanced Glaucoma))
2. Experiment-2: Binary Classification (Normal Control vs. Advanced Glaucoma)
3. Experiment-3: Binary Classification (Normal Control vs. Early Glaucoma)
4. Experiment-4: Binary Classification (Early Glaucoma vs. Advanced Glaucoma)
5. Experiment-5: Multiclass Classification (Normal Control vs. Early Glaucoma vs. Advanced Glaucoma)
6. Experiment-6: Multiclass Classification using Ensemble Approach
For the first experiment, early and advanced glaucoma classes are combined and treated as a single positive class against normal control (negative class). The purpose is to create a broad classifier that can differentiate between normal and diseased conditions, regardless of the glaucoma stage. This may be helpful for initial screening of the subjects to decide if more detailed examination is required.
The second experiment classifies normal controls and advanced glaucoma subjects. This experiment learns the pronounced features characterizing advanced glaucoma in RFIs. This may help to identify the individuals who need more intensive and immediate treatment to avoid further vision impairment.
Third experiment classifies normal control and early glaucoma to enable the model to identify glaucoma in its early stage. In the early stage of glaucoma, the disease is often asymptomatic but is treatable. It is essential to diagnose disease in its early stage to prevent its progression and avoid any vision impairment.
Fourth experiment classifies early glaucoma and advanced glaucoma to learn the differences between RFIs characterizing the explicit features between various stages of the disease. Understanding the progression of the disease is vital for devising new treatment strategies.
Multi-class classification (Normal Control, Early Glaucoma, Advanced Glaucoma) is also conducted on the same models. Subsequently, in last experiment, an averaging ensemble of these models is devised to detect normal, advanced, and early glaucoma stages. The ensemble technique combines the outputs of the individual models to make more accurate and robust predictions for the multi-class classification task.
The hyperparameters that are used by classification models are shown in Table 2.
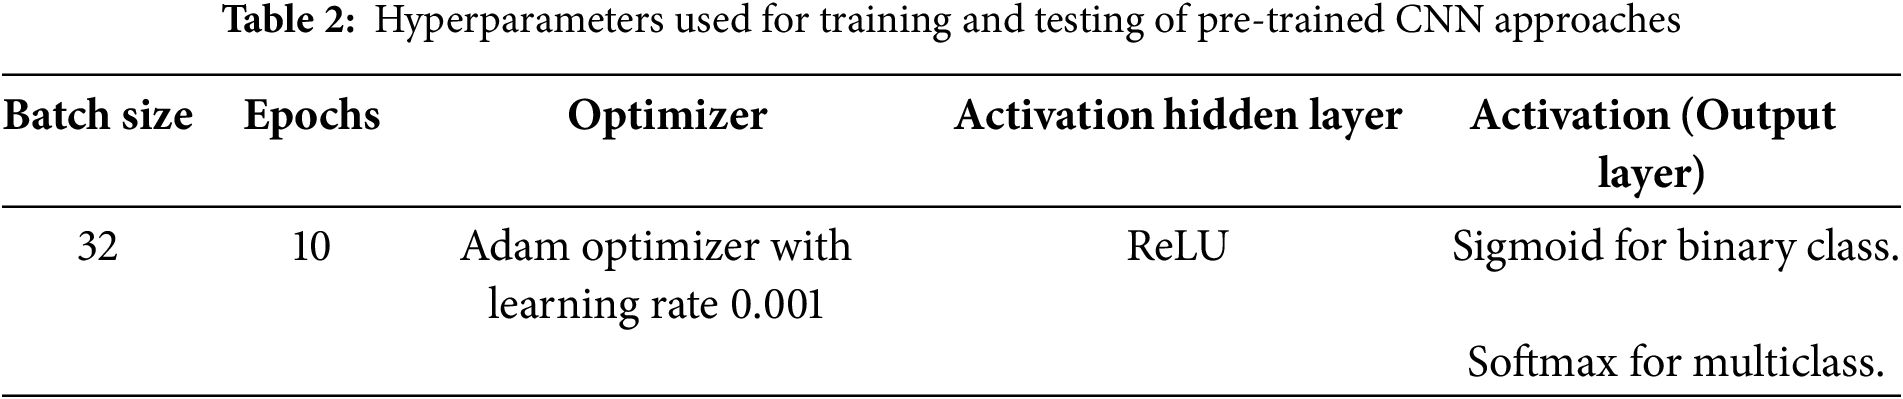
The optimizer used for all models was Adam, with an initial learning rate of 0.001. A learning rate decay mechanism was applied, reducing the learning rate by a factor of 0.1 after 5 epochs if no improvement in validation loss was observed. The batch size was set to 32, and the models were trained for 10 epochs in all experiments, as summarized in Table 2. Data augmentation settings included random zoom in the range of 0.8 to 1.2, random shear intensity of 0.2 radians, random brightness adjustments within a range of
4.3 Binary Classification Results
4.3.1 Experiment-1: Normal Control vs. (Early + Advanced Glaucoma)
This experiment is conducted for binary classification of Normal Control vs. (Early + Advanced Glaucoma). Classification is performed using ResNet-50, VGG-16 and InceptionV3 to classify the images as either Normal or Glaucoma. The ResNet-50 showed promising results as compared to others. The graphical representation of the accuracy and loss graphs using ResNet-50, VGG-16 and InceptionV3 is shown in Figs. 8–10, respectively.

Figure 8: Accuracy and loss graph using ResNet-50 for Experiment-1

Figure 9: Accuracy and loss graph using VGG-16 for Experiment-1

Figure 10: Accuracy and loss graph using InceptionV3 for Experiment-1
4.3.2 Experiment-2: Normal Control vs. Advanced Glaucoma
Normal control images used in this experiment total 551. Therefore, augmentation is applied on the advanced glaucoma images to produce a total of 551 images for training, to avoid the problem of data imbalance. The graphical representation of the accuracy and loss graphs using ResNet-50, VGG-16 and InceptionV3 is shown in Figs. 11–13, respectively.

Figure 11: Accuracy and loss graph using ResNet-50 for Experiment-2
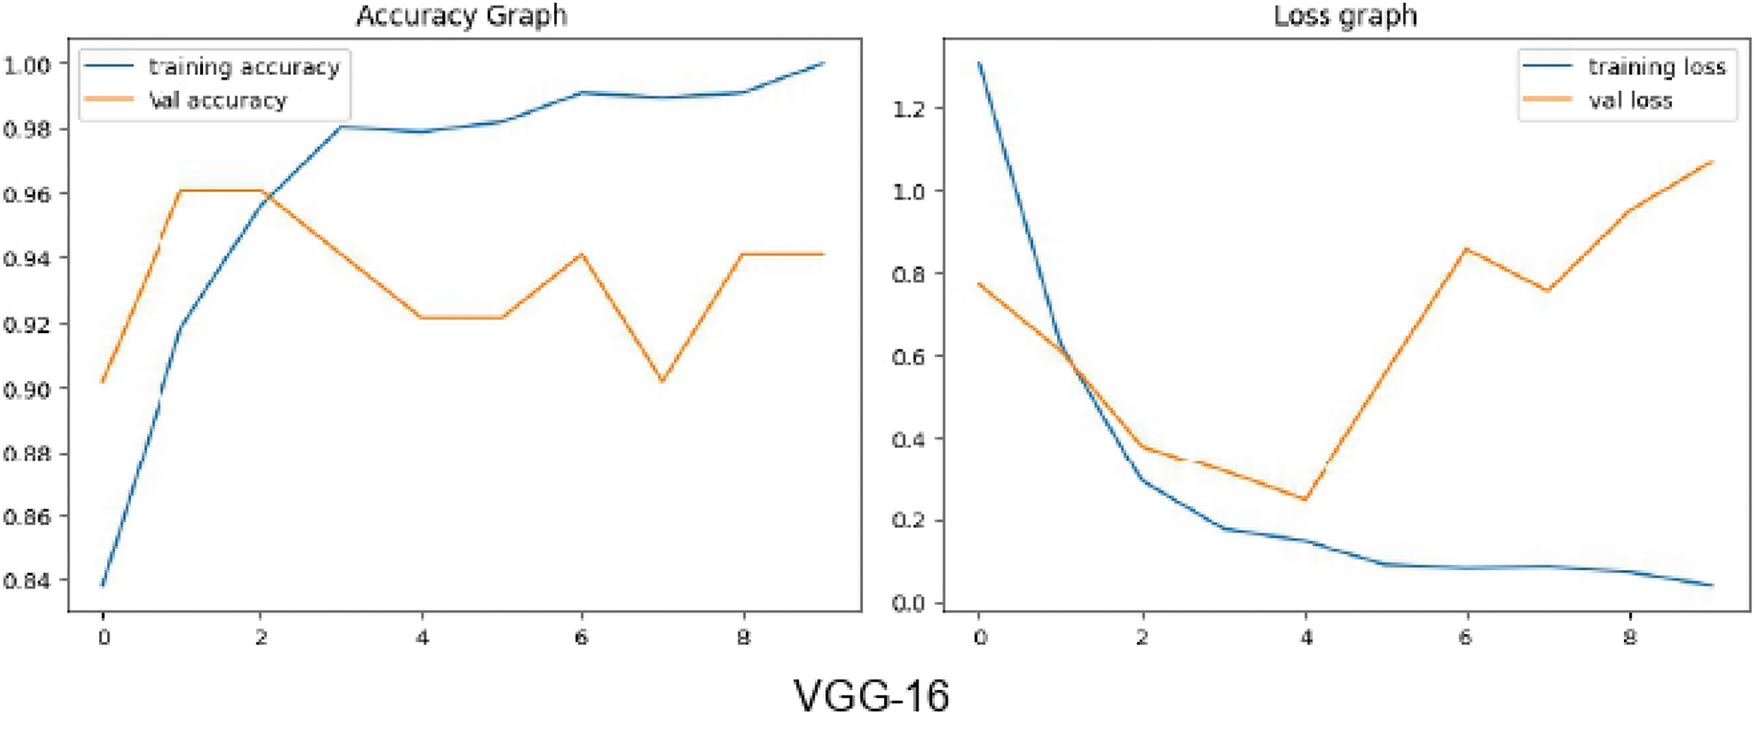
Figure 12: Accuracy and loss graph using VGG-16 for Experiment-2

Figure 13: Accuracy and loss graph using InceptionV3 for Experiment-2
4.3.3 Experiment-3: Normal Control vs. Early Glaucoma
Augmentation is applied to the early glaucoma images to generate a total of 551 images for training, to avoid the problem of data imbalance. The graphical representation of the accuracy and loss graphs using ResNet-50, VGG-16 and InceptionV3 is shown in Figs. 14–16, respectively.

Figure 14: Accuracy and loss graph using ResNet-50 for Experiment-3

Figure 15: Accuracy and loss graph using VGG-16 for Experiment-3

Figure 16: Accuracy and loss graph using InceptionV3 for Experiment-3
4.3.4 Experiment-4: Early Glaucoma vs. Advanced Glaucoma
In this experiment, augmentation is applied to the early glaucoma images to generate an equal number of samples for both advance and early glaucoma images. ResNet-50 showed promising results compared to the others. The graphical representation of the accuracy and loss graphs using ResNet-50, VGG-16 and InceptionV3 is shown in Figs. 17–19, respectively.

Figure 17: Accuracy and loss graph using ResNet-50 for Experiment-4

Figure 18: Accuracy and loss graph using VGG-16 for Experiment-4

Figure 19: Accuracy and loss graph using InceptionV3 for Experiment-4
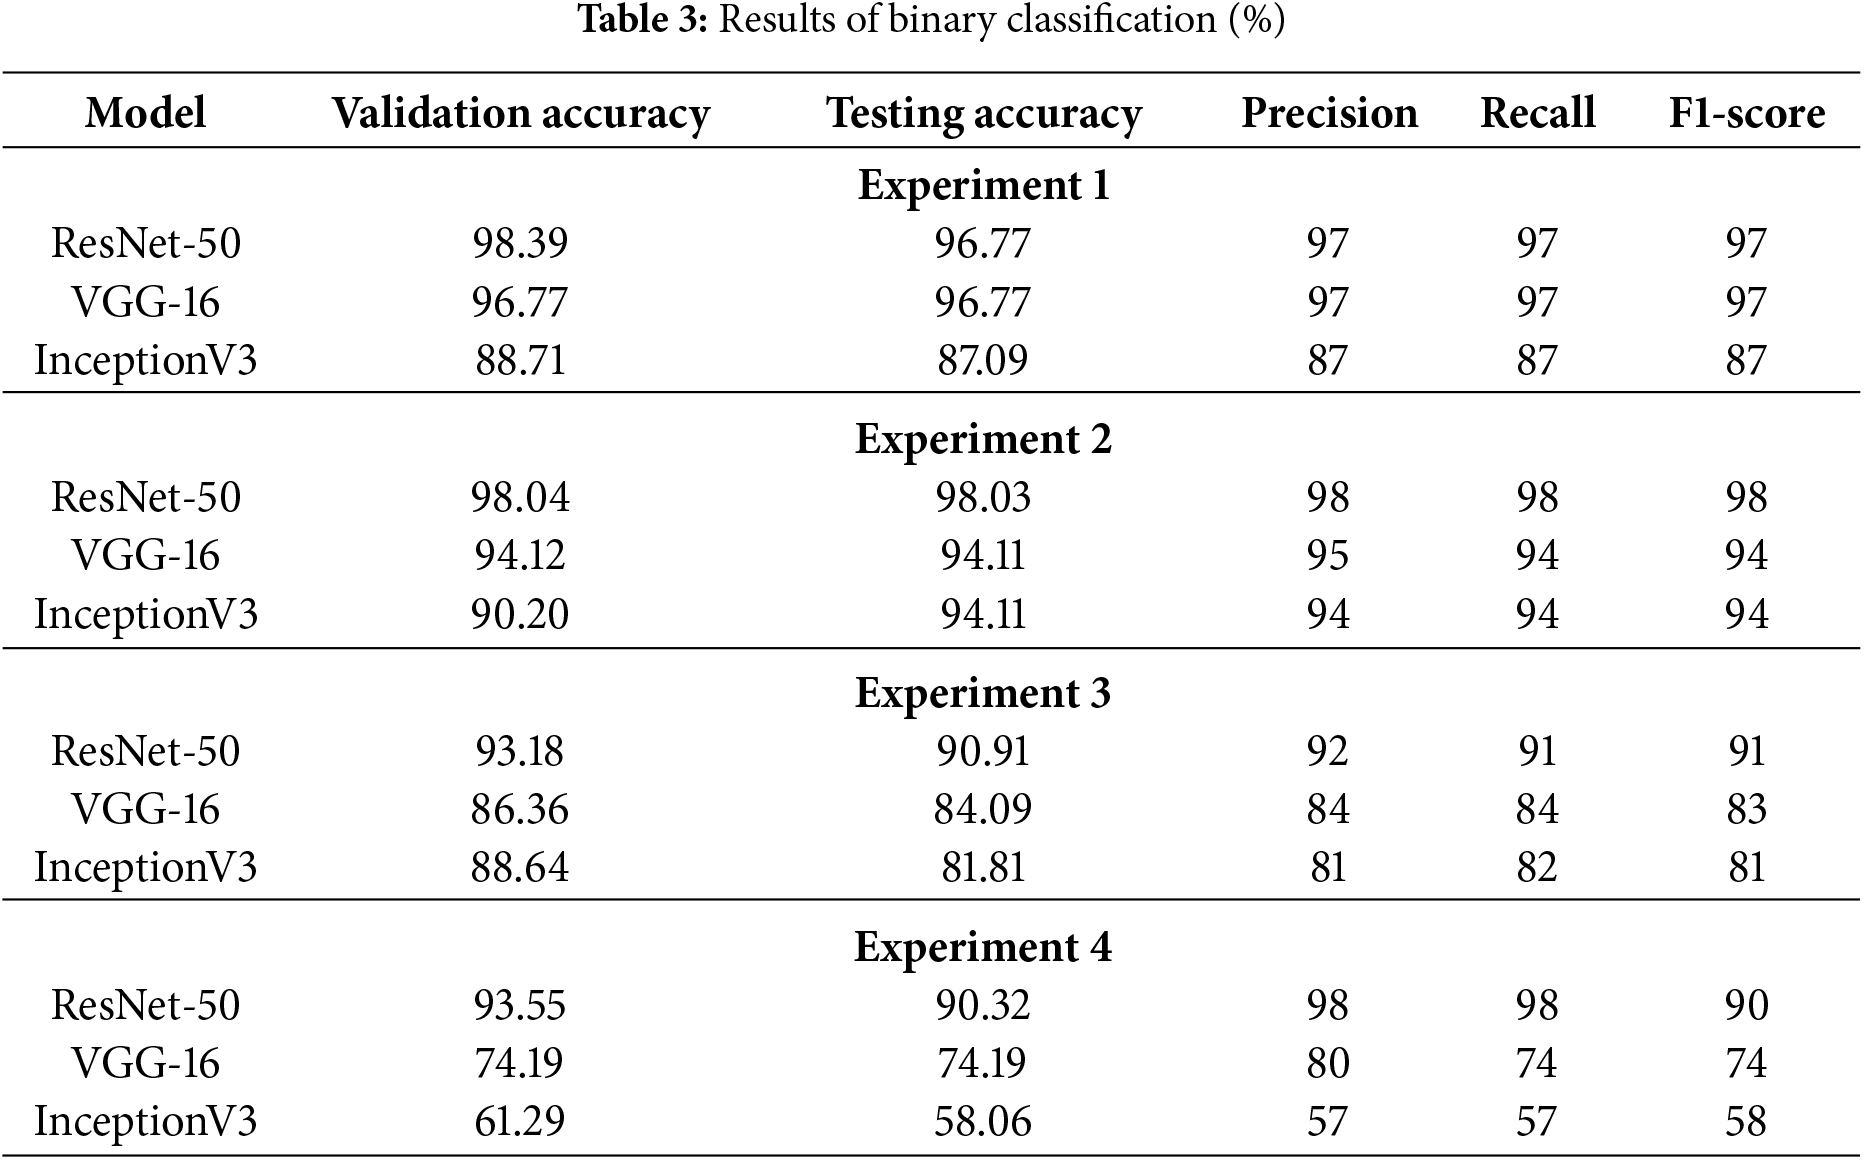
Figs. 20–22 represent the confusion matrices obtained for binary experiments using ResNet-50, VGG-16, and InceptionV3, respectively. The validation accuracy, testing accuracy, precision, recall and F1-Score obtained for all four binary experiments against each of the three models are presented in Table 3.

Figure 20: Confusion matrices for binary classification using ResNet-50

Figure 21: Confusion matrices for binary classification using VGG-16

Figure 22: Confusion matrices for binary classification using InceptionV3
4.4 Multiclass Classification Results
4.4.1 Experiment-5: Multiclass Classification Using ResNet-50, VGG-16, and InceptionV3
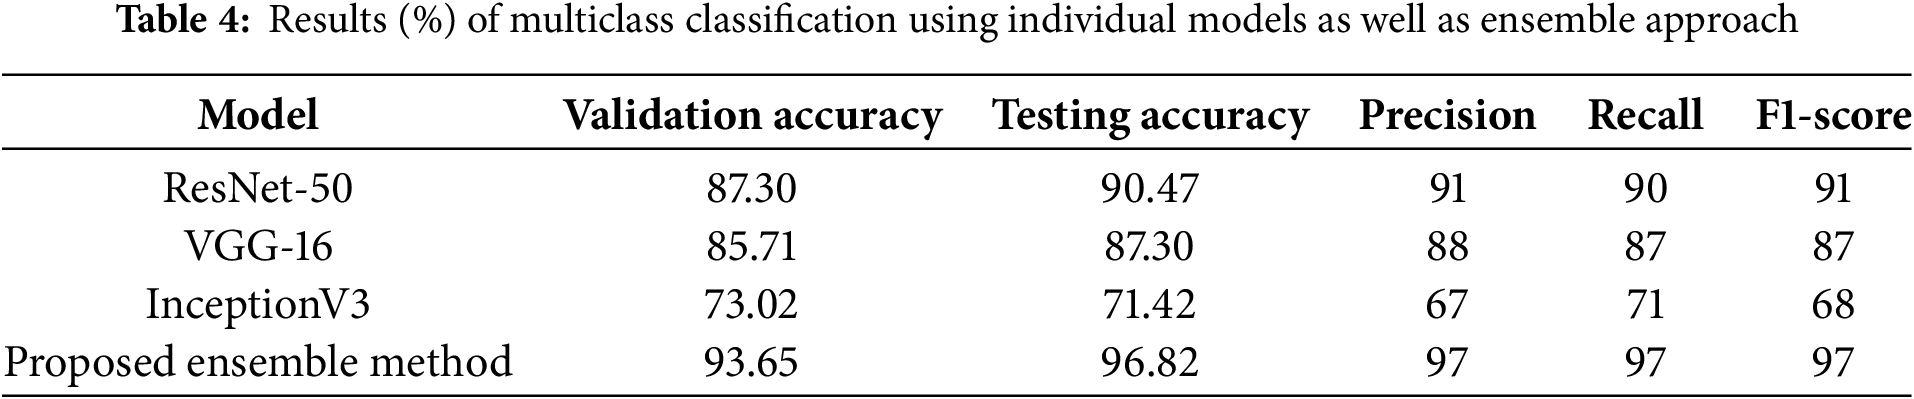
In this experiment, augmentation is applied to both early and advanced glaucoma images to generate a total of 551 images for each class. ResNet-50, VGG-16 and InceptionV3 are fined-tuned on the training set for the multiclass classification of RFIs into three classes: Advanced Glaucoma, Early Glaucoma, and Normal Control. The graphical representation of the accuracy and loss graphs using ResNet-50, VGG-16 and InceptionV3 is shown in Figs. 23–25, respectively, while confusion matrices are presented in Fig. 26. The results obtained for this experiment are shown in Table 4.

Figure 23: Accuracy and loss graph of Experiment-5 using ResNet-50

Figure 24: Accuracy and loss graph of Experiment-5 using VGG-16

Figure 25: Accuracy and loss graph of Experiment-5 using InceptionV3

Figure 26: Confusion matrices of Experiment-5 (a) ResNet-50, (b) VGG-16, and (c) InceptionV3
4.4.2 Experiment-6: Multiclass Classification Using Ensemble Approach
In this experiment, an ensemble technique is employed to classify RFIs into three categories: Advanced Glaucoma, Early Glaucoma, and Normal Control. Pre-trained models ResNet-50, VGG-16, and InceptionV3 are fine-tuned on the training set for multiclass classification using the ensemble method. The output of these three models is then merged, and an averaging approach is used to create the ensemble output. The graphical representation of the accuracy and loss graphs is shown in Fig. 27. The confusion matrix for this experiment is presented in Fig. 28. Table 4 also illustrates the results obtained from this experiment.

Figure 27: Accuracy and loss graph for Experiment-6 using ensemble approach

Figure 28: Confusion matrix for Experiment-6 using ensemble approach
4.5 Performance Comparison and Analysis
4.5.1 Summary of Classification Performance
ResNet-50 achieved the best results across all four binary classification experiments. The validation accuracy of ResNet-50 in Experiment-1 for Normal vs. (Early + Advanced Glaucoma) is 98.39%, while VGG-16 and InceptionV3 achieved 96.77% and 88.71%, respectively. Similarly in Experiment-2, ResNet-50 achieved an accuracy of 98.04% for Normal vs. Advanced Glaucoma, compared to VGG-16 and InceptionV3, which achieved accuracies of 94.12% and 90.20%, respectively. In Experiment-3, ResNet-50 attained 93.18% accuracy for Normal Control vs. Early Glaucoma, while VGG-16 and InceptionV3 reaches 86.36% and 88.64% accuracy, respectively. In Experiment-4, for Early Glaucoma vs. Advanced Glaucoma, ResNet-50 achieved an accuracy of 93.55%, whereas VGG-16 and InceptionV3 achieved 74.19% and 61.29%, respectively. As a result, it can be concluded that ResNet-50 outnumbered VGG-16 and InceptionV3 in all four scenarios of binary classification in this study.
4.5.2 Performance of the Ensemble Model
The proposed ensemble approach for multiclass classification outperforms ResNet-50, VGG-16, and InceptionV3, achieving the highest values for precision, recall, F1 score, and accuracy, as shown in Fig. 29 and Table 4. The validation accuracy of proposed ensemble approach is 93.65%, whereas ResNet-50, VGG-16 and inceptionV3 achieved an accuracy of 87.30%, 85.71%, and 73.02%, respectively. The proposed ensemble approach demonstrates significant improvement over individual models (ResNet-50, VGG-16, InceptionV3), with an average accuracy gain of 14.60%. This improvement highlights the effectiveness of the fusion mechanism in leveraging diverse feature representations and reducing model-specific biases and variances. For binary classification (e.g., Normal vs. Advanced Glaucoma), the ensemble approach ensures higher specificity (100%) compared to standalone models.

Figure 29: Graphical representation of the results for multi-class classification
4.5.3 Comparative Analysis with State-of-the-Art
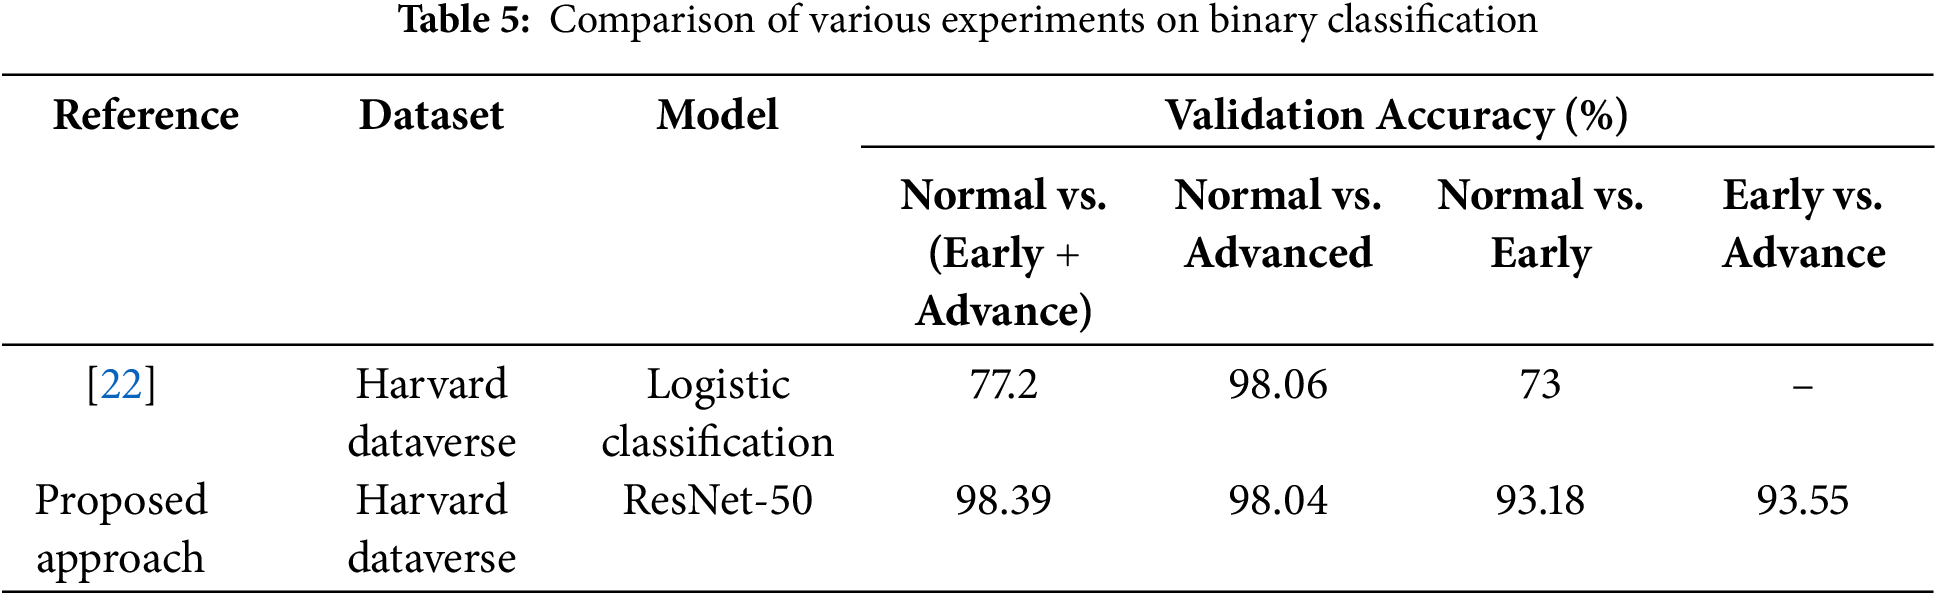
Most of the research in this field focuses solely on binary classification to distinguish between glaucoma-affected and healthy eye images. However, Ahn et al. [22] categorize normal vs. (Early + Advanced Glaucoma), normal vs. Advanced Glaucoma, and Normal vs. Early Glaucoma using logistic regression and DL. In comparison to the other works in this area, our research achieved a commendable result of 98.39% using ResNet-50 with only 10 epochs for Normal vs. (Early + Advanced Glaucoma) whereas [22] achieved only 77.2% accuracy for this scenario. Table 5 shows the comparison of results. Furthermore, this study achieved the highest accuracy of 93.18% for Normal vs. Early Glaucoma.
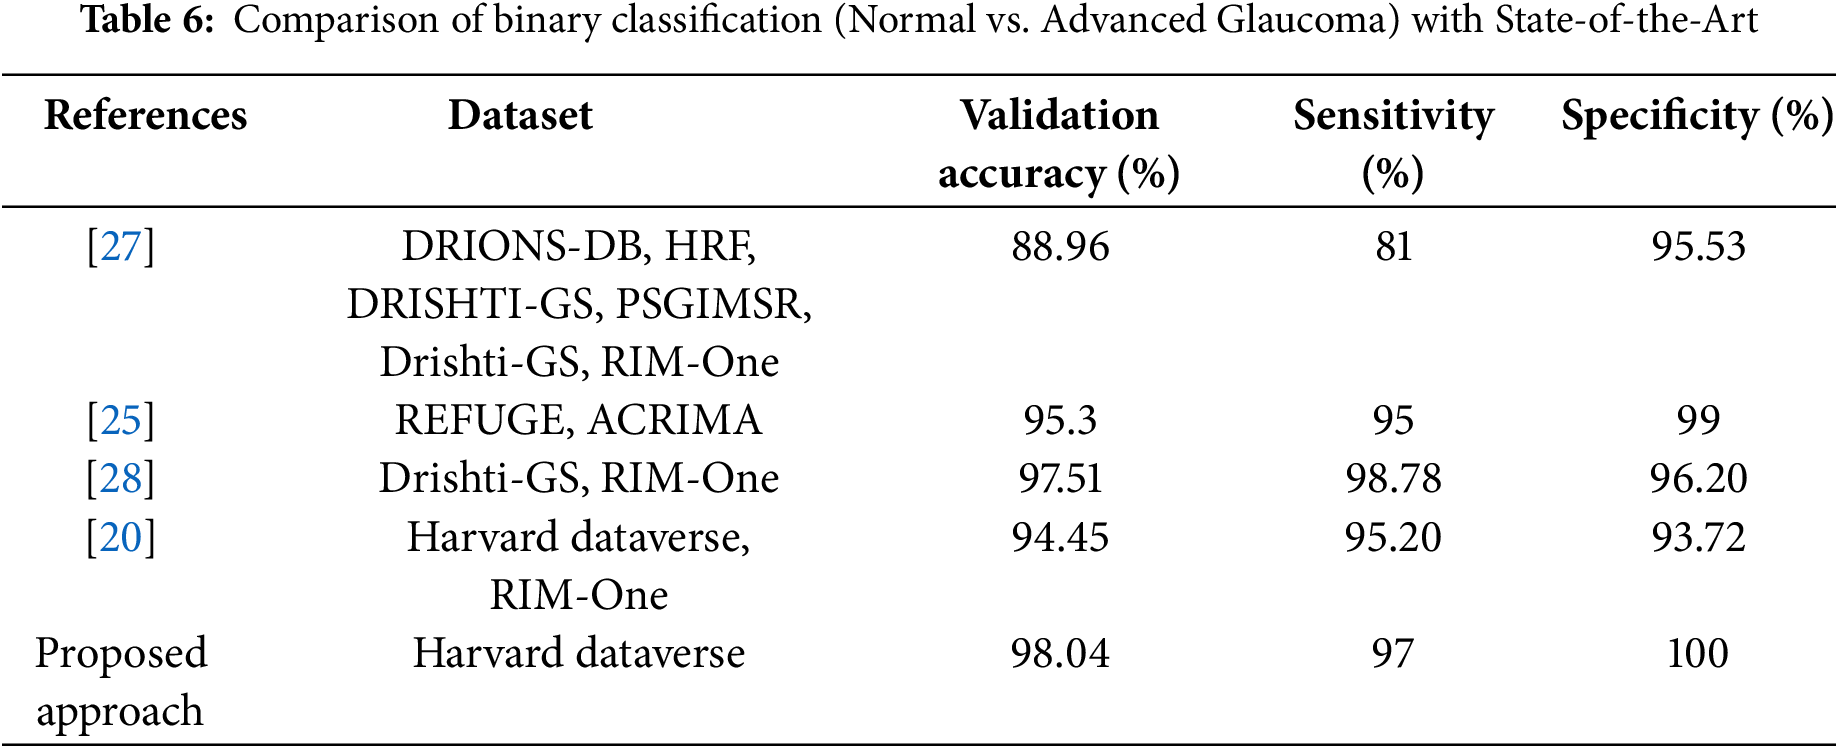
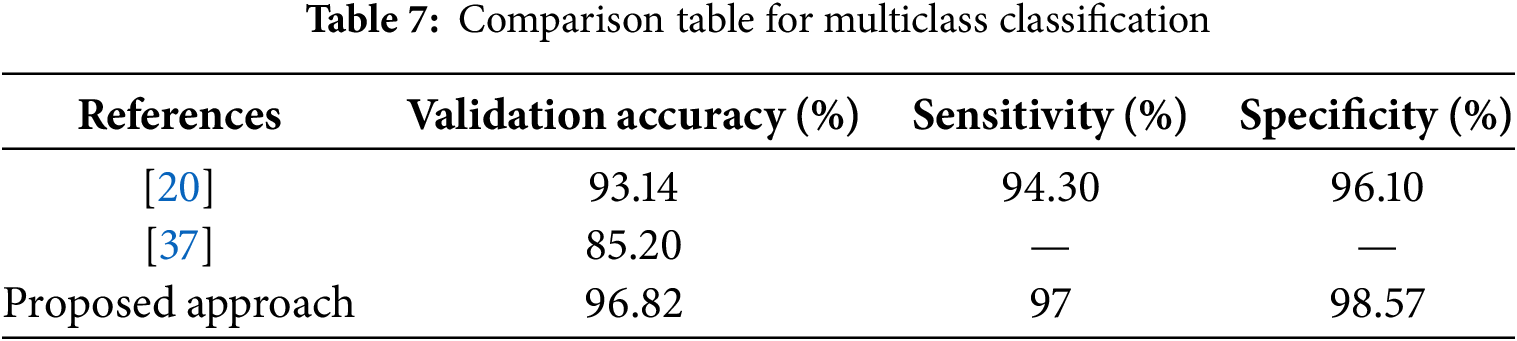
As shown in Table 6, a major achievement of this work in binary classification is attaining 100% specificity, meaning that it correctly classified all healthy images and 98.04% accuracy compared to other studies for normal vs. advanced glaucoma. The comparison table for multiclass classification is shown in Table 7. The proposed ensemble approach achieved the best result compared to state-of-the-art methods. In particular, this research provides an efficient binary and multiclass classification of glaucoma.
4.5.4 Interpretation of Results and Dataset Sensitivity
Performance variability across experiments was observed, reflecting sensitivity to data splits and the intrinsic difficulty of different classification tasks. Classifying between Normal and Advanced Glaucoma, where morphological differences are more pronounced, resulted in higher accuracy. In contrast, distinguishing Normal from Early Glaucoma, which involves subtler changes in OD and OC morphology, proved more challenging. This highlights the importance of considering intrinsic feature similarity when interpreting performance metrics. Future work will incorporate k-fold cross-validation and stratified sampling to comprehensively assess model robustness across varying data conditions.
The confusion matrix analysis reveals that the proposed ensemble model achieves particularly high true positive rates for advanced glaucoma detection while maintaining high specificity for normal controls. Importantly, early glaucoma, which typically presents subtle visual features, is detected with a high sensitivity of 97%, supporting the model’s clinical applicability for early intervention.
4.5.5 Limitations and Future Improvements
While the proposed E-GlauNet model achieves high accuracy and specificity on the Harvard Dataverse dataset, there are inherent limitations that must be acknowledged. The dataset, although widely used, is relatively limited in size compared to larger ophthalmic datasets and may possess intrinsic biases related to imaging device characteristics, patient demographics, and data acquisition protocols. These factors may affect the generalizability of the model to broader, real-world clinical populations.
Another important limitation of the current study is the lack of direct clinical validation or feedback from ophthalmologists. While the computational performance metrics are promising, assessing the model’s usability, interpretability, and clinical trustworthiness through expert evaluation remains crucial. Future work will include collaboration with ophthalmologists to obtain qualitative and quantitative feedback, validate diagnostic decision support capabilities, and refine the model for practical deployment in clinical environments.
While high validation and testing accuracies were achieved, it is recognized that some risk of overfitting remains, particularly given the moderate size and limited diversity of the Harvard Dataverse dataset. External validation on independent datasets will be essential to more rigorously assess the model’s generalization capability and further confirm the robustness of the reported results.
Although the ensemble fusion mechanism improves robustness and accuracy, it also introduces increased computational complexity and resource requirements compared to single-model solutions. However, the use of relatively lightweight ConvNet architectures (ResNet-50, VGG-16, and InceptionV3) and the choice of simple averaging fusion mitigate some of this overhead. Although the ensemble approach enhances classification robustness and accuracy, it also reduces model interpretability by obscuring the specific contribution of individual base models. This trade-off highlights the need for future work exploring ensemble transparency methods, such as contribution analysis, uncertainty modeling, and attention-based fusion mechanisms, to provide clearer insights into decision-making processes and support clinical adoption.
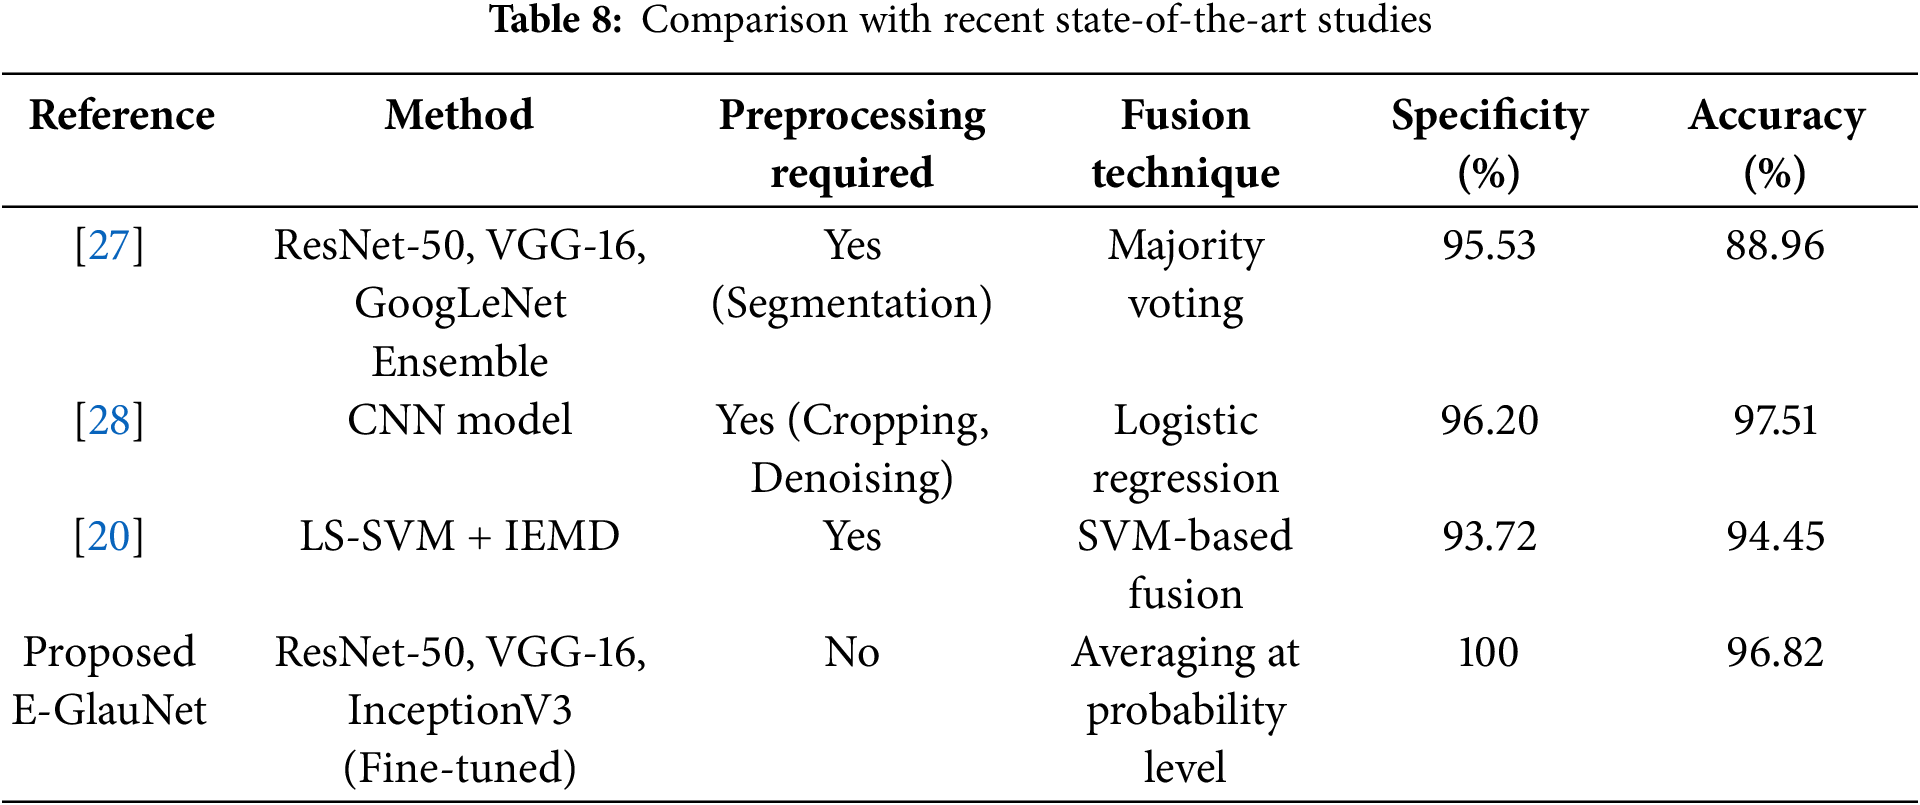
In addition to the above results, the proposed E-GlauNet ensemble model demonstrates notable advancements over previous studies. Unlike traditional ensemble methods relying on simple voting mechanisms [27], our probability-averaging strategy allows better uncertainty handling and enhances robustness across multiple glaucoma stages. Furthermore, the customization of pre-trained models for glaucoma-specific features, without extensive segmentation or preprocessing, contributes to improved clinical applicability. To further highlight the superiority of our approach, Table 8 presents a direct comparison with recent state-of-the-art studies.
Glaucoma, a retinal disease, affects millions of people worldwide each year. If left untreated, glaucoma can cause significant vision loss in a large portion of the world’s population. As a result, early detection is critical to prevent its progression to permanent vision loss. Traditional diagnostic approaches, such as measuring the dimensions of the OC and OD, are tedious, slow, and subjective, making early identification and diagnosis challenging. The proposed work aims to provide more efficient and accurate identification of the stages of glaucoma, helping to timely diagnosis and intervention to prevent vision loss and improve patient outcomes. This study presents four different experiments, each focused on improving the differentiation between advanced glaucoma, early glaucoma, and normal control. It achieves a validation accuracy of 98.39% for Normal vs. (Early + Advanced Glaucoma), 98.04% for Normal vs. Advanced Glaucoma, 93.18% for Normal vs. Early Glaucoma and 93. 55% for Early vs. Advanced Glaucoma. The research correctly classified healthy images by attaining a specificity of 100%. The proposed ensemble model achieved a state-of-the-art precision of 96. 82%, with 97% sensitivity and 98.57% specificity for multiclass classification of glaucoma.
Future work will involve integrating and benchmarking newer architectures, such as EfficientNet and Transformer-based models, within the ensemble framework to further enhance classification accuracy and robustness across diverse retinal fundus datasets. Moreover, exploring alternative ensemble fusion techniques, including weighted averaging and feature-level stacking with an additional classifier, will be prioritized in future studies to further optimize model performance and robustness. Currently, the model has been evaluated only on the Harvard Dataverse dataset; however, external validation using independent datasets such as DRIONS-DB, RIM-ONE, and REFUGE is planned as future work to comprehensively assess the robustness and clinical applicability of the proposed approach. Although AUC-ROC and decision curve analysis (DCA) could provide additional insights regarding clinical utility across various decision thresholds, it was not conducted in this study due to the absence of patient-level outcome data. Incorporating AUC-ROC and DCA will be a priority in future extensions involving larger, clinically annotated datasets. While the current study focuses on classification performance metrics, enhancing model interpretability remains a critical future direction. Techniques such as Gradient-weighted Class Activation Mapping (Grad-CAM) and other explainable AI (XAI) tools will be incorporated in future work to visualize and better understand the specific regions influencing model predictions. These efforts will further enhance the clinical transparency and trustworthiness of the proposed ensemble model. Future work will also explore model compression techniques, such as knowledge distillation and pruning, to optimize the ensemble for real-time deployment and resource-constrained environments.
Acknowledgement: The authors would like to thank the reviewers and editors for their insightful contribution.
Funding Statement: This work is funded by Department of Robotics and Mechatronics Engineering, Kennesaw State University, Marietta, GA 30060, USA.
Author Contributions: Maheen Anwar participated in the conceptualization, development of the algorithms, data analysis, and writing of the manuscript. Saima Farhan conceptualized and supervised the research and prepared the manuscript. Yasin Ul Haq helped with the making of figures, tables, and supervised the drafting and the writing of the main manuscript. Waqar Azeem performed an analysis of the results. Muhammad Ilyas revised the manuscript draft, prepared the figures and tables, and suggested improvements. Razvan Cristian Voicu helped with the challenges faced in the research and its solutions, and Muhammad Hassan Tanveer contributed to the collection and analysis of the data. All authors reviewed the results and approved the final version of the manuscript.
Availability of Data and Materials: The data that support the findings of this study are openly available in Harvard Dataverse repository at: https://doi.org/10.7910/DVN/1YRRAC.
Ethics Approval: Not applicable.
Conflicts of Interest: The authors declare no conflicts of interest to report regarding the present study.
References
1. Flaxman SR, Bourne RR, Resnikoff S, Ackland P, Braithwaite T, Cicinelli MV, et al. Global causes of blindness and distance vision impairment 1990–2020: a systematic review and meta-analysis. Lancet Glob Health. 2017;5(12):e1221–34. doi:10.1016/S2214-109X(17)30393-5. [Google Scholar] [PubMed] [CrossRef]
2. Klein BE, Magli YL, Richie KA, Moss SE, Meuer SM, Klein R. Quantitation of optic disc cupping. Ophthalmology. 1985;92(12):1654–6. doi:10.1016/S0161-6420(85)34085-X. [Google Scholar] [PubMed] [CrossRef]
3. Quigley HA, Broman AT. The number of people with glaucoma worldwide in 2010 and 2020. Br J Ophthalmol. 2006;90(3):262–7. doi:10.1136/bjo.2005.081224. [Google Scholar] [PubMed] [CrossRef]
4. Tham YC, Li X, Wong TY, Quigley HA, Aung T, Cheng CY. Global prevalence of glaucoma and projections of glaucoma burden through 2040: a systematic review and meta-analysis. Ophthalmology. 2014;121(11):2081–90. doi:10.1016/j.ophtha.2014.05.013. [Google Scholar] [PubMed] [CrossRef]
5. Fu H, Cheng J, Xu Y, Zhang C, Wong DWK, Liu J, et al. Disc-aware ensemble network for glaucoma screening from fundus image. IEEE Trans Med Imaging. 2018;37(11):2493–501. doi:10.1109/tmi.2018.2837012. [Google Scholar] [PubMed] [CrossRef]
6. Fu H, Xu Y, Lin S, Zhang X, Wong DWK, Liu J, et al. Segmentation and quantification for angle-closure glaucoma assessment in anterior segment OCT. IEEE Trans Med Imaging. 2017;36(9):1930–8. doi:10.1109/tmi.2017.2703147. [Google Scholar] [PubMed] [CrossRef]
7. Morgan JE, Sheen NJL, North RV, Choong Y, Ansari E. Digital imaging of the optic nerve head: monoscopic and stereoscopic analysis. Br J Ophthalmol. 2005;89(7):879–84. doi:10.1136/bjo.2004.046169. [Google Scholar] [PubMed] [CrossRef]
8. Kaur R, Juneja M, Mandal AK. Computer-aided diagnosis of renal lesions in CT images: a comprehensive survey and future prospects. Comput Electr Eng. 2019;77:423–34. doi:10.1016/j.compeleceng.2018.07.024. [Google Scholar] [CrossRef]
9. Kheng GG, Wynne HS, Li M, Wang H. An automatic diabetic retinal image screening system. In: Krzysztof J Cios, editor. Medical data mining and knowledge discovery; 2001. Vol. 29, p. 181–210. [Google Scholar]
10. Cheng J, Liu J, Xu Y, Yin F, Wong DWK, Tan NM, et al. Superpixel classification based optic disc and optic cup segmentation for glaucoma screening. IEEE Trans Med Imaging. 2013;32(6):1019–32. doi:10.1109/tmi.2013.2247770. [Google Scholar] [PubMed] [CrossRef]
11. Cheng J, Yin F, Wong DWK, Tao D, Liu J. Sparse dissimilarity-constrained coding for glaucoma screening. IEEE Trans Biomed Eng. 2015;62(5):1395–403. doi:10.1109/tbme.2015.2389234. [Google Scholar] [PubMed] [CrossRef]
12. Joshi GD, Sivaswamy J, Krishnadas S. Optic disk and cup segmentation from monocular color retinal images for glaucoma assessment. IEEE Trans Med Imaging. 2011;30(6):1192–205. doi:10.1109/tmi.2011.2106509. [Google Scholar] [PubMed] [CrossRef]
13. Chen S, Shi D, Sadiq M, Cheng X. Image denoising with generative adversarial networks and its application to cell image enhancement. IEEE Access. 2020;8:82819–31. doi:10.1109/access.2020.2988284. [Google Scholar] [CrossRef]
14. Ji X, Cheng X. An adaptive multisensor image fusion method based on monogenic features. IEEE Sens J. 2020;21(14):15598–606. doi:10.1109/jsen.2020.3009242. [Google Scholar] [CrossRef]
15. Zhu X, Rangayyan RM, Ells AL. Detection of the optic nerve head in fundus images of the retina using the hough transform for circles. J Digit Imaging. 2010;23(3):332–41. doi:10.1007/s10278-009-9189-5. [Google Scholar] [PubMed] [CrossRef]
16. Abdullah M, Fraz MM, Barman SA. Localization and segmentation of optic disc in retinal images using circular Hough transform and grow-cut algorithm. PeerJ. 2016;4(3):e2003. doi:10.7717/peerj.2003. [Google Scholar] [PubMed] [CrossRef]
17. Lu S. Accurate and efficient optic disc detection and segmentation by a circular transformation. IEEE Trans Med Imaging. 2011;30(12):2126–33. doi:10.1109/tmi.2011.2164261. [Google Scholar] [PubMed] [CrossRef]
18. Fink F, Worle K, Gruber P, Tome A, Gorriz-Saez J, Puntonet C, et al. ICA analysis of retina images for glaucoma classification. In: 2008 30th Annual International Conference of the IEEE Engineering in Medicine and Biology Society; 2008 Aug 20–25; Vancouver, BC, Canada. p. 4664–7. doi:10.1109/IEMBS.2008.4650253. [Google Scholar] [PubMed] [CrossRef]
19. Nayak DR, Das D, Majhi B, Bhandary SV, Acharya UR. ECNet: an evolutionary convolutional network for automated glaucoma detection using fundus images. Biomed Signal Process Control. 2021;67(11):102559. doi:10.1016/j.bspc.2021.102559. [Google Scholar] [CrossRef]
20. Parashar D, Agrawal DK. Classification of glaucoma stages using image empirical mode decomposition from fundus images. J Digit Imaging. 2022;35(5):1283–92. doi:10.1007/s10278-022-00648-1. [Google Scholar] [PubMed] [CrossRef]
21. Bock R, Meier J, Nyul LG, Hornegger J, Michelson G. Glaucoma risk index: automated glaucoma detection from color fundus images. Medical Image Anal. 2010;14(3):471–81. doi:10.1016/j.media.2009.12.006. [Google Scholar] [PubMed] [CrossRef]
22. Ahn JM, Kim S, Ahn KS, Cho SH, Lee KB, Kim US. A deep learning model for the detection of both advanced and early glaucoma using fundus photography. PLoS One. 2018;13(11):e0207982. doi:10.1371/journal.pone.0207982. [Google Scholar] [PubMed] [CrossRef]
23. Chen X, Xu Y, Wong DWK, Wong TY, Liu J. Glaucoma detection based on deep convolutional neural network. In: 2015 37th Annual International Conference of the IEEE Engineering in Medicine and Biology Society (EMBC); 2015 Aug 25–29; Milan, Italy. p. 715–8. doi:10.1109/EMBC.2015.7318462. [Google Scholar] [PubMed] [CrossRef]
24. Al-Bander B, Al-Nuaimy W, Al-Taee MA, Zheng Y. Automated glaucoma diagnosis using deep learning approach. In: 2017 14th International Multi-Conference on Systems, Signals & Devices (SSD); 2017 Mar 28–31; Marrakech, Morocco. p. 207–10. doi:10.1109/SSD.2017.8166974. [Google Scholar] [CrossRef]
25. Juneja M, Thakur S, Uniyal A, Wani A, Thakur N, Jindal P. Deep learning-based classification network for glaucoma in retinal images. Comput Electr Eng. 2022;101(11):108009. doi:10.1016/j.compeleceng.2022.108009. [Google Scholar] [CrossRef]
26. Benzebouchi NE, Azizi N, Bouziane SE. Glaucoma diagnosis using cooperative convolutional neural networks. Int J Adv Electron Comput Sci. 2018;5(1):31–6. [Google Scholar]
27. Joshi S, Partibane B, Hatamleh WA, Tarazi H, Yadav CS, Krah D. Glaucoma detection using image processing and supervised learning for classification. J Healthc Eng. 2022;2022(1):2988262. doi:10.1155/2022/2988262. [Google Scholar] [PubMed] [CrossRef]
28. Juneja M, Thakur N, Thakur S, Uniyal A, Wani A, Jindal P. GC-NET for classification of glaucoma in the retinal fundus image. Mach Vision Appl. 2020;31(5):1–18. doi:10.1007/s00138-020-01091-4. [Google Scholar] [CrossRef]
29. Ajitha S, Akkara JD, Judy M. Identification of glaucoma from fundus images using deep learning techniques. Indian J Ophthalmol. 2021;69(10):2702–9. doi:10.4103/ijo.IJO_92_21. [Google Scholar] [PubMed] [CrossRef]
30. de Sales Carvalho NR, Rodrigues MdCLC, de Carvalho Filho AO, Mathew MJ. Automatic method for glaucoma diagnosis using a three-dimensional convoluted neural network. Neurocomputing. 2021;438(3):72–83. doi:10.1016/j.neucom.2020.07.146. [Google Scholar] [CrossRef]
31. Xavier FJ. ODMNet: automated glaucoma detection and classification model using heuristically-aided optimized DenseNet and MobileNet transfer learning. Cybernet Syst. 2024;55(1):245–77. doi:10.1080/01969722.2023.2166250. [Google Scholar] [CrossRef]
32. Sujithra B, Jerome SA. Identification of glaucoma in fundus images utilizing gray wolf optimization with deep convolutional neural network-based ResNet50 model. Multimed Tools Appl. 2024;83(16):49301–19. doi:10.1007/s11042-023-17506-z. [Google Scholar] [CrossRef]
33. Elmannai H, Alhussan AA, Ayadi M, Ksibi A. An improved deep learning framework for automated optic disc localization and glaucoma detection. Comput Model Eng Sci. 2024;140(2):1429–57. doi:10.32604/cmes.2024.048557. [Google Scholar] [CrossRef]
34. Kim U. Machine learn for glaucoma. Cambridge, MA, USA: Harvard Dataverse; 2018. doi:10.7910/DVN/1YRRAC. [Google Scholar] [CrossRef]
35. He K, Zhang X, Ren S, Sun J. Deep residual learning for image recognition. In: Proceedings of the 2016 IEEE Conference on Computer Vision and Pattern Recognition; 2016 Jun 27–30; Las Vegas, NV, USA. p. 770–8. [Google Scholar]
36. Rokach L. Ensemble-based classifiers. Artif Intell Rev. 2010;33(1-2):1–39. doi:10.1007/s10462-009-9124-7. [Google Scholar] [CrossRef]
37. Cho H, Hwang YH, Chung JK, Lee KB, Park JS, Kim HG, et al. Deep learning ensemble method for classifying glaucoma stages using fundus photographs and convolutional neural networks. Curr Eye Res. 2021;46(10):1516–24. doi:10.1080/02713683.2021.1900268. [Google Scholar] [PubMed] [CrossRef]
Cite This Article
 Copyright © 2025 The Author(s). Published by Tech Science Press.
This work is licensed under a Creative Commons Attribution 4.0 International License , which permits unrestricted use, distribution, and reproduction in any medium, provided the original work is properly cited.
 Downloads
 Citation Tools