
 Submit a Paper
 Propose a Special lssue
 Open Access
ARTICLE
A Novel Face-to-Skull Prediction Based on Face-to-Back Head Relation
1 Univ. Lille, CNRS, Centrale Lille, UMR 9013-LaMcube-Laboratoire de Mécanique, Multiphysique, Multiéchelle, F-59000, Lille, France
2 School of Biomedical Engineering, International University, Ho Chi Minh City, 700000, Vietnam
3 Vietnam National University Ho Chi Minh City, Vietnam
* Corresponding Author: Tan-Nhu Nguyen. Email:
Computers, Materials & Continua 2025, 84(2), 3345-3369. https://doi.org/10.32604/cmc.2025.065279
Received 08 March 2025; Accepted 20 May 2025; Issue published 03 July 2025
 View Full Text
 Download PDF
Abstract
Skull structures are important for biomechanical head simulations, but they are mostly reconstructed from medical images. These reconstruction methods harm the human body and have a long processing time. Currently, skull structures can be straightforwardly predicted from the head, but a full head shape must be available. Most scanning devices can only capture the face shape. Consequently, a method that can quickly predict the full skull structures from the face is necessary. In this study, a novel face-to-skull prediction procedure is introduced. Given a three-dimensional (3-D) face shape, a skull mesh could be predicted so that its shape would statistically fit the face shape. Several prediction strategies were conducted. The optimal prediction strategy with its optimal hyperparameters was experimentally selected through a ten-fold cross-validation with 329 subjects. As a result, the face-to-skull prediction strategy based on the relations between face head shape and back head shape, between face head shape and face skull shape, and between back head shape and back skull shape was optimal. The optimal mean mesh-to-mesh distance (mean ± SD) between the predicted skull shapes and the ground truth skull shapes was 1.93 ± 0.36 mm, and those between the predicted skull meshes and the ground truth skull meshes were 2.65 ± 0.36 mm. Moreover, the prediction errors in back-skull and muscle attachment regions were 1.7432 ± 0.5217 mm and 1.7671 ± 0.3829 mm, respectively. These errors are within the acceptable range of facial muscle simulation. In perspective, this method will be employed in our clinical decision support system to enhance the accuracy of biomechanical head simulation based on a stereo fusion camera system. Moreover, we will also enhance the accuracy of the face-to-skull prediction by diversifying the dataset into more varied geographical regions and genders. More types of parameters, such as Body Mass Index (BMI), coupled with head-to-skull thicknesses, will be fused with the proposed face-to-skull procedure.Keywords
Muscle-based facial paralysis grading requires a patient-specific biomechanical head model [1,2]. Skull structures are important in this biomechanical head simulation [3–6]. In these types of simulations, the head shape, skull shape, and muscle network must be pre-defined in a subject-specific manner [1]. The skull structure helps form the head shape and positions the muscle attachment/insertion points [7], so the accuracy of skull structure reconstruction affects the accuracy of facial muscle analysis and diagnosis in facial paralysis grading [8].
Skull structures have been mostly reconstructed from medical images, such as Computed Tomography (CT) and/or Magnetic Resonance Imaging (MRI) image sets [9]. However, these methods are harmful to the human body in the case of using CT-based methods [10]. In particular, a head CT scan exposes an individual to approximately 2 millisieverts (mSv) of radiation [11]. This radiation level is equivalent to about 8 months of natural background radiation. Moreover, a full-body CT scan can deliver up to 10 mSv, which is equivalent to about 3 years of natural background radiation [12]. These radiation levels are considered low-risk for single scans, but they can accumulate health risks if the scan is repeated frequently [13]. Especially in the case of 3-D reconstruction of the whole head-and-neck region, multiple scans of up to 500 slices are needed for high-resolution scanning [13]. These exposed radiation levels were even more harmful in the case of paediatric and pregnant individuals, as developing tissues are more sensitive to radiation [14]. Note that image scanning, segmentation, and 3D reconstruction also require long acquisition times and much clinical expertise in the case of using MRI-based methods [15,16]. Scanning devices, such as infrared sensors, laser scanners, and stereo cameras, can quickly and safely reconstruct 3-D shapes of the human head, but they cannot capture internal structures, such as the skull [17–20]. A straightforward head-to-skull prediction method was, therefore, strongly required.
Recently, skull structures have been predicted from the head with acceptable accuracy using the statistical relationship between head and skull shapes [21]. In particular, with a dataset of 209 head and skull shapes reconstructed from the public CT. The head-to-skull relationship was trained using the Partial Least Squares Regression (PLSR) algorithm [22,23]. Based on this relationship, given a head shape, its skull shape could be predicted to be statistically fit with the head shape. The template skull mesh would be deformed so that its shape would fit the predicted skull shape. We could achieve an acceptable accuracy for facial mimic applications. In particular, the mesh-to-mesh distance errors (mean ± SD) of the head-to-skull prediction method were from 2.09 ± 0.15 mm to 2.64 ± 0.26 mm. Several prediction strategies have also been developed to enhance the accuracy of the head-to-skull prediction [24,25]. For instance, by separately training the head-to-skull relation in the face head and back head regions, the accuracy of the head-to-skull prediction can be enhanced up to 36.96% for the skull shape prediction and 14.17% for the skull mesh prediction [25]. This enhancement was also due to the increase in the size of the training dataset [25]. In perspective, several prediction strategies and advanced non-linear regression methods could also be employed to continue to improve the accuracy of the head-to-skull prediction [26].
Even though the accuracy of the head-to-skull prediction is progressive, the full head shape must be available to predict the skull structure. Most 3-D scanning devices, such as laser scanners, infrared sensors, and stereo-vision sensors, can only capture the 3-D structure of the face [17–20]. Although some studies can utilise multiple 3-D views captured by a 3-D scanner to reconstruct the full 3-D structure of the head, the reconstructed head shape may contain some outlier structures, such as hair [27]. Consequently, the full skull structure could not be predicted from these reconstructed head shapes. Another full head regeneration procedure should be introduced. Some studies tried to overcome this drawback by scaling a template head structure to the subject-specific face structure on the x-, y-, and z-axes of the Euclidean coordinate system. For example, in our previous study, we employed a Microsoft Kinect V2.0 sensor coupled with its Kinect Software Development Kit (SDK) 2.0 to detect 3-D high-definition face points in real-time [1]. For the neutral mimic, a template head shape from the Kinect SDK 2.0 was scaled so that its face vertices optimally fit with the detected face points. The full head structure was finally formed by the detected face points and the back head vertices. During head and face movements, the back head vertices of the scaled head were coupled with the animated face points to provide rigid and non-rigid animation of the head with a real-time framerate of up to 60 frames per second. The generated head shape could be employed for predicting the full skull structure and muscle network [1]. This procedure could also be employed with a stereo-fusion sensor to generate subject-specific head and skull meshes and muscle networks using multiple cameras [2]. However, the relationship between the back head and the face head region has not been studied in these studies [1,2]. The accuracy of the full head shape and, therefore, the predicted skull structure was not high, especially in the back of the head regions [1,2].
The estimation of the full head structure from the face could be acceptably conducted with the Statistical Shape Modeling (SSM) head shape, such as FLAME [28]. In this type of SSM-based head shape model, the head shape can be controlled by the translation, pose, shape, and expression parameter sets [28]. These parameter sets were trained from a database of full-head shapes using the Principal Component Analysis (PCA) algorithm [29]. However, the database of the full-head shapes was mostly accurate in the face region, and the back-head region was simply scaled from a computer-aided design (CAD) head mesh [28]. Consequently, the back head region could not be predicted from the face accurately using the FLAME model. In this study, the PCA-based SSMs of the face and the back head shapes were trained on the database of 329 3-D head shapes reconstructed from the CT images. The relationship between the face head shape PCA parameters and the back head shape PCA parameters was trained using the linear multivariate regression algorithm. With this face-to-head shape relation, the back-head shape could be predicted from the face-head shape. The mesh-to-mesh distances between the predicted back-head shapes and the ground truth back-head shapes (Mean ± SD) were 1.15 ± 0.21 mm, which outperformed the face-head-to-back-head prediction methods using the scaling and FLAME-based face-head-to-back-head procedures. However, this face-head-to-back-head prediction has not been employed for predicting the full skull structure from the face. Moreover, other region-of-interest (ROI) relations on the head and skull shapes, such as the face-skull-to-back-skull relation, might also contribute to the accuracy of the face-head-to-full-skull prediction.
Because of the above drawbacks, in this study, we proposed a novel procedure for predicting the full-skull structure based only on the face-head structure. In particular, we employed 329 3-D head and skull models reconstructed from public CT image databases. The reconstructed head and skull meshes were sampled to get the back-head (BH), face-head (FH), back-skull (BS), and face-skull (FS) features. In the training procedure, the FH, BH, FS, and BS shapes were parameterized based on the PCA algorithm [29] with the training datasets. Moreover, multiple shape-parameter relations, such as FH-to-BH, FS-to-BS, FH-to-FS, and BH-to-BS, were also investigated with the training datasets. In the testing procedure, with the FH shape parameters, we predicted the FS and BS shape parameters. These parameters were reconstructed into a 3-D full-skull shape. The template skull mesh was deformed to the predicted skull shape to yield the predicted skull mesh. Several face-head-to-full-skull (FH2S) prediction strategies were also conducted and cross-validated to select the optimal strategy. After conducting this study, we had three main contributions: (1) a novel procedure for predicting the full-skull structure from the face, (2) an investigation of the face-skull to back-skull relation, and (3) a novel full-skull structure generation from the skull shape. The proposed method in this study will also be helpful for the applications of biomechanical head simulations in the case of having only the FH shape. In perspective, we will employ the FH2S prediction in our clinical decision-support system for facial mimic rehabilitation to enhance the accuracy of facial paralysis analysis and diagnosis.
In the following, we first introduce the overall training and testing procedure conducted in this study in Section 2.1. The dataset preparation and feature sampling procedures will then be presented in Section 2.2. The training and testing of the various back-head, face-head, face-skull, and face-skull shape relations will also be described in Section 2.3. Different face-head-to-full-skull prediction strategies will be investigated in Section 2.4. We also show the cross-validation method in Section 2.4. The results of the cross-validation procedure and the optimal accuracy of the face-head-to-full-skull prediction will be shown in Section 3. Finally, discussion and conclusions will be written in Sections 4 and 5.
2.1 Overall Processing Procedure
The overall procedure of the face-head-to-full-skull prediction is briefly illustrated in Fig. 1. Specifically, this procedure is composed of three main stages: (1) dataset preparation, (2) statistical shape relation training, and (3) face-to-skull prediction.
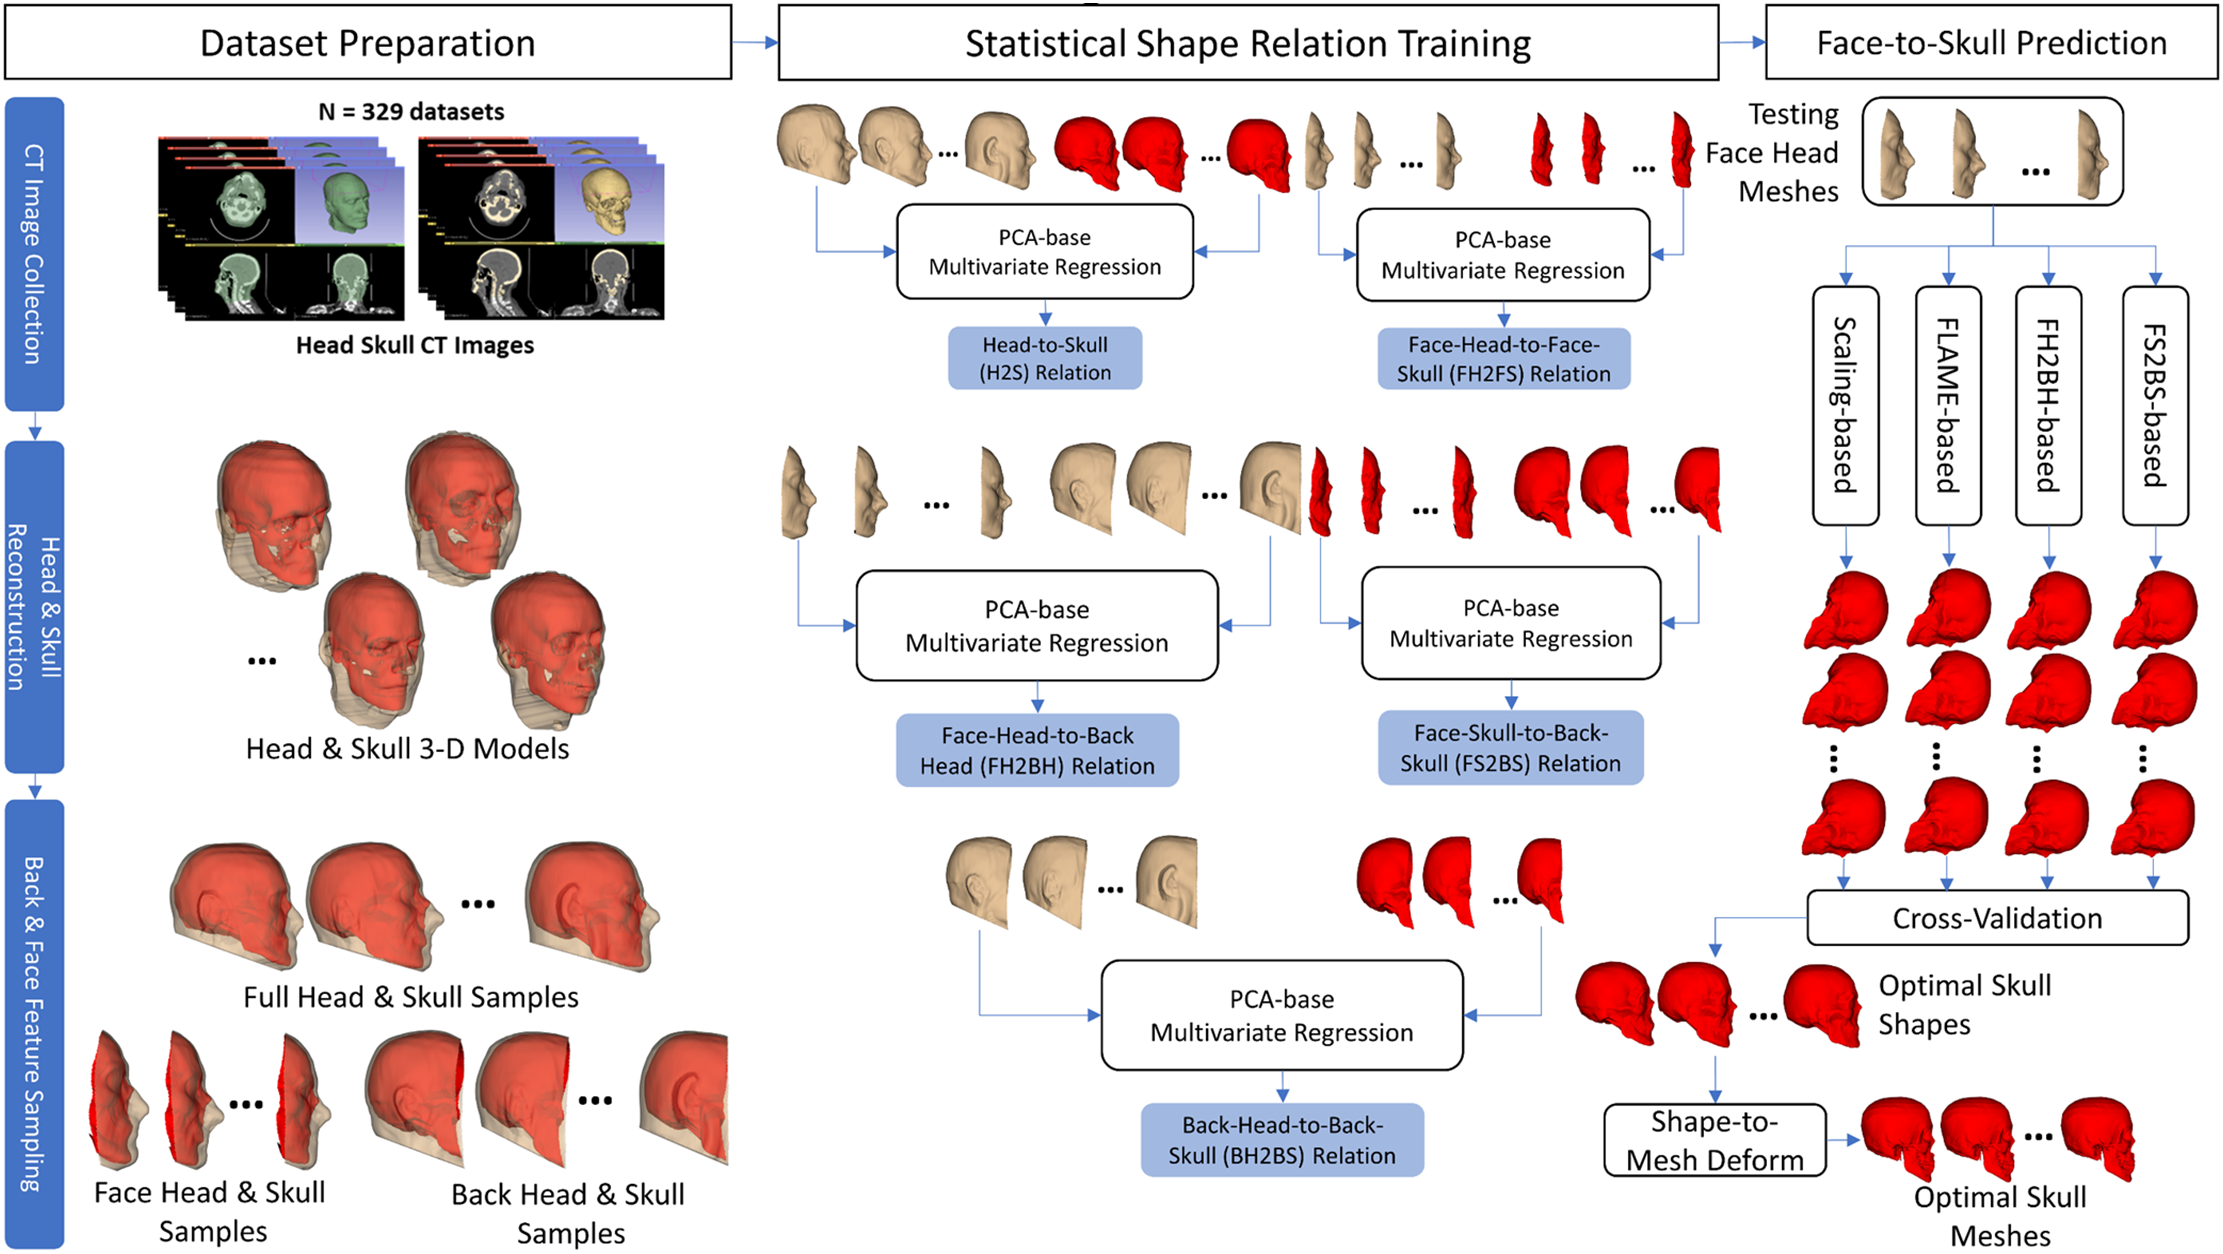
Figure 1: Overall processing procedure
(1) Regarding the dataset preparation, we collected CT image sets of 329 subjects from public head-neck CT image databases. The head and skull structures were segmented from the CT images for each subject to form the 3-D head and skull meshes. The CT-reconstructed head and skull meshes were then sampled to get the face-head (FH), face-skull (FS), back-head (BH), and back-skull (BS) features, which represented the FH, FS, BH, and BS shapes, respectively. These shapes were normalized into the coordinate system of the first head & skull meshes. The dataset of the 329 subjects was divided into 80% of training data (264 subjects) and 20% of testing data (65 subjects).
(2) Regarding the statistical shape relationship training, the statistical shape models (SSMs) of the FH, FS, BH, and BS shapes were trained using the PCA [29] algorithm on the training data. Based on the trained SSMs, the shapes of the FH, FS, BH, and BS could be adjusted by the FH, FS, BH, and BS parameters, respectively. Moreover, various relations among those parameter sets were also trained based on the multivariate linear regression algorithm [30]. These relations included the FH-to-FS (FH2FS), BH-to-BS (BH2BS), FH-to-BH (FH2BH), and FS-to-BS (FS2BS). A ten-fold cross-validation procedure was conducted to select the optimal numbers of components for the FH, FS, BH, and BS SSMs so that the regression errors of the FH2FS, BH2BS, FH2BH, and FS2BS regression models were minimized on the testing data.
(3) Regarding the face-head-to-full-skull shape prediction, four main prediction strategies: scaling-based, FLAME-based, FH2BH-based, and FS2BS-based, were tried. A ten-fold cross-validation procedure was conducted on the testing data to select the optimal prediction strategy. The optimal Fh2S shape prediction strategy was then applied to our previous head-to-skull prediction methods [21,25] to test the accuracy of the FH2S mesh prediction.
We collected head-and-neck CT image sets of 329 subjects with normal head and skull shapes from the public database, The Cancer Imaging Archive (TCIA) [31]. In this database, we collected the head-and-neck CT image sets from two datasets: the Head-Neck-PET-CT [32] and the Head and Neck Cancer CT Atlas dataset (HNSCC) [33]. The age (Mean ± SD) of the selected subjects was 61.1 ± 10.5 years, with 265 males and 64 females. For each subject, we segmented the head and skull regions out of the CT slices thanks to the thresholds of the soft- and hard-tissue gray levels on CT images [34]. The segmented regions throughout all slices were voxelized to form 3-D head and skull meshes. The segmentation and voxelization tasks were conducted with the 3-D Slicer software [35]. The reconstructed head and skull meshes of the 329 subjects were post-processed to get only the head and skull geometries, as shown in Fig. 1.
As shown in Fig. 2, for each subject, the FLAME head model [36] was deformed to the shape of the CT-reconstructed head mesh. A cutting plane, which was predefined on the FLAME head geometry, was employed for cutting the CT head mesh. The MCUT library [37] was employed for the mesh cutting. On the FLAME head mesh’s geometry, we also defined the back-head and face-head sampling rays. The sampling rays have the starting points on the center of the FLAME head mesh’s centroid and the ending points on the FLAME head mesh’s surface. In this study, the number of back-sampling rays was 34,096, and that of the face-sampling rays was 16,021. Intersections between the head mesh and the back-sampling rays were the BH features, those between the head mesh and the face-sampling rays were the FH features, those between the skull mesh and the back-sampling rays were the BS features, and those between the skull mesh and the face-sampling rays were the FS features. Note that, in Fig. 2, we only illustrate some features of the FH, FS, BH, and BS features among their full features. The FH, FS, BH, and BS features, coupled with their pre-defined facet structures, form the FH, FS, BH, and BS shapes. Besides the back and face features, we also defined full head (H) and full skull (S) features and their facet structures to form the full-head and full-skull shapes. The H features are composed of FH and BH features, and the S features are composed of FS and BS features.
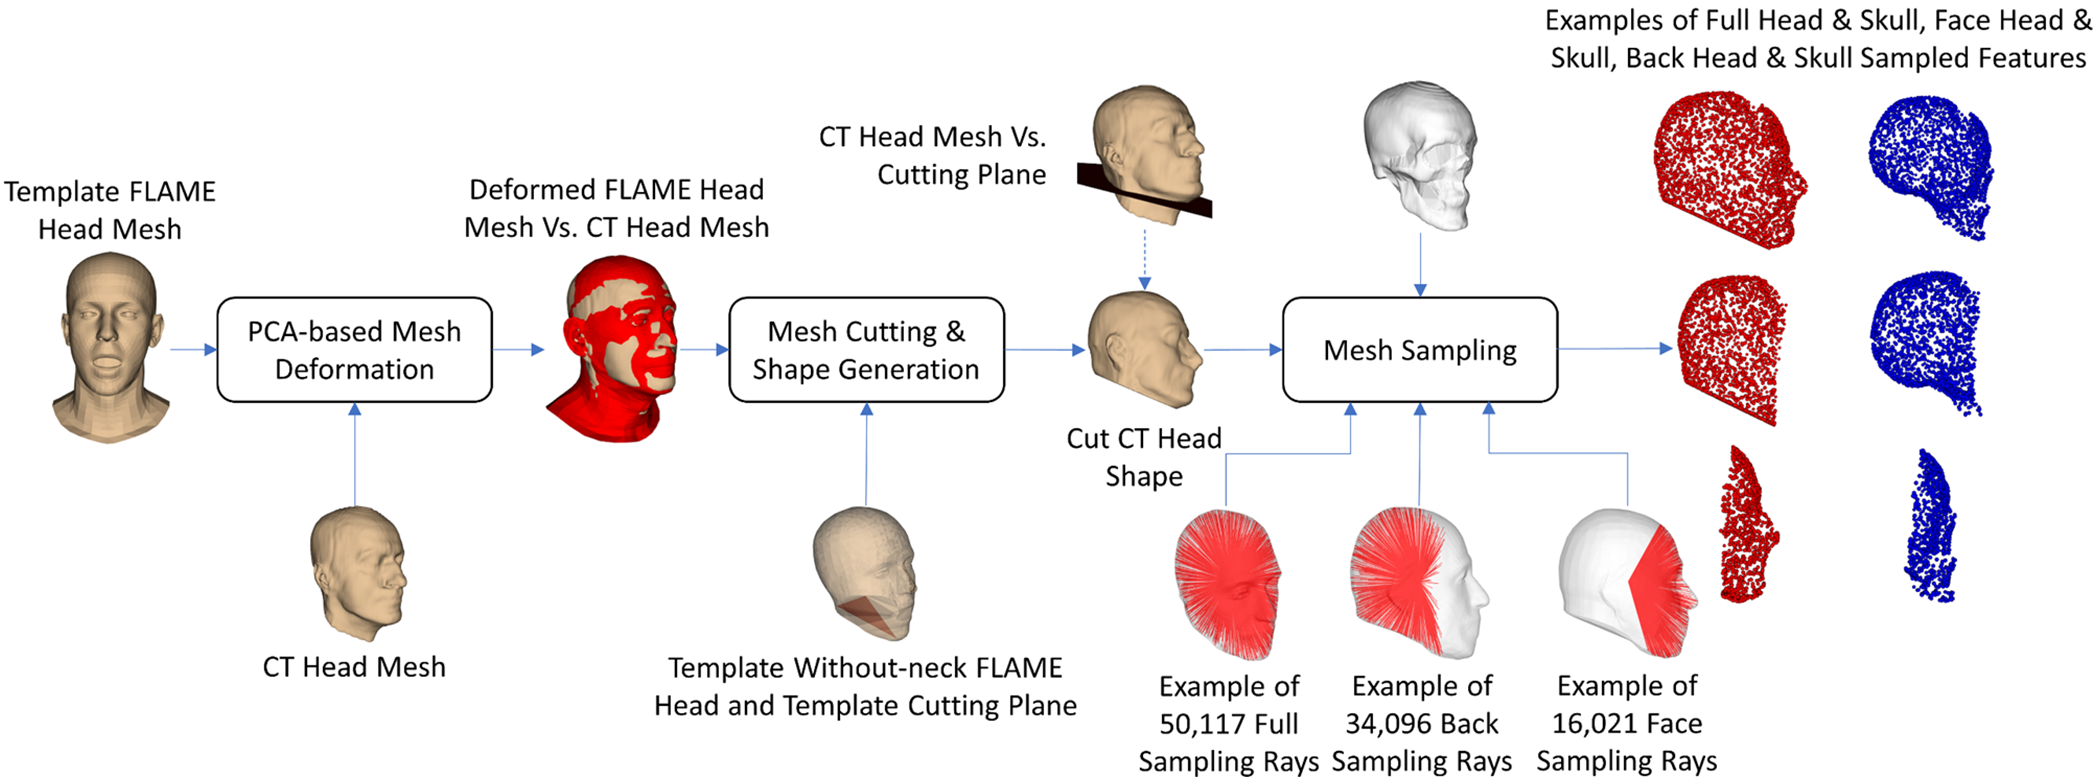
Figure 2: The dataset preparation procedure
2.3 Shape Relation Training & Prediction
The full-head-to-full-skull (H2S) relation was trained for predicting the skull shape given the full head shape. The head-to-skull prediction was conducted in our previous study based on the Partial Least Squares Regression (PLSR) algorithm through the distance-to-thickness relation [21]. However, in this study, as shown in Fig. 3, we employed the PCA-based method coupled with multivariate linear regression to study the head-to-skull relation directly through the head and skull feature points. In particular, the PCA-based SSM [29] method was used to describe the shape variation of the H and S features on the H and S training datasets. After being trained, the shape of the head and skull could be controlled by the PCA parameter sets of the head and skull SSMs, respectively. The multivariate linear regression algorithm was then used for training the relation between the head shape parameter sets and the skull shape parameter sets on the training dataset. In the testing stage, the testing head shapes were first converted to the head testing parameter sets. Based on the trained head-to-skull regression model, the skull-shape parameter sets could be predicted from the testing head-shape parameter sets. The skull shape can be reconstructed from the predicted skull parameter sets using the trained skull SSM. The predicted skull shapes were compared with the tested skull shapes to select the optimal number of components for the head and skull SSMs.

Figure 3: Full-head to full-skull shape (H2S) relation training and prediction
The same procedure as training the H2S relation was also applied to train the relation from face-head to back-head shapes, from face-skull to back-skull shapes, from face-head to face-skull shapes, from face-head to face-skull shapes, and from back-head to back-skull shapes. In particular, the face-head-to-back-head (FH2BH) relation, as shown in Fig. 4, was trained to predict the BH shape given the FH shape. The face-skull-to-back-skull (FS2BS) relation, as shown in Fig. 5, was trained for predicting the BS shape having the FS shape. Moreover, the face-head-to-face-skull relation, as shown in Fig. 6, was also investigated to support the prediction of the FS shape from the FH shape. Finally, the back-head-to-back-skull (BH2BS) relation was also studied to predict the BS shape from the BH shape, as shown in Fig. 7. In the training phase, all relations were trained on the training dataset, and, in the testing phase, the predicted shapes were compared with the testing shapes for optimizing the number of PCA components for the PCA-based statistical shape modeling.
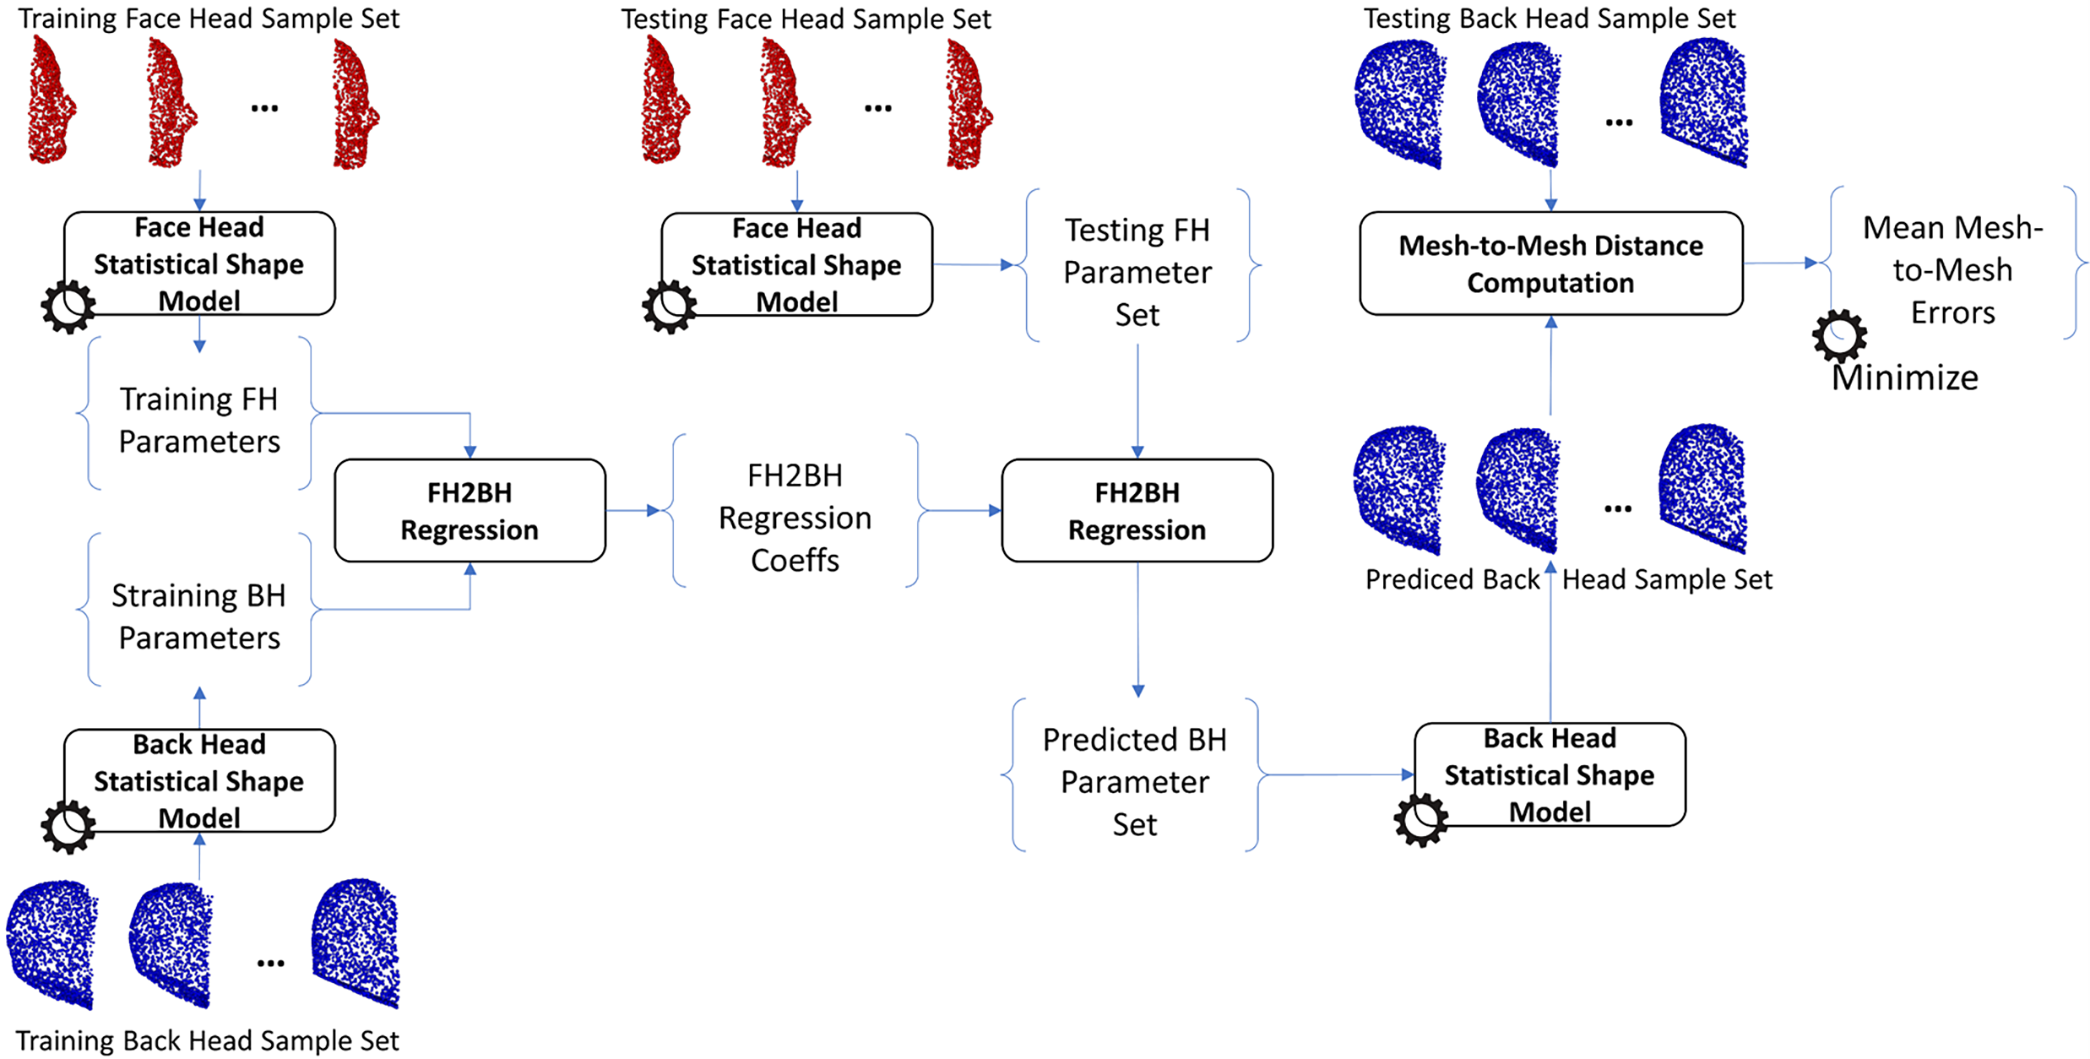
Figure 4: Training and predicting the face-head to back-head shape (FH2BH)
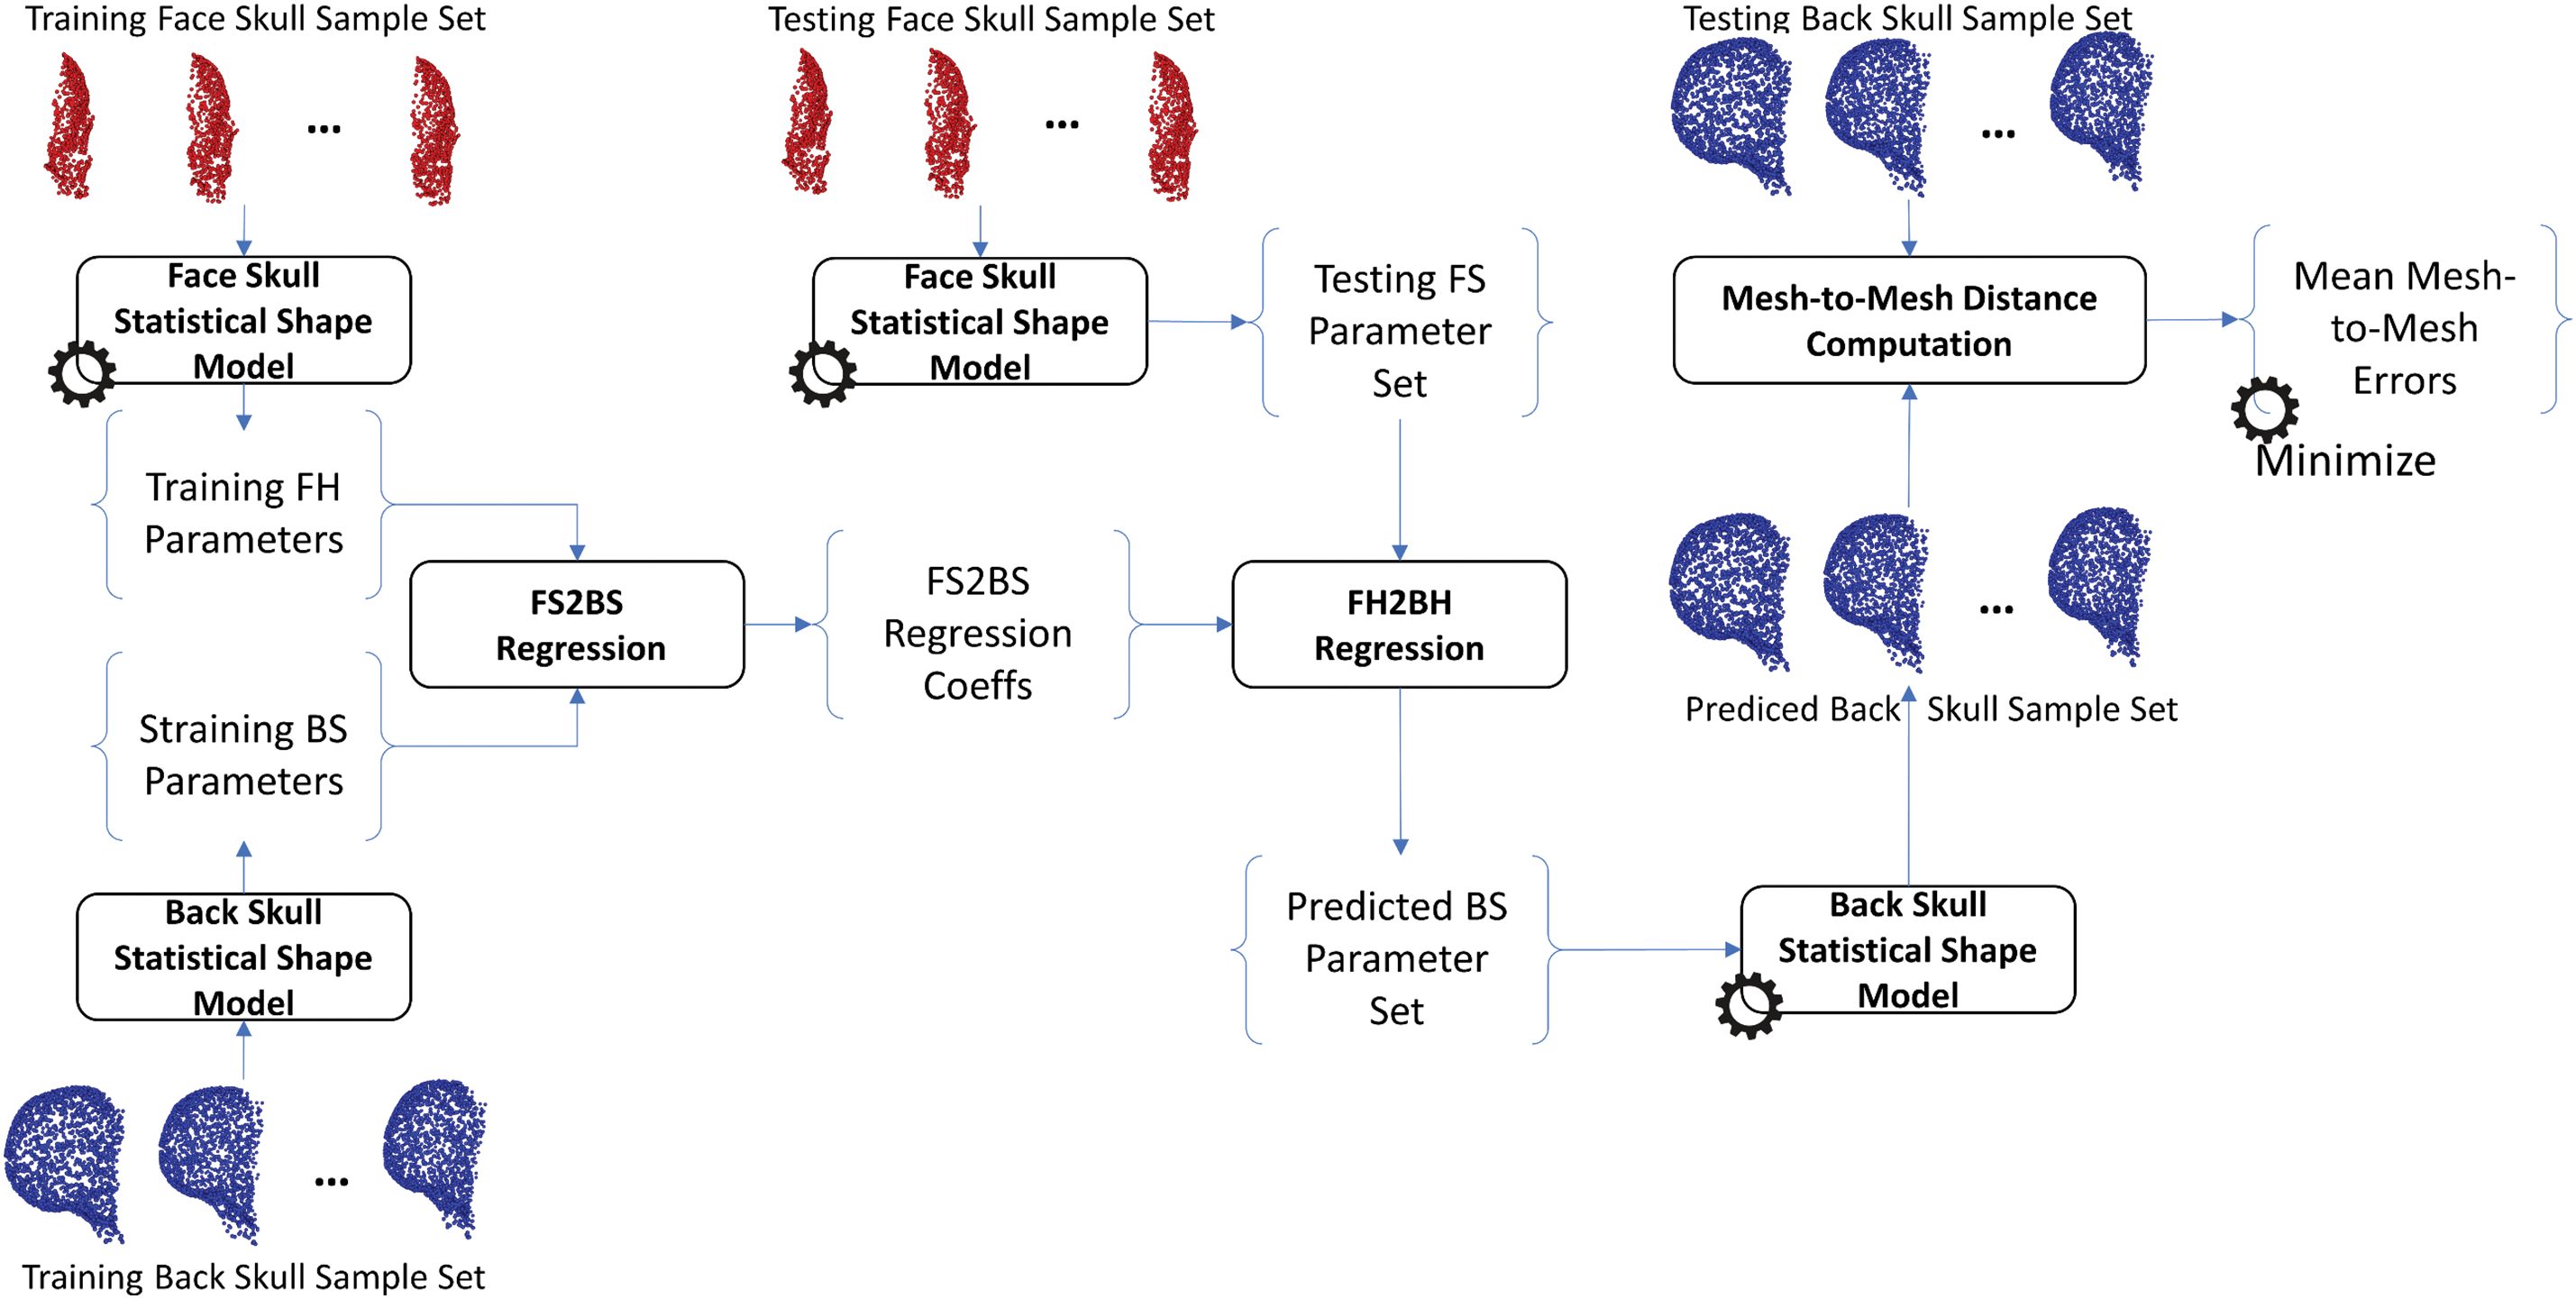
Figure 5: Training and predicting the face-skull to back-skull shape (FS2BS) relation
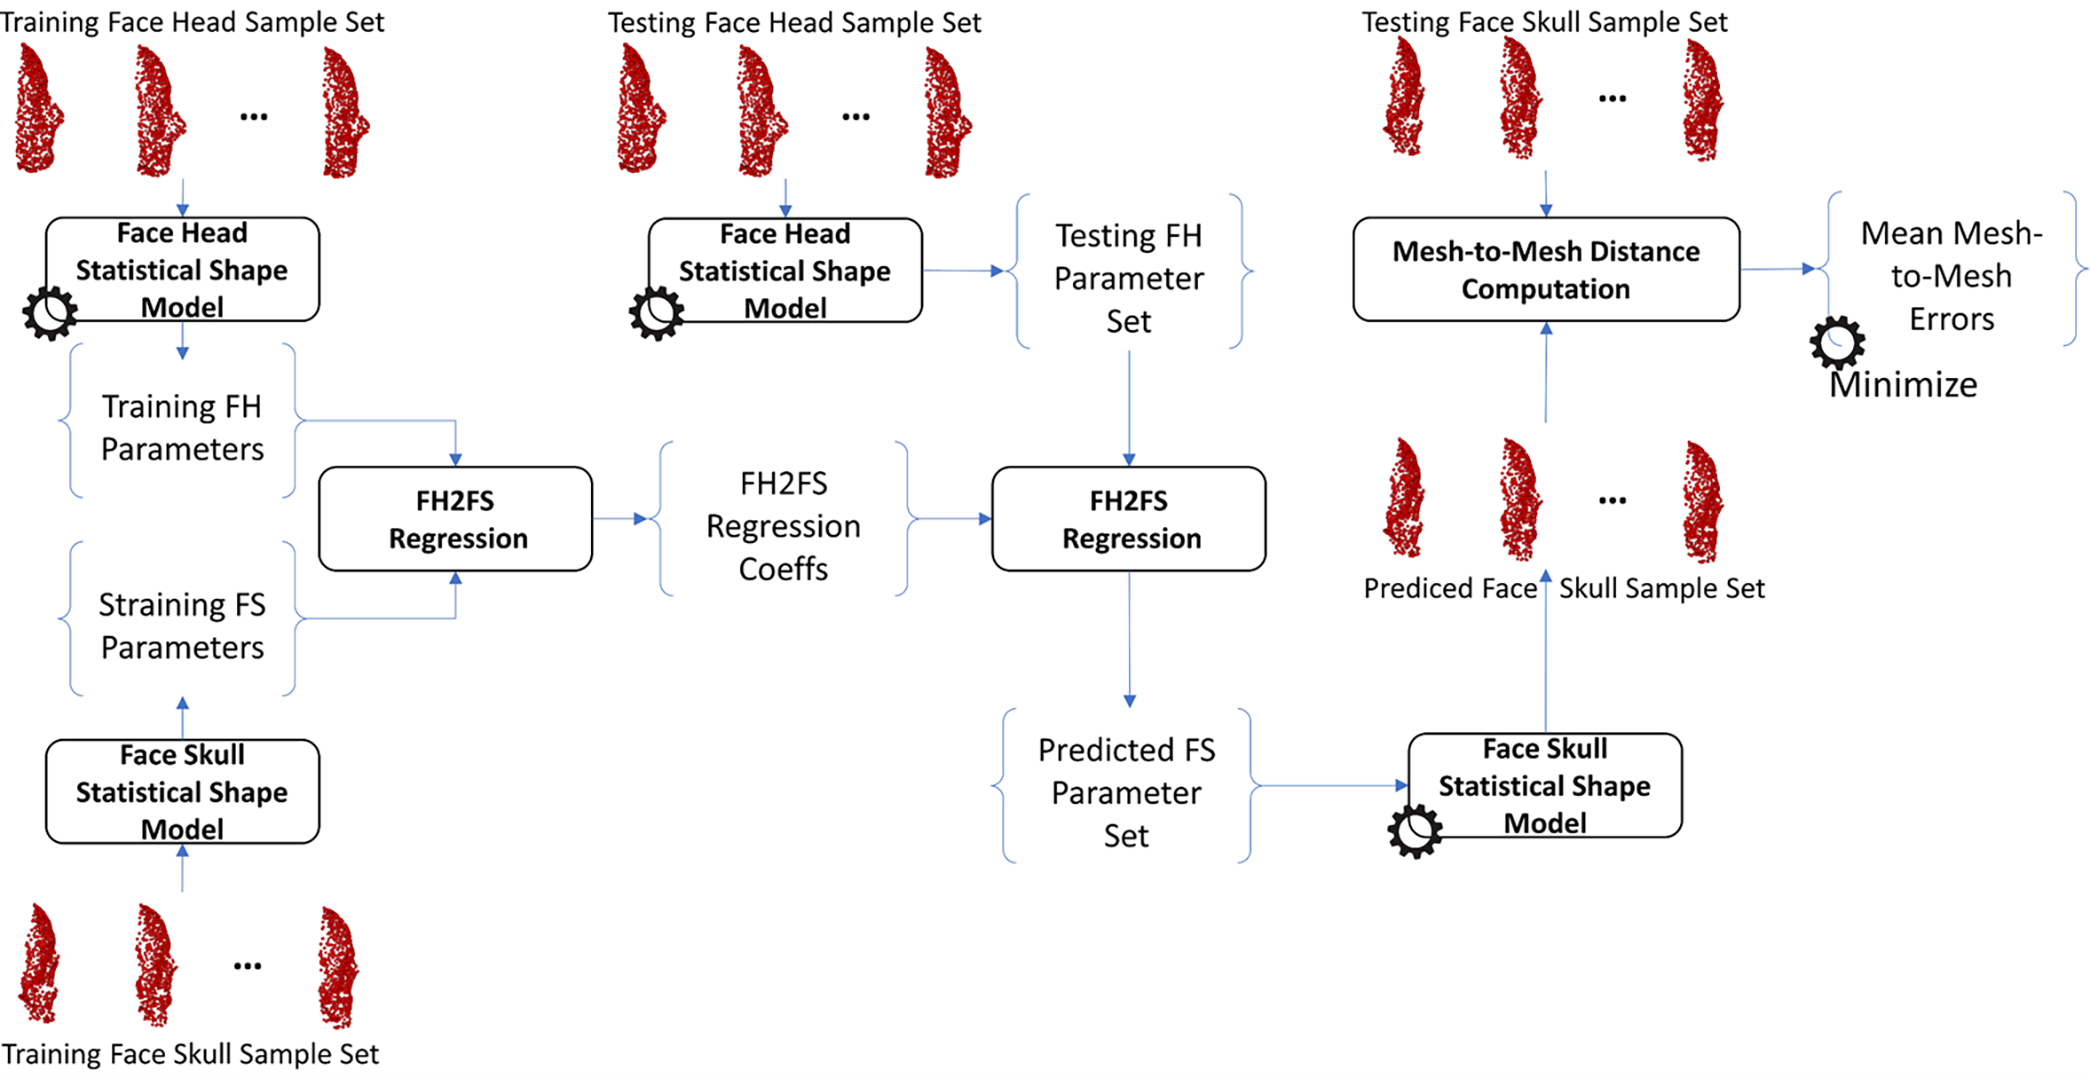
Figure 6: Training and predicting the face-head to face-skull shape (FH2FS) relation
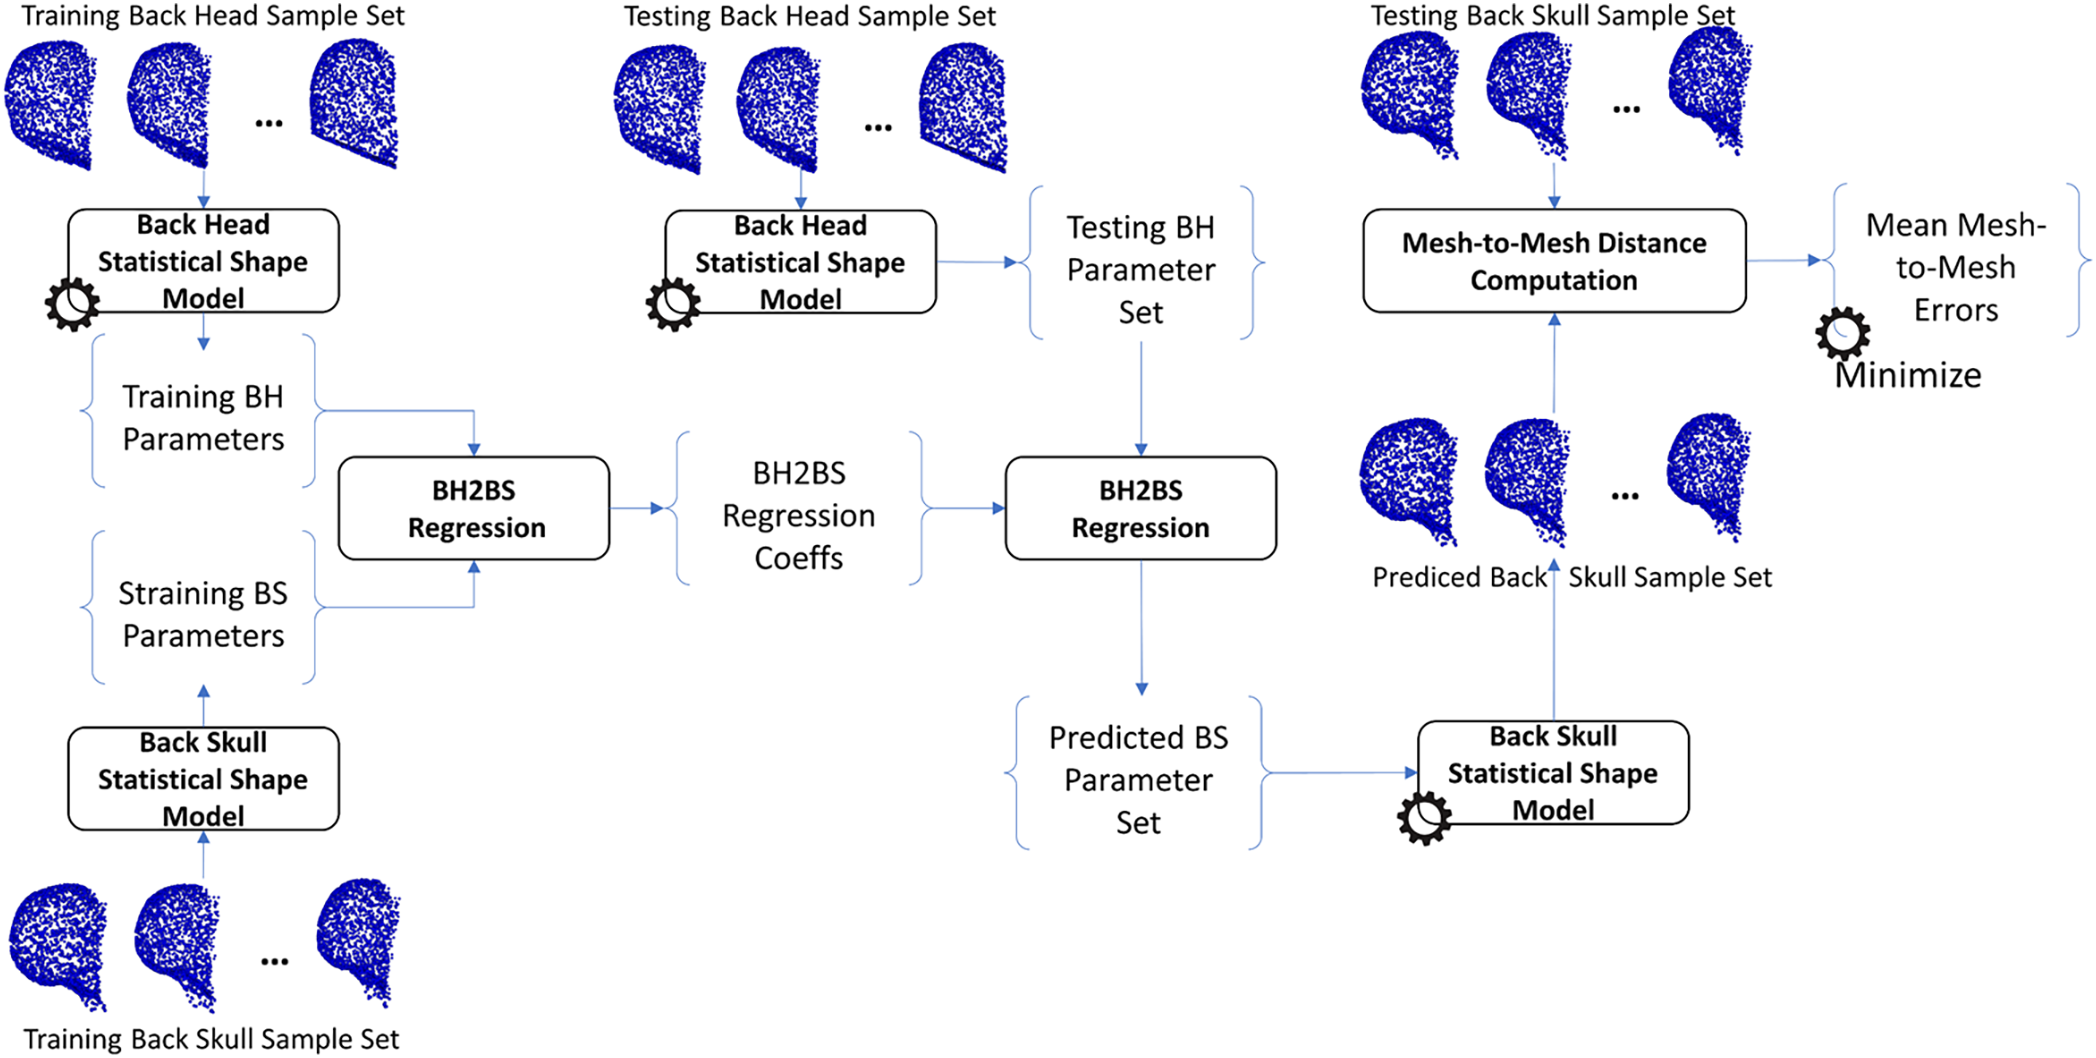
Figure 7: Training and predicting the back-head to back-skull shape (BH2BS) relation
2.4 Face-Head-to-Full-Skull Prediction
The first strategy of the FH2S shape prediction was based on the scaling technique. In particular, as illustrated in Fig. 8, we employed a template head mesh to deform to the target face mesh using the 3-D affine transform. The used templated head mesh was from the 3-D generic head mesh of the FLAME head model [36]. The Singular Value Decomposition (SVD) registration method [38] was first used to register the template head mesh to the coordinate system of the target face mesh based on the feature points defined in them. The nearest points from the face vertices of the registered head mesh to the target face meshes were also estimated using the K-Nearest Point search algorithm [39]. The 3-D affine transformation from the face vertices of the registered head mesh to their nearest points on the target face mesh was computed using the Coherent Point Drift affine transform estimator [40]. The computed affine transform was applied to the registered template head mesh. In the full-head forming step, the back-head vertices of the transformed head mesh were coupled with the target face mesh to form the predicted full-head mesh. Using the H2S prediction procedure, as illustrated in Fig. 3, the full-skull shape can be predicted from the predicted full-head mesh.
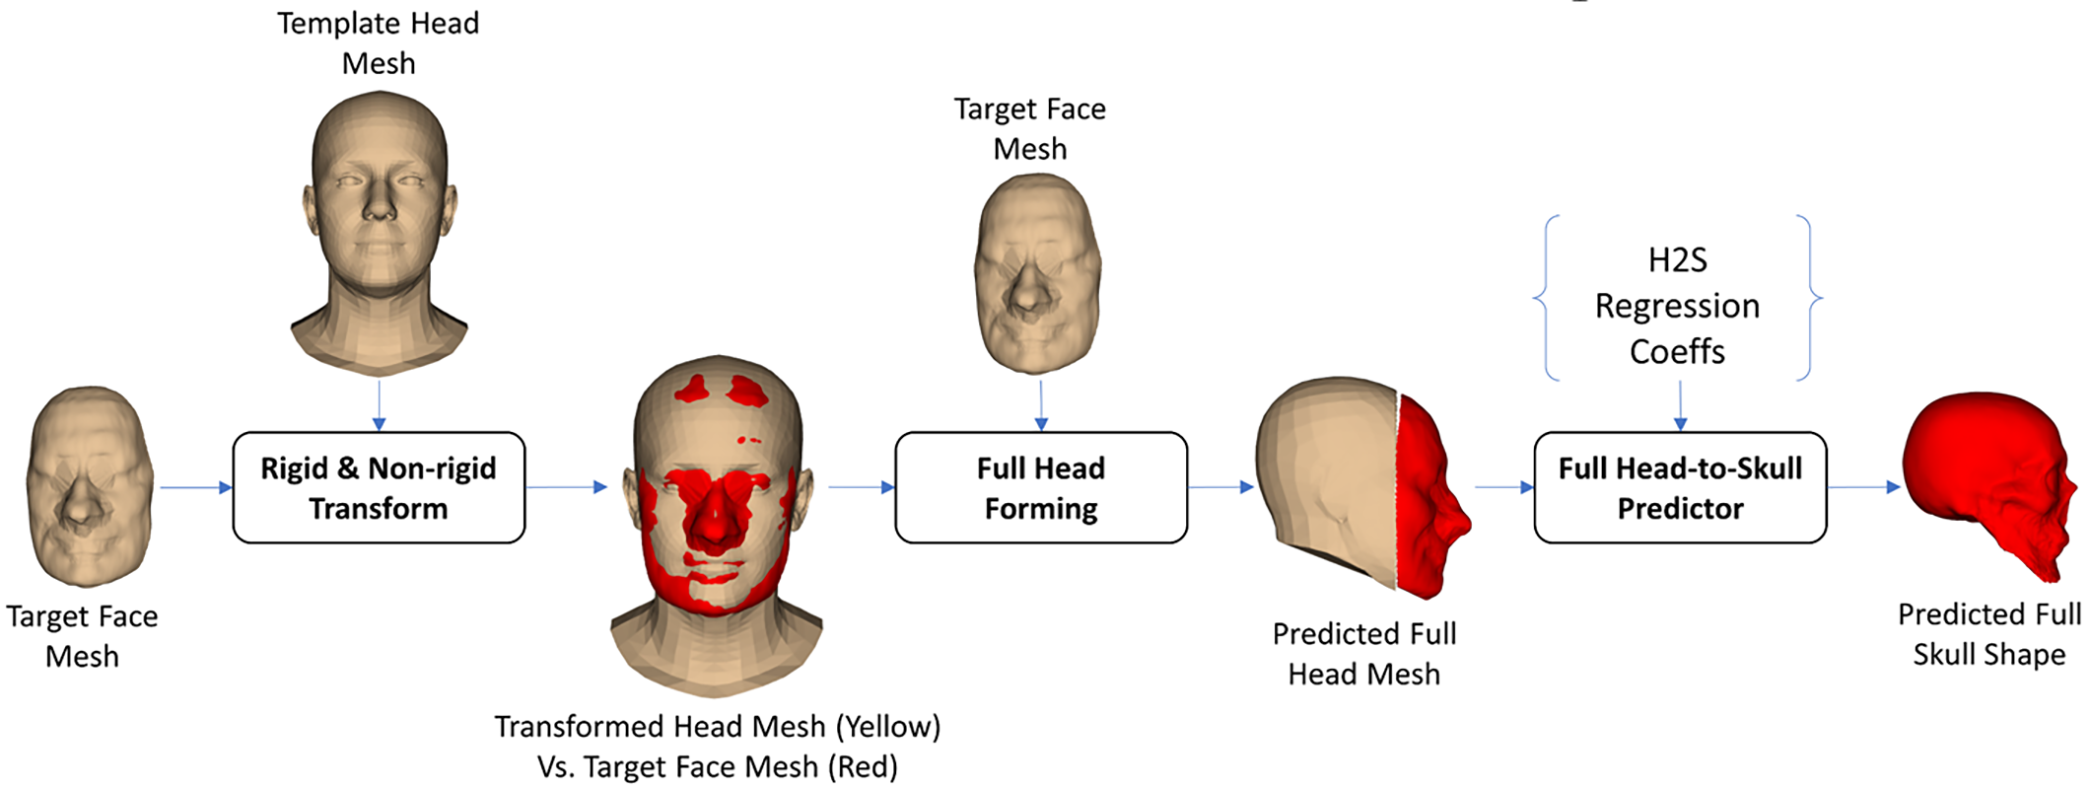
Figure 8: Scaling-based face-head-to-full-skull shape prediction
2.4.2 FLAME Optimization-Based
The FLAME optimization-based FH2S shape prediction procedure is illustrated in Fig. 9. In particular, we utilized a head SSM called the FLAME head model [36]. This model can generate shape variations of the head by controlling the translation, pose, expression, and shape parameters [36]. These parameters were optimized so that the distances between the face vertices of the FLAME head mesh and the vertices of the target face mesh were minimized. In the full head forming step, the target face mesh was combined with the back-head vertex of the deformed FLAME head mesh to form the predicted full head mesh. The H2S prediction, as illustrated in Fig. 3, was employed to predict the full-skull shape from the predicted full-head shape.
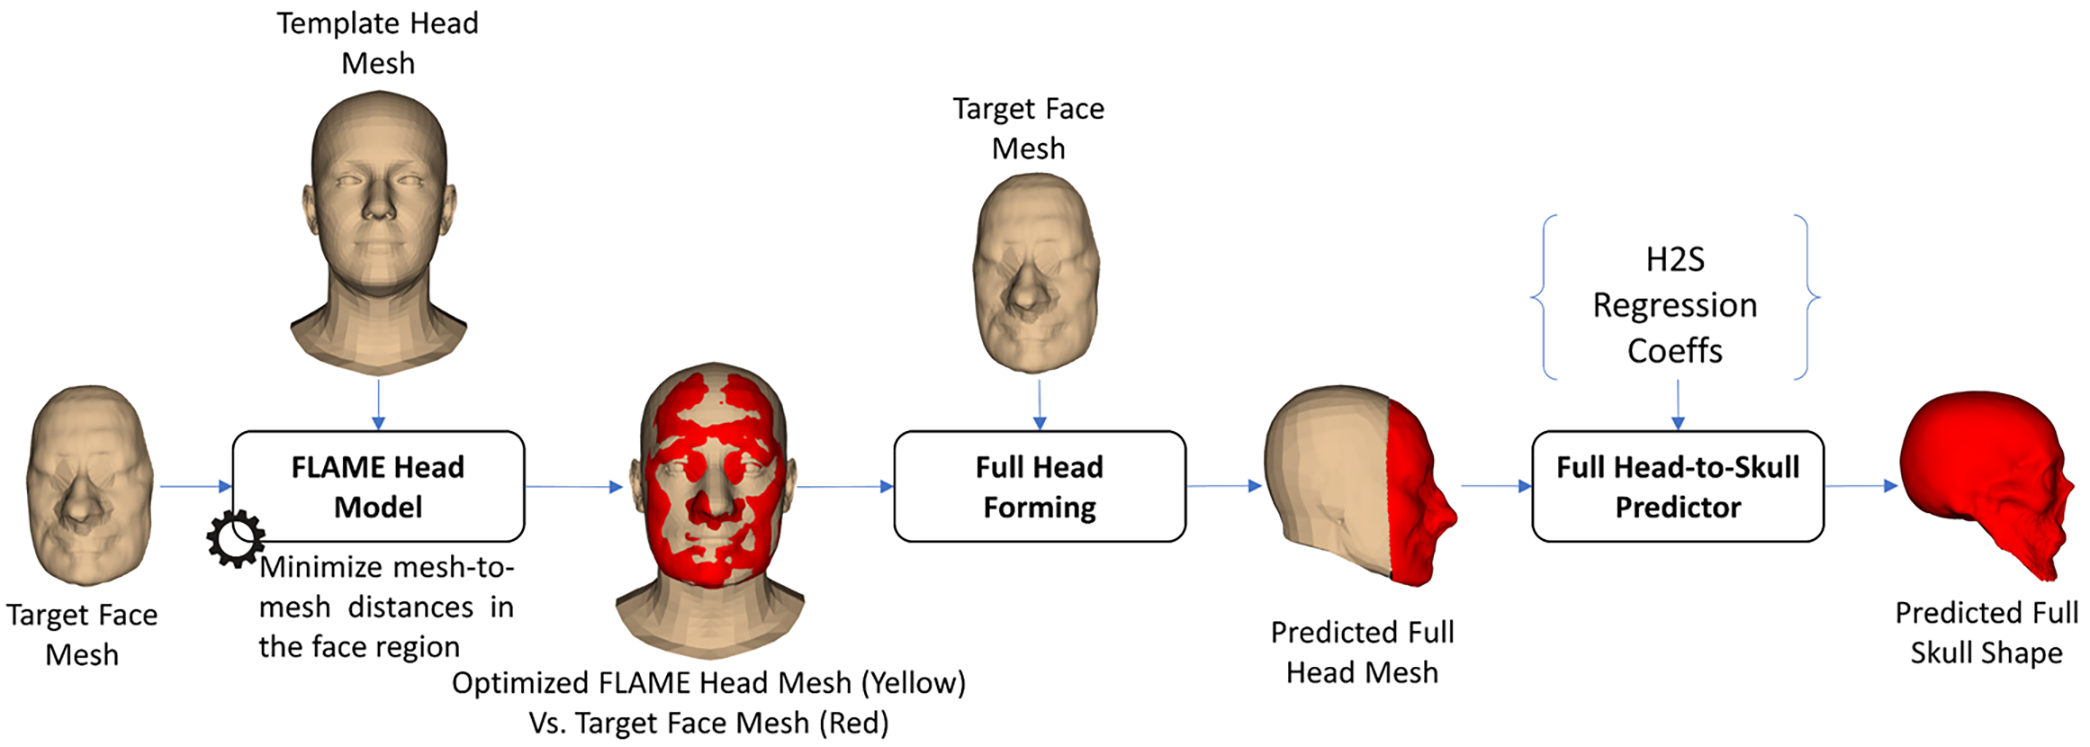
Figure 9: The FLAME-optimization-based face-head-to-full-skull shape prediction
In the FH2BH-based FH2S prediction strategy, as shown in Fig. 10, we first parameterized the target face mesh using the FH SSM. The FH parameters were then regressed to the BH parameters using the FH2BH linear regression model. The predicted back-head shape was reconstructed from the regressed BH parameters using the BH SSM. In the full-head forming step, the predicted back-head shape was combined with the target face-head mesh to form the predicted full-head mesh. This predicted full-head mesh was then input into the H2S shape prediction procedure, as shown in Fig. 3, to yield the predicted skull shape.

Figure 10: FH2BH-based face-head-to-full-skull shape prediction
In the FS2BS-based FH2S prediction strategy, as shown in Fig. 11, we employed the FS2BS relation to form the full-skull shape, having only the face-head shape. In particular, after parameterizing the target face-head mesh using the FH SSM, the FS parameters were regressed from the FH parameters. The regressed FS parameters were used for reconstructing the FS shape. The predicted FS shape was then parameterized using the FS SSM to get the FS parameters supporting the BS prediction. Using the FS2BS regression model, the BS parameters could be predicted from the regressed BS parameters. The predicted BS shape from the regressed BS parameters was combined with the predicted FS shape to form the predicted full-skull shape.
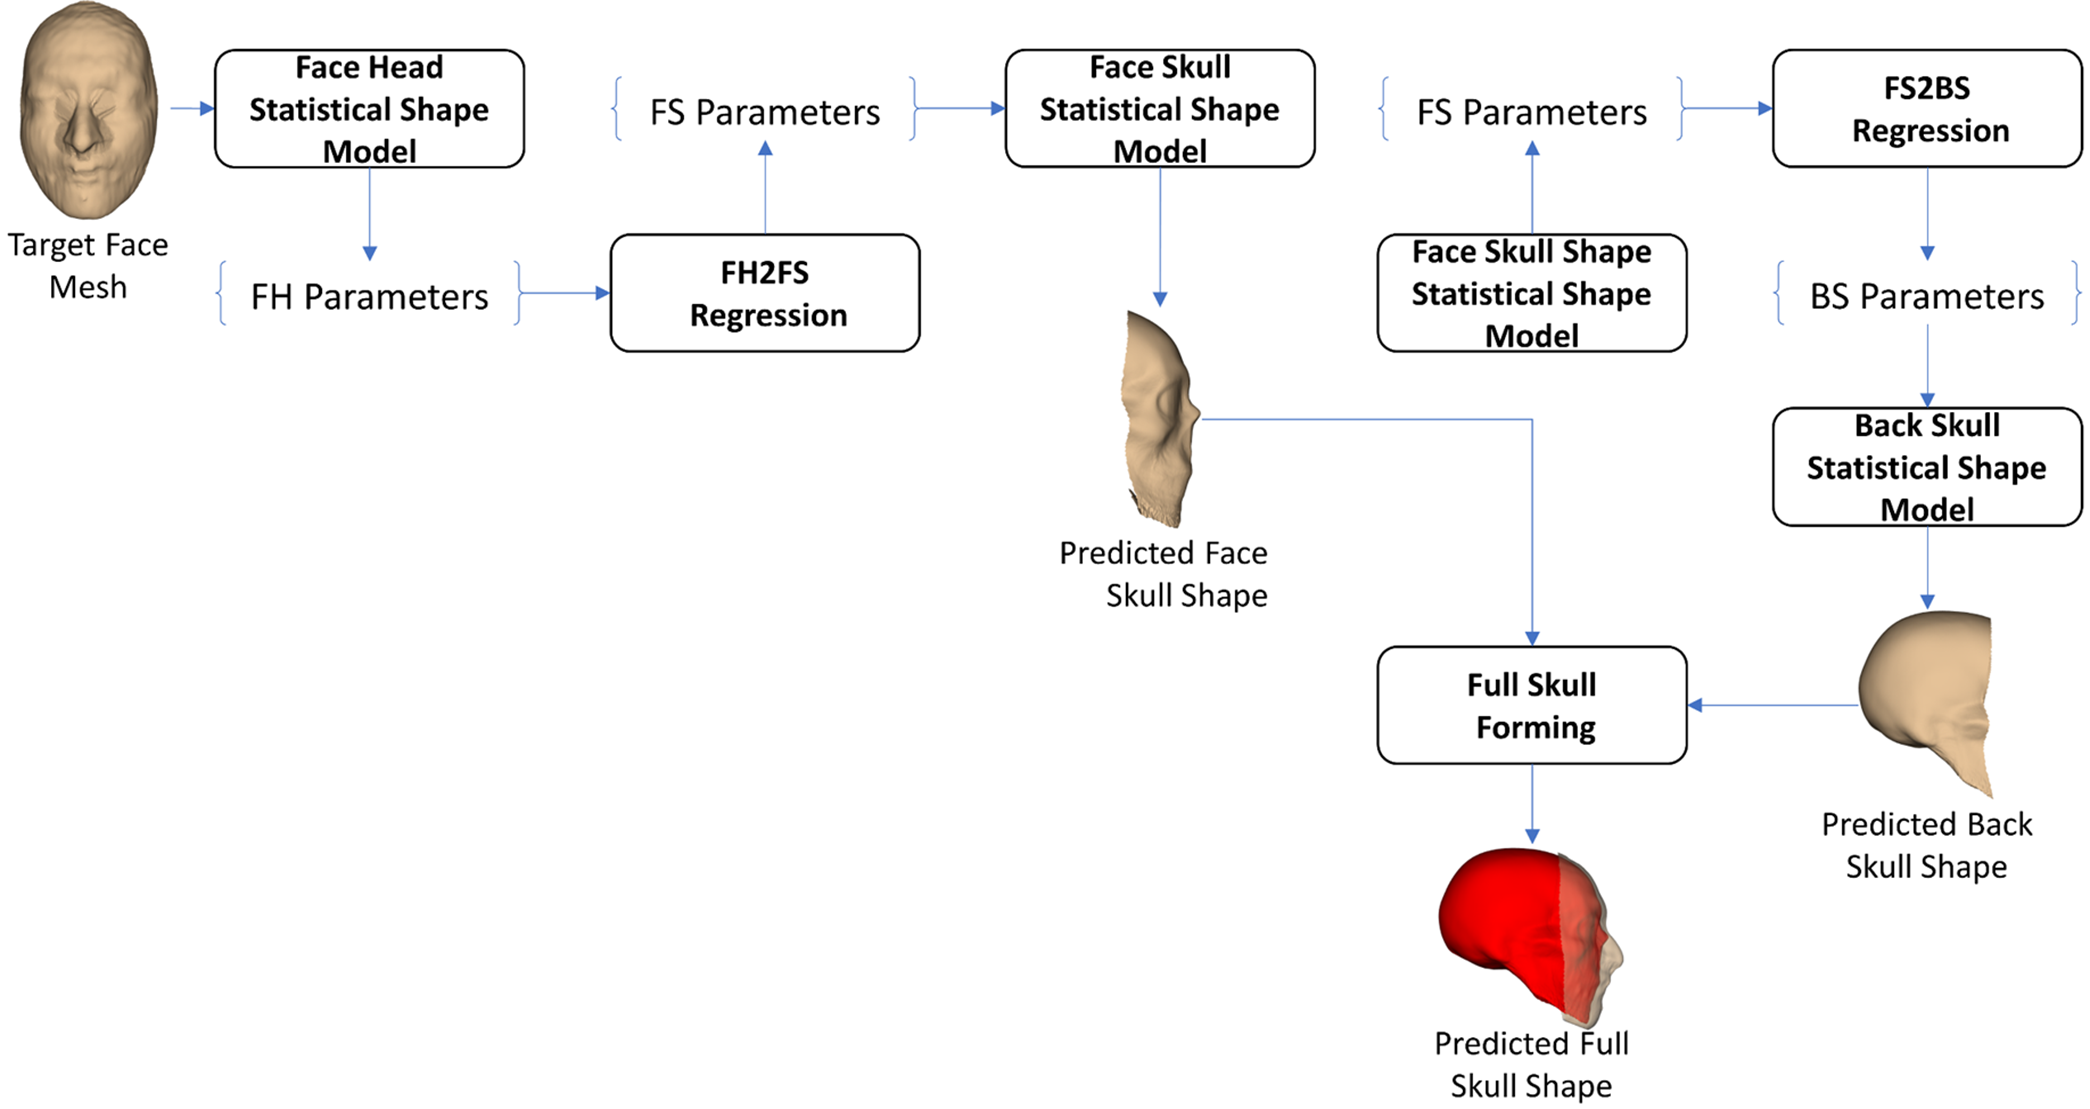
Figure 11: FS2BS-based face-head-to-full-skull shape prediction
2.4.5 FH2BH & FS2BS & BH2BS-Based
To test the enhancement of the application of FH2BH prediction to the ROI-based H2S prediction that was developed in our previous study [25], as shown in Fig. 12, we applied the FH2BH prediction procedure, as shown in Fig. 4, to predict the BH shape from the FH shape. Moreover, the FH2FS prediction procedure, as shown in Fig. 6, was also used for predicting the FS shape from the FH shape. The predicted BH shape was then used for predicting the BS shape based on the BH2BS prediction procedure, as shown in Fig. 7. In the full-skull forming step, the predicted FS shape was combined with the predicted BS shape to form the predicted full-skull shape.
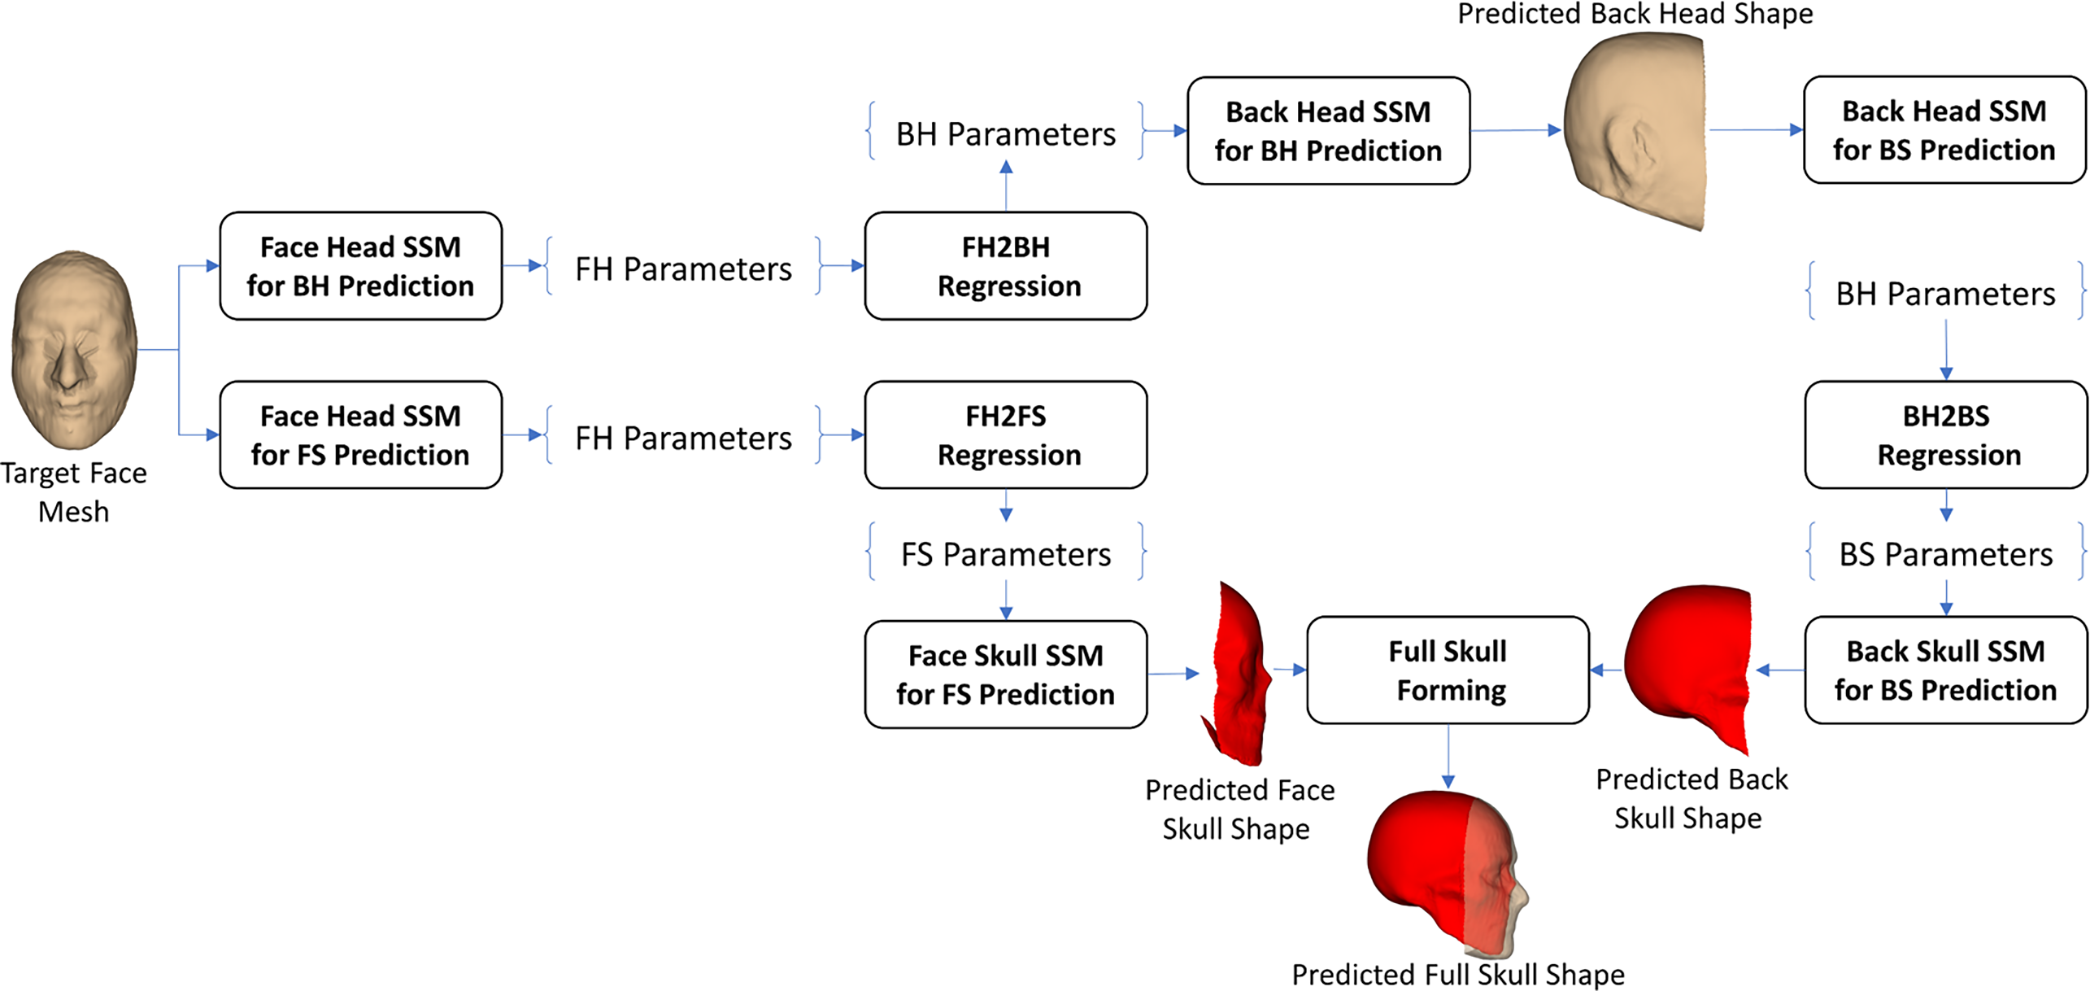
Figure 12: The FH2BH & FS2BS & BH2BS-based face-head-to-full-skull shape prediction
2.4.6 Skull Mesh Generation from Skull Shapes
In this study, we employed the cage-based deformation concept to generate the skull mesh from the skull shape. This concept was also utilized in our previous studies [21,25], but in this study, we have some enhancements. Overall, a template skull mesh, which was designed by computer-aided design (CAD) software, was deformed so that its shape optimally fit with the target skull shape. The detailed steps are illustrated in Fig. 13. In particular, a template skull mesh was rigidly transformed into the target skull shape. The transformation was estimated using the SVD registration method [38] based on the feature points predefined in the template skull mesh and the target skull shape. The rigid transformed skull mesh was then deformed to the target skull shape based on the affine transform. The affine transformation was estimated using the coherent point drift (CPD) algorithm [40] so that the covering box of the registered skull mesh was optimally fitted with the covering box of the target skull shape. The affine-transformed skull mesh was used for estimating the affine-transformed skull shape. The process of estimating the skull shape from the skull mesh was presented in our previous study [21]. The full sampling rays were then used to sample the estimated skull shapes to get the affine-transformed skull features. The affine-transformed skull cage was formed from the affine-transformed skull features and the pre-defined facet structure of the full-sampling mesh. In this study, we employed the cage-based deformation method [41] coupled with mean weight coordinates [42] for parameterizing the shape of the affine-transformed skull mesh. With the computed mean weight coefficients, the shape of the affine-transformed skull mesh can be controlled by the vertex positions of the affine-transformed skull cage. Because the vertex indices of the target skull shape and those of the affine-transformed skull cage were similar to each other, we can set the vertex positions of the target skull shape as the new positions of the affine-transformed skull cage’s vertices to deform the affine-transformed skull mesh. The deformed skull mesh would have a shape that perfectly fits the target skull shape.
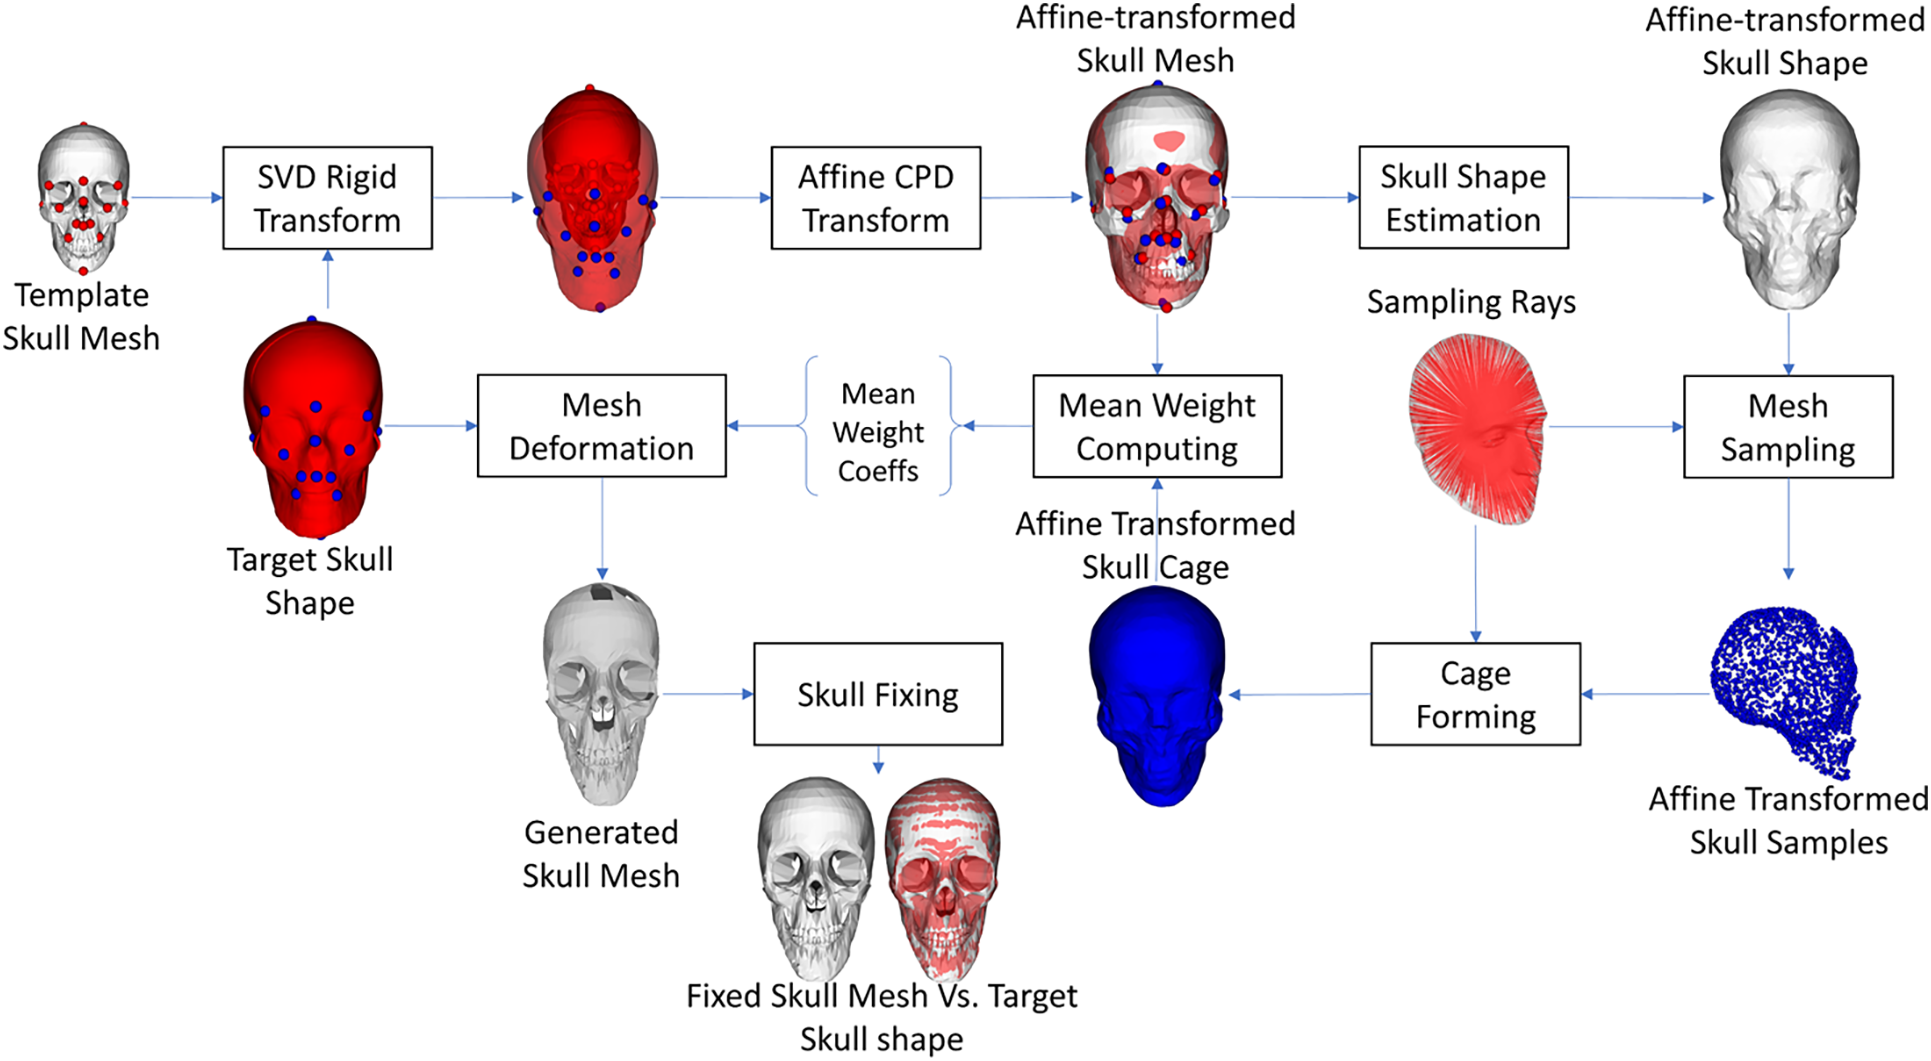
Figure 13: The skull mesh generation from the skull shape
It is important to note that, because the cage-based deformation algorithm [41] just affects the vertices inside the cage, some vertices outside or on the cage are unpredictable during the cage’s motion. Consequently, we investigated a skull mesh fixing algorithm to estimate the missing vertices after the cage-based deformation. In particular, for each missing vertex having the NaN (Not a Number) value, we found its three nearest vertices on the affine-transformed skull cage and its index on the affine-transformed skull mesh. The estimated skull index was used to select a vertex on the affine-transformed skull mesh. The barycentric coordinates of the vertex and the estimated three nearest vertices on the affine-transformed skull cage were computed. Because the estimated three nearest vertices on the affine-transformed skull cage had the same vertex indices as those on the target skull shape. These indices were used to get the three nearest vertices on the target skull shape. The estimated vertices were used for computing the missing vertex on the generated skull mesh based on the computed barycentric coordinates.
In this study, a ten-fold cross-validation procedure was conducted to select the optimal number of PCA components for training the H2S, FH2FS, BH2BS, FH2BH, and FS2BS relations. Moreover, this procedure was also used for selecting the optimal face-head-to-full-skull prediction strategy. In particular, the dataset of 329 subjects was divided into the training and testing datasets. The training dataset was composed of 80% of the subjects (263 subjects). The testing dataset was composed of 20% of the subjects (65 subjects). The training and testing datasets were kept the same for training and testing all shape relations. For each cross-validation fold and each shape relation, we trained and tested with the number of components increasing from 1 to 100. The grand mean errors of the mesh-to-mesh distances between the predicted skull shapes and the CT-based skull shapes were computed on the testing dataset after ten-fold testing to evaluate the accuracy. The optimal number of PCA components was selected when having the minimum grand mean of mesh-to-mesh distances. Based on the optimal shape relationship models, the four strategies of the FH2S prediction were trained. After ten-fold training and testing with cross-validated training and testing datasets, the optimal prediction strategy was selected so that it had the minimum testing errors on the testing datasets. The testing errors were computed based on the mesh-to-mesh distances between the predicted skull shapes and the CT-based skull shapes. With the optimal FH2S prediction strategy, we also generated the skull meshes for the testing dataset for each time of cross-validation. The generated skull meshes were compared with the CT-reconstructed skull meshes to evaluate the FH2S accuracy.
Note that, in this study, the mesh-to-mesh distance between the surface mesh
in which,
To evaluate prediction errors in various regions of the skull shape, distance-based color maps were also formed on the predicted skull shapes and skull meshes for the best and worst predicted cases. Moreover, as shown in Fig. 14, we also divided skull shape into several anatomical regions: back skull shape, face skull shape, frontal skull shape, eye skull shape, nose skull shape, mouth skull shape, mental skull shape, and maxilla skull shape. The skull shape division was followed by the standard skull anatomical structures. Based on facial muscle anatomy, we also defined muscle attachment regions on the skull shape to evaluate prediction errors in these regions. In the pre-defined regions, we computed mesh-to-mesh distances with the number of samples of 100,000 points.
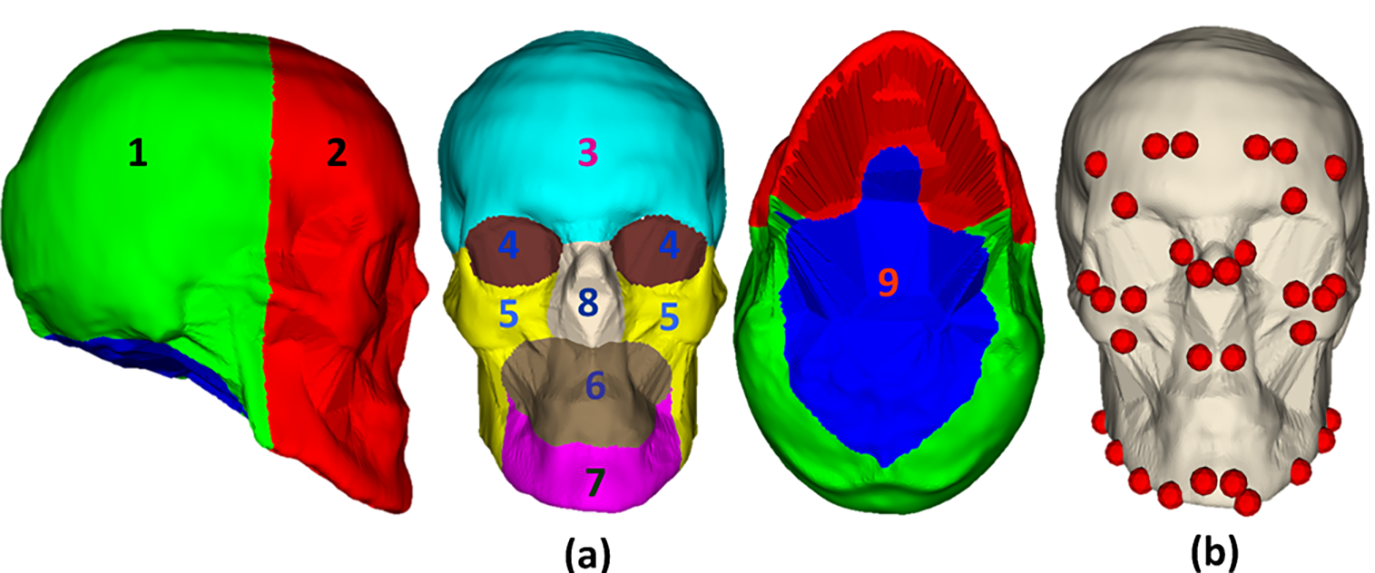
Figure 14: Skull shape region division for evaluating prediction errors in various skull shape regions: (a1) back skull shape, (a2) face skull shape, (a3) frontal skull shape, (a4) eye skull shape, (a5) maxilla skull shape, (a6) mouth skull shape, (a7) mental skull shape, (a8) nose skull shape, (a9) bottom skull shape, and (b) muscle attachment regions
The mesh-to-mesh distances between the predicted skull shapes (or meshes) and the ground truth skull shapes (or meshes) were also analyzed in several anatomical regions by distance color maps. Moreover, the best and worst predicted skull meshes were also plotted in the same coordinate system as the CT-reconstructed skull meshes to compare the structural similarities. To deal with the missing structures of the CT-based skull meshes, we also calculated cranial linear measurements for the predicted skull meshes and the CT-reconstructed skull meshes for the best and worst predicted cases.
Fig. 15 shows the cross-validated results for selecting the optimal number of components of the H2S, FH2BH, FH2FS, FS2BS, and BH2BS regression on the testing dataset after the ten-fold cross-validation. For the H2S regression, with the number of components of 54, the optimal grand mean error was 1.77 mm. For the FH2BH regression, the optimal number of components was 84 with a grand mean error of 1.54 mm. For the FH2FS regression, the optimal number of components was 33, with the optimal grand mean error of 1.53 mm. The optimal numbers of components were 90 and 43 for the FS2BS and BH2BS regression, respectively.
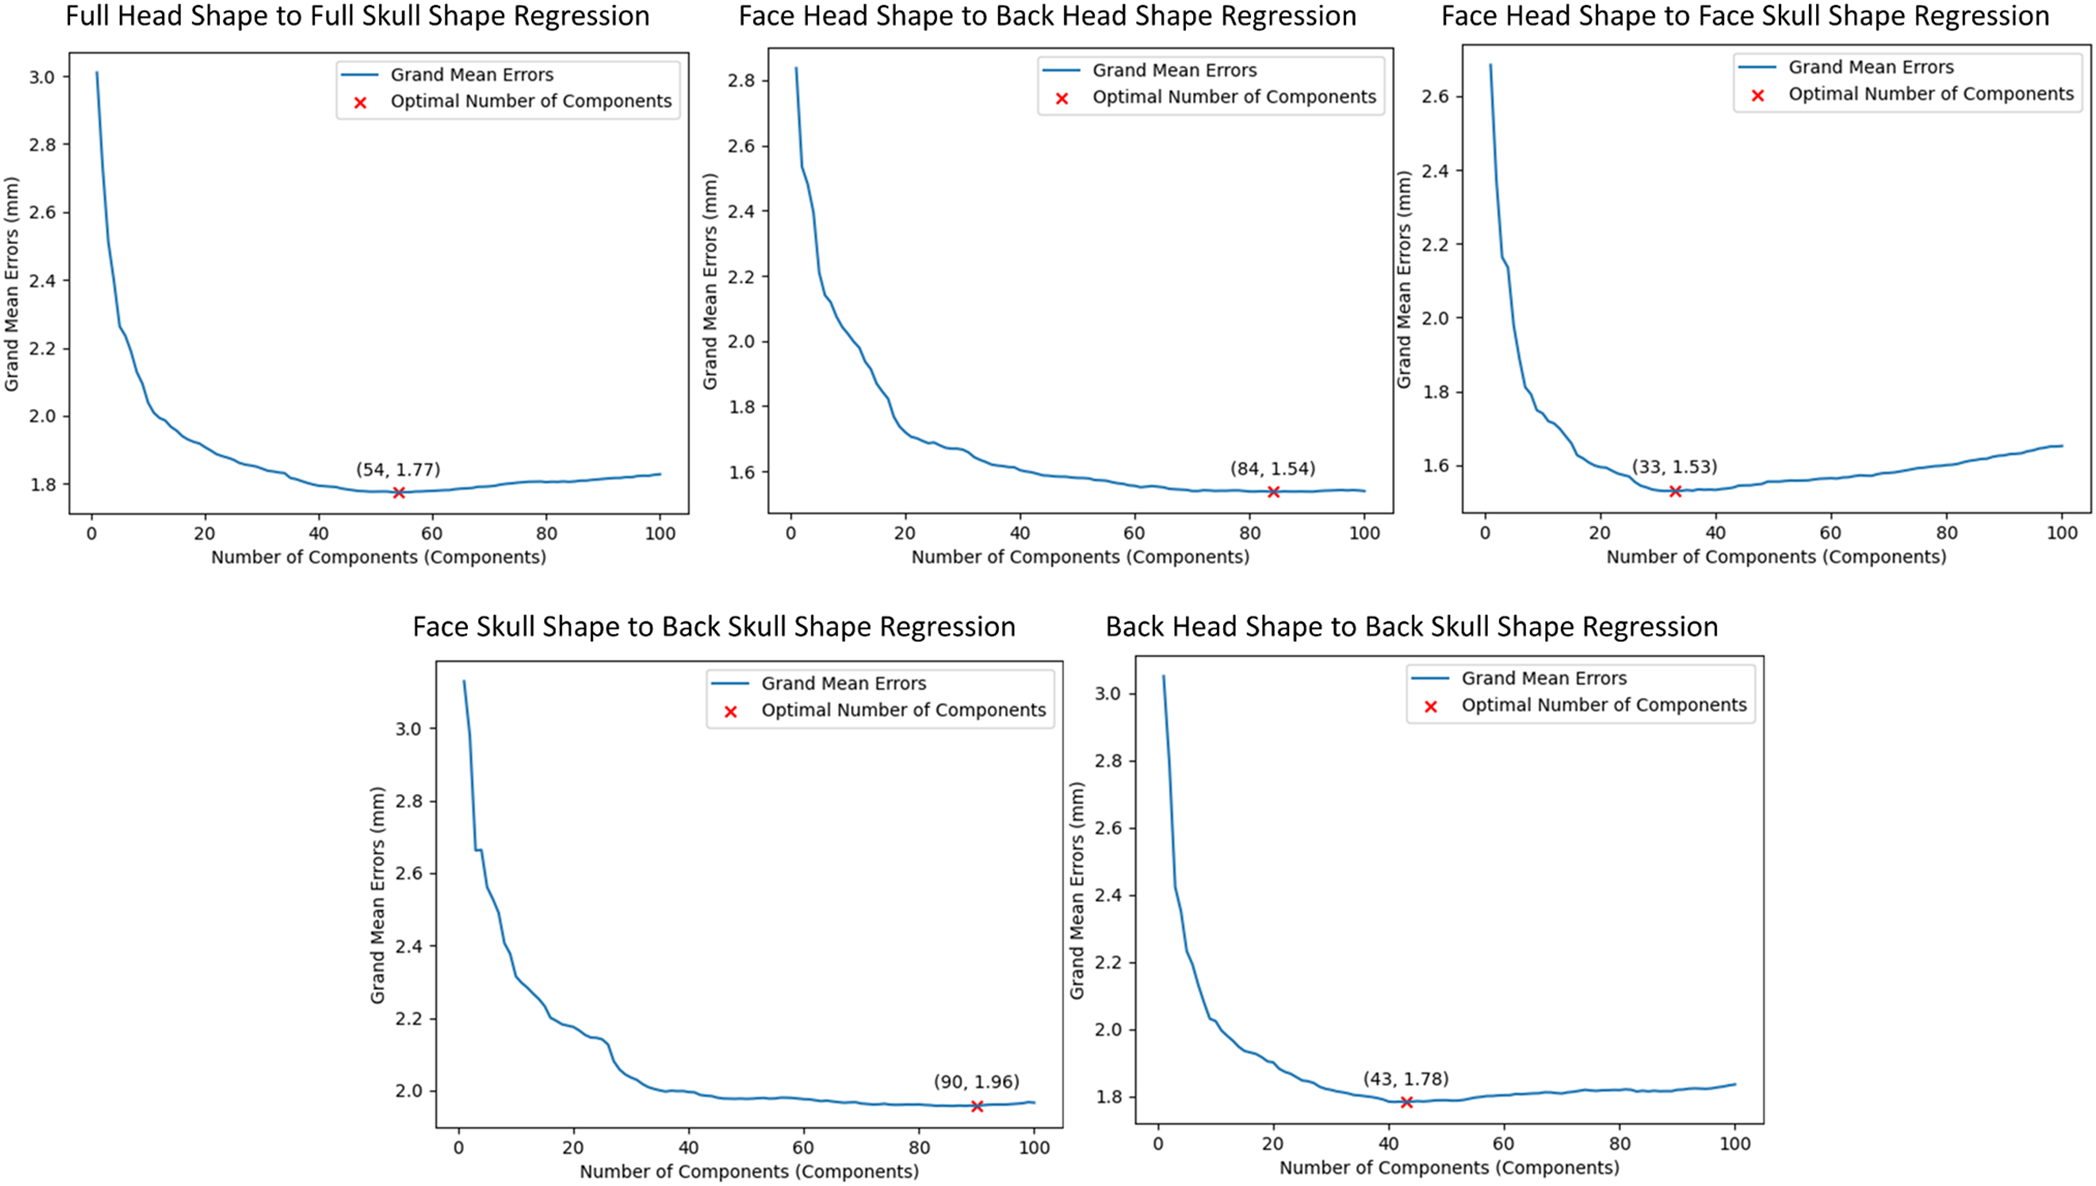
Figure 15: Cross-validation results for selecting the optimal number of components for head-to-skull shape relations in various ROIs
Fig. 16 shows the mean mesh-to-mesh distance errors between the predicted skull shapes and the CT-based skull shapes using the five different face-head-to-full-skull prediction strategies. Using the scaling-based strategy, the distance errors (Mean ± SD) were 5.84 ± 1.62 mm. Using the FLAME optimization-based prediction strategy, these errors were 3.61 ± 0.78 mm. Using the FS2BS relation, these errors were reduced up to 1.99 ± 0.37 mm. Moreover, by applying the FH2BH relationship, the skull prediction errors continued to reduce up to 1.94 ± 0.37 mm. By using the procedure of predicting the face-skull shape based on the face-head shape, predicting the back-head shape from the face-head shape, and predicting the back-skull shape from the predicted back-head shape, the errors could be reduced even more to reach 1.93 ± 0.36 mm. It is also important to note that the standard deviation of the distance errors could be reduced when the FH2BH relation was applied. Consequently, the accuracy of the FH2S prediction was the best when applying the FH2BH relation. This accuracy can be even better when using the ROI-based prediction strategy, as concluded in our previous study [25].
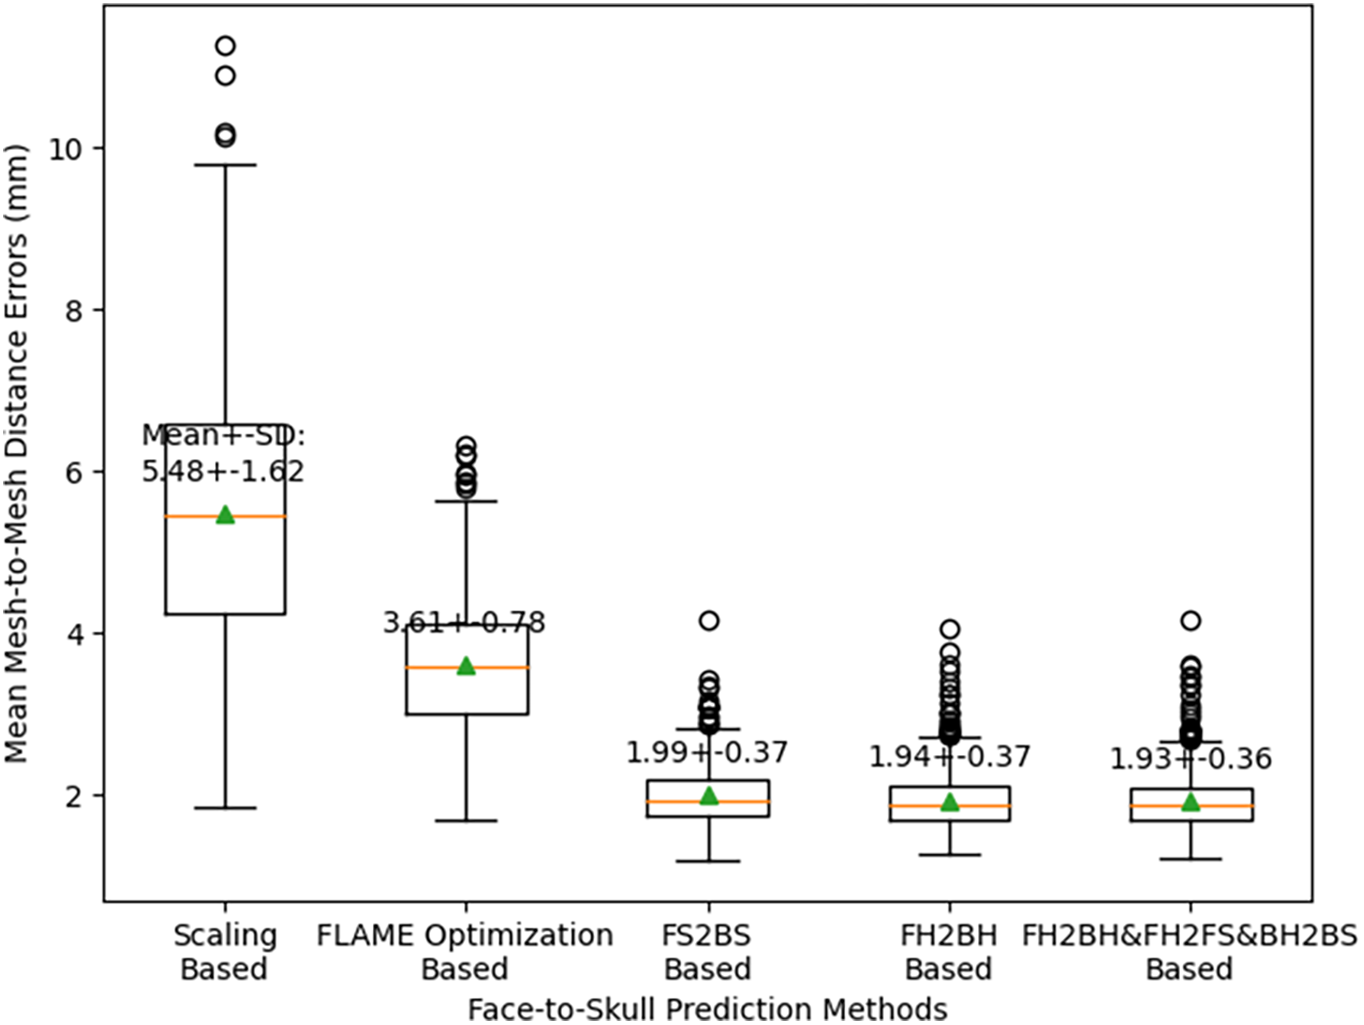
Figure 16: Cross-validation results for selecting the optimal face-to-skull shape prediction strategy
We employed the optimal FH2S prediction strategy to predict the skull meshes on the testing datasets after the ten-fold cross-validation. As shown in Fig. 17, the mean mesh-to-mesh distances between the generated skull meshes and the CT-reconstructed skull meshes were 2.65 ± 0.36 mm, and the median mesh-to-mesh distances were 1.92 ± 0.27 mm.
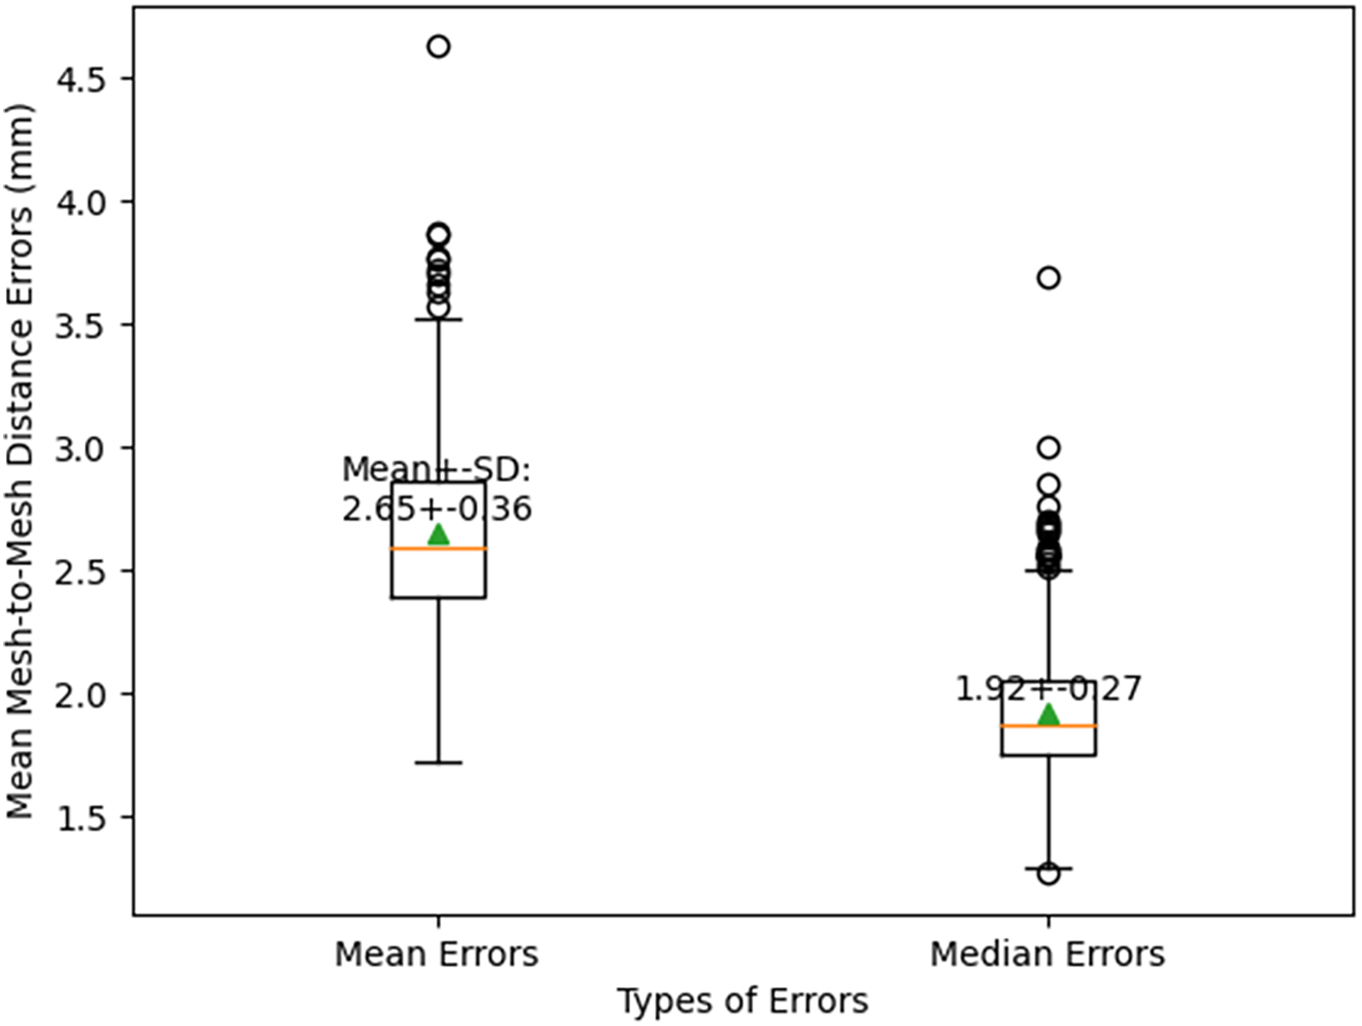
Figure 17: The optimal face-to-skull mesh prediction errors
The best and worst predicted cases for the skull shape and skull mesh predictions were illustrated in Figs. 17 and 18. Regarding the skull shape prediction, as shown in Fig. 18, the best-predicted case has mesh-to-mesh errors of 1.29 ± 1.12 mm, and the worst-predicted case has mesh-to-mesh errors of 1.84 ± 1.37 mm. The deviation between the mean error of the best and that of the worst-predicted cases was only 0.55 mm. Based on the color distance map in Fig. 18, most errors are focused on the mandible region of the skull in the best and worst cases. In the worst-predicted case, most errors are focused on the back region of the skull. Regarding the skull mesh prediction, as shown in Fig. 19, the best-predicted case has mesh-to-mesh errors of 1.72 ± 1.45 mm, and the worst-predicted case has mesh-to-mesh errors of 3.68 ± 2.63 mm. Based on the distance color map, most errors are mainly distributed on the mandible region of the skull structure for both the best and worst-predicted cases. Especially, in the worst-predicted case, some errors also largely appeared on the back and top skull regions. It is important to note that the errors of the skull mesh generation were higher than those of the skull shape generation due to the complex structures inside the skull mesh.
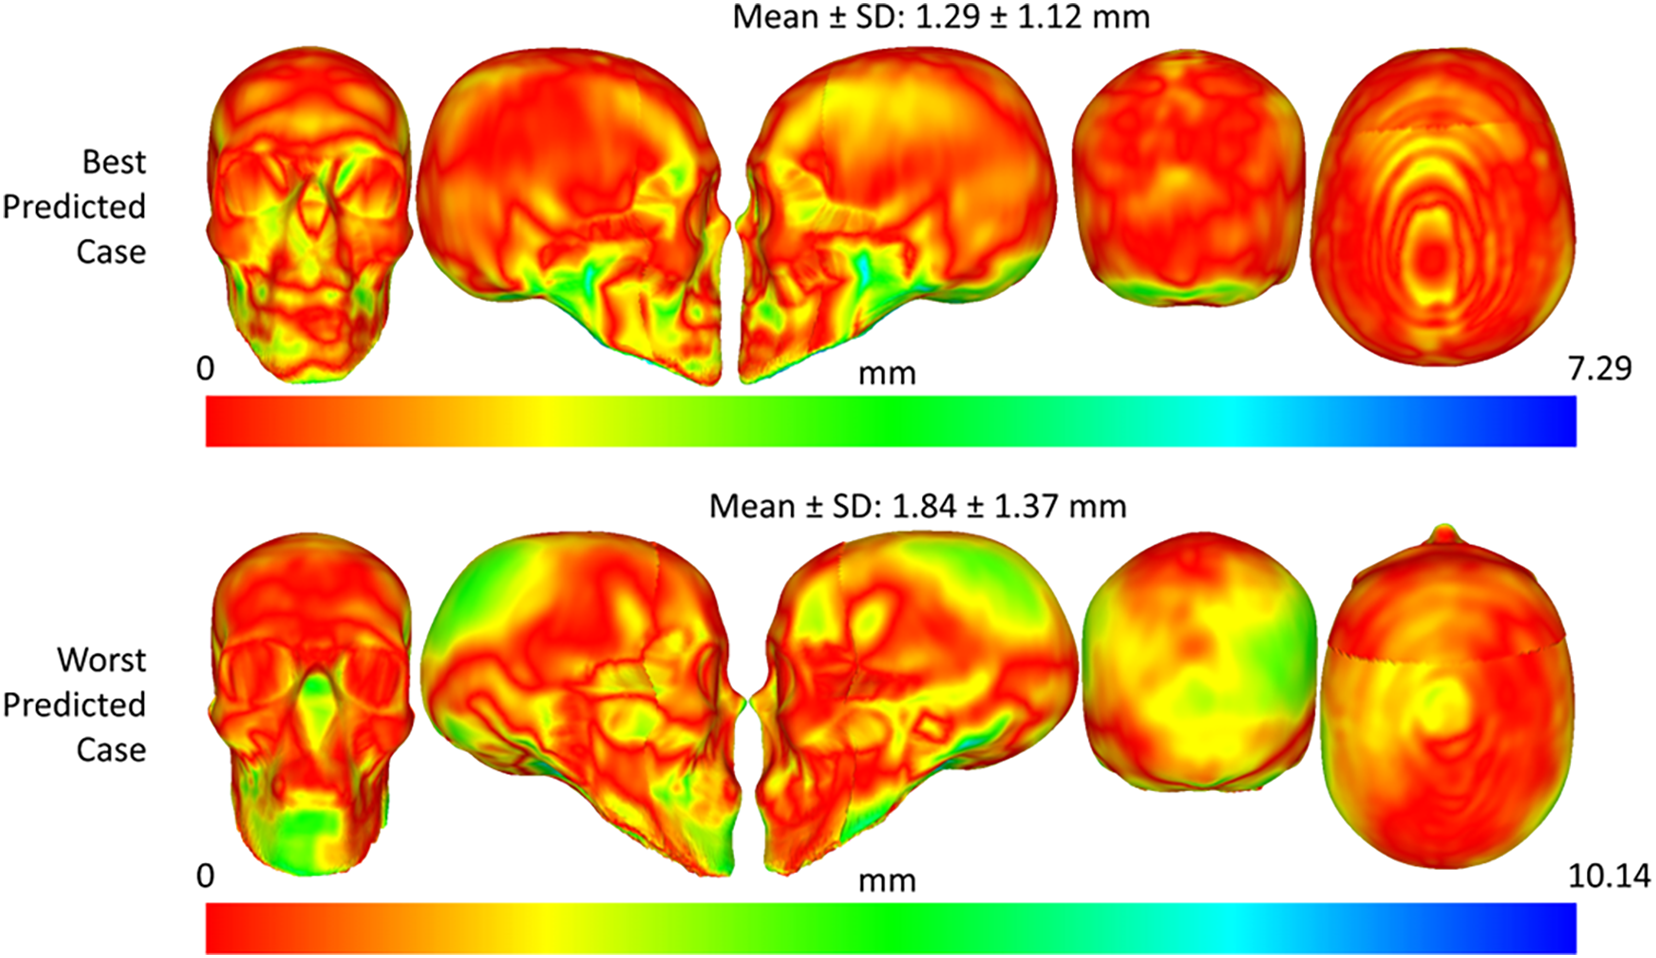
Figure 18: Best and worst predicted cases for face-to-skull shape prediction using the optimal prediction strategy
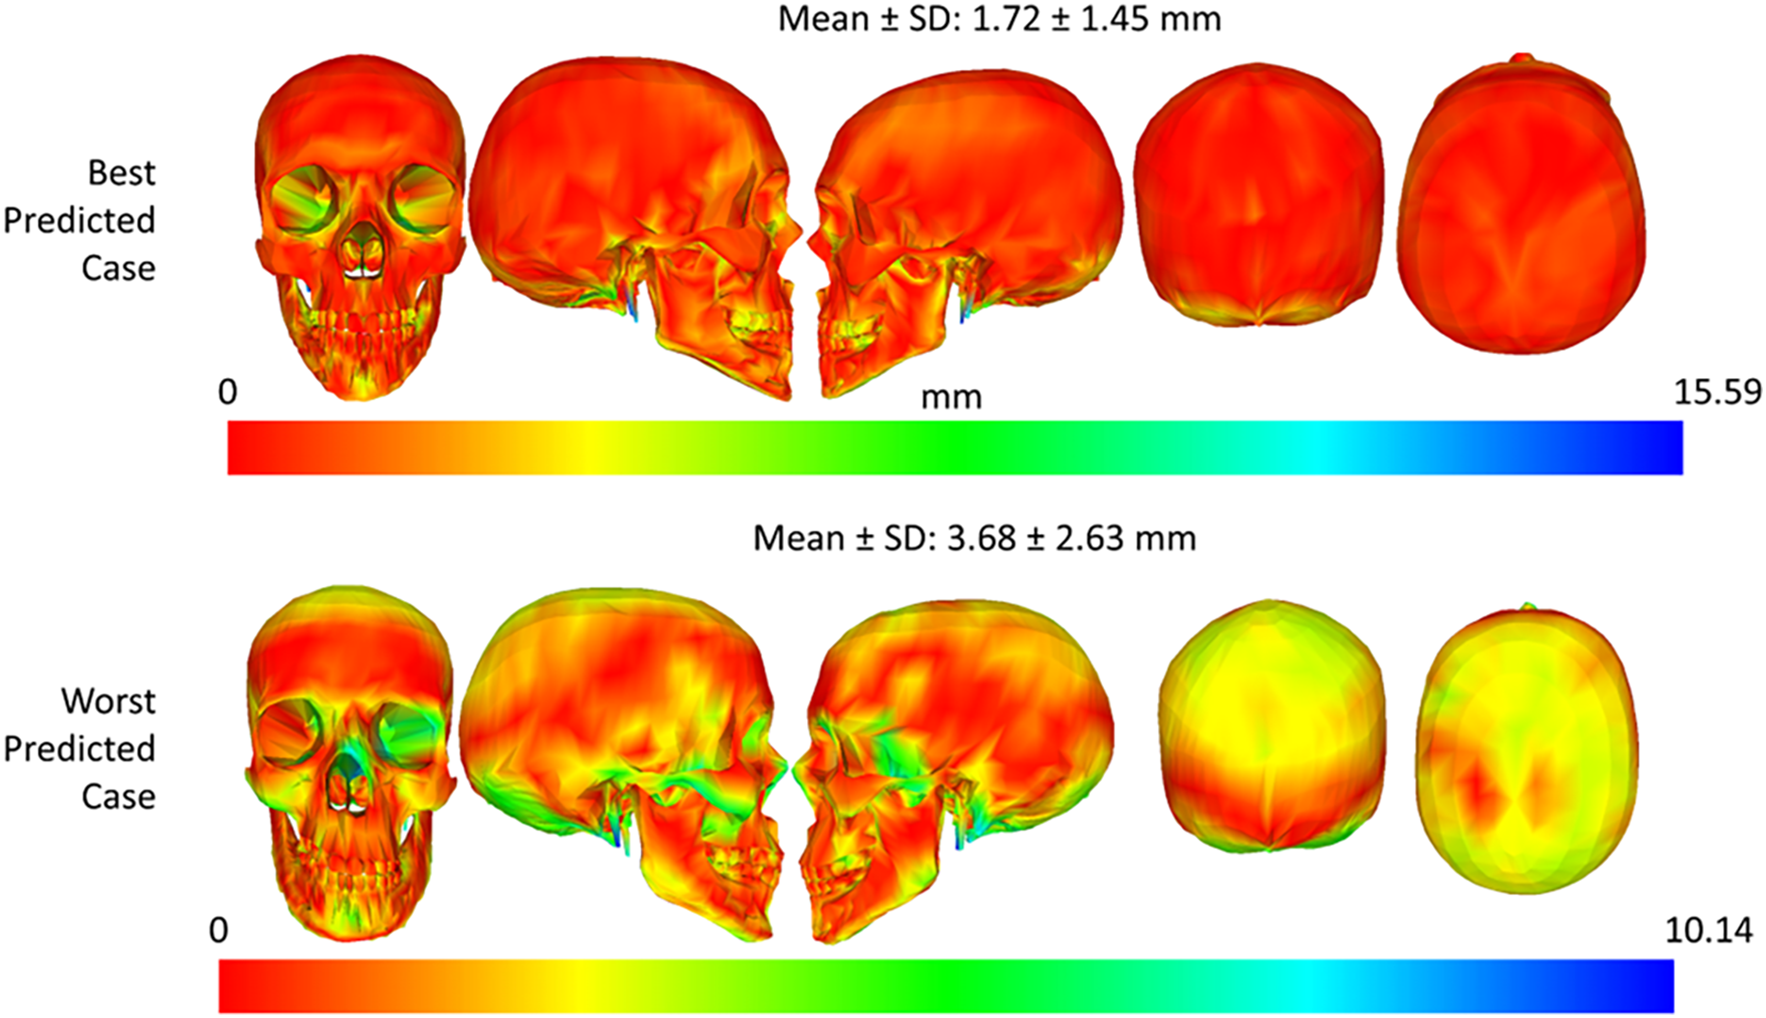
Figure 19: Best and worst predicted cases for face-to-skull mesh prediction using the optimal prediction strategy
Fig. 20 shows the structural correspondence between the predicted skull shapes and the appropriate CT-reconstructed skull meshes in the best and worst predicted cases. Note that in the best and worst predicted cases, the skull structures of the predicted skull meshes generally fit with the CT-reconstructed skull meshes. However, the structures of the mandible jaw do not fit very well, as shown in Fig. 20a–c. Based on this structural comparison, we can see that due to the missing structures in the CT-reconstructed skull meshes, the errors between the predicted skull meshes and the CT-derived skull meshes are large in the missing regions, as shown in Figs. 19 and 20. Moreover, the prediction errors in the occipital bone are large because of the low shape correlation between the head shape and skull shapes in this region.
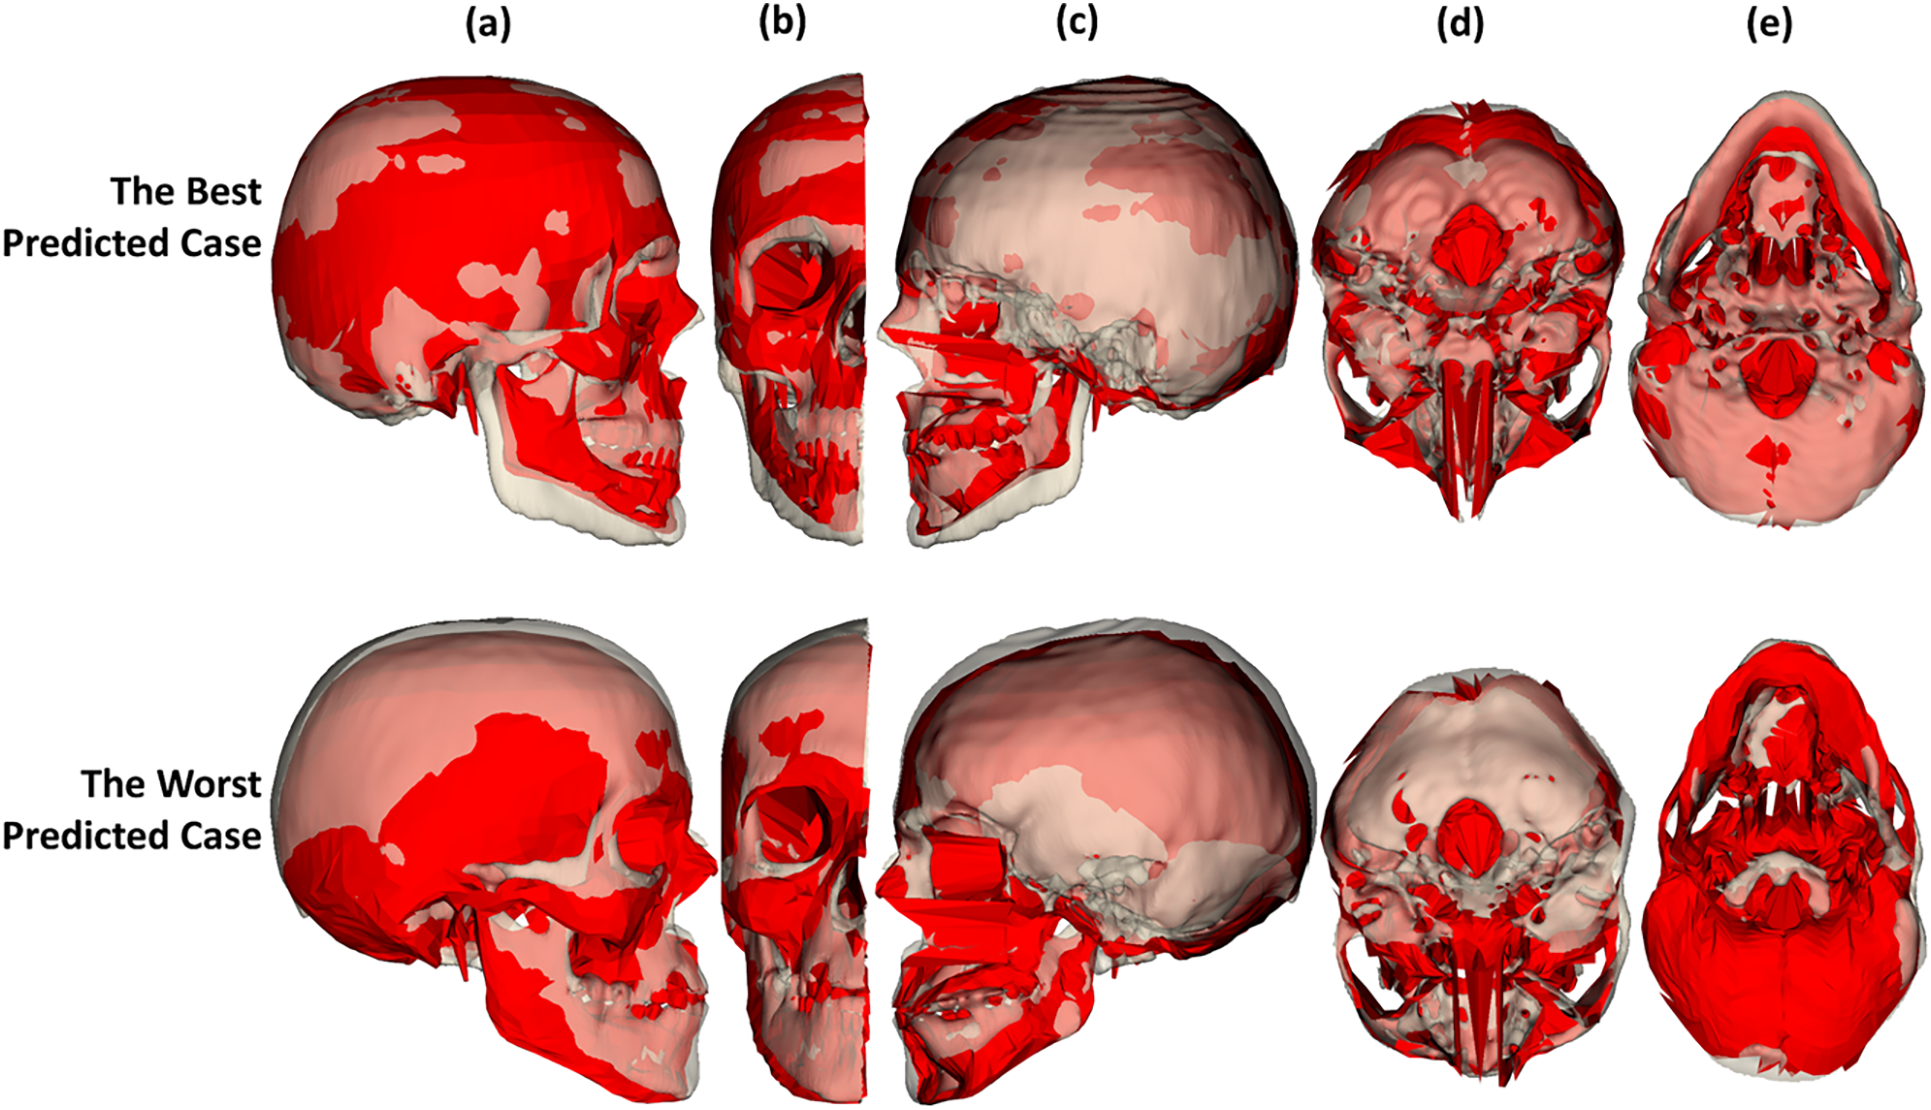
Figure 20: Structural correspondence between the predicted skull meshes and the CT-reconstructed skull meshes for the best and worst predicted cases in midsagittal (a–c) and mid-transverse (d,e) cuts
As shown in Figs. 18 and 19, error distributions in various skull regions are different. Table 1 presents the mean mesh-to-mesh distances computed on the testing data in various regions. Overall, the largest errors are in the bottom skull shape, with (Mean ± SD) of 3.5040 ± 1.5239 mm due to the low shape correlation between the head and skull in this region. The smallest errors are in the frontal skull with 0.9632 ± 0.2632 mm due to the strong correlation between the face and skull in this region. The errors in the back skull region are 1.7432 ± 0.5217 mm. The errors in facial regions are 1.3979 ± 0.3189 mm. These errors are acceptable in the application of CAD/CAM implant surgical guides [43]. The errors in the muscle attachment regions are 1.7671 ± 0.3829 mm. These values are acceptable for the application of facial mimic simulation with the variation of muscle insertion/attachment regions of 6 mm [44]. Because the errors in the bottom region of the skull were large, these errors contributed to the overall errors of the skull shape prediction up to 1.92 ± 0.27 mm.
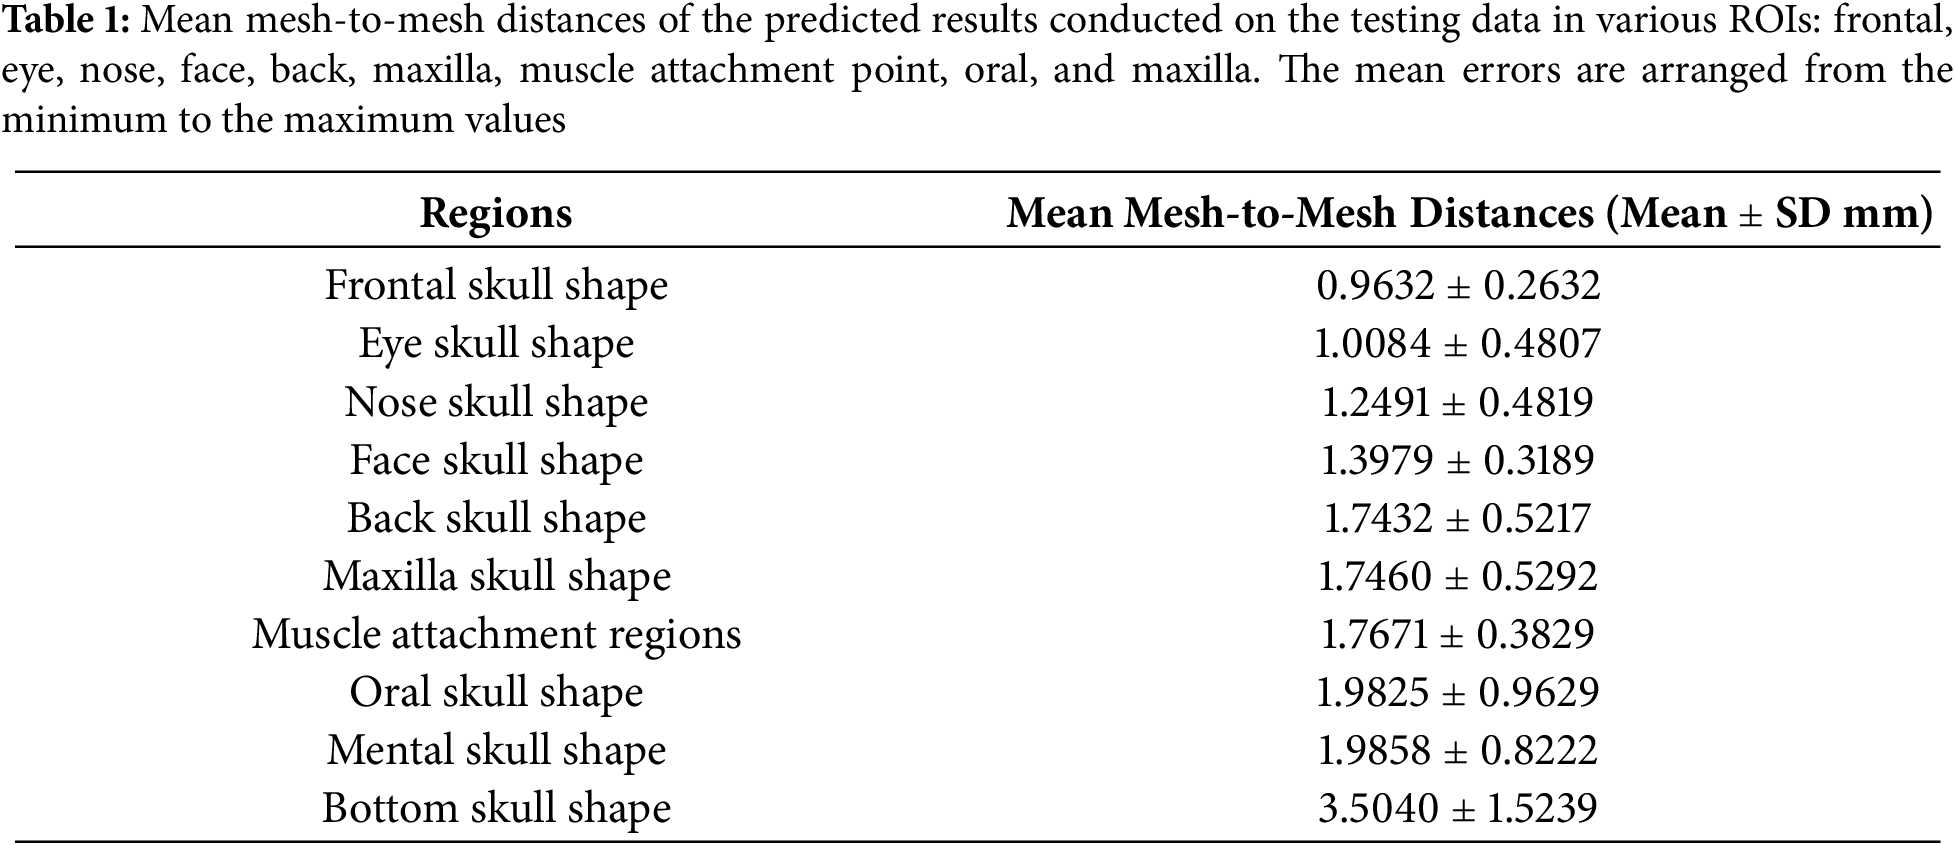
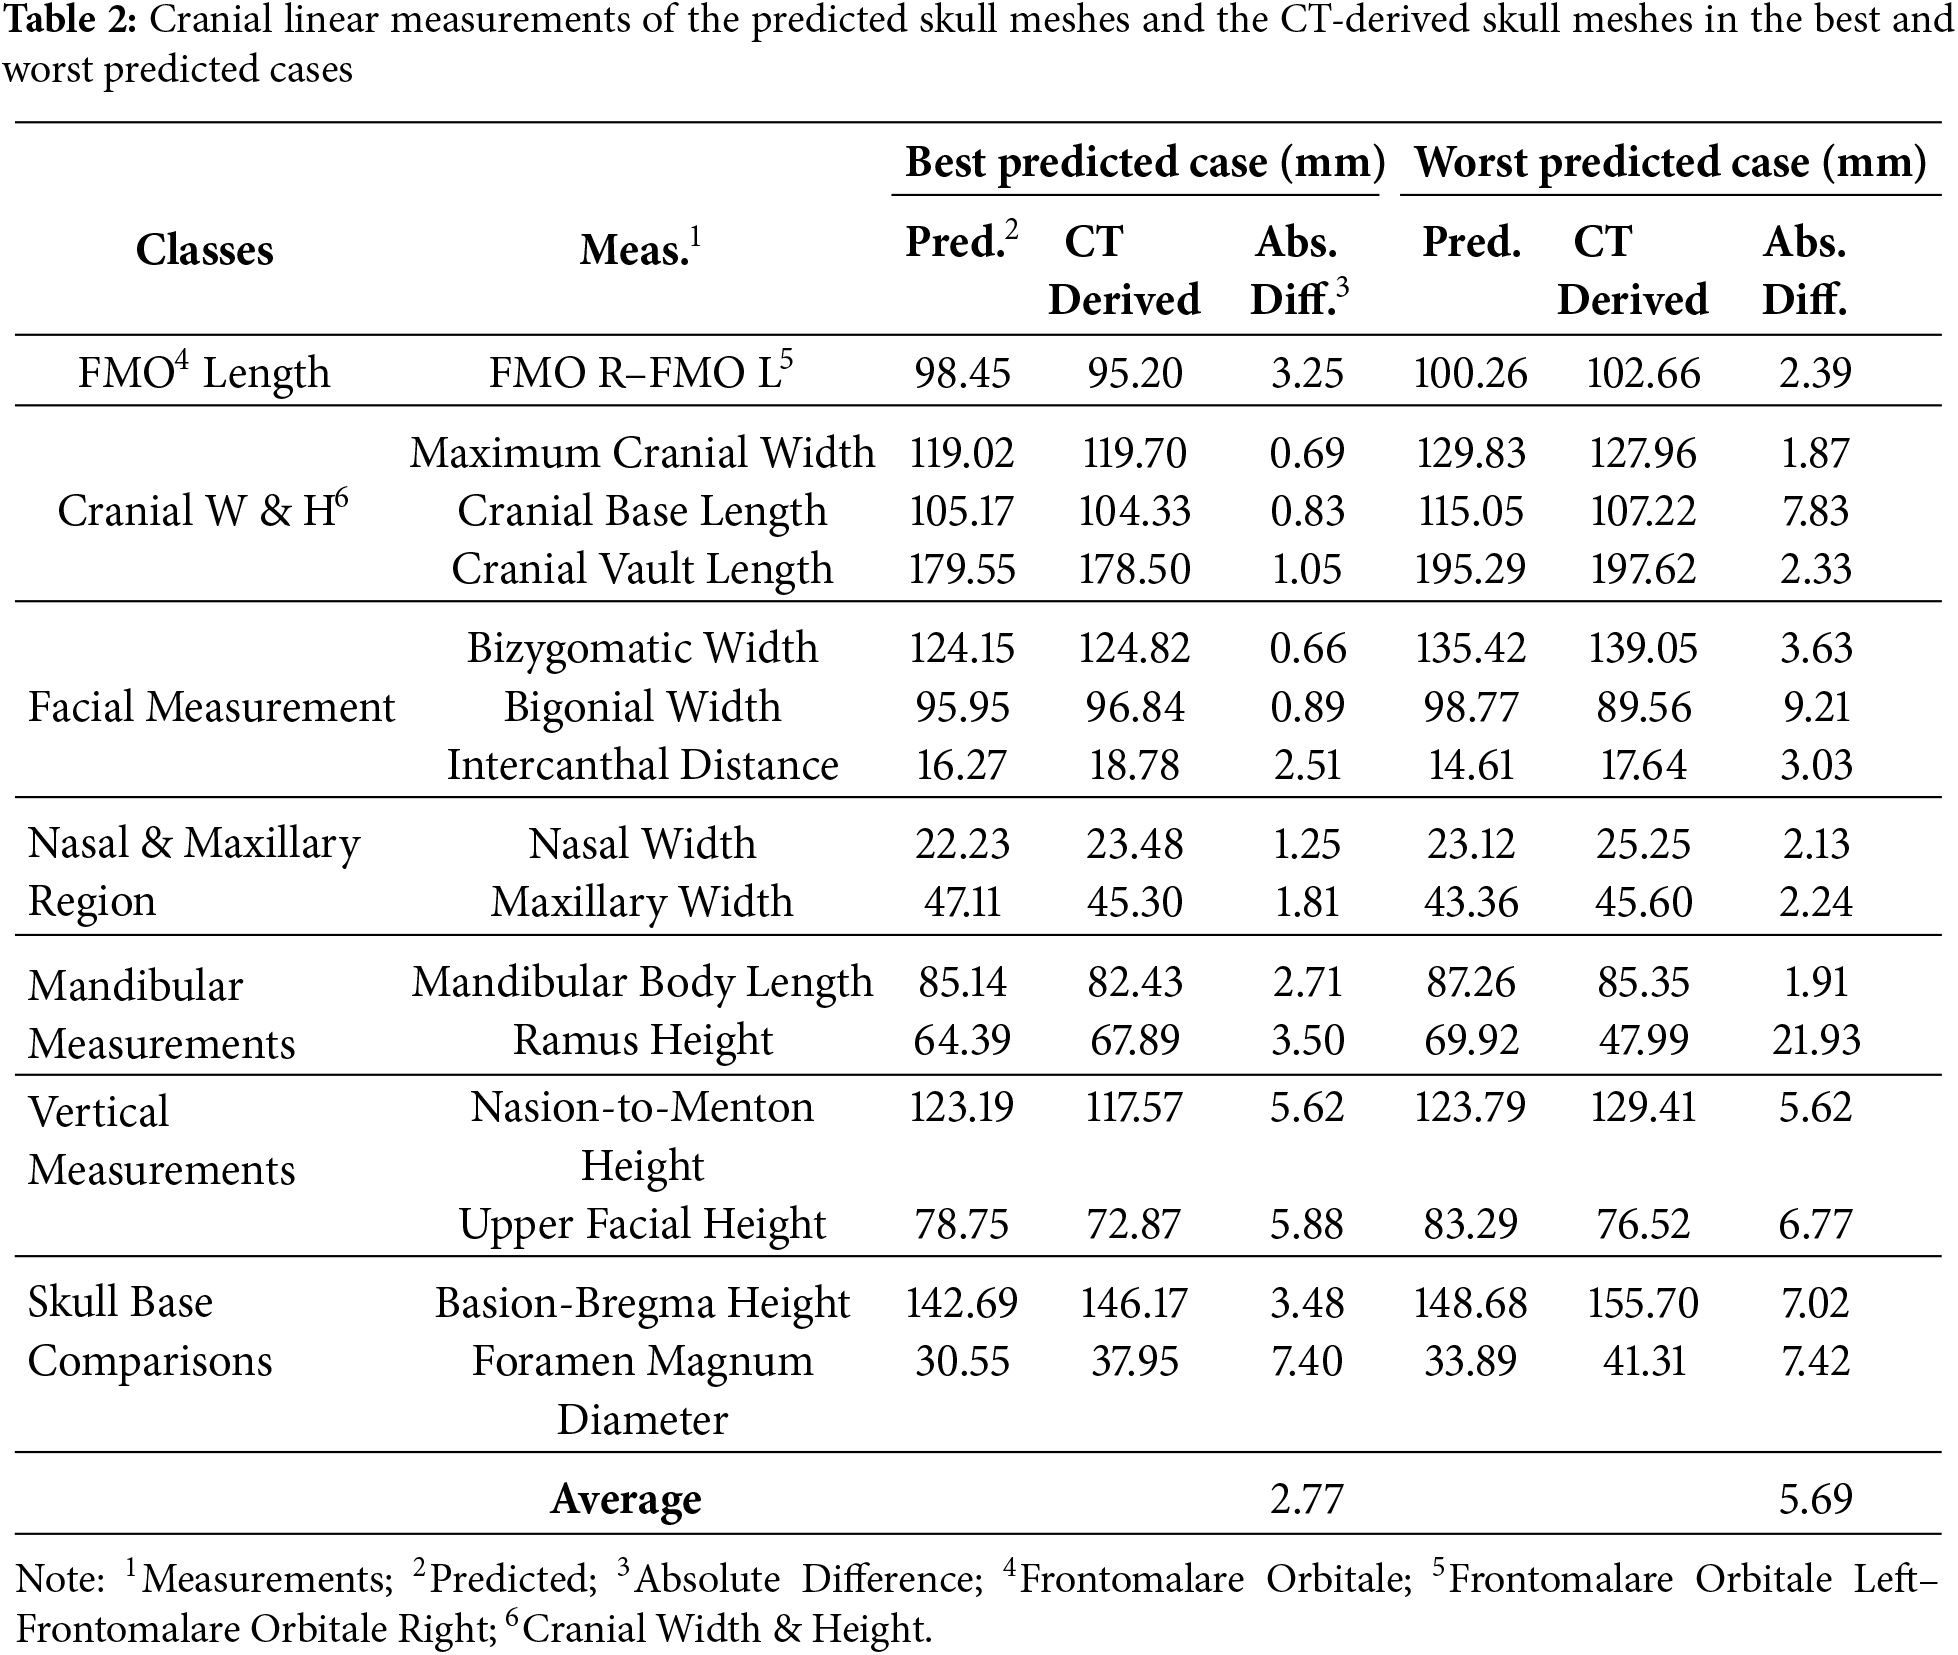
Table 2 presents the comparison between the predicted skull meshes and the CT-derived skull meshes using cranial linear measurements for the best and worst predicted cases. Overall, the average of absolute differences between the predicted skull meshes and the CT-derived skull meshes ranged from 2.77 mm to 5.69 mm, for the best and worst predicted cases, respectively. These errors are within the acceptable range of facial muscle biomechanical simulation, with less than 6 mm [44]. In particular, the errors in the cranial width & height class are the smallest in comparison with others. The errors in the facial measurement class are also better than in other classes. Note that errors in global skull shapes tend to be smaller than those in local skull shapes.
Skull structure prediction from the head has been an interesting research topic these days [1,24,25]. This head-to-skull prediction is necessary for subject-specific biomechanical head simulation in real-time [1]. However, in this type of prediction, the full head structure must be first available, but most 3-D scanning devices can only capture the frontal region of the head. The back-head region is often covered by hair or other obstacles. Consequently, a method that can predict the full-skull structure based only on the face is strongly required for the application of fast biomechanical head simulation. After conducting this study, we have three main contributions: (1) a novel method for predicting the full-skull structure from the face, (2) an estimation of the relation from face-skull shapes to back-skull shape, and (3) a novel full-skull structure generation from the skull shape.
Regarding the first contribution, in this study, we first introduce the procedure of predicting full-skull structure from the face-head shape. Nowadays, the issue of 3-D face-shape animation based on 3-D scanning devices has been popularly researched in the literature [45–48]. Most animation methods could only animate the frontal region of the head, and the back-head structure was lacking. Even though the full-head structure could be reconstructed based on multiple views of 3-D scanners, such as Kinect sensors and laser scanners, these structures contained hairs and other obstacles [17–20]. These reconstructed head and face shapes could not be used directly to predict the full skull structure.
In our previous study, based only on the 3-D high-definition (HD) face points, although we could reconstruct the full-head structure by scaling a template head mesh to the 3-D HD face points using the affine transform [1], the reconstructed head geometries were not accurate, especially in the back-head region. This was because the back-head shape could not be predicted directly from the face-head shape using the single affine transform. Consequently, the predicted skull shape based on the predicted head shape was also not accurate, especially in the back-skull region [1,2]. Some studies have also tried to use the statistical shape models of the head, such as the FLAME head model, to generate a full-head structure based on the face-head shape [2]. In these studies, the FLAME head model was deformed by controlling the pose, shape, expression, and translation parameters so that the face vertices would optimally fit with the target face shape. However, the predicted back-head shape was still not accurate because the training dataset of the FLAME model was mainly focused on the frontal region of the head [28]. The predicted full-skull structure was, therefore, not accurate if the FLAME-generated head shape was used.
Consequently, a clear relation between the face-head and back-head shapes should be employed to generate a more accurate full-head shape based only on the face-head shape. The full-skull shape generated from that FH2BH-based full-head shape would also be more accurate. In this study, we enhanced the accuracy of the face-to-skull prediction. In particular, as shown in Fig. 16, after ten-fold cross-validation, the mean mesh-to-mesh distances (Mean ± SD) of the FH2BH-based FH2S prediction strategy were 1.94 ± 0.37 mm, which was the smallest in comparison with the scaling-based strategy (5.84 ± 1.62 mm) and the FLAME optimization-based strategy (3.61 ± 0.78 mm). This prediction strategy could be even more enhanced if we applied the FH2BH relation to the ROI-based head-to-skull prediction. As shown in Fig. 16, the optimal testing error of the face-head to full-skull shape prediction could reach up to 1.94 ± 0.37 mm. Regarding the face-head to full-skull structure prediction, the mean mesh-to-mesh distance errors were 2.65 ± 0.36 mm. These errors were smaller than the best skull prediction errors, with a mean of 3.21 mm, when the scaling-based FH2S prediction strategy was used in our previous study [1].
In facial mimic rehabilitation, muscle strains were analyzed to diagnose facial paralysis and supervise the development progress [1]. Muscle strains are formed by the relative motion of muscle insertion and attachment points on the head and skull shape [44]. The acceptable error for the muscle insertion and attachment points is 6 mm [44]. Consequently, even though the final error was 2.65 ± 0.36 mm, this error was still in the acceptable range of facial mimic rehabilitation. Moreover, the errors in the muscle insertion and attachment regions are based on the shape of the head and skull, so the error of 1.93 ± 0.36 mm for the skull shape was even better than the acceptable errors of the target application. Note that the errors from the skull mesh were larger than the errors from the skull shape due to some missing anatomical structures from the CT-reconstructed skulls.
Regarding the second contribution, we first investigated the FS2BS relation. In the literature, no studies have tried to predict the back-skull shape based on the face-skull shape. In particular, as shown in Fig. 15, the face-skull shape to back-skull shape regression errors could reach the grand mean values of 1.96 mm after the ten-fold cross-validation. This relationship not only supported the FH2S prediction in this study, but also helped predict the back-skull structure when only having the face-skull structure. The FS2BS relation could also be applied to archeology applications for predicting the back-skull structures based on the remains of the face-skull structure. It is important to note that even though our model just trained the face-to-skull prediction model based only on CT-reconstructed head and skull meshes that do not include hair. In real-world scenarios, such as in our previous study [2], we employed deep neural networks, such as the Mediapipe framework and Deep Face, for detecting facial points and reconstructing them into 3D using stereo fusion [2]. Even though some parts of hair might exist in the field of vision of the camera, the employed deep neural network still can infer the facial region. Consequently, our face-to-skull prediction model can still be employed in these studies to enhance the accuracy of face-to-skull prediction.
Regarding the third contribution, we found a novel skull mesh generation procedure from the skull shape. In the previous study [21], after having the skull shape, a template skull mesh was deformed to the target skull shape based on the optimization procedure. In particular, the template skull mesh was parameterized using the mean-weighted coordinate generation algorithm [42]. The cage of the skull mesh was its isometrically re-meshed convex hull. The vertices of the skull cage were iteratively moved so that the shape of the template skull mesh optimally fit with the target skull shape. If this skull mesh generation procedure were employed for the head-to-skull prediction, the generated skull mesh would include two head-shape-to-skull-shape regression errors and skull-mesh optimization errors. In this study, as shown in Fig. 13, we first deformed the template skull mesh to the target skull shape based on the SVD rigid transform with the pre-defined features and the affine CPD transform with their covering boxes. The skull shape of the affine-transformed skull mesh was directly used as the cage for the cage-based deformation. The cage vertices were replaced by the target skull shape vertices to deform the skull mesh to the target skull shape. By using this strategy, the shape of the affine-transformed skull mesh was perfectly fitted with the target skull shape. Consequently, we could eliminate the skull-mesh-from-skull-shape generation errors from the head-to-skull prediction procedure.
However, we also have some drawbacks when predicting the full-skull structure from the face. As shown in Figs. 17 and 18, both the best and worst predicted skull shapes, have large errors distributed on the mandible region of the skull structure. Errors were also concentrated in the back-skull regions. In particular, based on the distance color maps in Figs. 17 and 18, the prediction performance is good in the upper area, when significant errors were evident in the mandible and occipital region of the skull shapes and meshes. This is because of a stronger shape correlation between the head and skull shapes in the upper area than in the occipital area of the head and skull. Moreover, in this study, we only train face-to-skull relation in the neutral facial mimics, in which the mandible jaw is closed. In some cases of jaw opening on the face, large prediction errors might occur in the mandible region. Moreover, the front tooth region in the worst predicted case, as shown in Figs. 17 and 18 were missing, so the prediction errors in this case were the largest. Last but not least, PCA-based shape modeling with a limited number of principal components cannot handle small geometrical shapes in the mandible regions. Consequently, the prediction performance in the upper area is better than in the lower area of the skull. This was because, in this study, we found the shape relations based on the multivariate linear regression algorithm through the PCA-based parameters. These errors might be enhanced if a multivariate non-linear regression algorithm is employed with the shape parameters. More advanced shape modeling methods, such as Gaussian-based PCA SSM [21] and 3-D GAN [49] could also be employed to enhance the accuracy of the shape parameterization. Additionally, the head-to-skull prediction should also be enhanced by using the local shape relation, mainly focused on the mandible and back-head regions, to reduce the errors of the FH2S prediction. Regarding the training and testing data, we had a notable imbalance between males (265 subjects) and females (64 subjects). This might cause sexual dimorphism in cranial structures. Moreover, most subjects in the dataset were Canadian, so the trained model might not be generalized to various geographical locations. Last but not least, the BMI values were not included in the face-to-skull prediction procedure. BMI values highly affect the thicknesses between the head shape and the skull shape in various regions [2]. Consequently, the BMI values might also affect the accuracy of face-to-skull prediction.
In perspective, the head and skull meshes of female subjects will be collected. Moreover, we will collect more data from Asian countries to diversify the geography of the training dataset. We will also employ the optimal FH2S prediction strategy to enhance the accuracy of the subject-specific biomechanical head modeling supporting the clinical decision support system for facial mimic rehabilitation [1]. The developed FH2S prediction strategy could also be applied to generate the full head structure, including full head geometries, skull, and muscle network, coupled with the 3-D face mesh detected on mono cameras. When we have enough male and female subjects, we will train the models for males and females and use different template skulls for skull structure generation from the predicted skull shape. The target application of our study will be facial mimic rehabilitation. In particular, the proposed face-to-skull procedure will be employed to generate the subject-specific head shape based on the 3D reconstructed face mesh with a stereo-fusion system [2]. The generated head shape will be used for skull and muscle network generation. The generated head, skull, and muscle network will be used for real-time biomechanical head simulation [1]. Facial surgical planning will be one of our long-term perspectives when more advanced shape modeling methods, regression methods, and more complete data will be employed to enhance the accuracy of the issue of face-to-skull prediction. Last but not least, we will also study the relationship between BMI values and head-to-skull thicknesses in various regions. These thicknesses will be fused with the face-to-skull prediction method to enhance the face-to-skull prediction.
Skull prediction from head shape has been one of the most challenging issues in biomechanical head simulation, especially when only having the face shape. In this study, we first investigated the procedure of the face-head-to-full-skull prediction based on the face-head-to-back-head relation. We have proven that by applying the relationship between the face-head shape and the back-head shape, the skull prediction from the face-head shape could be significantly enhanced. After ten-fold cross-validation, the optimal face-to-skull prediction had mesh-to-mesh distance errors of 1.93 ± 0.36 mm and 2.65 ± 0.36 mm for the skull shape and skull mesh comparison, respectively. We also found that the back-skull shape could be predicted from the face-skull shape with a mean error of 1.96 mm. This face-skull-to-back-skull prediction is also helpful for predicting the back-skull structures when having only the face-skull structure. Moreover, in this study, we also investigated a novel procedure for generating the skull structure from the skull shape. This procedure helps eliminate the skull mesh generation errors from the head-to-skull prediction. In perspective, we will employ the face-to-skull prediction procedure in our clinical decision support system for facial mimic rehabilitation to enhance the accuracy of the biomechanical head simulation based only on the stereo-vision sensors.
Acknowledgement: We would like to thank the International University, Vietnam National University—Ho Chi Minh City (VNU-HCM) for supporting and funding this study.
Funding Statement: This research is funded by the International University, VNU-HCM, under grant number T2023-01-BME.
Author Contributions: The authors confirm contribution to the paper as follows: Conceptualization, Tien-Tuan Dao and Tan-Nhu Nguyen; methodology, Tien-Tuan Dao, Lan-Nhi Tran-Ngoc, Trong-Pham Nguyen-Huu, Khanh-Linh Dinh-Bui, Nhat-Minh Nguyen, Ngoc-Bich Le, and Tan-Nhu Nguyen; validation, Nhat-Minh Nguyen and Ngoc-Bich Le; formal analysis, Tien-Tuan Dao and Tan-Nhu Nguyen; project investigation, Tan-Nhu Nguyen; resources, Tan-Nhu Nguyen; data curation, Trong-Pham Nguyen-Huu and Khanh-Linh Dinh Bui; writing—original draft preparation, Tien-Tuan Dao and Tan-Nhu Nguyen; writing—review and editing, Tien-Tuan Dao and Tan-Nhu Nguyen; visualization, Tan-Nhu Nguyen; supervision, Tan-Nhu Nguyen; funding acquisition, Tan-Nhu Nguyen. All authors reviewed the results and approved the final version of the manuscript.
Availability of Data and Materials: The data that support the findings of this study are available from the corresponding author, Tan-Nhu Nguyen, upon reasonable request.
Ethics Approval: Not applicable.
Conflicts of Interest: The authors declare no conflicts of interest to report regarding the present study.
References
1. Nguyen TN, Dakpe S, Ho Ba Tho MC, Dao TT. Kinect-driven patient-specific head, skull, and muscle network modelling for facial palsy patients. Comput Methods Programs Biomed. 2021;200:105846. doi:10.1016/j.cmpb.2020.105846. [Google Scholar] [PubMed] [CrossRef]
2. Nguyen TN, Ballit A, Dao TT. A novel stereo camera fusion scheme for generating and tracking real-time 3-D patient-specific head/face kinematics and facial muscle movements. IEEE Sens J. 2023;23(9):9889–97. doi:10.1109/JSEN.2023.3259473. [Google Scholar] [CrossRef]
3. Lipphaus A, Witzel U. Three-dimensional finite element analysis of the dural folds and the human skull under head acceleration. Anat Rec. 2021;304(2):384–92. doi:10.1002/ar.24401. [Google Scholar] [PubMed] [CrossRef]
4. Shobha ES, Raghuveer HP, Nagesh S, Nainoor N, Shaju N, Punyakoti NS. Stress propagation in the craniofacial skeleton on frontal impact—a virtual simulation study. J Maxillofac Oral Surg. 2023;22(4):1027–33. doi:10.1007/s12663-023-01979-4. [Google Scholar] [PubMed] [CrossRef]
5. Henningsen MJ, Lindgren N, Kleiven S, Li X, Jacobsen C, Villa C. Subject-specific finite element head models for skull fracture evaluation—a new tool in forensic pathology. Int J Legal Med. 2024;138(4):1447–58. doi:10.1007/s00414-024-03186-3. [Google Scholar] [PubMed] [CrossRef]
6. Singh A, Kumar D, Ganpule S. Biomechanical response of head surrogate with and without the helmet. J Biomech Eng. 2024;146(3):031001. doi:10.1115/1.4062968. [Google Scholar] [PubMed] [CrossRef]
7. Von Arx T, Nakashima MJ, Lozanoff S. The face—a musculoskeletal perspective. a literature review. Swiss Dent J SSO. 2018;128(9):678–88. doi:10.61872/sdj-2018-09-442. [Google Scholar] [PubMed] [CrossRef]
8. Fan AX, Dakpé S, Dao TT, Pouletaut P, Rachik M, Ho Ba Tho MC. MRI-based finite element modeling of facial mimics: a case study on the paired zygomaticus major muscles. Comput Methods Biomech Biomed Engin. 2017;20(9):919–28. doi:10.1080/10255842.2017.1305363. [Google Scholar] [PubMed] [CrossRef]
9. Arora V, Sidhu BS, Singh K. Comparison of computed tomography and magnetic resonance imaging in evaluation of skull lesions. Egypt J Radiol Nucl Med. 2022;53(1):67. doi:10.1186/s43055-022-00745-9. [Google Scholar] [CrossRef]
10. Shi HM, Sun ZC, Ju FH. Understanding the harm of low-dose computed tomography radiation to the body. Exp Ther Med. 2022;24(2):534. doi:10.3892/etm.2022.11461. [Google Scholar] [PubMed] [CrossRef]
11. Cohnen M, Wittsack HJ, Assadi S, Muskalla K, Ringelstein A, Poll LW, et al. Radiation exposure of patients in comprehensive computed tomography of the head in acute stroke. AJNR Am J Neuroradiol. 2006;27(8):1741–5. [Google Scholar] [PubMed]
12. Brix G, Lechel U, Glatting G, Ziegler SI, Münzing W, Müller SP, et al. Radiation exposure of patients undergoing whole-body dual-modality 18F-FDG PET/CT examinations. J Nucl Med. 2005;46(4):608–13. doi:10.3413/nukmed-0663-14-04. [Google Scholar] [PubMed] [CrossRef]
13. Cao CF, Ma KL, Shan H, Liu TF, Zhao SQ, Wan Y, et al. CT scans and cancer risks: a systematic review and dose-response meta-analysis. BMC Cancer. 2022;22(1):1238. doi:10.1186/s12885-022-10310-2. [Google Scholar] [PubMed] [CrossRef]
14. Mattsson S, Leide-Svegborn S, Andersson M. X-ray and molecular imaging during pregnancy and breastfeeding-when should we be worried? Radiat Prot Dosimetry. 2021;195(3–4):339–48. doi:10.1093/rpd/ncab041. [Google Scholar] [PubMed] [CrossRef]
15. Nielsen JD, Madsen KH, Puonti O, Siebner HR, Bauer C, Madsen CG, et al. Automatic skull segmentation from MR images for realistic volume conductor models of the head: assessment of the state-of-the-art. Neuroimage. 2018;174:587–98. doi:10.1016/j.neuroimage.2018.03.001. [Google Scholar] [PubMed] [CrossRef]
16. Minnema J, van Eijnatten M, Kouw W, Diblen F, Mendrik A, Wolff J. CT image segmentation of bone for medical additive manufacturing using a convolutional neural network. Comput Biol Med. 2018;103:130–9. doi:10.1016/j.compbiomed.2018.10.012. [Google Scholar] [PubMed] [CrossRef]
17. Wang SF, Lai SH. Reconstructing 3D face model with associated expression deformation from a single face image via constructing a low-dimensional expression deformation manifold. IEEE Trans Pattern Anal Mach Intell. 2011;33(10):2115–21. doi:10.1109/TPAMI.2011.88. [Google Scholar] [PubMed] [CrossRef]
18. Marcos S, Gómez-García-Bermejo J, Zalama E. A realistic, virtual head for human-computer interaction. Interact Comput. 2010;22(3):176–92. doi:10.1016/j.intcom.2009.12.002. [Google Scholar] [CrossRef]
19. Matsuoka A, Yoshioka F, Ozawa S, Takebe J. Development of three-dimensional facial expression models using morphing methods for fabricating facial prostheses. J Prosthodont Res. 2019;63(1):66–72. doi:10.1016/j.jpor.2018.08.003. [Google Scholar] [PubMed] [CrossRef]
20. Turban L, Girard D, Kose N, Dugelay JL. From Kinect video to realistic and animatable MPEG-4 face model: a complete framework. In: Proceedings of the 2015 IEEE International Conference on Multimedia & Expo Workshops (ICMEW); 2015 Jun 29–Jul 3; Turin, Italy. doi:10.1109/ICMEW.2015.7169783. [Google Scholar] [CrossRef]
21. Nguyen TN, Tran VD, Nguyen HQ, Dao TT. A statistical shape modeling approach for predicting subject-specific human skull from head surface. Med Biol Eng Comput. 2020;58(10):2355–73. doi:10.1007/s11517-020-02219-4. [Google Scholar] [PubMed] [CrossRef]
22. Wold S, Geladi P, Esbensen K, Öhman J. Multi-way principal components-and PLS-analysis. J Chemometrics. 1987;1(1):41–56. doi:10.1002/cem.1180010107. [Google Scholar] [CrossRef]
23. Garthwaite PH. An interpretation of partial least squares. J Am Stat Assoc. 1994;89(425):122. doi:10.2307/2291207. [Google Scholar] [CrossRef]
24. Nguyen HQ, Nguyen TN, Tran VD, Dao TT. A deep learning approach for predicting subject-specific human skull shape from head toward a decision support system for home-based facial rehabilitation. IRBM. 2023;44(1):100724. doi:10.1016/j.irbm.2022.05.005. [Google Scholar] [CrossRef]
25. Nguyen TN, Tran VD, Nguyen HQ, Nguyen DP, Dao TT. Enhanced head-skull shape learning using statistical modeling and topological features. Med Biol Eng Comput. 2022;60(2):559–81. doi:10.1007/s11517-021-02483-y. [Google Scholar] [PubMed] [CrossRef]
26. Lüthi M, Gerig T, Jud C, Vetter T. Gaussian process morphable models. IEEE Trans Pattern Anal Mach Intell. 2018;40(8):1860–73. doi:10.1109/tpami.2017.2739743. [Google Scholar] [PubMed] [CrossRef]
27. Hernandez M, Choi J, Medioni G. Near laser-scan quality 3-D face reconstruction from a low-quality depth stream. Image Vis Comput. 2015;36(4):61–9. doi:10.1016/j.imavis.2014.12.004. [Google Scholar] [CrossRef]
28. Li T, Bolkart T, Black MJ, Li H, Romero J. Learning a model of facial shape and expression from 4D scans. ACM Trans Graph. 2017;36(6):1–17. doi:10.1145/3130800.3130813. [Google Scholar] [CrossRef]
29. Soh W, Kim H, Yum BJ. Application of kernel principal component analysis to multi-characteristic parameter design problems. Ann Oper Res. 2018;263(1):69–91. doi:10.1007/s10479-015-1889-2. [Google Scholar] [CrossRef]
30. Higham NJ. QR factorization with complete pivoting and accurate computation of the SVD. Linear Algebra Appl. 2000;309(1–3):153–74. doi:10.1016/S0024-3795(99)00230-X. [Google Scholar] [CrossRef]
31. Clark K, Vendt B, Smith K, Freymann J, Kirby J, Koppel P, et al. The cancer imaging archive (TCIAmaintaining and operating a public information repository. J Digit Imaging. 2013;26(6):1045–57. doi:10.1007/s10278-013-9622-7. [Google Scholar] [PubMed] [CrossRef]
32. Vallières M, Kay-Rivest E, Perrin LJ, Liem X, Furstoss C, Aerts HJWL, et al. Radiomics strategies for risk assessment of tumour failure in head-and-neck cancer. Sci Rep. 2017;7(1):10117. doi:10.1038/s41598-017-10371-5. [Google Scholar] [PubMed] [CrossRef]
33. Grossberg AJ, Mohamed ASR, Elhalawani H, Bennett WC, Smith KE, Nolan TS, et al. Author Correction: imaging and clinical data archive for head and neck squamous cell carcinoma patients treated with radiotherapy. Sci Data. 2018;5(1):1. doi:10.1038/sdata.2018.173. [Google Scholar] [PubMed] [CrossRef]
34. Dao TT, Pouletaut P, Charleux F, Lazáry Á., Eltes P, Varga PP, et al. Multimodal medical imaging (CT and dynamic MRI) data and computer-graphics multi-physical model for the estimation of patient specific lumbar spine muscle forces. Data Knowl Eng. 2015;96(6):3–18. doi:10.1016/j.datak.2015.04.001. [Google Scholar] [CrossRef]
35. Pieper S, Halle M, Kikinis R. 3D Slicer. In: Proceedings of the 2004 2nd IEEE International Symposium on Biomedical Imaging: Nano to Macro (IEEE Cat No. 04EX821); 2004 Apr 18–18; Arlington, VA, USA. doi:10.1109/ISBI.2004.1398617. [Google Scholar] [CrossRef]
36. Tran VD, Nguyen TN, Ballit A, Dao TT. Novel baseline facial muscle database using statistical shape modeling and in silico trials toward decision support for facial rehabilitation. Bioengineering. 2023;10(6):737. doi:10.3390/bioengineering10060737. [Google Scholar] [PubMed] [CrossRef]
37. Floyd Chitalu. Github. Gist: a simple and fast C++ library for mesh booleans and more [Internet]. [cited 2025 Mar 8]. Available from: https://github.com/cutdigital/mcut. [Google Scholar]
38. Akritas AG, Malaschonok GI. Applications of singular-value decomposition (SVD). Math Comput Simul. 2004;67(1–2):15–31. doi:10.1016/j.matcom.2004.05.005. [Google Scholar] [CrossRef]
39. Li Z, Ding G, Li R, Qin S. A new extracting algorithm of k nearest neighbors searching for point clouds. Pattern Recognit Lett. 2014;49:162–70. doi:10.1016/j.patrec.2014.07.003. [Google Scholar] [CrossRef]
40. Myronenko A, Song X. Point set registration: coherent point drift. IEEE Trans Pattern Anal Mach Intell. 2010;32(12):2262–75. doi:10.1109/TPAMI.2010.46. [Google Scholar] [PubMed] [CrossRef]
41. Nieto JR, Susín A. Cage based deformations: a survey, deformation models: tracking, animation and applications. In: Hidalgo MG, Torres AM, Gómez JV, Amsterdam, The Netherlands: Elsevier; 2012. p. 75–99. doi: 10.1007/978-94-007-5446-1_3. [Google Scholar] [CrossRef]
42. Hormann K, Floater MS. Mean value coordinates for arbitrary planar polygons. ACM Trans Graph. 2006;25(4):1424–41. doi:10.1145/1183287.1183295. [Google Scholar] [CrossRef]
43. Apostolakis D, Kourakis G. CAD/CAM implant surgical guides: maximum errors in implant positioning attributable to the properties of the metal sleeve/osteotomy drill combination. Int J Implant Dent. 2018;4(1):34. doi:10.1186/s40729-018-0146-2. [Google Scholar] [PubMed] [CrossRef]
44. Dao TT, Pouletaut P, Lazáry Á, Tho MCHB. Multimodal medical imaging fusion for patient specific musculoskeletal modeling of the lumbar spine system in functional posture. J Med Biol Eng. 2017;37(5):739–49. doi:10.1007/s40846-017-0243-3. [Google Scholar] [CrossRef]
45. Paysan P, Knothe R, Amberg B, Romdhani S, Vetter T. A 3D face model for pose and illumination invariant face recognition. In: Proceedings of the 2009 Sixth IEEE International Conference on Advanced Video and Signal Based Surveillance; 2009 Sep 2–4; Genova, Italy. doi:10.1109/AVSS.2009.58. [Google Scholar] [CrossRef]
46. Grishchenko I, Ablavatski A, Kartynnik Y, Raveendran K, Grundmann M. Attention mesh: high-fidelity face mesh prediction in real-time. arXiv:2006.10962v1. 2020. [Google Scholar]
47. Deng Y, Yang J, Xu S, Chen D, Jia Y, Tong X. Accurate 3D face reconstruction with weakly-supervised learning: from single image to image set. In: Proceedings of the 2019 IEEE/CVF Conference on Computer Vision and Pattern Recognition Workshops (CVPRW); 2019 Jun 16–17; Long Beach, CA, USA. doi:10.1109/cvprw.2019.00038. [Google Scholar] [CrossRef]
48. Guo J, Zhu X, Yang Y, Yang F, Lei Z, Li SZ. Towards fast, accurate and stable 3D dense face alignment. In: Proceedings of the Computer Vision—ECCV 2020; 2020 Aug 23–28; Glasgow, UK. doi:10.1007/978-3-030-58529-7_10. [Google Scholar] [CrossRef]
49. Karthika S, Durgadevi M. Generative adversarial network (GANa general review on different variants of GAN and applications. In: Proceedings of the 2021 6th International Conference on Communication and Electronics Systems (ICCES); 2021 Jul 8–10; Coimbatre, India. doi:10.1109/icces51350.2021.9489160. [Google Scholar] [CrossRef]
Cite This Article
 Copyright © 2025 The Author(s). Published by Tech Science Press.
This work is licensed under a Creative Commons Attribution 4.0 International License , which permits unrestricted use, distribution, and reproduction in any medium, provided the original work is properly cited.
 Downloads
 Citation Tools