
 Submit a Paper
 Propose a Special lssue
 Open Access
ARTICLE
A Deep Learning Approach for Fault Diagnosis in Centrifugal Pumps through Wavelet Coherent Analysis and S-Transform Scalograms with CNN-KAN
1 Department of Electrical, Electronics and Computer Engineering, University of Ulsan, Ulsan, 44610, Republic of Korea
2 PD Technology Co. Ltd., Ulsan, 44610, Republic of Korea
* Corresponding Author: Jong-Myon Kim. Email:
(This article belongs to the Special Issue: Advancements in Machine Fault Diagnosis and Prognosis: Data-Driven Approaches and Autonomous Systems)
Computers, Materials & Continua 2025, 84(2), 3577-3603. https://doi.org/10.32604/cmc.2025.065326
Received 10 March 2025; Accepted 27 May 2025; Issue published 03 July 2025
 View Full Text
 Download PDF
Abstract
Centrifugal Pumps (CPs) are critical machine components in many industries, and their efficient operation and reliable Fault Diagnosis (FD) are essential for minimizing downtime and maintenance costs. This paper introduces a novel FD method to improve both the accuracy and reliability of detecting potential faults in such pumps. The proposed method combines Wavelet Coherent Analysis (WCA) and Stockwell Transform (S-transform) scalograms with Sobel and non-local means filters, effectively capturing complex fault signatures from vibration signals. Using Convolutional Neural Network (CNN) for feature extraction, the method transforms these scalograms into image inputs, enabling the recognition of patterns that span both time and frequency domains. The CNN extracts essential discriminative features, which are then merged and passed into a Kolmogorov-Arnold Network (KAN) classifier, ensuring precise fault identification. The proposed approach was experimentally validated on diverse datasets collected under varying conditions, demonstrating its robustness and generalizability. Achieving classification accuracy of 100%, 99.86%, and 99.92% across the datasets, this method significantly outperforms traditional fault detection approaches. These results underscore the potential to enhance CP FD, providing an effective solution for predictive maintenance and improving overall system reliability.Keywords
Centrifugal Pumps (CPs) are essential machine components in various engineering sectors. Their failure can lead to increased process downtime, operational disruptions, and accidents, resulting in losses either financially or, in severe cases, may lead to company bankruptcy or stock price devaluation [1,2]. Given the significant impact of CP failures, diagnosing faults in these pumps is important. The primary causes of catastrophic pump failure include faulty bearings, mechanical seal issues, and impeller defects [3]. While numerous studies have focused on identifying bearing defects, research on diagnosing mechanical seal and impeller issues is limited. Thus, a comprehensive diagnostic framework that addresses these specific defects is necessary to improve the reliability and safety of CPs [4–6].
Various Health Management Strategies, including preventive maintenance, reactive maintenance, and predictive maintenance, have been extensively studied in previous research. Among these, predictive maintenance, which is also termed as condition-based maintenance (CBM), has gained significant attention due to its efficiency in reducing downtime and maintenance costs. CBM relies on real-time data collected from condition monitoring to determine the optimal time for maintenance, ensuring maximum operational efficiency. Given these advantages, this study adopts the CBM approach for diagnosing faults in CPs, aiming to enhance fault detection accuracy and improve system reliability [7,8].
CPs in abnormal states typically exhibit changes in overall vibration levels. VS has become increasingly evident for developing diagnostic methods for rotating machinery, including CPs, due to their ability to reveal machine failures [9–11]. Numerous studies have focused on identifying faults in CPs by analyzing VS. For instance, Sakthivel et al. [12] proposed a method that combines statistical feature analysis with ML techniques, such as k-NN, decision trees (DT), and Naive Bayes, to enhance FD in mono-block CPs. Their approach takes advantage of the extracted features from VS to improve classification accuracy and reliability in identifying different fault conditions. Wang et al. [13] used FFT to identify defects by analyzing the frequency components of VS, providing insights into fault characteristics, while Farokhzad et al. [14] introduced a DT-based intelligent approach that utilizes linear classification for final diagnosis, aiming to improve the accuracy and efficiency of fault detection in mechanical systems. Muralidharan and Sugumaran [15] developed a DT-based method utilizing the discrete wavelet transformation for time-frequency domain analysis, though it comes with high computational costs. Other approaches include cyclic spectral analysis by Sun et al. [16], geometric mode decomposition with power spectral entropy proposed by Zheng and Xin [17], and a refined composite multivariate multiscale symbolic dynamic entropy framework by Yang et al. [18] developed a feature selection method based on the Fisher discriminant ratio, which was integrated with an SVM classifier to enhance the accuracy of health condition classification. This approach aimed at improving fault detection by selecting the most discriminative features from VS, ensuring a more reliable diagnosis of system health. Wang and Chen [19] proposed a hybrid approach combining wavelet packet transform analysis with a partially linear neural network to automatically classify health states. Altobi et al. [20] implemented a hybrid approach, combining a genetic algorithm, back-propagation, and support vector machine (SVM) for FD, utilizing the one-dimensional CWT for signal preprocessing. These diagnostic techniques typically extract statistical features from VS in the time, frequency, or time-frequency domains and use them to train conventional machine learning algorithms for fault detection [21]. However, the selection of features plays an important role in determining diagnostic performance. Poor feature selection can lead to reduced accuracy and unreliable results, often necessitating extensive domain expertise. Additionally, many conventional methods face challenges in effectively capturing the nonlinear and non-stationary nature of VS across different health conditions, limiting their effectiveness in FD. To overcome these limitations, DL-based approaches have been introduced, providing a more reliable and effective solution for FD in CPs [22,23].
DL methods are highly effective in tackling the extraction of essential features and performing accurate classifications of faults, making them well-suited for fault detection tasks that are complex [24–28]. These methods automatically extract features from data representations, allowing for strong generalization capabilities. Among DL approaches, CNNs are widely used for their effectiveness in capturing highly discriminative features from image data and efficiently handling classification tasks [29]. Umar et al. developed an FD method for milling machines using acoustic emission signals, where CWT scalograms are processed with Gaussian filtering and analyzed through a CNN-BiLSTM hybrid model optimized by a genetic algorithm for enhanced fault classification [30]. Siddique et al. proposed a bearing-FD method using Mel-transformed scalograms and an ANN optimized by the FOX optimizer, achieving better classification performance [31]. Zaman et al. further proposed a hybrid FD model for CPs by combining WCA with VGG16 and ResNet50 [32]. Siddique et al. also proposed a hybrid deep learning model for bearing fault diagnosis, utilizing CWT-generated scalograms from vibration signals, which are processed through a spatiotemporal feature extraction architecture integrating multi-head self-attention, bidirectional LSTM, and a 1D convolutional residual network to enhance classification performance under nonstationary signal conditions [33]. Autoencoders are widely applied in domains like data compression, anomaly detection, and data generation, owing to their ability to efficiently learn and extract meaningful features from input data [34]. Generative Adversarial Networks (GANs) are frequently employed for data augmentation by learning the underlying distribution of input data, enabling the generation of realistic and diverse synthetic samples [35]. These techniques have demonstrated robustness in various applications; however, their effectiveness is largely dependent on the quality and relevance of the features captured by the input data. If the input data lacks critical information or includes excessive noise, the performance of these models can degrade significantly. In recent years, Neural Component Analysis (NCA) has also emerged as a promising method in the field of industrial process monitoring, offering a powerful tool for uncovering underlying patterns and dependencies within complex datasets. Its integration into fault detection and diagnosis frameworks has shown to significantly enhance the accuracy and responsiveness of these systems. By leveraging the strengths of both neural-based feature extraction and traditional analytical approaches, these methods collectively demonstrate substantial potential for advancing condition monitoring and predictive maintenance strategies, ultimately leading to reduced downtime, improved operational efficiency, and more reliable decision-making in industrial environments [36].
In this study, the integration of multiple techniques plays a vital role in enhancing FD for CPs. The process begins by applying WCA and S-transform scalograms into VS. WCA captures localized correlations between signal components over time, while S-transform provides a time-frequency representation. This combination allows more comprehensive analysis, incorporating both time and frequency domain information, which is essential for detecting small fault signatures that might be missed using either technique alone. The transformed scalograms are processed through two filters. The Sobel filter emphasizes edges in the scalograms, highlighting important transitions and discontinuities in the VS, which are key indicators of potential faults. At the same time, the non-local means filter reduces noise while preserving critical details, ensuring that essential fault-related features remain intact for further analysis. These filtered scalograms are treated as image inputs and fed into a CNN, which automatically extracts discriminative features from the images. CNN captures both time and frequency domain patterns necessary for effective fault detection. These extracted features are then merged and passed into a KAN classifier, which models complex nonlinear relationships to accurately classify faults. The significance of the KAN lies in its ability to handle highly complex and nonlinear fault patterns, enhancing the accuracy and robustness of the fault classification process. By integrating WCA, S-transform scalograms, filters, CNN feature extraction, and KAN classification, this model ensures high accuracy and reliability in identifying faults in CPs, utilizing the strengths of each technique to deliver more robust fault detection. The primary contributions of this work are as follows.
1. Enhanced Vibration Signal Representation:
To enhance the discriminatory characteristics of VS, their time-domain sequences are transformed into scalograms utilizing WCA and S-transform. This approach ensures a high-quality representation and reveals intricate details regarding the transient processes occurring within the system. Additionally, Sobel filtering and non-local means noise reduction are applied to refine the scalograms, enhancing fault signature visibility. This approach ensures a high-quality representation and reveals intricate details regarding transient processes occurring within the system.
2. Advanced Features Extraction and Fusion Method:
To cover the limitations of traditional feature extraction methods, a hybrid deep neural architecture is proposed that uses CNNs for feature extraction from scalograms. CNNs are designed to capture discriminative features from both time as well as frequency domains. The extracted features are then fused using a fully connected layer to form a comprehensive representation that enhances the model’s classification performance.
3. Robust Fault Classification:
The fused features are classified by KAN classifier to assess the health condition of the CP system. This integrated DL model streamlines features extractions that are fault related and classification into a single end-to-end workflow, which in turn enhances the reliability and accuracy of fault detection in CP systems.
The paper is summarized as follows: Section 2 introduces the proposed methodology used for detecting and classifying faults, explaining the design choices and architectural components in detail. Section 3 presents the necessary theoretical background and gives a comprehensive description of the dataset, including its source, characteristics, and preprocessing steps. Section 4 describes the experimental setup, covering the tools, parameters, and implementation procedures adopted during model training and evaluation. Section 5 discusses the results in depth, highlighting the performance of the proposed approach in comparison with baseline methods, supported by visual and quantitative analysis. Finally, Section 6 concludes the study by highlighting the main outcomes and proposing future research pathways to enhance and build upon the current approach.
The methodology for diagnosing CP health conditions, depicted in Fig. 1, consists of four main stages. The first step involves collecting vibration acceleration signals which originate from the testbed using a data acquisition system to capture real-time operational data. These signals are then transformed into scalograms using WCA and S-transform, with additional processing through Sobel and non-local means filters to enhance feature visibility. This step helps detect frequency variations in different sub-bands and generates image-like patterns that facilitate FD. In the third stage, CNN extracts localized fault features from the scalograms, ensuring the model captures critical information necessary for classification. These extracted features are then combined and fed into the input layer of a KAN classifier, which takes advantage of the integrated discriminative features to achieve precise mechanical fault identification. This structured approach ensures comprehensive analysis, improving the accuracy as well as reliability of CP FD.
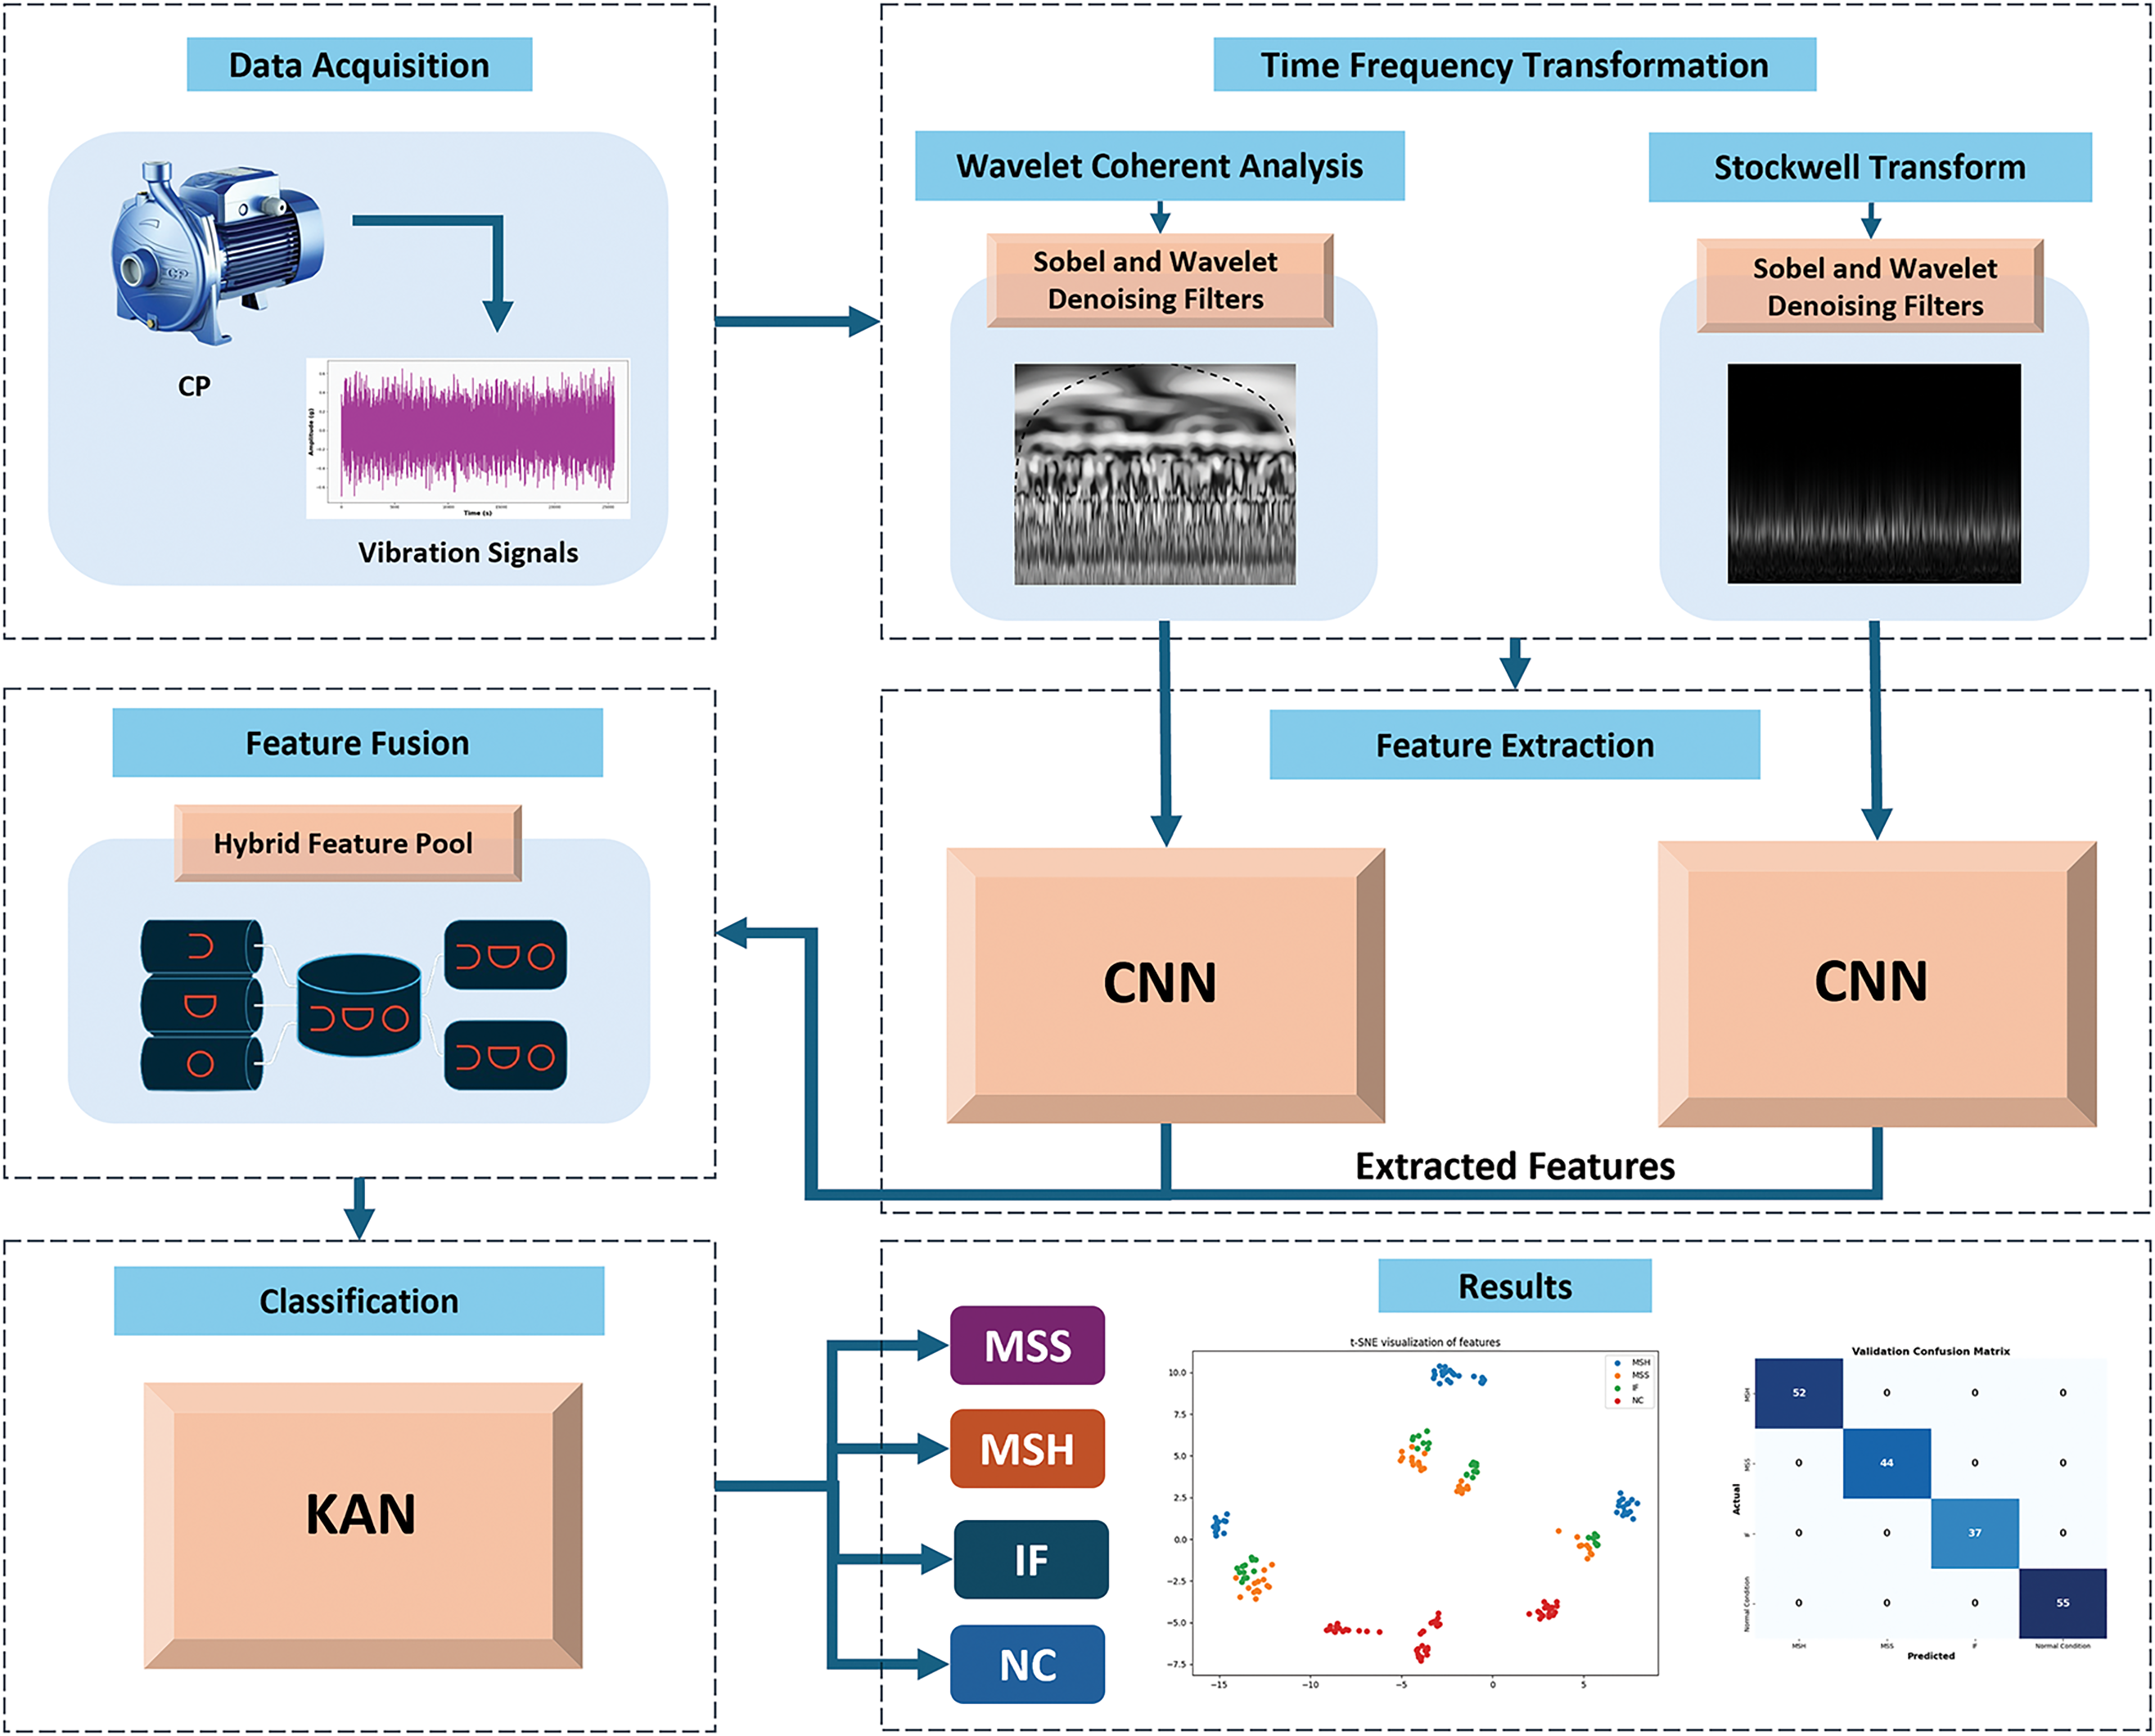
Figure 1: Proposed fault diagnosis framework combining time-frequency transformations, CNN-based feature extraction, and KAN classification for CPs
The experimental setup consisted of a CP of the PMT-4008 type, a commonly used industrial model, powered by a 5.5 kW motor. The system was equipped with a comprehensive control panel that included several components. Among these were an ON/OFF switch for general operation, a speed controller to adjust the rotational speed of the pump, a flow rate controller for regulating water flow, and a temperature controller to manage the thermal conditions of the setup. Additionally, a water supply controller was included to ensure proper water levels, alongside display screens for monitoring operational parameters in real time. Pressure gauges were installed to measure the pressure at key points in the system, and transparent steel pipes allowed visual inspection of fluid movement. The setup featured two tanks, a main tank and a buffer tank for efficient water management. To optimize the pump’s performance, the water tank was elevated to maintain the required Net Positive Suction Head (NPSH) at the inlet, preventing cavitation. Figs. 2 and 3 provide detailed representations of the test rig and a schematic layout of the entire system, illustrating the configuration and connectivity of all components.
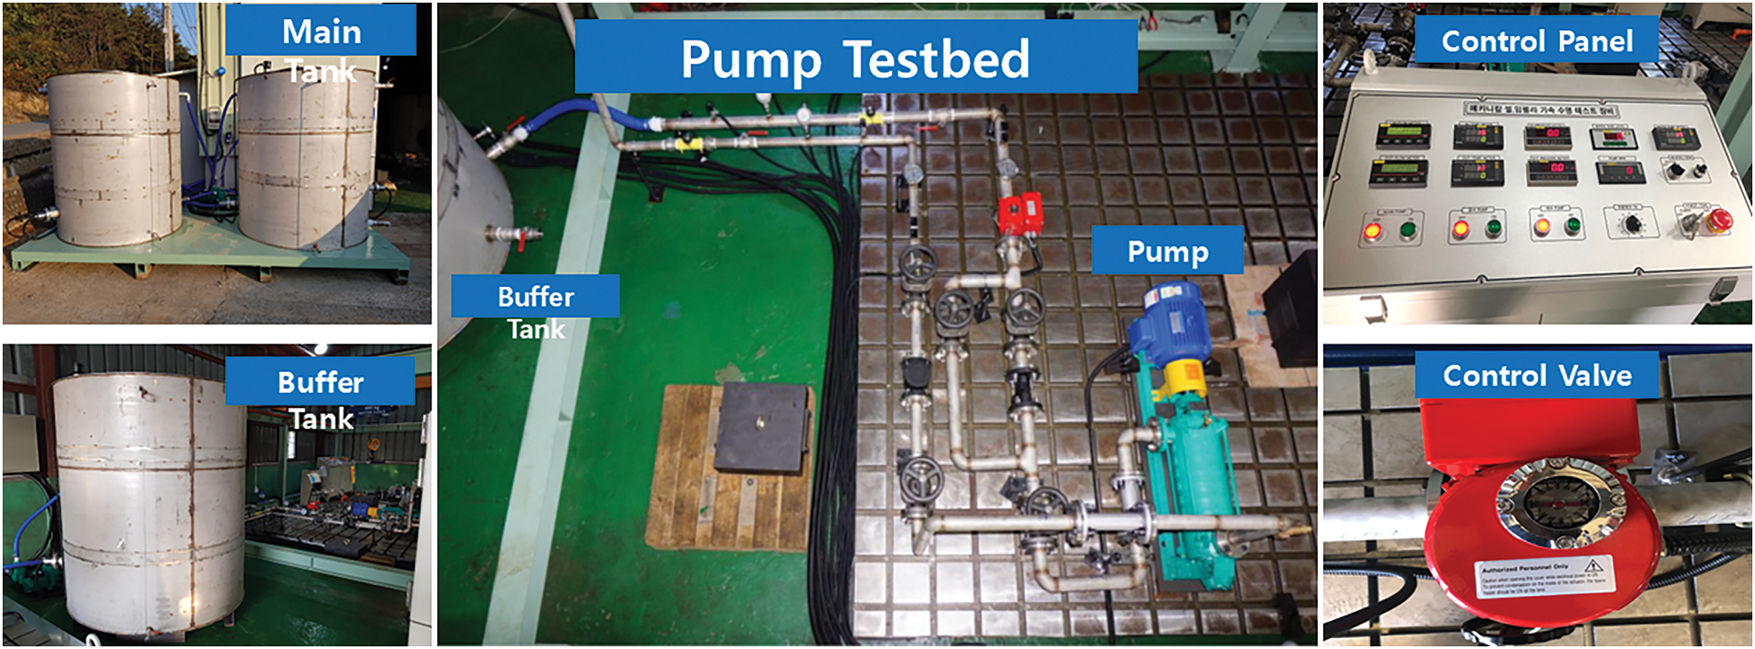
Figure 2: Diagram of the experimental test bed for CP fault detection
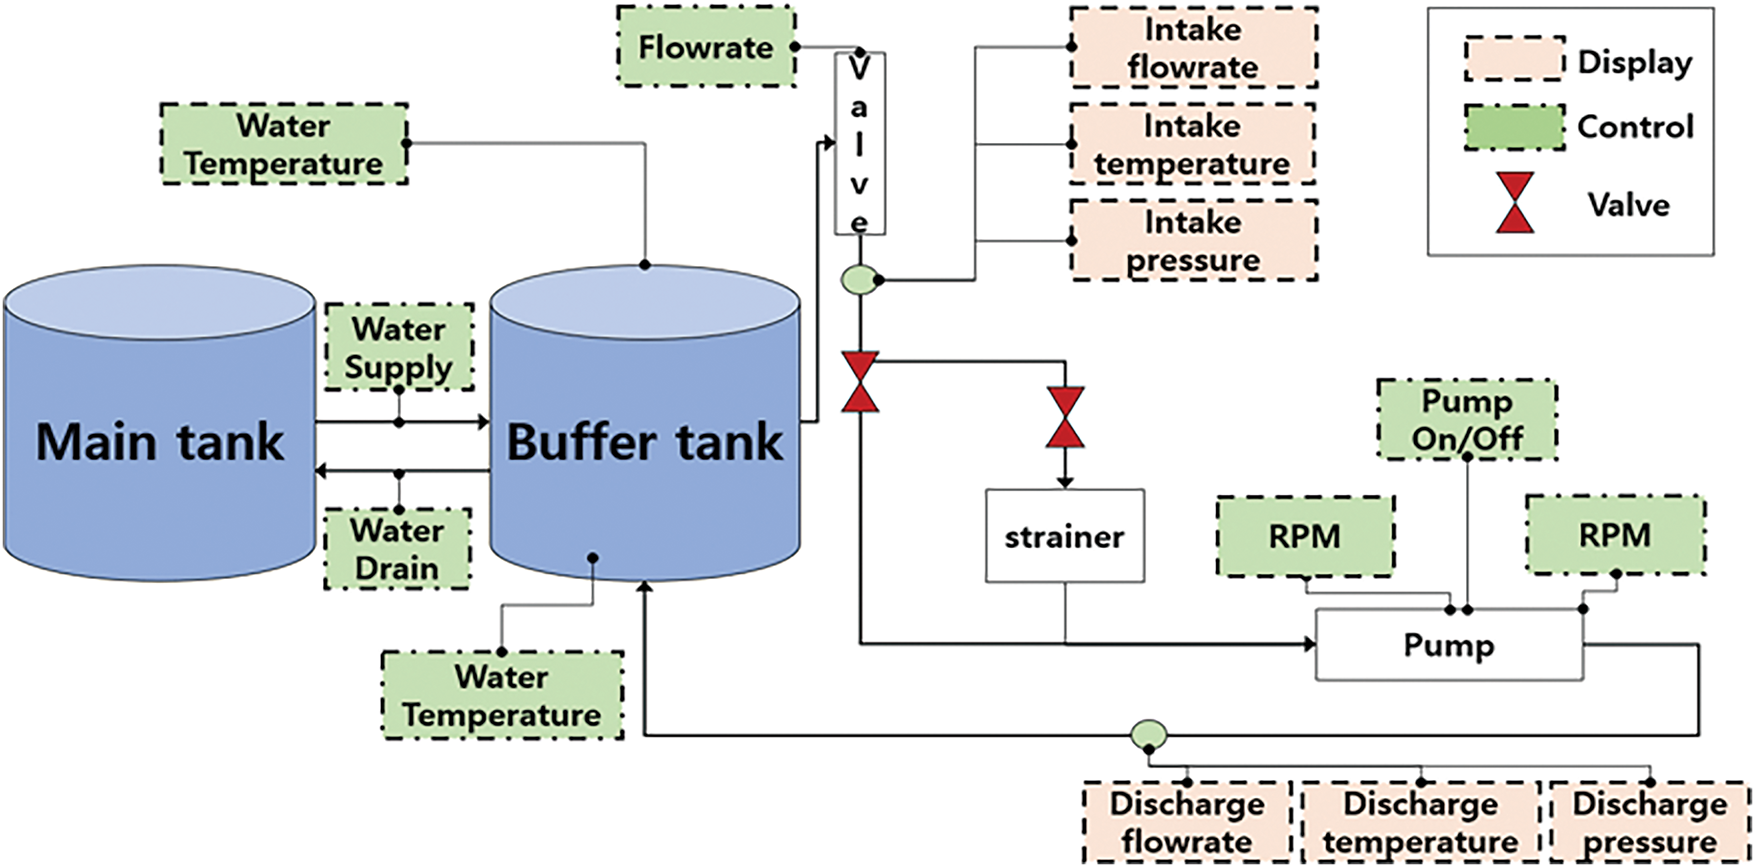
Figure 3: Block diagram illustrating the experimental setup used for CP fault analysis
Once the main setup was completed, the test rig was activated, initiating the circulation of water in a closed-loop system. Data acquisition was performed using accelerometers (four in total) strategically positioned to capture vibration data from different sections of the CP. Two accelerometers were mounted on the pump casing, while the other two were placed beside the mechanical seal and the impeller. Each accelerometer operated independently, collecting VS specific to its location. After vibration data were collected, they were transmitted to a signal monitoring system for further analysis. A National Instruments 9234 module was used to digitize the signals, converting them into a format suitable for further processing and storage. Table 1 provides detailed information on the data acquisition process, including relevant parameters and specifications. This systematic methodology ensures accurate and reliable data collection, enabling precise FD and performance evaluation of the CP.

The data acquisition process involved simulating each fault separately to capture the corresponding VS. Measurement noise was assessed by comparing the recorded signals to a baseline VS representing normal operation. The study analyzed three fault conditions: Mechanical Seal Hole (MSH) with a noise level of −69.10 dB, Impeller Fault (IF) with −63.78 dB, and Mechanical Seal Scratch (MSS) with −62.07 dB.
Dataset Description
The proposed method’s generalizability was rigorously tested using three separate datasets obtained under varying pressure conditions, which play a critical role in determining its accuracy. VS were collected through the data acquisition system and categorized into four groups MSH, MSS, IF, and normal each representing a unique health condition of the CP system. These classifications ensured that the data covered a wide range of possible fault scenarios. Each dataset consisted of a distinct number of samples, adding to the diversity and complexity of the data, which enabled a more comprehensive evaluation of the proposed method. To provide clarity and a deeper understanding of the dataset composition, Table 2 presents a detailed breakdown, outlining the structure of each dataset.

Choosing accurately the appropriate healthy baseline signals is essential for analyzing system coordination and calculating the correlation coefficients of VS after preprocessing a mechanical system’s characteristics. This paper outlines an effective method for selecting appropriate healthy baseline signals, with the process detailed as follows.
4.1.1 Maximum Efficiency Point
Determining the maximum efficiency point (MEP) is important for maximizing the operational performance of a pump. The MEP serves as a key indicator, helping to identify the optimal flow rate and NPSH that enables the pump to function most efficiently. As the flow rate changes, corresponding variations occur in the pump head, power consumption, and overall efficiency, which collectively result in a characteristic performance curve as shown in Fig. 4. The MEP is the point on this curve where the pump achieves maximum efficiency. This figure illustrates the performance curve and the MEP for the PMT-4008 pump. The pump efficiency, denoted by η, is calculated using the following equation:
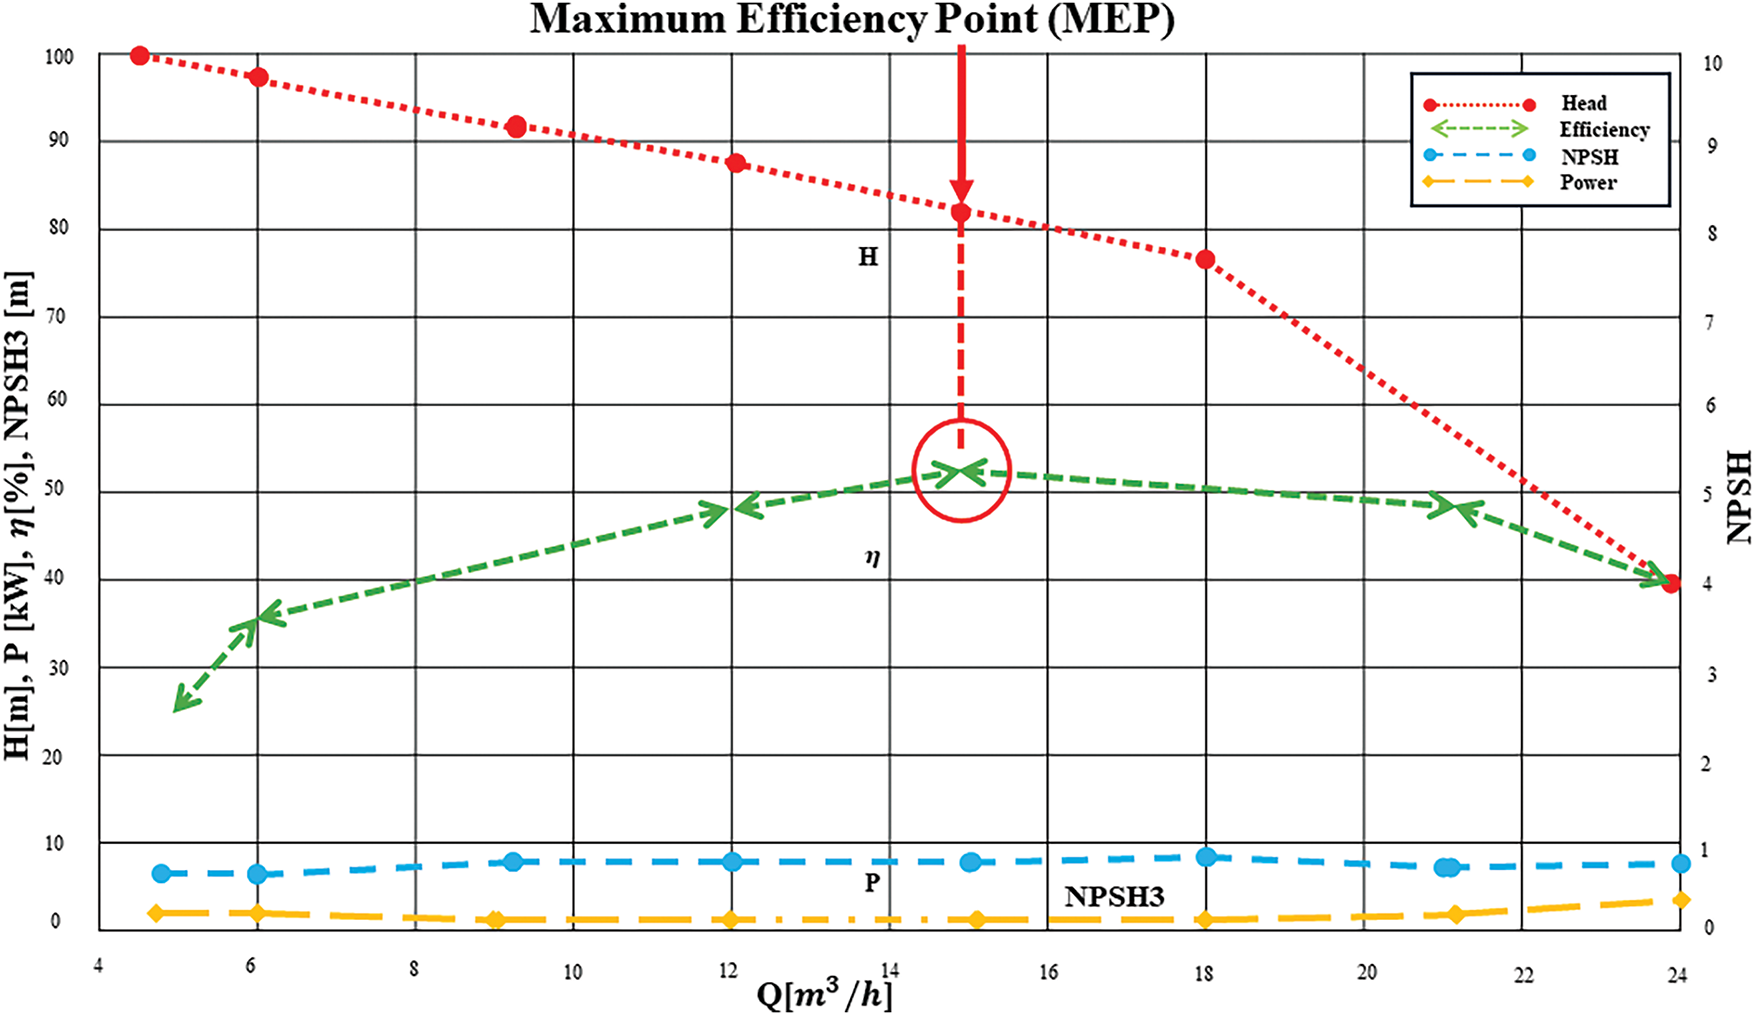
Figure 4: Pump maximum efficiency point
In this context, Q represents the flow rate,
4.1.2 Healthy Signal Selection Criteria
When choosing a dependable and accurate baseline signal from a collection of random vibration samples obtained at the pump’s MEP, random selection by itself is insufficient. Detailed analysis has shown that the ideal healthy baseline signal should exhibit a sample mean value that aligns closely with that of the pump’s normal VS, while also being distinctly different from the sample means of various fault types, including MSHs, MSSs, and IFs. The experimental results clearly demonstrate that selecting the baseline signal based on the defined criterion leads to a notable improvement in classification accuracy. This targeted selection approach ensures that the model learns from a consistent and representative healthy state of the system. In contrast, using a randomly chosen baseline signal introduces variability and inconsistency, which negatively impacts the model’s ability to distinguish between normal and faulty conditions, thereby reducing overall accuracy. It is also important to emphasize that the normal VS of the pump is captured exclusively under standard, controlled operating conditions to ensure reliability. The healthy baseline signal chosen using this systematic criterion is depicted in Fig. 5, serving as a reference for fault differentiation.
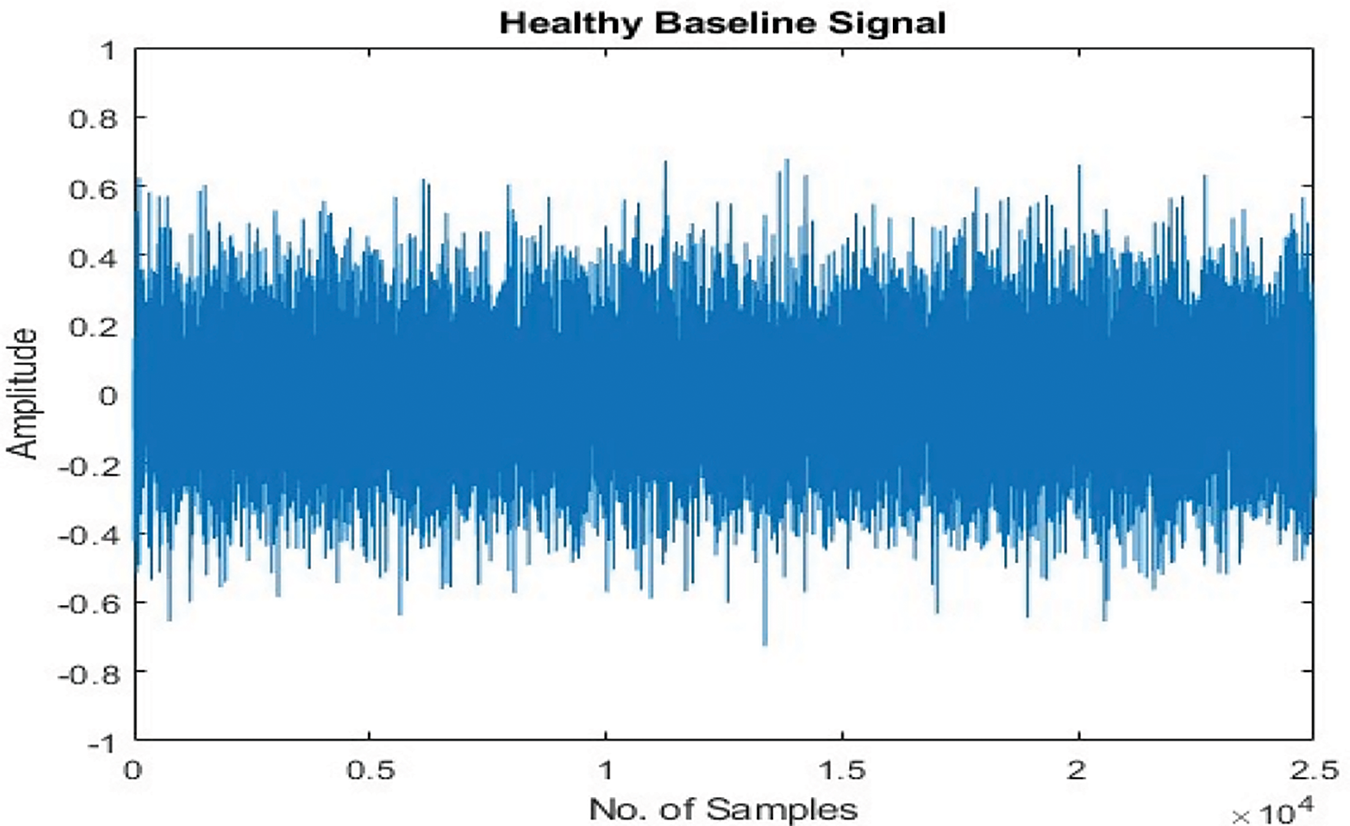
Figure 5: Health-based signal
Mechanical seal failure is often caused by high pressure. To ensure effective sealing and prevent leaks, springs are installed during pump setup to hold the rotating and stationary seal components firmly together. Maintaining correct pressure is key to ensure the springs are compressed appropriately. However, when the pressure surpasses a critical threshold, the mechanical seal faces experience excessive compressive force, leading to elevated friction and heat generation. This overheating causes the lubricant film between the seal surfaces to vaporize, compromising the sealing efficiency and potentially initiating fault conditions. The presence of dirt particles can worsen the situation, as elevated spring pressure combined with inadequate lubrication may trap these particles, leading to scratches, pitting, or even brittleness in the seal faces. If not addressed, these issues can cause premature seal failure, which may result in severe pump damage. Preventing these failures is essential for maintaining pump reliability and performance. This study examines the effects of MSH and MSS as mechanical seal faults and are discussed one by one as below.
A mechanical seal is composed of two primary components: a stationary seal and a rotating seal. In the current study, both seals had a diameter of 38.0 mm. As shown in Fig. 6, the rotating part of both seals showed a perforation with a 2.8 mm diameter and 2.8 mm depth, whereas the stationary component remained in its normal condition. The detected flaw was intentionally introduced as a controlled defect to act as an imperfect barrier, enabling study of the weaknesses inherent in mechanical apertures in seals.
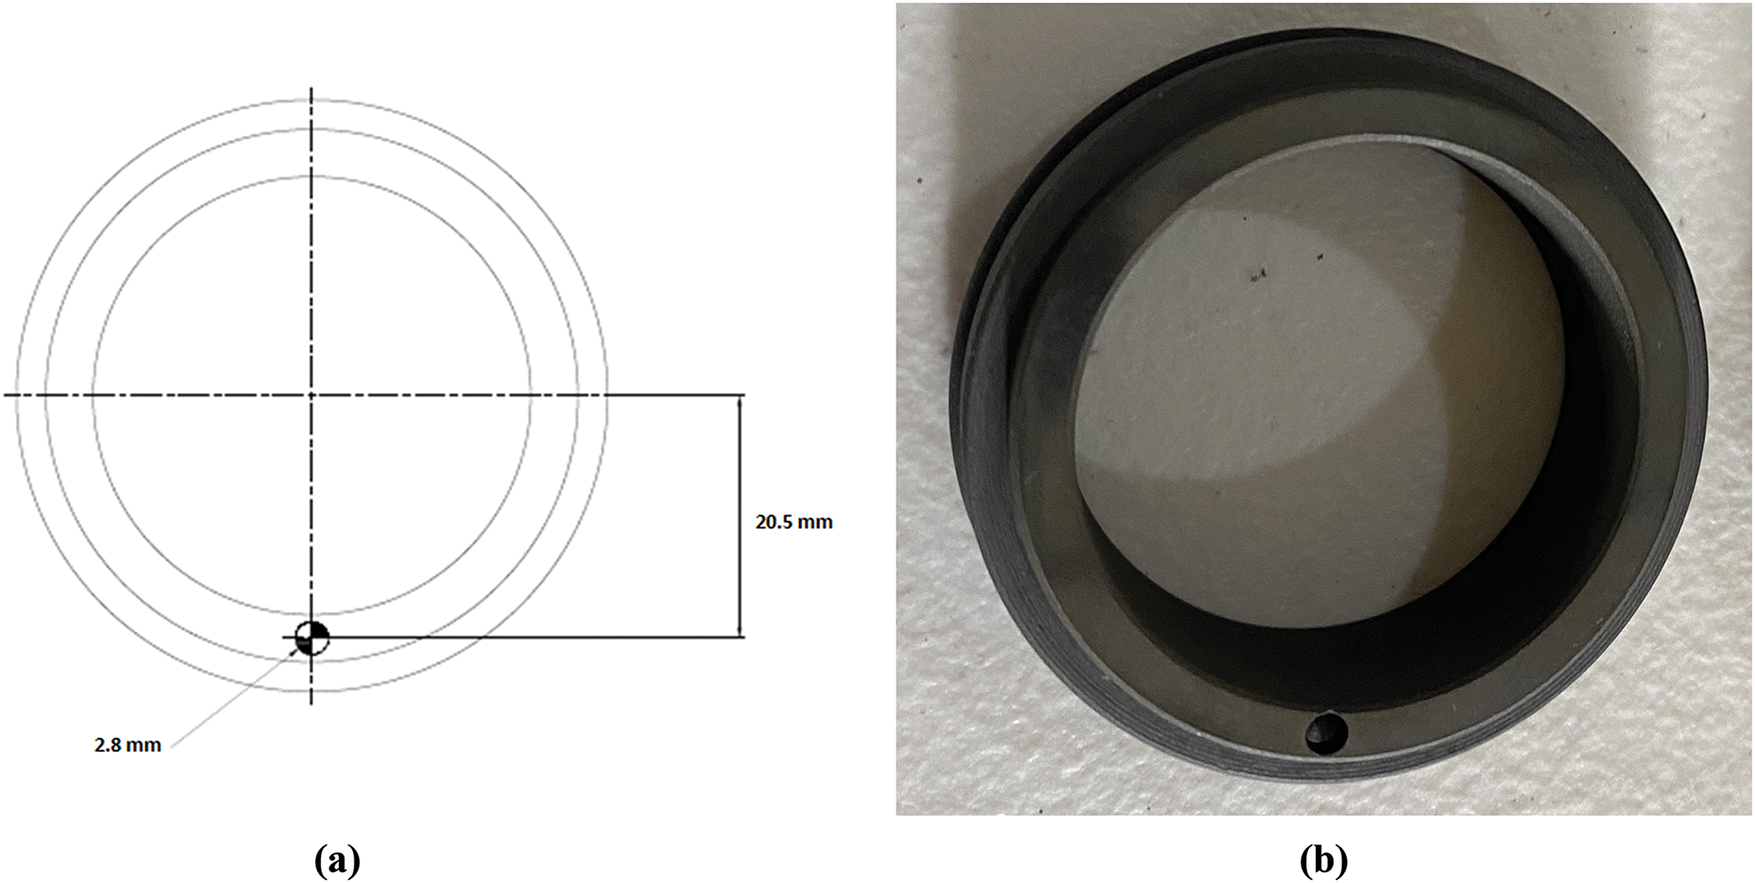
Figure 6: (a) Schematic illustration of MSH; (b) Real view of MSH
In a mechanical seal, the rotating component experiences surface abrasion, whereas the stationary component remains intact. Fig. 7 presents a defect in the form of a scratch, with dimensions of 10 mm in length, 2.8 mm in depth, and 2.5 mm in width. This flaw compromises the seal’s reliability and overall performance. Evaluating such damage is essential for understanding its influence on the efficiency and durability of mechanical seals within pump systems.
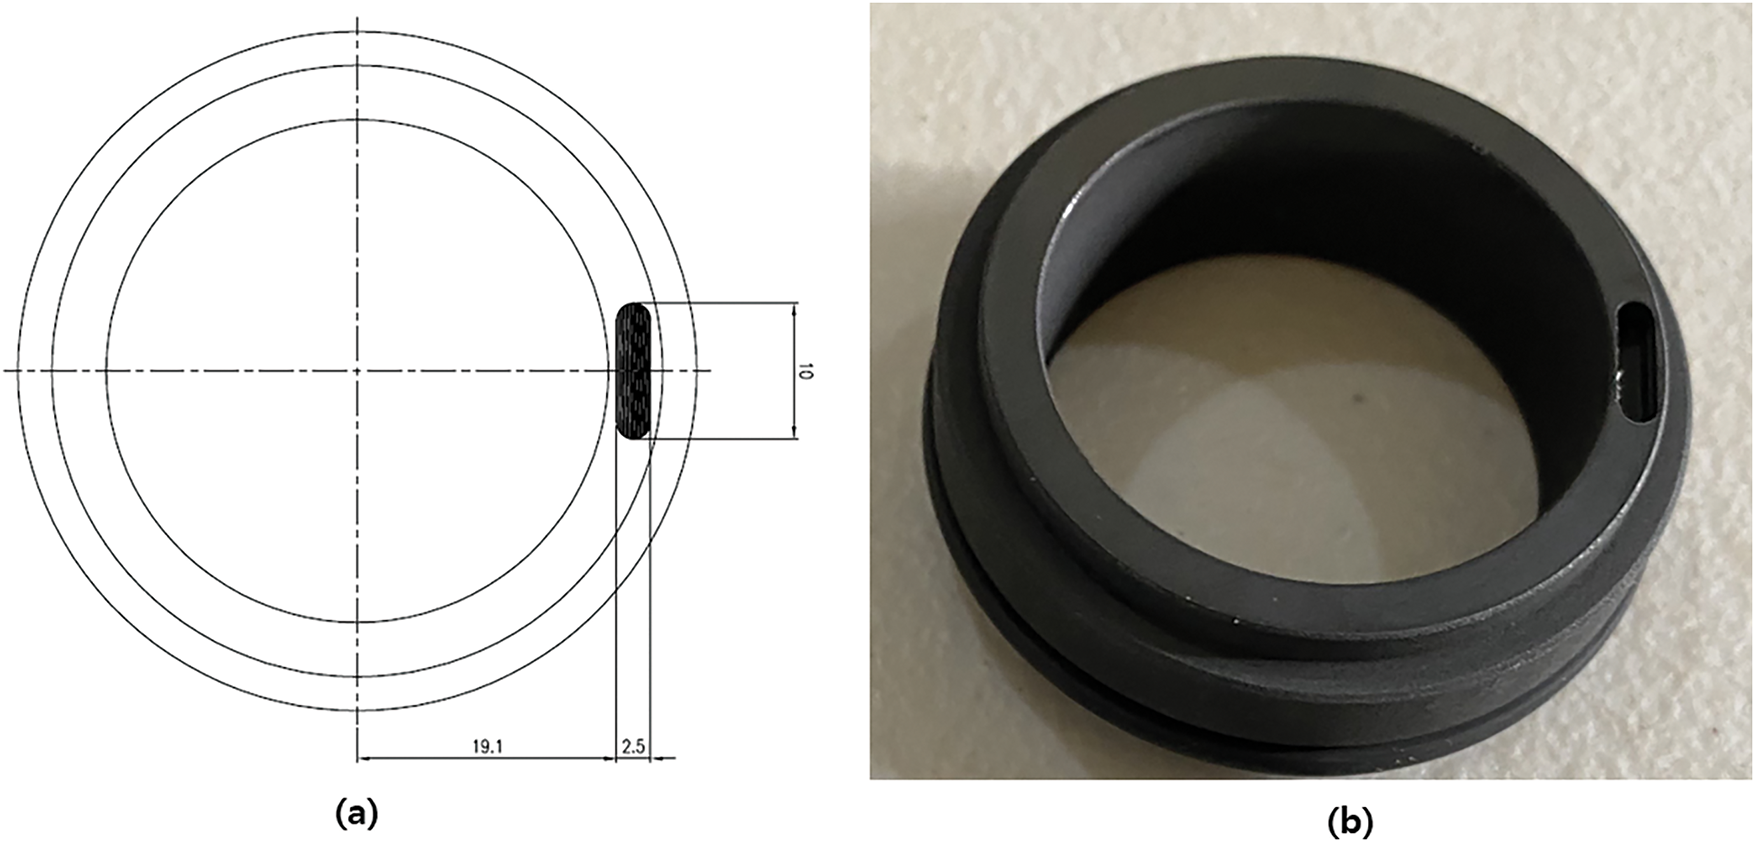
Figure 7: (a) Schematic illustration of MSS; (b) Real view of MSS
Crevice corrosion is a prevalent cause of impeller malfunctions, leading to performance degradation and potential system failures. This type of corrosion leads to the formation of a nonuniform surface on the impeller, characterized by multiple, superimposed apertures of varying dimensions, resembling insect bores in wood, caused by erosion on the impeller’s exterior. The shear stress acting on the material can cause existing holes of different sizes to evolve into significant cracks, leading to fatigue and potentially resulting in a catastrophic collapse of the impeller. A similar corrosion defect was intentionally introduced into an impeller, and VS were recorded to analyze its behavior and performance. This study seeks to understand the impact of crevice corrosion on impeller functionality, providing insights that can aid in developing strategies for early fault detection and enhanced maintenance practices in industrial pump systems.
In the current study, three impellers made of cast iron, each with 161.0 mm of diameter, were utilized. While two remained intact in their original, undamaged condition, a defect was deliberately introduced into the third by removing a specific section of its metal, as illustrated in Fig. 8. The defect was carefully measured, with dimensions of 18 mm in length, 2.8 mm in depth, and 2.5 mm in width, ensuring precise simulation of real-world damage. This intentional modification was implemented to assess the effectiveness of fault detection methods in identifying structural anomalies.
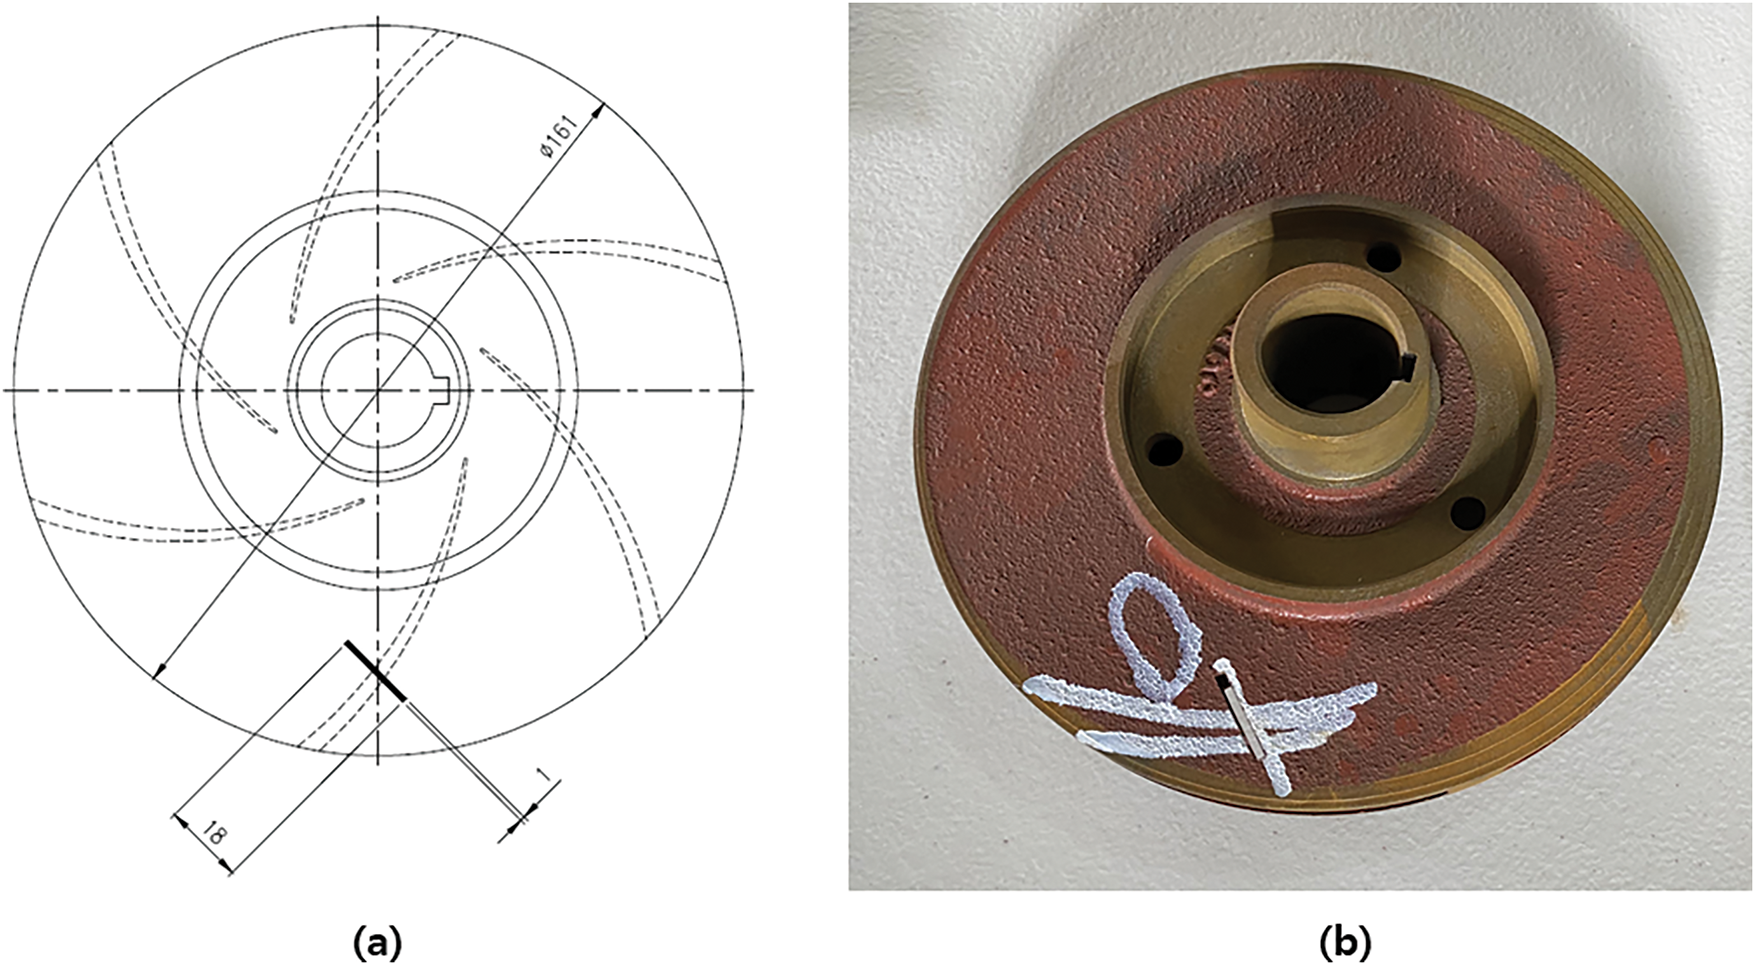
Figure 8: (a) Schematic representation of IF (b) Real view of IF
Fig. 9 displays the VS recorded for normal, MSH, MSS and the IF conditions. The analysis of this VS provides essential insights into how the introduced defect influences impeller performance and overall system behavior. Understanding these effects contributes to refining FD techniques, ultimately improving maintenance strategies and the reliability of pump systems.
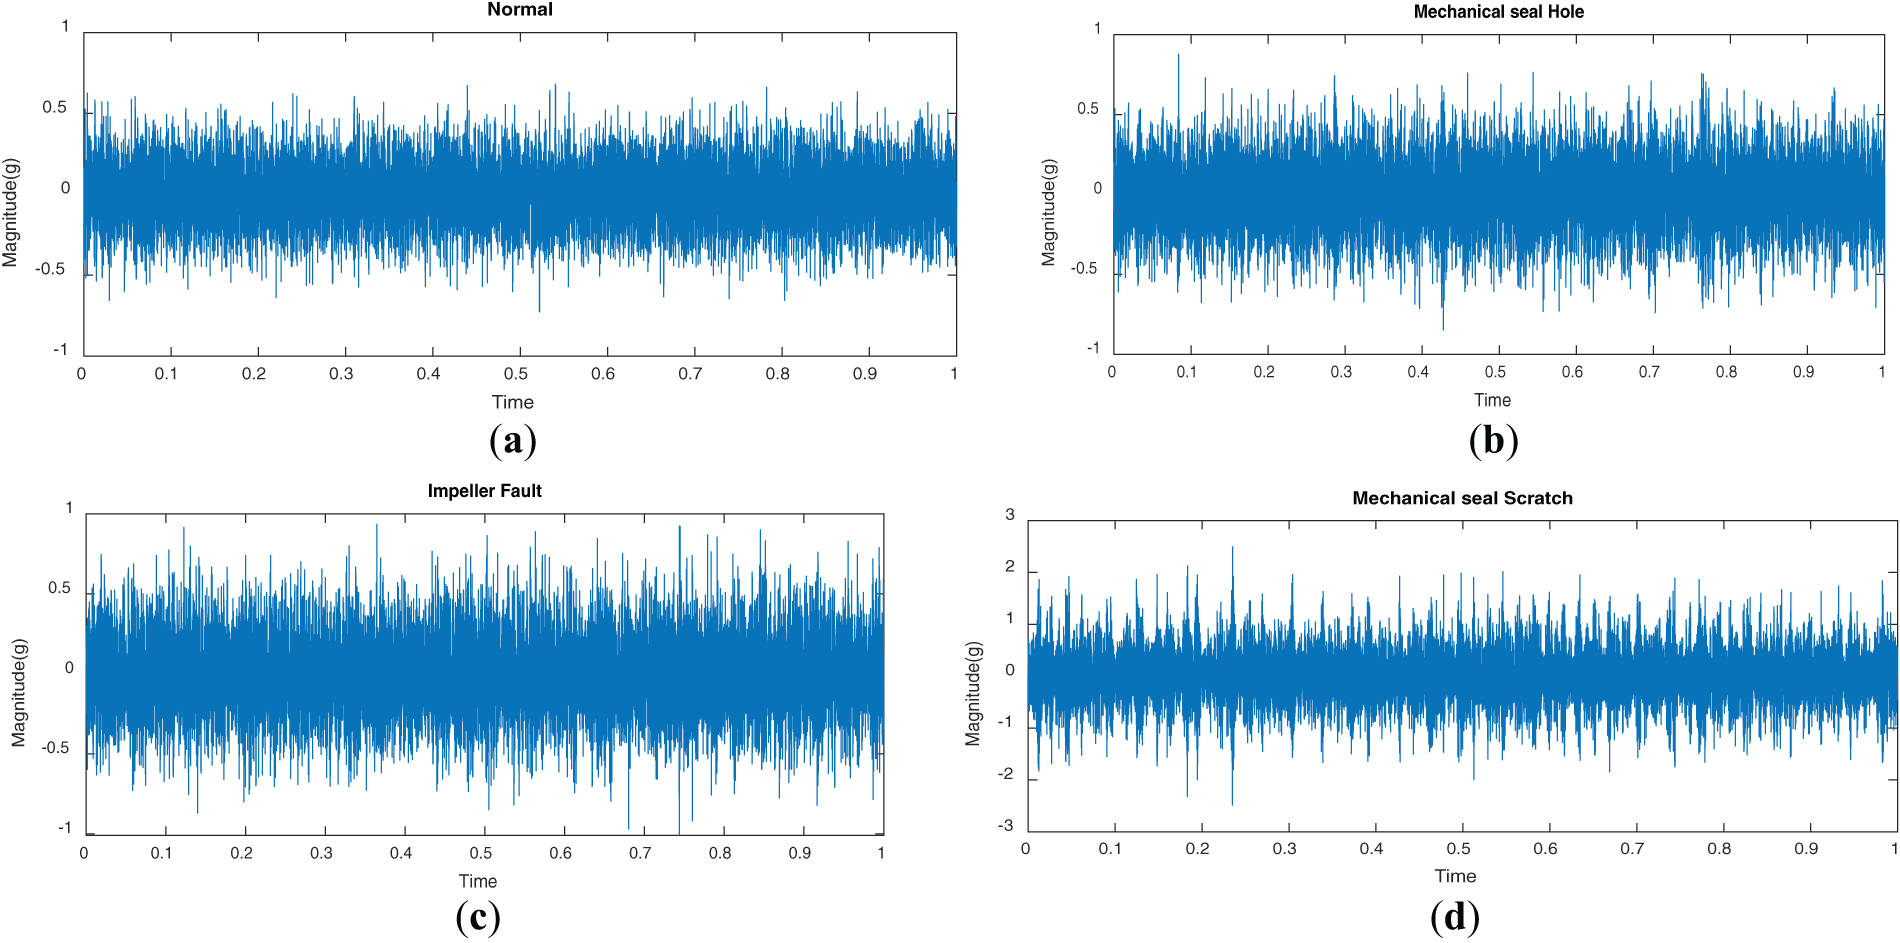
Figure 9: Vibration signals under conditions (a) normal; (b) MSH; (c) IF; (d) MSS
WCA is a signal processing method that examines how two time-series signals are related over time and across different frequencies, using wavelets. This method produces a time-frequency representation of the signals, as shown in Fig. 10. To further define the WCA, is a mathematical method used to break down a signal into its frequency components while also capturing how these frequencies change over time. The Eqs. (2) and (3) for wavelet transformation and for cross-wavelet transformation respectively are as follows:
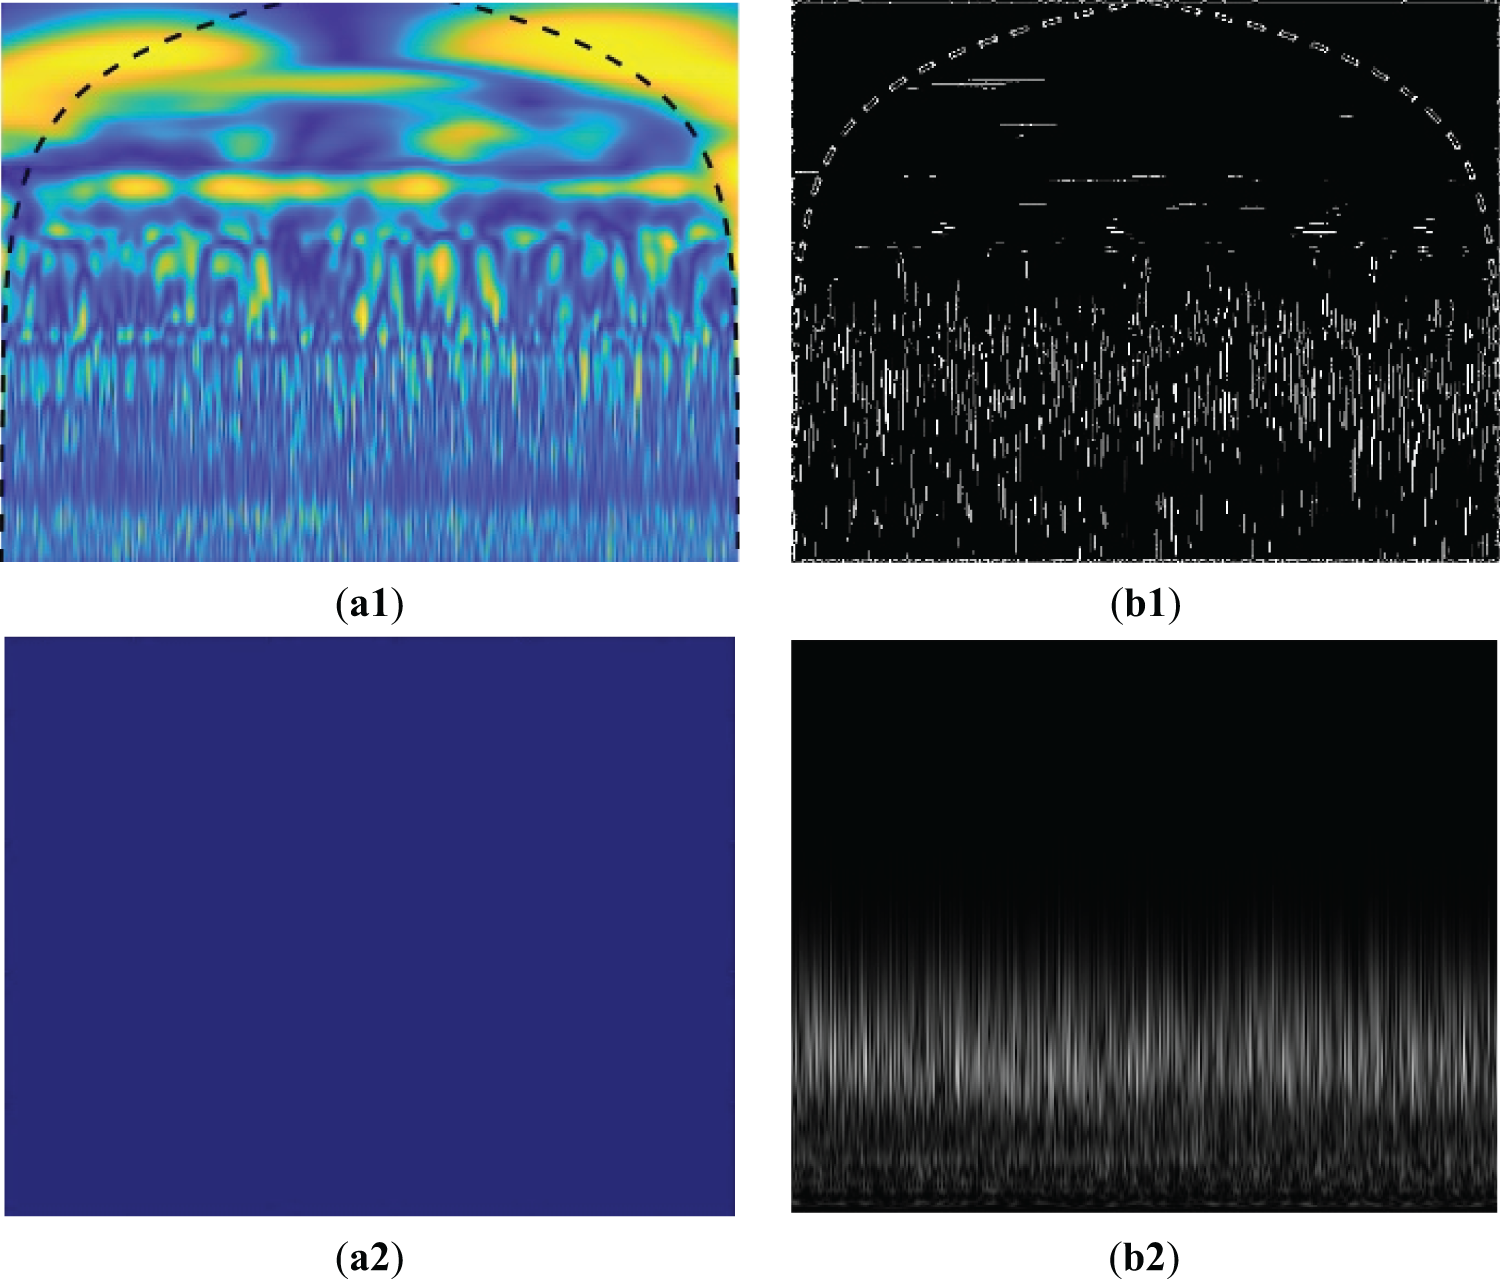
Figure 10: WCA and S-transform scalograms (a1,a2) without filters and (b1,b2) with filters, respectively
In Eqs. (2) and (3), z and y represents the scaling and translation factors respectively whereas the φ(t) denotes the Morlet wavelet function. The coherence function, ranging from 0 to 1, reflects the level of linear correlation across frequencies, with 0 shows no correlation and 1 representing complete correlation. The coherence relationship between
In Eq. (4),
The process begins with the decomposition of both signals into their wavelet coefficients through a wavelet transformation. Next, the cross-wavelet transform is calculated by multiplying the wavelet coefficients of the two signals at each scale and time point. This is followed by computation of the wavelet coherence function, which assesses the correlation between the signals across scales and times. Finally, WCA images are constructed by identifying regions in the time-frequency plane that exhibit significant coherence and highlight these regions with elevated color intensities.
S-transform combines the advantages of both the STFT, and the wavelet transform, providing an improved approach for precise time-frequency analysis. It improves these methods by providing better resolution in both the time and frequency domains. This enhancement enables more accurate detection and localization of signal features, making S-transform particularly useful for applications requiring detailed time-frequency analysis. This technique is often viewed as a “phase-corrected” version of the CWT, improving accuracy in phase-related information. Its capability to preserve phase information makes it especially effective for analyzing non-stationary signals. Consequently, the S-transform is widely applied in fault detection and signal processing tasks. In this framework, the CWT, denoted as
In this context,
As defined, the S-transform of a function h(t) is essentially a CWT that utilizes a specific mother wavelet, combined with a phase factor.
It is important to highlight that the frequency
By applying the S-transform to represent the local spectrum, the overall Fourier spectrum can be derived by averaging these local spectra over time. The S-transform breaks the signal into a sequence of time-frequency segments, where each segment shows the energy level of the signal at a specific frequency within a brief time window. In the S-transform of a VS, brighter areas represent higher energy levels at certain frequencies and time periods.
In the S-transform, brighter regions indicate portions of the VS with higher amplitudes or stronger vibrations, offering important insights into the system’s behavior. Changes in the CP operating conditions resulted in clear variations in the S-transform scalograms, with distinct bright regions emerging in response to these alterations. Fig. 10 presents VS scalograms, highlighting the impact of the filters and offering a comprehensive visualization of the system’s vibrational response.
4.5 Sobel And Wavelet Denoising Filters
VS from a CP is processed into noisy scalograms using the S-transform and WCA. To enhance these scalograms, the Sobel filter is applied as the first step. The Sobel filter is a gradient-based technique used for edge detection that functions by highlighting areas with rapid intensity changes, distinguishing the boundaries of time-frequency components [29]. This filter helps clarify the structural details of the scalograms, which is critical for feature extraction, as it visualizes transitions in the signal, particularly at localized edges. In addition, wavelet denoising is applied to further clean the scalograms. This method works by decomposing the signal into multiple scales using wavelet transforms, allowing separation of noise from significant features. By selectively removing the noise while maintaining important signal characteristics, wavelet denoising helps preserve both time-localized and frequency-domain information, as shown in Fig. 10. The combination of these two filters converts the scalograms to a cleaner, more interpretable format, making it easier for CNN models to accurately detect phenomena like oscillations, transient events, and frequency modulations within the VS.
4.6 Convolutional Neural Networks
CNNs are very effective at capturing local features from data by utilizing convolutional layers with trainable filters, enabling them to detect features like edges, textures, and color variations within the input data. These layers extract hierarchical features, starting from simple patterns at the initial layers to more complex features as the data moves deeper through the network. As a result, CNNs can progressively recognize higher-level patterns, making them highly suitable for tasks like image and signal analysis, where identifying intricate details is critical. Pooling layers, located between the convolutional layers, down-sample the data, enhancing the network ability to manage variations in translation and scale. This structure enables CNNs to detect complex patterns that may be challenging for traditional algorithms or human analysis to recognize [39]. The details of the CNN architecture used in this study are given in Table 3.

CNN model is structured into two primary stages: firstly, feature+ extraction and then classification. The feature extraction phase comprises convolutional, activation, and pooling layers. In deep CNN architectures, these layers are arranged in multiple levels, creating a hierarchy that extracts progressively complex features. The classification phase consists of a MLP with fully connected layers that categorize the processed data. Each layer outputs feature maps that become the input for the following layer. The transformation of data through the CNN is mathematically expressed via the feedforward calculation process [29].
where
In this study, images obtained from both WCA, and S-transform are processed through CNN for feature extraction. CNN applies a series of layers, starting with convolutional layers that utilize filters to detect distinct patterns, followed by activation layers that introduce nonlinearity, and pooling layers that reduce dimensionality while preserving essential details. These steps enable the network to extract features from WCA and S-transform images which are then combined into a unified feature pool, ensuring comprehensive information captured from both sources. These pooled features undergo further refinement to enhance their discriminative ability before being passed to a KAN classifier for final classification. This structured approach improves fault detection accuracy and ensures a more robust diagnosis of CP conditions.
4.7 Kolmogorov-Arnold Networks
KANs are highly effective for classification tasks, particularly when working with complex, high-dimensional data, such as time-frequency scalograms. KANs are proposed as advanced alternatives to MLP and are inspired by the theorem of the Kolmogorov-Arnold representation. Unlike MLPs, which use fixed activation functions on neurons, KANs apply learnable activation functions directly to the edges (weights), replacing standard linear weights with univariate functions, typically modeled as splines. This distinctive design enables KANs to achieve better performance and greater interpretability than MLPs, making them especially well-suited for small-scale AI tasks and scientific applications. KANs can achieve higher or similar accuracy with fewer parameters compared to MLPs in function-fitting tasks and exhibit faster neural scaling laws, improving computational efficiency [40]. The main equation used in a KAN comes from the Kolmogorov-Arnold representation theorem and is written as follows:
In Eq. (10),
In the current study, WCA and S-transform are used to model complex functions and provide a detailed representation of a signal’s characteristics over time and frequency domains. These scalograms are first used to extract relevant features, such as statistical measures and specific frequency components, which capture the intricate details of the signal’s temporal and spectral properties. This rich feature set forms the input for the KAN, enabling it to effectively differentiate between classes. In classification using a KAN, the network architecture is designed with multiple layers, each applying nonlinear transformations to the input features. The network is trained on labeled data to minimize classification errors by adjusting its weights and biases. Once trained, the KAN can classify new instances based on the extracted features, processing them through its layers to produce predicted class labels. The main advantages of using a KAN include its ability to handle nonlinear relationships, scalability to varying levels of model complexity, and robustness in achieving high classification accuracy, even in scenarios with noisy or incomplete data. This makes KANs an excellent choice for the detailed feature sets derived from time-frequency scalograms for accurate classification. The entire working process of a KAN is illustrated in Table 4 as follows.

Developing appropriate training and testing subsets is essential for evaluating the proposed approach for identifying CP health conditions. This study introduces an intelligent framework that combines WCA with DL techniques for FD in CPs. The framework incorporates key components to ensure accurate FD and improved feature extraction. WCA is used to create images that capture coherence patterns between frequency components. These images are then processed using DL methods, particularly CNNs, to extract discriminative features for more effective classification. The dataset consists of 1247, 1324, and 1287 WCA and s-transform images, categorized into four fault conditions: IF, MSH, MSS, and Normal, recorded at pressures of 3.0, 3.5, and 4.0 bar, respectively. These images provide a diverse set of fault signatures, ensuring a fair evaluation of the proposed method. Features extracted from the scalograms of WCA, and S-transform undergo additional preprocessing using the Sobel function and non-local means filters, which enhance edge detection and noise reduction, respectively. The processed features are then combined into a feature pool, ensuring a more discriminative representation before classification. A KAN classifier is used for the final classification task, utilizing the enriched feature set for improved FD accuracy. The dataset is split into training and testing parts, with 20% set aside for testing to fairly assess the model’s performance. Fig. 11 presents the proposed model’s performance, illustrating the accuracy and loss trends for both training and validation over multiple epochs, providing insight into the model’s learning progression and generalization capability.
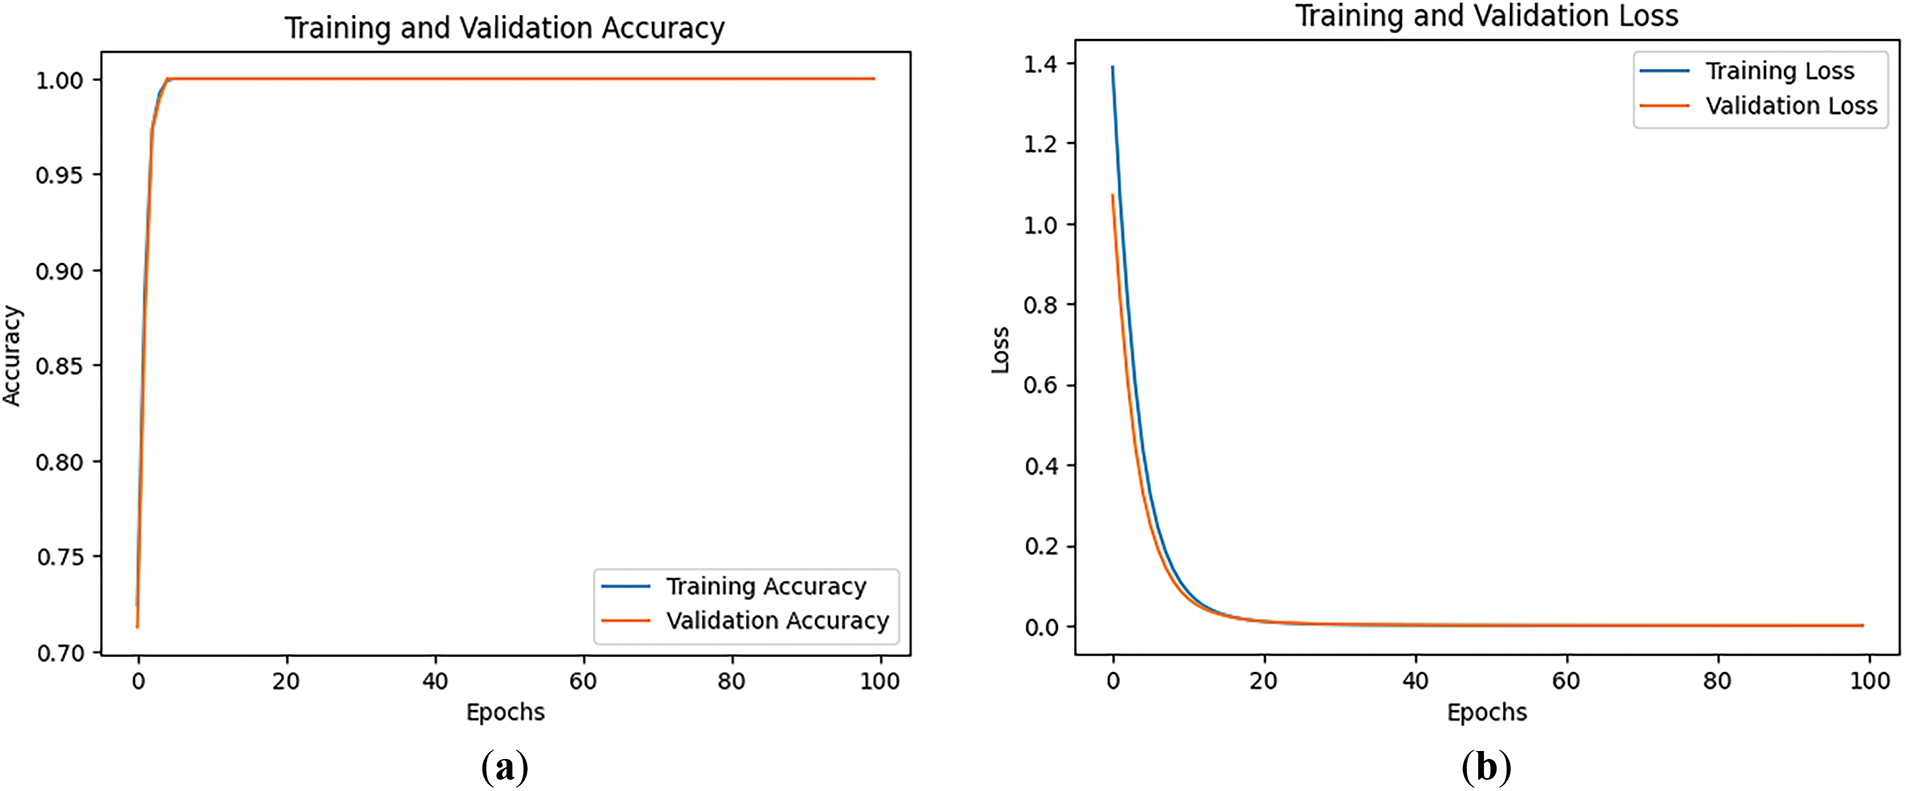
Figure 11: Performance of the proposed model: (a) Accuracy, and (b) Loss plotted against the number of training epochs
To evaluate the trade-off between model complexity and diagnostic performance, a comparative analysis was conducted using simplified model variants: (A) WCA + CNN + Softmax, (B) S-transform + CNN + Softmax, (C) WCA + S-transform + CNN, and (D) the proposed full model integrating WCA, S-transform, CNN, and KAN. The results demonstrate that the proposed model (D) achieves the highest performance outperforming the simpler configurations by 1%–3% while incurring only a marginal increase in inference time (~2–6 ms per sample). The total end-to-end inference time of approximately 0.59 s per sample confirms the model’s practicality for near-real-time diagnostics in industrial settings. These findings validate the efficiency and effectiveness of the proposed multi-stage hybrid framework for near-real-time industrial FD.
This integrated approach ensures precise fault detection and diagnosis, improved feature extraction through time-frequency scalograms, and efficient fault classification using the KAN algorithm. The effectiveness of the proposed method is assessed by comparing it with traditional techniques across multiple performance metrics. The mathematical expressions for these metrics are provided in Eqs. (11)–(14).
In classification, a true positive (TP) occurs when the classifier correctly identifies a positive sample, ensuring an accurate detection of the intended condition. Similarly, a true negative (TN) refers to the correct classification of a negative sample, confirming the absence of the targeted condition. Conversely, a false positive (FP) happens when the classifier labels a negative sample as positive, leading to a misclassification that may result in unnecessary corrective actions. A false negative (FN), on the other hand, arises when a positive sample is mistakenly identified as negative, potentially causing critical faults to go undetected. Understanding these classification outcomes is essential for evaluating the performance and reliability of FD models.
To evaluate the performance of the proposed model, a comparative analysis was conducted against the approach developed by Weifang Sun et al. [41], which utilized a FD technique based on transformed 2D vibrational signal matrices within a similar experimental framework. Their method aimed to reduce interference using a mean curvature algorithm, extract fault features through Histograms of Oriented Gradients (HOG), and classify faults automatically using SVM. When evaluated on the current dataset, Weifang Sun’s model achieved an accuracy of 96.65%, with a precision of 96.77%, recall of 96.57%, and an F1-score of 96.43%. However, slightly lower performance was expected due to substantial noise in the vibrational signals, affecting the model’s ability to accurately extract fault patterns. Additionally, the scalograms used in their method lacked precise energy distribution and critical phase information, further limiting the overall diagnostic effectiveness.
In 2023, a specialized experimental setup was utilized by Manikandan et al. [42] conducted a comprehensive study on vibration-based FD in industrial mono-block CPs, with the objective of advancing machine learning algorithms. The research began by collecting VS from a defect-free pump under normal operating conditions. The study then prioritized the diagnosis of two critical faults: a broken impeller and seal failure. These faults were systematically introduced into the pump, and the resulting VS were captured. To enable more detailed analysis, the signals were converted into 2D images using a novel image processing technique. When applied to our dataset, this method achieved notable results, including an accuracy of 88.83%, precision of 89.08%, recall of 88.83%, and an F1 score of 89.92%. These outcomes highlight the model’s effectiveness in accurately diagnosing CP faults, demonstrating its potential to improve maintenance and reliability in industrial applications. This study emphasizes the value of using VS and advanced image processing techniques for FD, setting a high benchmark for future research in this domain.
Furthermore, in 2024, Umar et al. [30] conducted an in-depth investigation into FD of milling cutting tools using a hybrid DL framework combining CNN and BiLSTM networks. The study focused on effectively learning both spatial features from vibration scalograms and temporal dependencies inherent in sequential data. By utilizing this dual architecture, the model demonstrated better diagnostic performance on benchmark datasets. When evaluated on our lab CP dataset, the CNN-BiLSTM model achieved an accuracy of 97.84%, precision of 97.88%, recall of 97.88%, and an F1 score of 97.88%, significantly outperforming conventional single-architecture approaches.
In contrast, the proposed model demonstrated significant advantages utilizing WCA and S-transform images for better time-frequency resolution and enhanced transient event detection. The model integrates WCA, S-transform scalograms, Sobel function, and non-local means filters to capture intricate fault signatures from VS. CNNs treat these scalograms as image inputs, extracting essential features for fault classification, which are then fed into a KAN classifier. The results of the proposed method, as illustrated in Table 5, show a clear superiority over the reference methods, particularly in terms of classification accuracy. This enhanced performance is due to the integration of extracted features into a unified hybrid feature set, which allows the method to capture more relevant and diverse patterns from the data. As a result, the proposed approach achieves significant improvements across all evaluation metrics. This method not only surpasses traditional FD techniques but also demonstrates strong potential for industrial applications, particularly in predictive maintenance. Its ability to generalize across different datasets and operating conditions highlights its robustness, making it a valuable solution for industries reliant on the continuous operation of machinery, such as centrifugal pumps and motors. The improved fault detection ensures earlier identification of issues, ultimately reducing downtime and maintenance costs.

The study uses confusion matrices to comprehensively evaluate the classification performance of the proposed model in comparison to the reference models across all pressure conditions, as shown in Fig. 12. These matrices provide a clear visualization of correctly and incorrectly classified instances for each fault category, offering valuable insights into the model’s effectiveness. The proposed model demonstrates consistently higher classification accuracy, with minimal misclassifications, indicating its ability to accurately distinguish between different fault types. In contrast, the reference models exhibit a higher number of misclassifications, particularly when differentiating between fault types with similar characteristics, suggesting limitations in their ability to capture subtle fault signatures. The confusion matrices further reveal that the reference models struggle with distinguishing closely related conditions, leading to a reduction in diagnostic reliability. The superior performance of the proposed model across all fault categories reinforces its robustness and effectiveness in fault classification, ensuring more accurate and reliable fault detection in CPs.
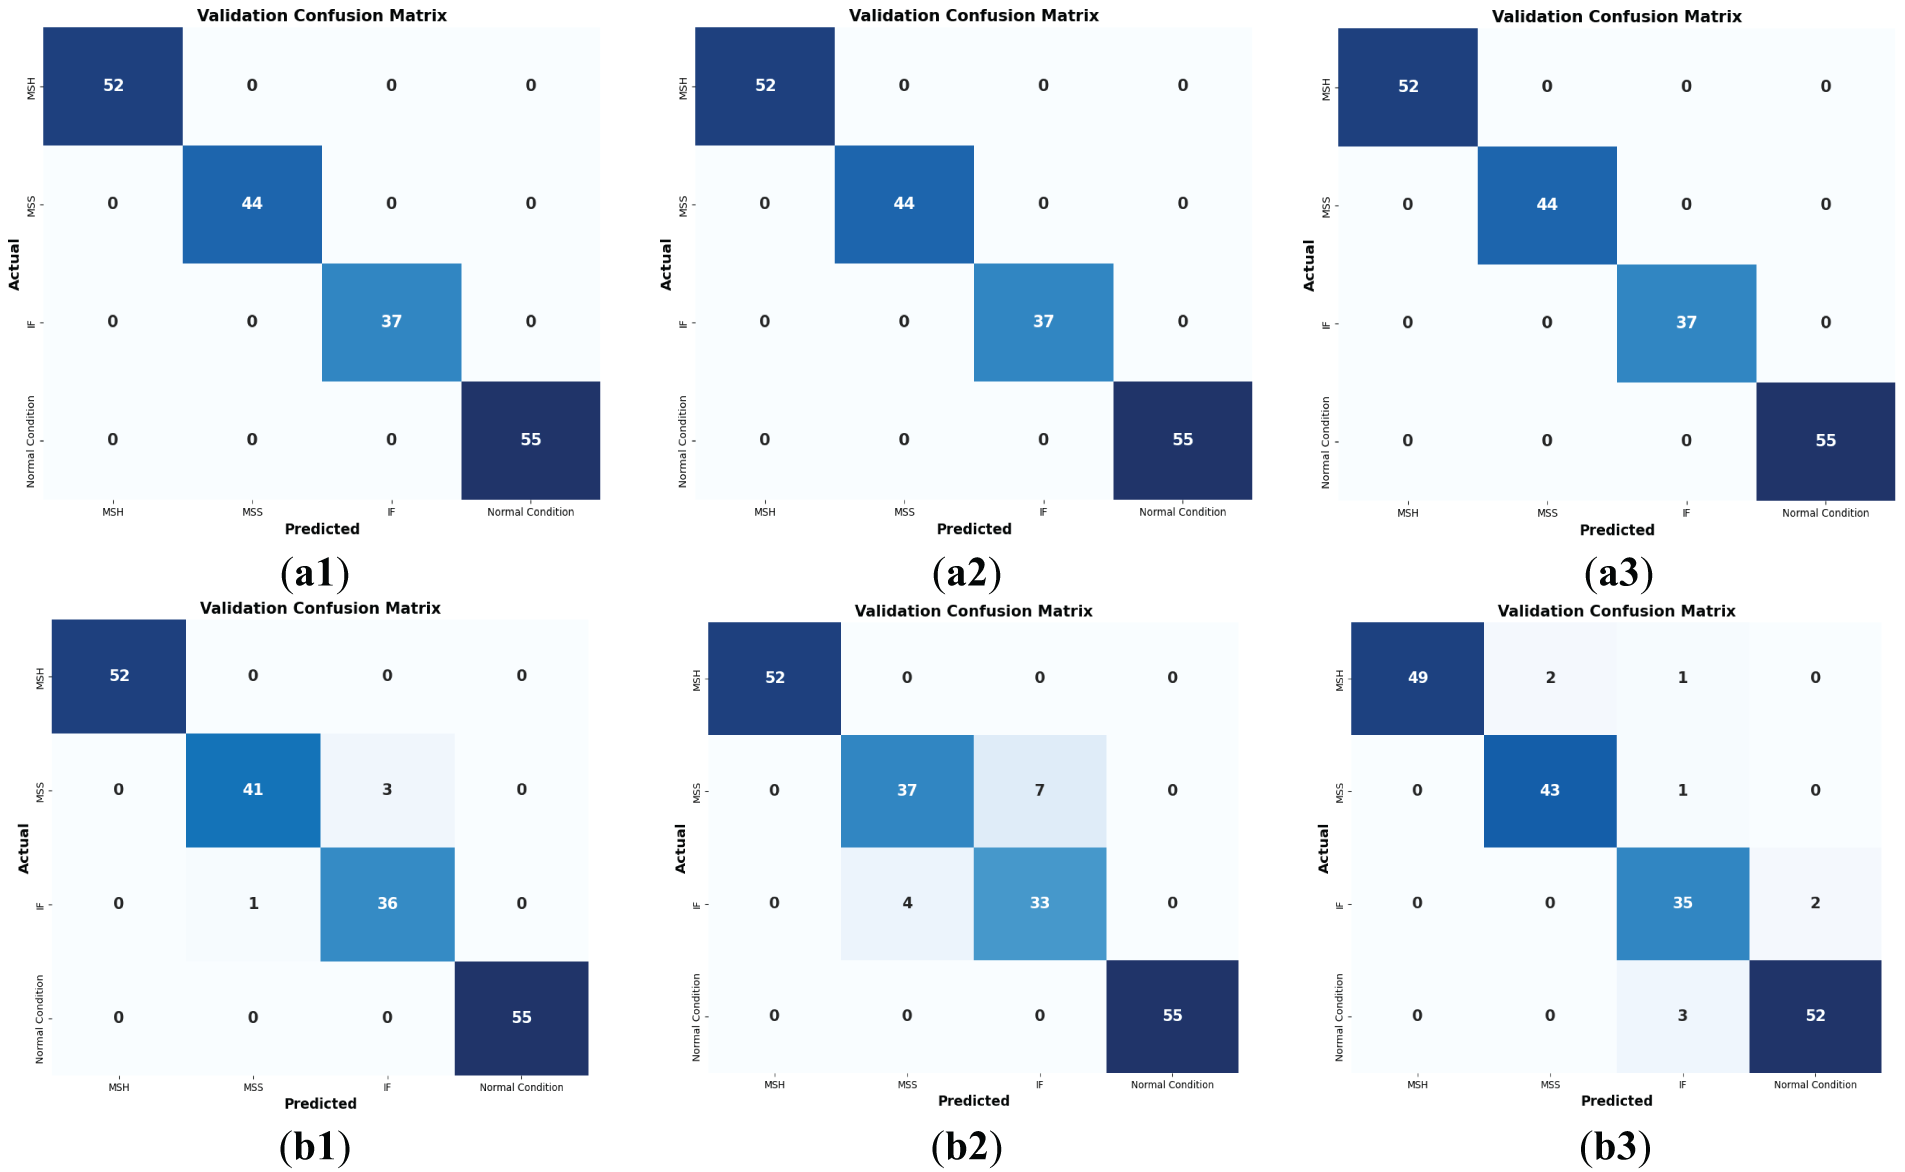

Figure 12: Confusion matrix comparison of (a) the Proposed Model; (b) Weifang Sun’s method; and (c) Manikandan’s method across datasets recorded at (1) 3.0 bar, (2) 3.5 bar, and (3) 4.0 bar pressure levels. The results highlight the proposed model’s better classification accuracy and reduced misclassification across all pressure conditions
Furthermore, t-SNE plots are utilized to perform a detailed comparative analysis of the feature spaces learned by different models, offering a clear visual depiction of the proposed model’s effectiveness in distinguishing fault types relative to reference approaches. Each point in the plot corresponds to a specific fault condition in CPs, revealing the degree of class separability and feature clustering achieved by the models. By projecting high-dimensional feature representations into a lower-dimensional space, t-SNE effectively captures the extent to which different models differentiate between fault categories. This visualization highlights the distribution and separation of features under varying operational conditions, offering insights into the model’s ability to discern fault patterns. While all models demonstrate the capability to distinguish between healthy and faulty states, the reference models exhibit challenges in differentiating between fault types with subtle variations. Misclassifications are more frequent in cases where fault characteristics overlap, indicating limitations in feature extraction and classification. In contrast, the proposed model not only successfully identifies healthy and faulty conditions but also achieves a precise separation between various fault categories, a crucial aspect for effective FD and predictive maintenance. Fig. 13 presents these t-SNE plots, showcasing the enhanced classification performance of the proposed model compared to the reference models across three distinct dataset conditions. The visualizations clearly depict how the proposed approach attains a more structured and accurate fault separation, reinforcing its superiority in handling complex fault classification tasks. These results further validate the robustness of the model in industrial applications, ensuring improved fault detection and reliability in CP systems. The study also utilizes receiver operating characteristic (ROC) curves, as shown in Fig. 14, to further validate the better performance of the proposed model compared to the reference models across all pressure conditions of the dataset.

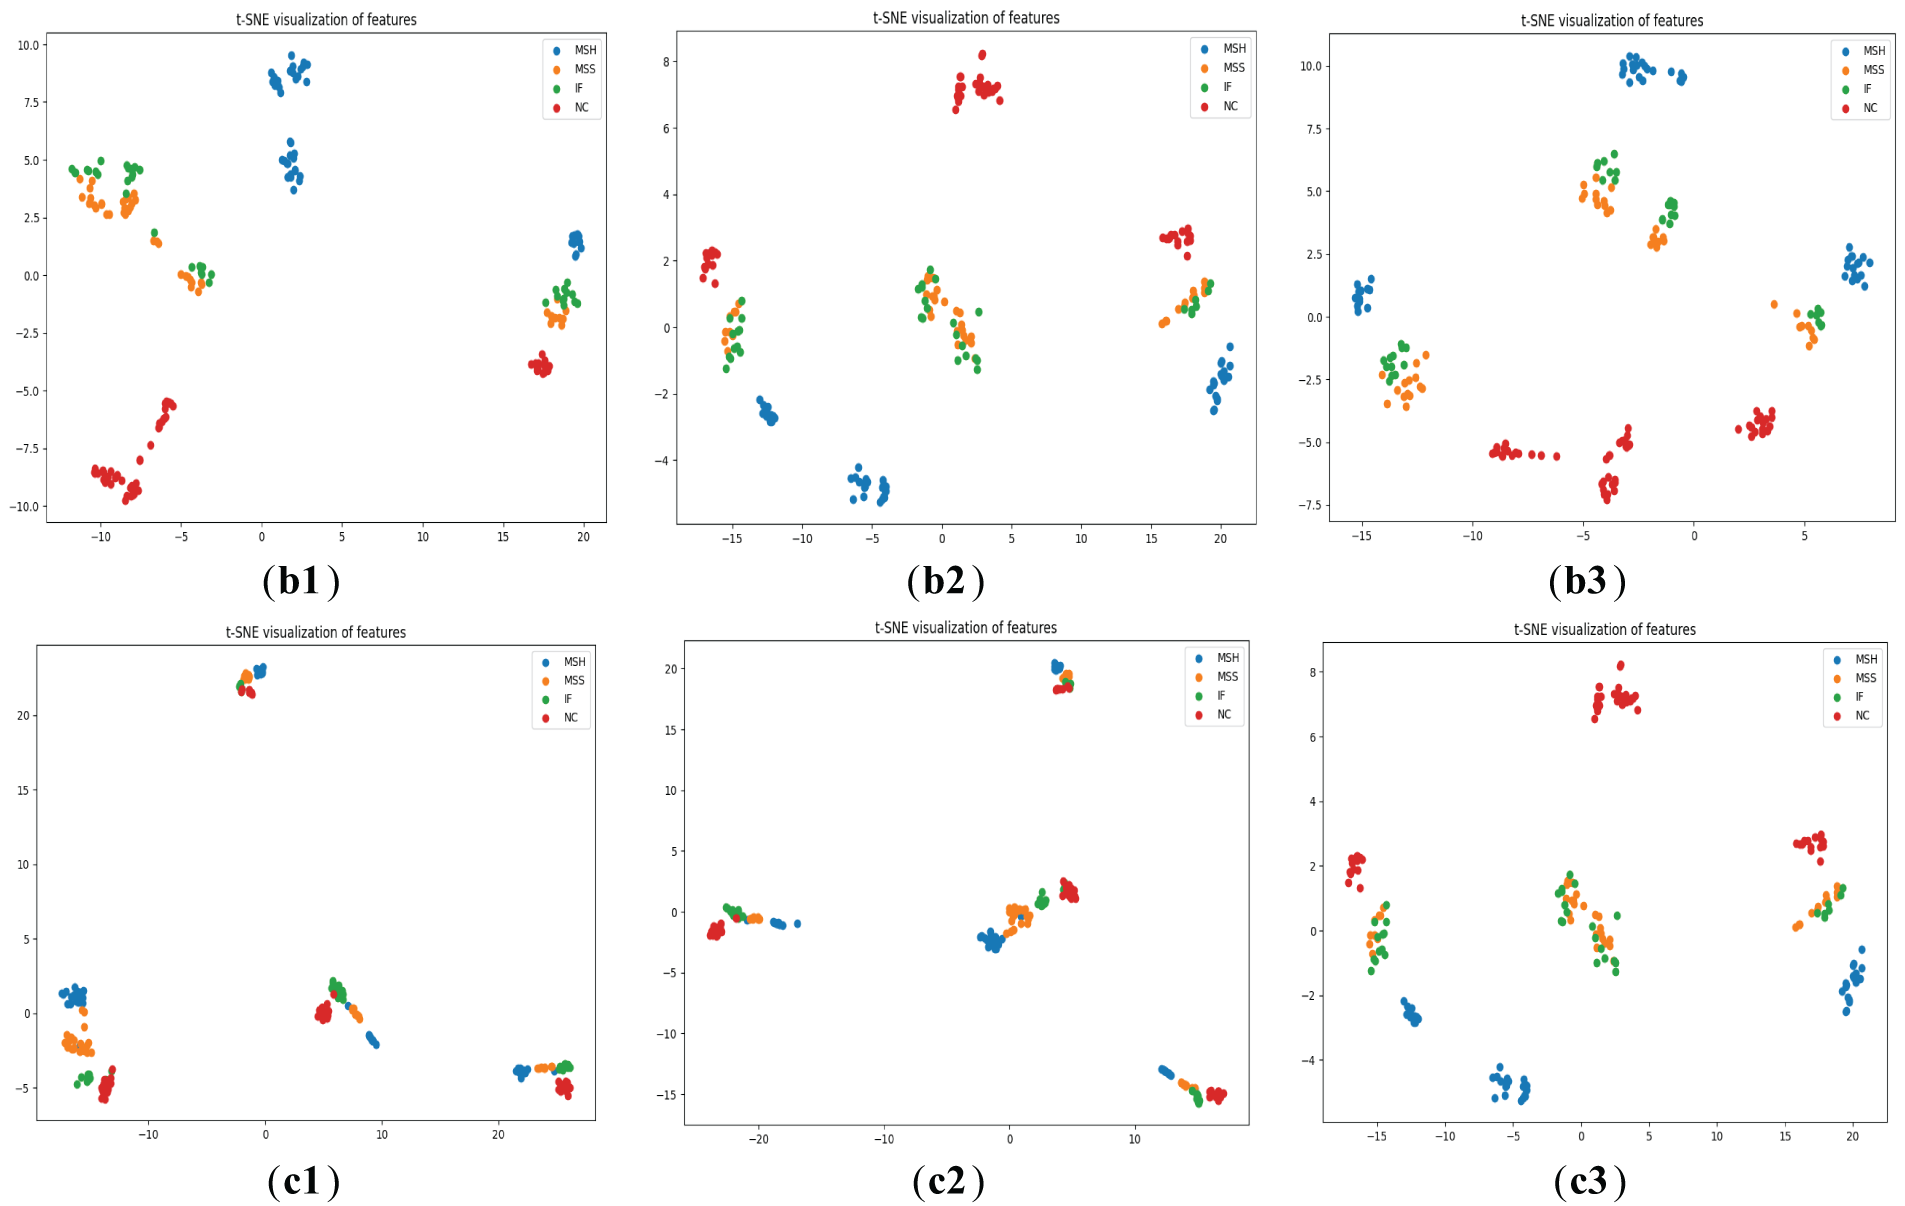
Figure 13: t-SNE plot comparison of (a) the proposed model, (b) Weifang Sun’s method, and (c) Manikandan’s method across datasets collected at pressure levels of (1) 3.0 bar, (2) 3.5 bar, and (3) 4.0 bar. The visualizations demonstrate the superior feature clustering and class separability achieved by the proposed model under varying operational pressures
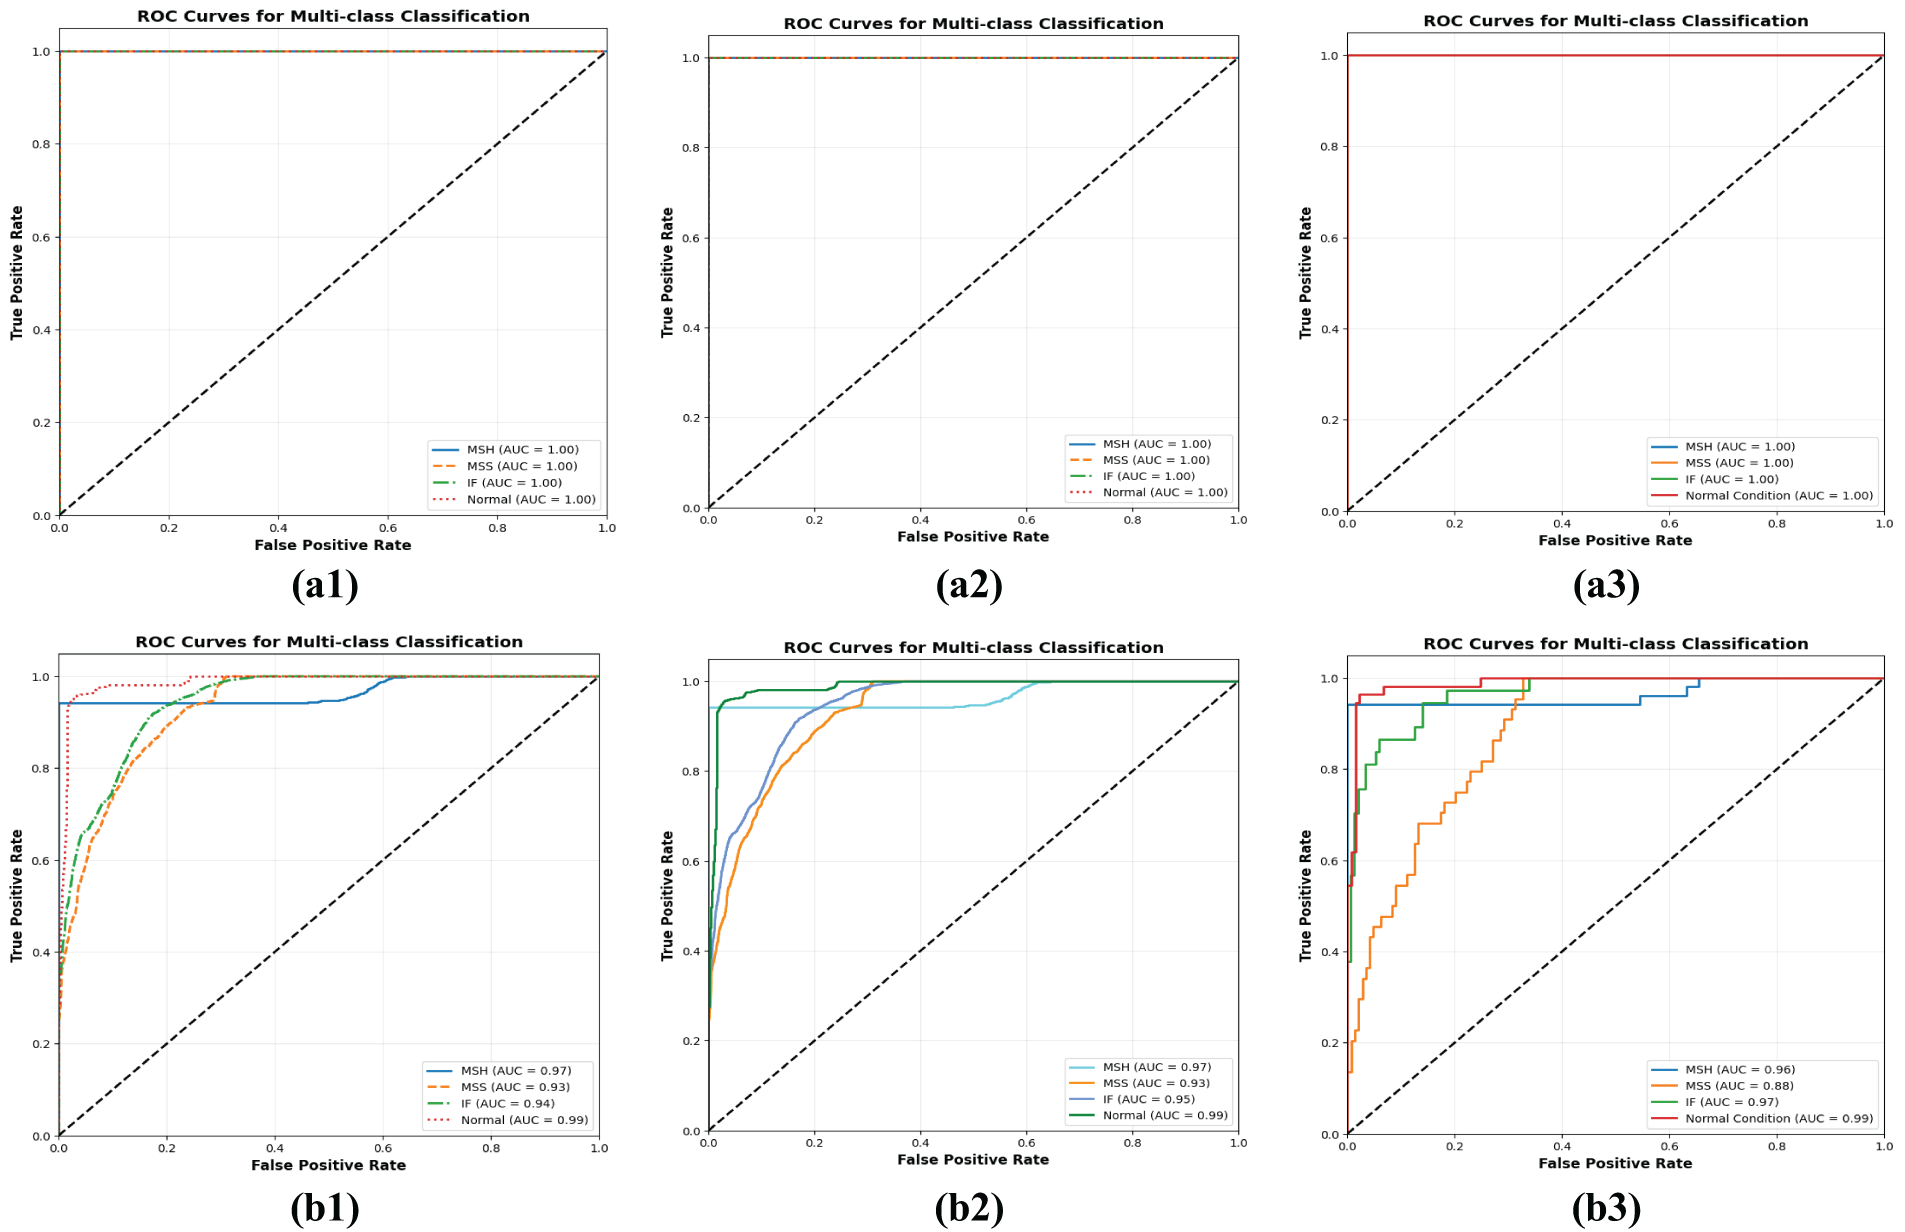

Figure 14: Comparative ROC curves of (a) the proposed model; (b) Weifang Sun’s approach; and (c) Manikandan’s method for datasets obtained at (1) 3.0 bar, (2) 3.5 bar, and (3) 4.0 bar operating pressures. The plots highlight the superior discriminative capability of the proposed model under varying pressure conditions
The ROC curves provide a detailed evaluation of classification performance by illustrating the trade-off between true positive rates (sensitivity) and false positive rates across various fault types. The proposed model demonstrates consistently higher Area Under the Curve (AUC) scores, reflecting its superior capability in accurately identifying and separating different fault conditions. Conversely, the reference models exhibit comparatively lower AUC values, particularly when distinguishing between similar or overlapping fault categories, resulting in increased false positives. These observations highlight the robustness and reliability of the proposed approach, especially in scenarios involving subtle fault variations.
In summary, the proposed FD method demonstrates significant advancements over existing approaches by effectively integrating WCA and S-transform scalograms with advanced image preprocessing and deep learning-based classification. The framework leverages non-local means filtering and Sobel edge enhancement to reduce noise and highlight fault-relevant features within time-frequency representations. These enhanced scalograms are then fed into a deep learning architecture for robust feature extraction and classification, enabling the model to learn complex and subtle fault patterns that are often missed by conventional techniques. Comparative evaluations against state-of-the-art reference models clearly highlight the superior performance of the proposed approach, achieving higher accuracy, precision, and recall across all fault categories. The reduction in misclassification rates, particularly in distinguishing closely related fault types, underlines the model’s discriminative capability. This is further supported by visual analyses including confusion matrices, t-SNE projections, and ROC curves, which illustrate well-separated feature clusters and high true positive rates, validating the robustness of the proposed method under varying fault conditions. Importantly, the model exhibits strong generalization ability, making it highly applicable for real-time predictive maintenance in centrifugal pump systems. By identifying incipient and severe faults, the method contributes to minimizing unplanned downtime, optimizing operational reliability, and reducing maintenance costs in industrial environments. To further test its adaptability, the model was also validated on the publicly available Paderborn dataset, which includes different fault types and operating conditions. The model maintained high classification performance and consistency, confirming that its effectiveness is not limited to the original experimental setup but extends to other benchmark datasets as well. While a formal sensitivity analysis of the filtering parameters was not conducted, the empirically selected values used for preprocessing yielded stable, high-performing outcomes across datasets. This further emphasizes the robustness and reliability of the designed preprocessing strategy and supports the practical deployment of the proposed framework in diverse real-world fault diagnosis applications.
This study presents an advanced fault diagnosis method designed to enhance both the effectiveness and consistency of fault identification in centrifugal pumps, ensuring efficient monitoring and predictive maintenance. Vibration signals are transformed into scalograms using WCA and S-transform, followed by sobel and non-local means filtering to capture intricate fault signatures. The features extracted from both wavelet coherent analysis and Stockwell transform are first combined in a feature pool to preserve critical fault-related information before classification. A CNN is used for feature extraction, and KAN is used for classification, ensuring precise fault identification. Experimental validation demonstrates classification accuracies of 100%, 99.86%, and 99.92% across three datasets, highlighting the model’s robustness and generalizability. The classification reports as well as confusion matrices, t-SNE and ROC curves reveal a significant reduction in misclassifications compared to traditional models, further reinforcing its reliability. This approach surpasses conventional FD techniques, making it a promising solution for predictive maintenance and real-world industrial applications.
Future research should focus on translating the proposed method to real-world industrial settings by addressing practical constraints such as sensor placement, hardware availability, and continuous data acquisition. Deployment of edge-computing platforms and adaptation to streaming data environments will be explored to enable real-time and resource-efficient fault monitoring. Additionally, investigating the scalability of the method in large-scale installations and enhancing its capability to operate effectively with lower-resolution or cost-effective sensors will further support its industrial integration. The model’s sensitivity to early-stage or low-severity faults and its capability to detect compound or simultaneous faults will also be systematically evaluated. Furthermore, the study will be extended to incorporate widely prevalent fault types such as bearing defects, cavitation, impeller cracks, and structural looseness, thereby broadening its applicability to more complex and realistic industrial environments.
Acknowledgement: The authors appreciate UIAI laboratory members for their technical assistance.
Funding Statement: This work was supported by the Technology Innovation Program (20023566, ‘Development and Demonstration of Industrial IoT and AI-Based Process Facility Intelligence Support System in Small and Medium Manufacturing Sites’) funded by the Ministry of Trade, Industry, & Energy (MOTIE, Republic of Korea).
Author Contributions: Conceptualization, Muhammad Farooq Siddique, Saif Ullah, and Jong-Myon Kim; methodology, Muhammad Farooq Siddique, Saif Ullah, and Jong-Myon Kim; validation, Muhammad Farooq Siddique, Saif Ullah, and Jong-Myon Kim; formal analysis, Muhammad Farooq Siddique, Saif Ullah, and Jong-Myon Kim; resources, Muhammad Farooq Siddique, Saif Ullah, and Jong-Myon Kim; writing—original draft preparation, Muhammad Farooq Siddique, Saif Ullah, and Jong-Myon Kim; writing—review and editing, Jong-Myon Kim; visualization, Muhammad Farooq Siddique, Saif Ullah, and Jong-Myon Kim; project administration, Jong-Myon Kim; funding acquisition, Jong-Myon Kim. All authors reviewed the results and approved the final version of the manuscript.
Availability of Data and Materials: The data supporting this study are described in Section Dataset Description.
Ethics Approval: Not applicable.
Conflicts of Interest: The authors declare no conflicts of interest to report regarding the present study.
Nomenclature
| KAN | Kolmogorov-Arnold Network |
| CWT | Continuous Wavelet Transform |
| WCA | Wavelet Coherent Analysis |
| FFT | Fast Fourier Transform |
| DL | Deep Learning |
| FD | Fault Diagnosis |
| VS | Vibration Signal |
| ANN | Artificial Neural Network |
| IoT | Internet of Things |
| MLP | Multi-layer Perceptron |
| S-transform | Stockwell Transform |
References
1. Sunal CE, Dyo V, Velisavljevic V. Review of machine learning based fault detection for centrifugal pump induction motors. IEEE Access. 2022;10(2):71344–55. doi:10.1109/access.2022.3187718. [Google Scholar] [CrossRef]
2. Muralidharan V, Sugumaran V, Indira V. Fault diagnosis of monoblock centrifugal pump using SVM. Eng Sci Technol Int J. 2014;17(3):152–7. doi:10.1016/j.jestch.2014.04.005. [Google Scholar] [CrossRef]
3. Ullah N, Ahmad Z, Siddique MF, Im K, Shon DK, Yoon TH, et al. An intelligent framework for fault diagnosis of centrifugal pump leveraging wavelet coherence analysis and deep learning. Sensors. 2023;23(21):8850. doi:10.3390/s23218850. [Google Scholar] [PubMed] [CrossRef]
4. McKee KK, Forbes GL, Mazhar I, Entwistle R, Howard I. A review of machinery diagnostics and prognostics implemented on a centrifugal pump. In: Engineering asset management. London, UK: Springer; 2013. p. 593–614. doi:10.1007/978-1-4471-4993-4_52. [Google Scholar] [CrossRef]
5. Ong P, Tan YK, Lai KH, Sia CK. A deep convolutional neural network for vibration-based health-monitoring of rotating machinery. Decis Anal J. 2023;7(17):100219. doi:10.1016/j.dajour.2023.100219. [Google Scholar] [CrossRef]
6. Vashishtha G, Kumar R. Centrifugal pump impeller defect identification by the improved adaptive variational mode decomposition through vibration signals. Eng Res Express. 2021;3(3):035041. doi:10.1088/2631-8695/ac23b5. [Google Scholar] [CrossRef]
7. Kumar A, Gandhi CP, Tang H, Sun W, Xiang J. Latest innovations in the field of condition-based maintenance of rotatory machinery: a review. Meas Sci Technol. 2024;35(2):022003. doi:10.1088/1361-6501/ad0f67. [Google Scholar] [CrossRef]
8. Vashishtha G, Chauhan S, Yadav N, Kumar A, Kumar R. A two-level adaptive chirp mode decomposition and tangent entropy in estimation of single-valued neutrosophic cross-entropy for detecting impeller defects in centrifugal pump. Appl Acoust. 2022;197(3):108905. doi:10.1016/j.apacoust.2022.108905. [Google Scholar] [CrossRef]
9. Rapur JS, Tiwari R. Experimental fault diagnosis for known and unseen operating conditions of centrifugal pumps using MSVM and WPT based analyses. Measurement. 2019;147(5–6):106809. doi:10.1016/j.measurement.2019.07.037. [Google Scholar] [CrossRef]
10. Wang S, Shuai H, Hu J, Zhang J, Liu S, Yuan X, et al. Few-shot fault diagnosis of axial piston pump based on prior knowledge-embedded meta learning vision transformer under variable operating conditions. Expert Syst Appl. 2025;269(3):126452. doi:10.1016/j.eswa.2025.126452. [Google Scholar] [CrossRef]
11. Zhao W, Wang Z, Lu C, Ma J, Li L. Fault diagnosis for centrifugal pumps using deep learning and softmax regression. In: 2016 12th World Congress on Intelligent Control and Automation (WCICA); 2016 Jun 12–15; Guilin, China. Piscataway, NJ, USA: IEEE; 2016. p. 165–9. doi:10.1109/WCICA.2016.7578673. [Google Scholar] [CrossRef]
12. Sakthivel NR, Nair BB, Elangovan M, Sugumaran V, Saravanmurugan S. Comparison of dimensionality reduction techniques for the fault diagnosis of mono block centrifugal pump using vibration signals. Eng Sci Technol Int J. 2014;17(1):30–8. doi:10.1016/j.jestch.2014.02.005. [Google Scholar] [CrossRef]
13. Wang Y, Zheng L, Gao Y, Li S. Vibration signal extraction based on FFT and least square method. IEEE Access. 2020;8:224092–107. doi:10.1109/access.2020.3044149. [Google Scholar] [CrossRef]
14. Farokhzad S, Ahmadi H, Jaefari A, Abad MRAA, Kohan MR. 897. Artificial neural network based classification of faults in centrifugal water pump. J Vibroeng. 2012;14:1734–44. [Google Scholar]
15. Muralidharan V, Sugumaran V. Feature extraction using wavelets and classification through decision tree algorithm for fault diagnosis of mono-block centrifugal pump. Measurement. 2013;46(1):353–9. doi:10.1016/j.measurement.2012.07.007. [Google Scholar] [CrossRef]
16. Sun H, Yuan S, Luo Y. Cyclic spectral analysis of vibration signals for centrifugal pump fault characterization. IEEE Sens J. 2018;18(7):2925–33. doi:10.1109/JSEN.2018.2804908. [Google Scholar] [CrossRef]
17. Zheng Z, Xin G. Fault feature extraction of hydraulic pumps based on symplectic geometry mode decomposition and power spectral entropy. Entropy. 2019;21(5):476. doi:10.3390/e21050476. [Google Scholar] [PubMed] [CrossRef]
18. Yang Y, Zheng H, Yin J, Xu M, Chen Y. Refined composite multivariate multiscale symbolic dynamic entropy and its application to fault diagnosis of rotating machine. Measurement. 2020;151:107233. doi:10.1016/j.measurement.2019.107233. [Google Scholar] [CrossRef]
19. Wang H, Chen P. Intelligent diagnosis method for a centrifugal pump using features of vibration signals. Neural Comput Applic. 2009;18(4):397–405. doi:10.1007/s00521-008-0192-4. [Google Scholar] [CrossRef]
20. Ali Saud ALTobi M, Bevan G, Wallace P, Harrison D, Ramachandran KP. Fault diagnosis of a centrifugal pump using MLP-GABP and SVM with CWT. Eng Sci Technol Int J. 2019;22(3):854–61. doi:10.1016/j.jestch.2019.01.005. [Google Scholar] [CrossRef]
21. Delgado M, Cirrincione G, García A, Ortega JA, Henao H. Accurate bearing faults classification based on statistical-time features, curvilinear component analysis and neural networks. In: IECON 2012—38th Annual Conference on IEEE Industrial Electronics Society; 2012 Oct 25–28; Montreal, QC, Canada. Piscataway, NJ, USA: IEEE; 2012. p. 3854–61. doi:10.1109/IECON.2012.6389596. [Google Scholar] [CrossRef]
22. Gou L, Li H, Zheng H, Li H, Pei X. Aeroengine control system sensor fault diagnosis based on CWT and CNN. Math Probl Eng. 2020;2020(6):5357146. doi:10.1155/2020/5357146. [Google Scholar] [CrossRef]
23. Li S, Wang H, Song L, Wang P, Cui L, Lin T. An adaptive data fusion strategy for fault diagnosis based on the convolutional neural network. Measurement. 2020;165(6):108122. doi:10.1016/j.measurement.2020.108122. [Google Scholar] [CrossRef]
24. Chen J, Li Z, Pan J, Chen G, Zi Y, Yuan J, et al. Wavelet transform based on inner product in fault diagnosis of rotating machinery: a review. Mech Syst Signal Process. 2016;70(1–2):1–35. doi:10.1016/j.ymssp.2015.08.023. [Google Scholar] [CrossRef]
25. Gonçalves JPS, Fruett F, Dalfré Filho JG, Giesbrecht M. Faults detection and classification in a centrifugal pump from vibration data using Markov parameters. Mech Syst Signal Process. 2021;158:107694. doi:10.1016/j.ymssp.2021.107694. [Google Scholar] [CrossRef]
26. Mousmoulis G, Karlsen-Davies N, Aggidis G, Anagnostopoulos I, Papantonis D. Experimental analysis of cavitation in a centrifugal pump using acoustic emission, vibration measurements and flow visualization. Eur J Mech Fluids. 2019;75(3):300–11. doi:10.1016/j.euromechflu.2018.10.015. [Google Scholar] [CrossRef]
27. Heaton J. Ian Goodfellow, yoshua bengio, and Aaron courville: deep learning. Genet Program Evolvable Mach. 2018;19(1):305–7. doi:10.1007/s10710-017-9314-z. [Google Scholar] [CrossRef]
28. McKee K, Forbes G, Mazhar MI, Entwistle R, Howard I. A review of major centrifugal pump failure modes with application to the water supply and sewerage industries. In: Proceedings of the ICOMS Asset Management Conference Proceedings. Asset Management Council; 2011 May 16–20. [Google Scholar]
29. Zaman W, Ahmad Z, Siddique MF, Ullah N, Kim JM. Centrifugal pump fault diagnosis based on a novel SobelEdge scalogram and CNN. Sensors. 2023;23(11):5255. doi:10.3390/s23115255. [Google Scholar] [PubMed] [CrossRef]
30. Umar M, Siddique MF, Ullah N, Kim JM. Milling machine fault diagnosis using acoustic emission and hybrid deep learning with feature optimization. Appl Sci. 2024;14(22):10404. doi:10.3390/app142210404. [Google Scholar] [CrossRef]
31. Siddique MF, Zaman W, Ullah S, Umar M, Saleem F, Shon D, et al. Advanced bearing-fault diagnosis classification using Mel-Scalograms and FOX-Optimized ANN. Sensors. 2024;24(22):7303. doi:10.3390/s24227303. [Google Scholar] [PubMed] [CrossRef]
32. Zaman W, Siddique MF, Ullah S, Saleem F, Kim JM. Hybrid deep learning model for fault diagnosis in centrifugal pumps: a comparative study of VGG16, ResNet50, and wavelet coherence analysis. Machines. 2024;12(12):905. doi:10.3390/machines12120905. [Google Scholar] [CrossRef]
33. Siddique MF, Saleem F, Umar M, Kim CH, Kim JM. A hybrid deep learning approach for bearing fault diagnosis using continuous wavelet transform and attention-enhanced spatiotemporal feature extraction. Sensors. 2025;25(9):2712. doi:10.3390/s25092712. [Google Scholar] [PubMed] [CrossRef]
34. Zaman W, Siddique MF, Kim JM. Centrifugal pump fault detection with hybrid feature pool and deep learning. In: 2023 20th International Bhurban Conference on Applied Sciences and Technology (IBCAST); 2023 Aug 22–25; Murree, Pakistan. Piscataway, NJ, USA: IEEE; 2023. p. 1–6. doi:10.1109/IBCAST59916.2023.10712967. [Google Scholar] [CrossRef]
35. Ding Y, Ma L, Ma J, Wang C, Lu C. A generative adversarial network-based intelligent fault diagnosis method for rotating machinery under small sample size conditions. IEEE Access. 2019;7:149736–49. doi:10.1109/access.2019.2947194. [Google Scholar] [CrossRef]
36. Zabin M, Choi HJ, Uddin J. Hybrid deep transfer learning architecture for industrial fault diagnosis using Hilbert transform and DCNN-LSTM. J Supercomput. 2023;79(5):5181–200. doi:10.1007/s11227-022-04830-8. [Google Scholar] [CrossRef]
37. Stockwell RG, Mansinha L, Lowe RP. Localization of the complex spectrum: the S transform. IEEE Trans Signal Process. 1996;44(4):998–1001. doi:10.1109/78.492555. [Google Scholar] [CrossRef]
38. Bajaj A, Kumar S. A robust approach to denoise ECG signals based on fractional Stockwell transform. Biomed Signal Process Control. 2020;62(4):102090. doi:10.1016/j.bspc.2020.102090. [Google Scholar] [CrossRef]
39. Zhao Z, Jiao Y. A fault diagnosis method for rotating machinery based on CNN with mixed information [Internet]. [cited 2025 May 26]. Available from: https://ieeexplore.ieee.org/abstract/document/9964316/. [Google Scholar]
40. Liu Z, Wang Y, Vaidya S, Ruehle F, Halverson J, Soljačić M, et al. KAN: kolmogorov-arnold networks. arXiv:2404.19756. 2024. [Google Scholar]
41. Sun W, Cao X. Curvature enhanced bearing fault diagnosis method using 2D vibration signal. J Mech Sci Technol. 2020;34(6):2257–66. doi:10.1007/s12206-020-0501-0. [Google Scholar] [CrossRef]
42. Manikandan S, Duraivelu K. Vibration-based fault diagnosis of broken impeller and mechanical seal failure in industrial mono-block centrifugal pumps using deep convolutional neural network. J Vib Eng Technol. 2023;11(1):141–52. doi:10.1007/s42417-022-00566-0. [Google Scholar] [CrossRef]
Cite This Article
 Copyright © 2025 The Author(s). Published by Tech Science Press.
This work is licensed under a Creative Commons Attribution 4.0 International License , which permits unrestricted use, distribution, and reproduction in any medium, provided the original work is properly cited.
 Downloads
 Citation Tools