
 Submit a Paper
 Propose a Special lssue
 Open Access
ARTICLE

Tree Detection in RGB Satellite Imagery Using YOLO-Based Deep Learning Models
Centre of Real Time Computer Systems, Kaunas University of Technology, Kaunas, 51373, Lithuania
* Corresponding Author: Robertas Damaševičius. Email:
Computers, Materials & Continua 2025, 85(1), 483-502. https://doi.org/10.32604/cmc.2025.066578
Received 11 April 2025; Accepted 04 July 2025; Issue published 29 August 2025
 View Full Text
 Download PDF
Abstract
Forests are vital ecosystems that play a crucial role in sustaining life on Earth and supporting human well-being. Traditional forest mapping and monitoring methods are often costly and limited in scope, necessitating the adoption of advanced, automated approaches for improved forest conservation and management. This study explores the application of deep learning-based object detection techniques for individual tree detection in RGB satellite imagery. A dataset of 3157 images was collected and divided into training (2528), validation (495), and testing (134) sets. To enhance model robustness and generalization, data augmentation was applied to the training part of the dataset. Various YOLO-based models, including YOLOv8, YOLOv9, YOLOv10, YOLOv11, and YOLOv12, were evaluated using different hyperparameters and optimization techniques, such as stochastic gradient descent (SGD) and auto-optimization. These models were assessed in terms of detection accuracy and the number of detected trees. The highest-performing model, YOLOv12m, achieved a mean average precision (mAP@50) of 0.908, mAP@50:95 of 0.581, recall of 0.851, precision of 0.852, and an F1-score of 0.847. The results demonstrate that YOLO-based object detection offers a highly efficient, scalable, and accurate solution for individual tree detection in satellite imagery, facilitating improved forest inventory, monitoring, and ecosystem management. This study underscores the potential of AI-driven tree detection to enhance environmental sustainability and support data-driven decision-making in forestry.Keywords
Trees play an essential role in maintaining life on Earth and contribute significantly to environmental stability and economic resources. As reported by [1], forests cover approximately 31% of the Earth’s land area, playing a fundamental role in sustaining biodiversity and regulating the global climate. Managing vast forested regions remains a major challenge due to their extensive geographical distribution, diverse ecosystems, and increasing threats of deforestation and change in land use. Consequently, many countries are actively developing advanced forest inventory systems to monitor and manage forest resources efficiently [2–4]. These inventories utilize remote sensing technologies, machine learning algorithms, and automated detection models to count and assess tree populations, allowing improved forest conservation and strategic resource allocation.
Forests serve as crucial carbon sinks by absorbing atmospheric carbon dioxide, which mitigates climate change and reduces the greenhouse effect [2]. They support biodiversity by providing habitats for countless plant and animal species, many of which rely on forest ecosystems for survival. Beyond their ecological importance, forests contribute to essential ecosystem services such as oxygen production, soil stabilization, and regulation of the water cycle. The root systems of trees help prevent soil erosion, while canopy cover regulates local temperatures and humidity levels [5]. Furthermore, forests play a crucial role in maintaining hydrological balance by reducing the risk of flooding and preserving water quality in river basins [6].
Economically, forests provide essential raw materials to various industries, including timber, paper, pharmaceuticals, and bioenergy [7]. Sustainable management of forest resources is essential for long-term economic stability, particularly in regions where the forest is a significant sector of the economy. Forests contribute to ecotourism and recreation, supporting livelihoods in rural communities. However, unsustainable logging, habitat destruction, and the increasing frequency of wildfires pose severe threats to global forest ecosystems [8].
Given the critical role of forests, effective tree monitoring and conservation strategies are imperative for ensuring their long-term sustainability. Advanced remote sensing techniques, including satellite imagery and LiDAR, combined with artificial intelligence (AI)-driven methods, are revolutionizing forest monitoring and assessment [9]. These technologies enable high-precision mapping of tree coverage, early detection of forest degradation, and estimation of biomass for carbon accounting [10]. As climate change and human-induced pressures continue to threaten forest ecosystems, the integration of AI and remote sensing in forestry practices will be essential for sustainable forest management, environmental conservation, and global climate resilience [11].
To address these challenges, many countries have turned to machine learning (ML) to develop machines, robots, and systems that can assist humans in managing forest resources. These advances have led to the introduction of Forest 4.0 concept, a framework to combine and apply modern digital technologies in forestry [12]. These technologies can analyze forest ecosystems using advanced Artificial Intelligence (AI) methods [13], perform forest modelling by developing digital twins [14], predict trends and adverse events such as wildfires [15], and monitor large forest areas for environmental surveillance [16]. All of these machines can capture images of the forest, which can then be used to detect and monitor trees [17].
YOLO (You Only Look Once) is a real-time object detection technique that is known for its speed and accuracy since it does classification and localization in one network forward pass. The authors [18] used the YOLO model to classify the individual tree types within corridor spaces for transmission power lines using UAV multispectral imagery, achieving a substantial detection accuracy of 85.42% for betel nut trees. Their results show that YOLO v7 is well-suited for use in fast detection and classification of individual tree types in complex forest sites and outperforms previous versions of YOLO in terms of speed and classification accuracy.
Individual Tree Detection (ITD) is a remote sensing technique used in forest and environmental science to identify, map, and analyze individual trees in forest ecosystems and landscapes [19]. This technology combines multiple data collection methods, primarily using LiDAR (light detection and rotation), which generates detailed 3D point clouds, high-resolution air or satellite images, and hyperspectral images. This process uses various algorithmic approaches to detect trees, including local maximum detection to identify the top of the tree, region-growing algorithms to define crown boundaries, crown density [20], watershed segmentation [21] to differentiate individual crowns, YOLO (you only look once) based object detection models to detect tree canopy and individual trees, and increasingly advanced deep learning and computer vision techniques [22] for automatic detection, classification, and segmentation. These methods can extract key tree parameters such as height, crown diameter, crown area, and precise position, and in multispectral [23] or hyperspectral data, species identification can be obtained. The implementation of this technology covers various applications ranging from detailed forest inventory assessments and biomass estimates to urban tree management and ecological research projects. However, the accuracy and efficiency of the ITD method depend on environmental and technical factors such as forest density, crown overlap between adjacent trees, tree tops, and the quality and resolution of remote sensing data. This technique continues to develop in sensor performance, processing algorithms, and computational power, enabling more accurate and efficient tree identification and characterization. The IDT results are evaluated based on precision, recall,
Individual tree detection relies on various datasets such as LiDAR [25], hyperspectral, multispectral, and aerial imagery, each offering unique strengths. LiDAR data are highly valued for their ability to create detailed 3D models of forest structures, making it possible to identify individual trees even in densely wooded areas by capturing accurate elevation details of the canopy and the ground [17]. Different devices are used to collect various types of LiDAR data. For ALS (Airborne LiDAR Systems) [26] data, devices such as the DJI Zenmuse L1, RIEGL, and VQ-1560i are commonly used. For TLS (Terrestrial LiDAR Systems) data, Leica RTC360 and FARO Focus series devices are preferred. For MLS (Mobile LiDAR Systems) [22] data, Velodyne HDL-32E and Leica Pegasus are frequently used. Handheld LiDAR scanners, such as the GeoSLAM ZEB-HORIZON and Leica BLK2GO, are also available.
The aerial imagery obtained from satellites, drones, or aircraft provides high-resolution visual content that can be analyzed using detection techniques to outline tree tops, tree crowns, and tree canopies. It is also called RGB (each pixel of the image is defined by the amount of red, green, and blue). Most researchers use Google Earth to obtain aerial images for training and validation [27]. The authors can access the publicly available RGB dataset from various repositories such as Landsat, Sentinel-2, MODIS, USGS Earth Explorer, and Google Earth Engine. In this research, the dataset used is publicly available for individual tree detection.
Hyperspectral images are very beneficial for the diverse forest ecosystem that stores the information in various spectral bands, enabling the identification of tree species by analyzing their distinct spectral characteristics. The collection of hyperspectral datasets for individual tree detection involves storing hundreds of narrow-wavelength images using high-spectral sensors mounted on mountains, satellites, aircraft, drones, and UAVs [28].
Multispectral images are less detailed than hyperspectral images but are cost-effective and more accessible. These images are used for individual tree detection and segmentation in large and wider plots. These images are also used for forest management projects due to their wide availability. These diverse images enable ITD and ITDS to provide accurate and detailed information, which significantly contributes to sustainable forest management, ecosystem management, and conservation efforts.
Recently, many authors have adopted various approaches to perform individual tree detection. Reference [29] uses the Mask R-CNN (Mask region-based convolutional neural network) to detect the trees. The results are achieved with a precision of 0.7085, recall of 0.7475, and a
In another paper, reference [30] used semi-automatic versions of the YOLOv3 model in the various data sets and achieved precision (49.92%), recall (38.85%) and
In the study, reference [35] use pre-trained YOLOv5, SSD, and UNET for satellite imagery collected from the National University of Sceine and Technology (NUST) located in Islamabad and achieved the highest accuracy with U-Net of 81%, which was significantly more accurate than both YOLOv5 (32%) and SSD (24%) and was particularly incredible in targeting those small objects in low-resolution imagery. In [36], the authors included the application of Faster R-CNN on aerial RGB imagery for Swiss forests; these multi-species models showed high F1 scores for both Norway spruce (0.86) and silver fir (0.84), and when modelling Scots pine, they demonstrated a high score of up to 0.92% indicating that it was operationally sound when detecting tree species at the species-level.
The results of recent studies are compared in Table 1.
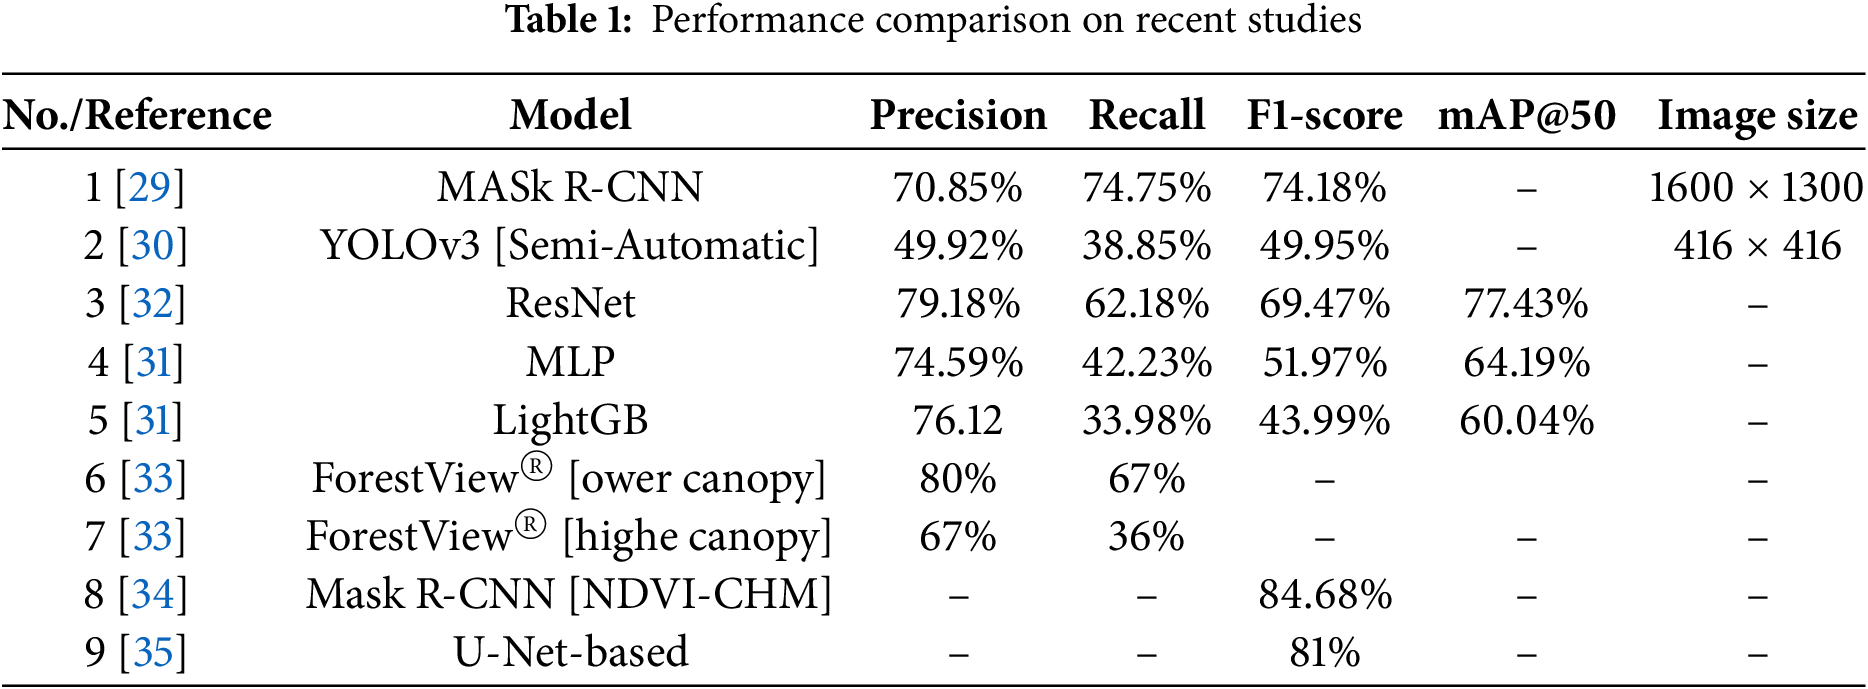
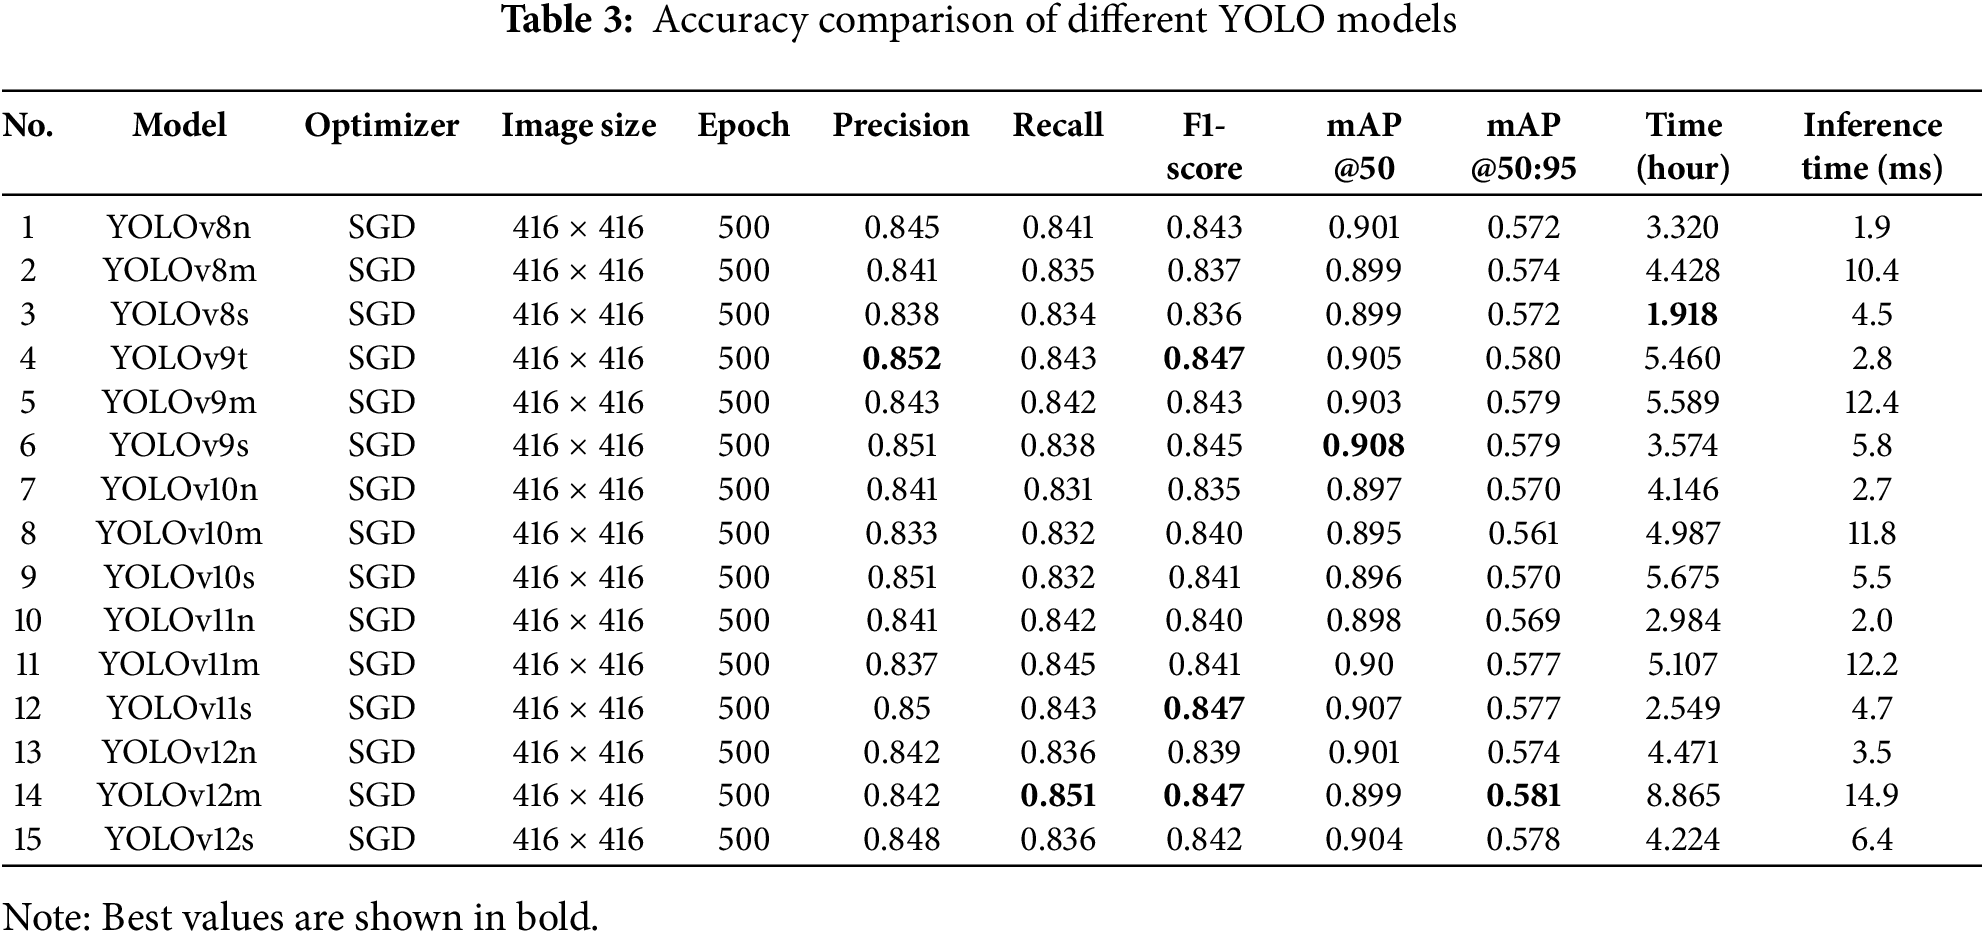
We used a dataset that is openly available [37] and trained different variants of the YOLO model such as YOLOv8n, YOLOv8m, YOLOv8s, YOLOv9t, YOLOv9m, YOLOv9s, YOLOv10n, YOLOv10m, YOLOv10s, YOLOv11n, YOLOv11m, and YOLOv11s. The new and latest versions of the YOLO model such as YOLOv12n, YOLOv12m, and YOLOv12s are also performed on the same dataset for better results. The models were trained on Kaggle, Tesla P100-PCIE-16GB and tried to gain the highest
In this research, individual tree detection is performed using different variants of the YOLO model. The dataset used for this investigation was collected from Roboflow (https://roboflow.com/ (accessed on 03 July 2025)). In the first step, The low-resolution dataset was collected with a size of 416
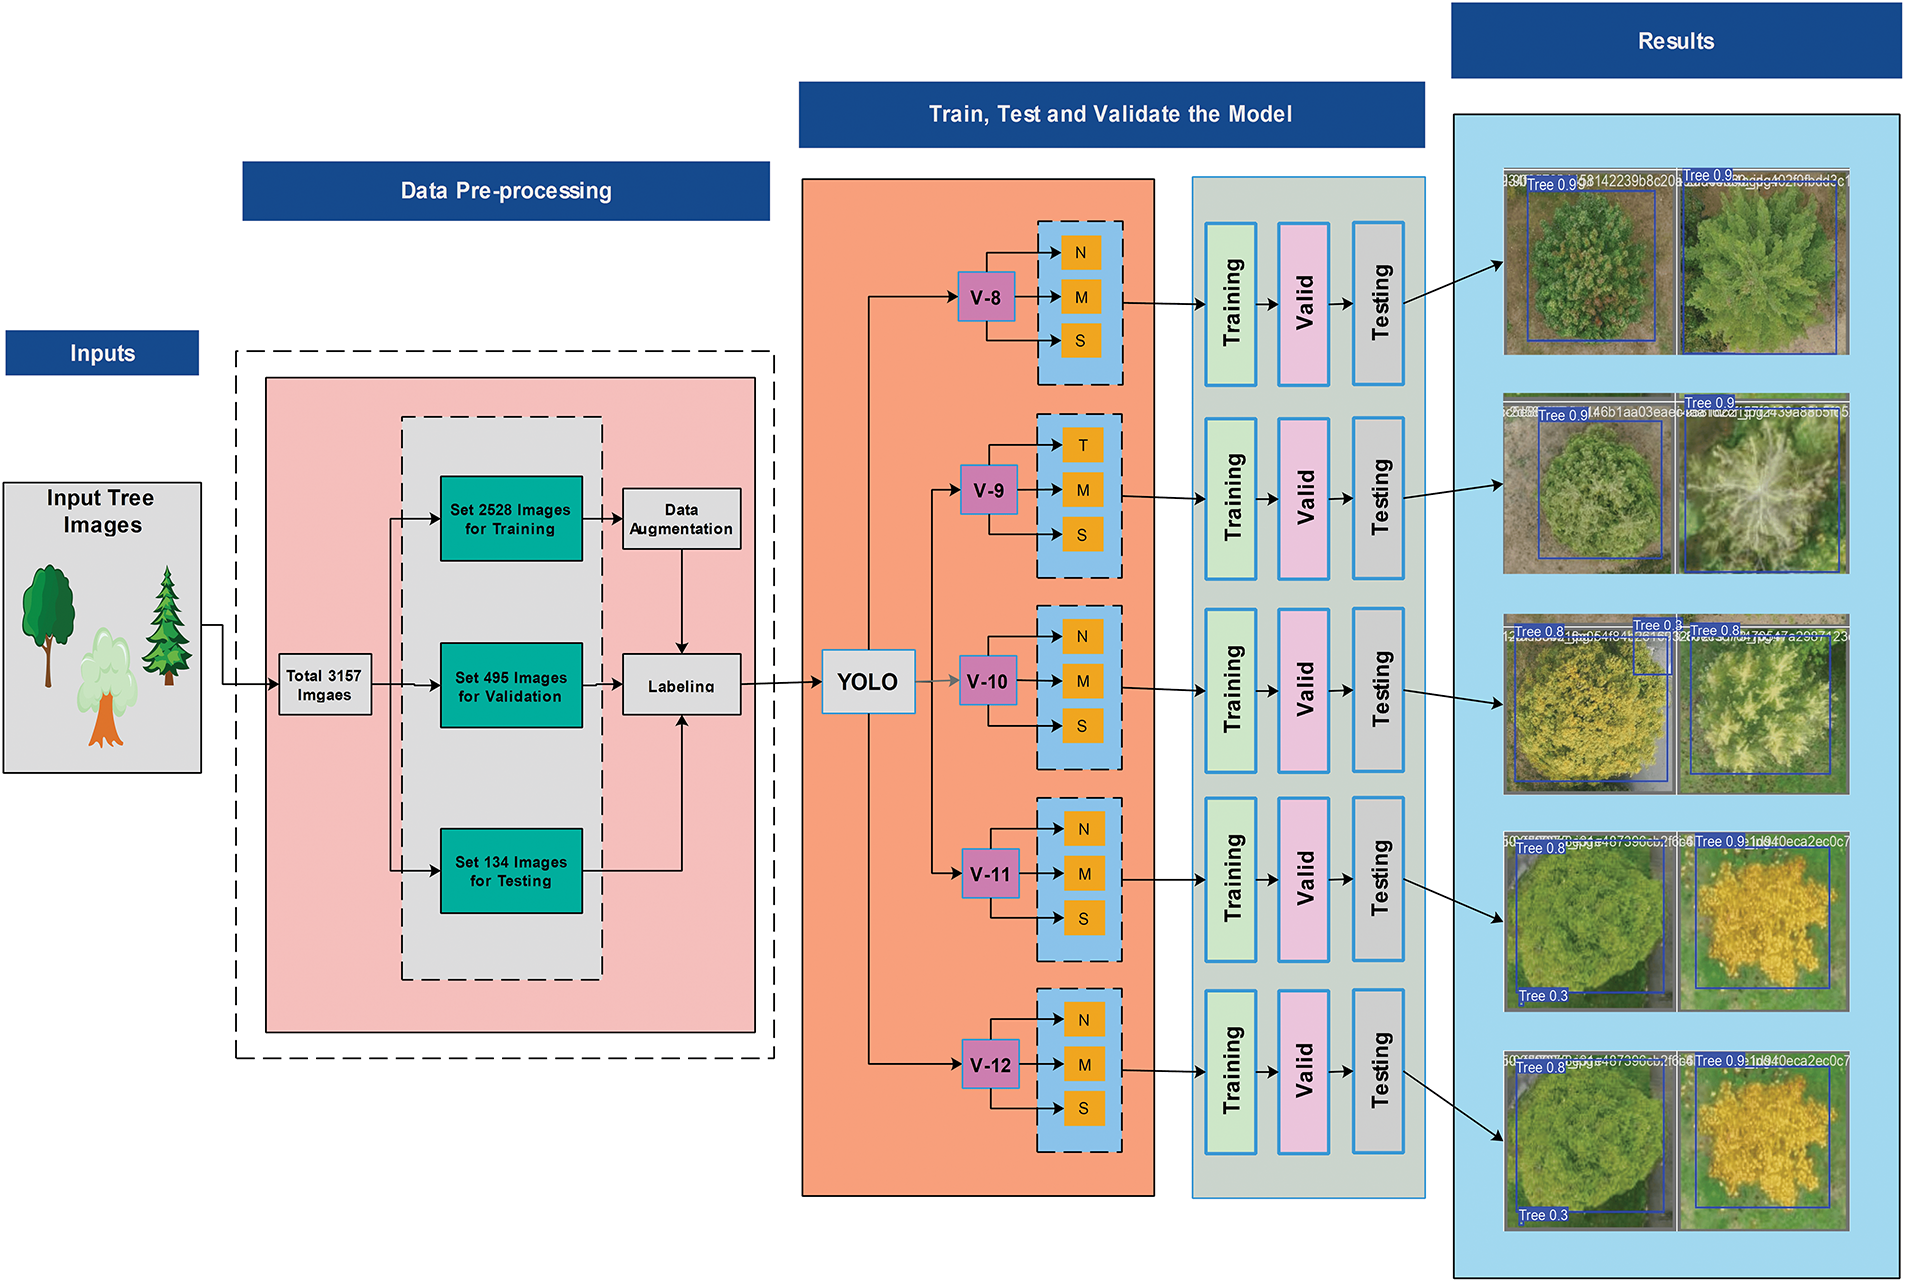
Figure 1: A complete workflow for individual tree detection using YOLO models
2.1 Dataset and Pre-Processing
The dataset used for this study is publicly available and consists of manually annotated images of trees from an urban area. The resolution of every image is 416
All types of images, including training (2528
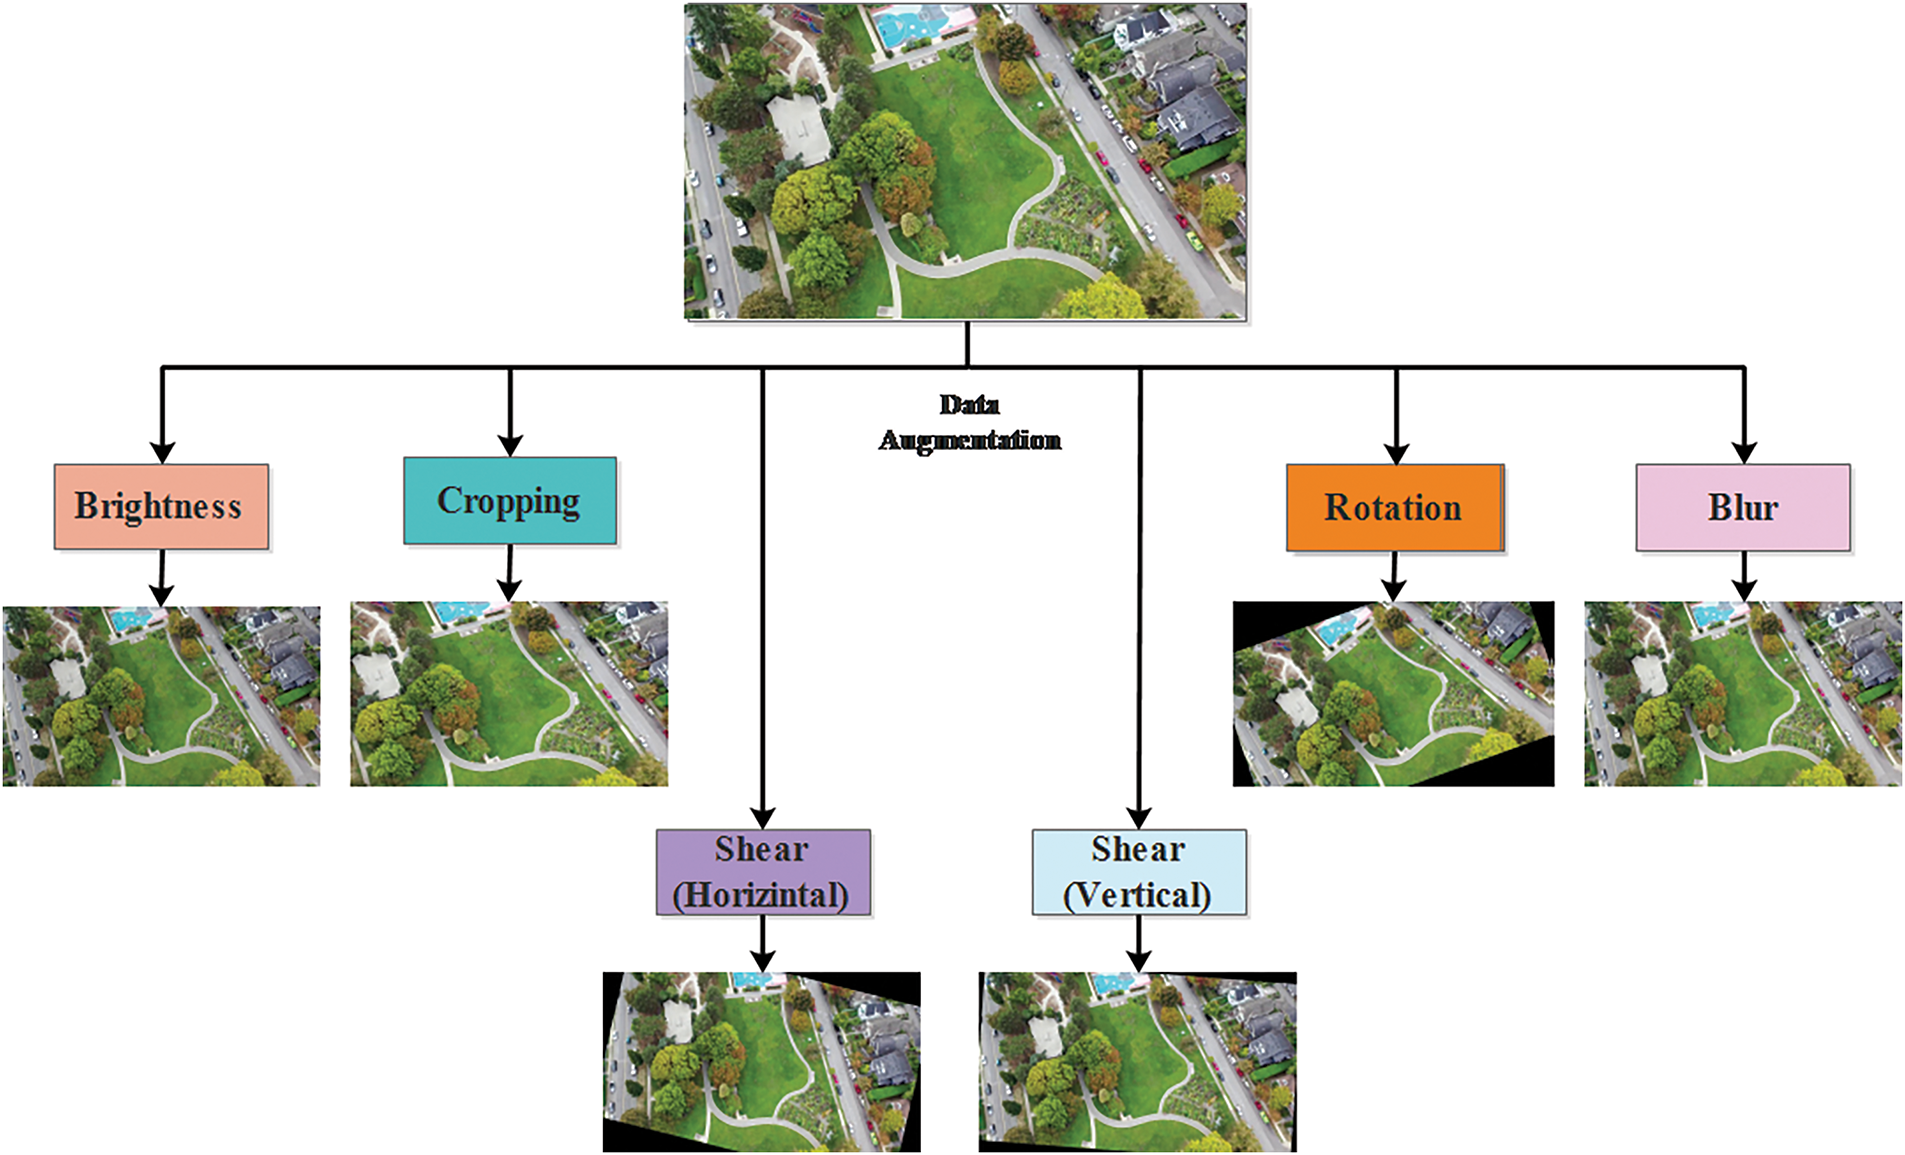
Figure 2: A data augmentation process for six functions
The dataset is divided into two classes, one for the background and the other for trees. The Roboflow website (https://roboflow.com/) was used to label the images and define boundaries to detect individual trees.
In this research, different variants of the YOLO model, including YOLOv8n, YOLOv8m, YOLOv8s, YOLOv9t, YOLOv9m, YOLOv9s, YOLOv10n, YOLOv10m, YOLOv10s, YOLOv11n, YOLOv11m, YOLOv11s, YOLOv12n, YOLOv12m, and YOLOv12s, are used. All results are compared with other methods according to precision, recall,
2.2.1 You Only Look Once (YOLO)
Introduced by [38], You Only Look Once (YOLO) is the latest deep learning model for real-time object detection. Unlike traditional methods, object detection is performed in two stages (regional proposal and classification), and treats detection as a single regression problem, making it very efficient, accurate, and fast. This model divides the input image into grid cells, each grid cell predicting the boundary box and the class probability of the object (trees) inside the grid. Detects multiple objects efficiently in a single forward pass, making it faster than models such as Mask R-CNN, RetinaNet, and DETR. The YOLO architecture is shown in Fig. 3.
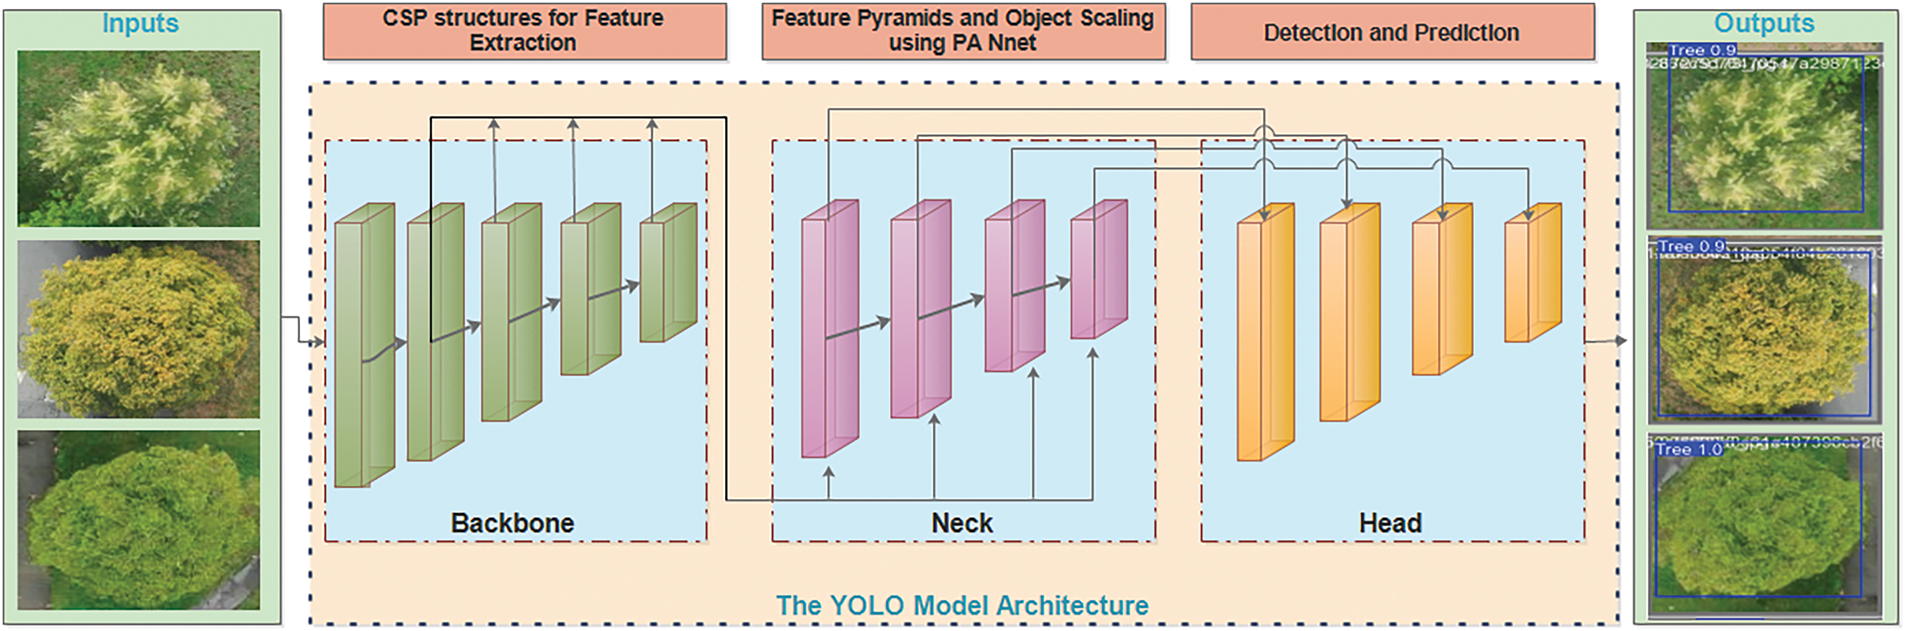
Figure 3: A YOLO architecture used in this research
Multiple versions of YOLO have been developed, each bringing significant improvements in accuracy and speed. YOLOv1 to YOLOv5 focused on optimizing architecture and loss functions [39], while later versions (YOLOv6 [40], YOLOv7 [41], YOLOv8 [42], YOLOv9 [43], YOLOv10 [44], YOLOv11 [45], and YOLOv12 [46]) introduced advanced features like anchor-free detection, transformer-based components, and improved backbone networks. YOLOv9 introduces enhanced channel attention (ECA) and more efficient pillars, which greatly improve the accuracy and robustness of object detection. YOLOv10 integrates adaptive instance normalization and compact model design to optimize execution on edge devices in real-time. YOLOv11 uses vision transformers and CNN-transformer hybrid methods to provide superior generalization for complex object detection tasks. YOLOv12 uses the improved feature aggregation method, such as (R-ElAN) Residual Efficient Layer Aggregation Networks, to concatenate the features from multiple layers and to improve the ability of the model.
2.2.2 Performance Evaluation Matrices
Trained models are evaluated based on accuracy and loss, including metrics like precision (Prc) (It is also called Positive Predictive Value) 1, recall (Rec) 2,
where: TP is a True Positive, FP is a False Positive, FN is a False Negative.
where: N = Total number of classes or queries,
or, in a discrete form:
where:
The loss function is used to calculate the loss in the trained model:
where CIoU is defined as:
where:
Alternatively, the Generalized IoU (GIoU) loss can be used:
The classification loss is calculated using Binary Cross-Entropy-(BCE)loss:
where:
The Focal Loss, used in models in an upgraded version of the YOLO model such as v8, and v9 modifies BCE loss to focus more on hard-to-classify examples:
where:
The Distribution Focal Loss (DFL) is used for precise bounding box regression. Instead of predicting a single number for box coordinates, DFL models them as a discrete probability distribution:
where:
Precision, defined in Eq. (1), is used to evaluate the ability of trained model to accurately predict tree objects from RGB imagery. To check the ability of the trained model for all detections of all relevant instances in the trees, as displayed in Eq. (2).
Algorithm: For individual tree detection
Step 1: Image Augmentation and Pre-Processing To enhance model capabilities to detect the individual tree from the images, six augmented images are created per original image. The augmentation process includes:
• Random cropping of images by zooming in from 0% to 26%.
• Rotation of images between –21∘ and +21∘.
• Horizontal shearing of up to
• Vertical shearing of up to
• Adjustment of brightness between –44% and +44%.
• Gaussian blur with a radius up to 3.5 pixels.
After all, the images including the training, validation and testing part are manually labeled and resized to 640
Step 2: YOLO Detection Process
• Extract and represent features using a transformer-based backbone.
• Detect individual trees by aggregating features from multiple scales in different sizes.
• Highlight potential tree regions and suppress background noise using the attention.
Step 3: Post-Processing
• The predicted bounding boxes are mapped back to the image dimensions.
• Non-Maximum Suppression (NMS) is applied to eliminate redundant overlapping boxes.
Output: The detected trees are visualized with their number of trees, and the trees are marked with different colors.
All experiments are carried out on a Kaggle Tesla P100-PCIE-16GB, 16269MiB. All original images are used with a size of 416
Multiple models of YOLO series such as YOLOv8n, YOLOv8m, YOLOv8s, YOLOv9t, YOLOv9m, YOLOv9s, YOLOv10n, YOLOv10m, YOLOv10s, YOLOv11n, YOLOv11m, YOLOv11s, YOLOv12n, YOLOv12m, and YOLOv12s are trained with the same parameters and YOLOv12m achieved the highest accuracy with recall (0.851),
The Nemenyi post-hoc test was conducted for a follow-up analysis after the Friedman test, which tested for significant differences in the performance of multiple YOLO models. The test aimed to compare the models’ ranking in six performance metrics: Precision, Recall, F1-score, mAP@50, mAP@50:95, and inference time. The p-value of the Friedman test was less than 0.05, so the Nemenyi post-hoc test was applied to compare the average ranks of the YOLO models. From the Critical Distance Diagram (Fig. 4), YOLOv9t, YOLO11s, and YOLOv9s achieved the best rankings, indicating superior performance in object detection accuracy. Models like YOLOv10m, YOLOv10n, and YOLOv8s ranked lower, suggesting comparatively weaker performance. The clustering of models suggests that some variations of YOLO perform similarly, with minor improvements in accuracy, possibly due to architectural optimizations. Overall, the YOLOv9 and YOLOv12 series performed well, reinforcing their effectiveness in individual tree detection tasks.
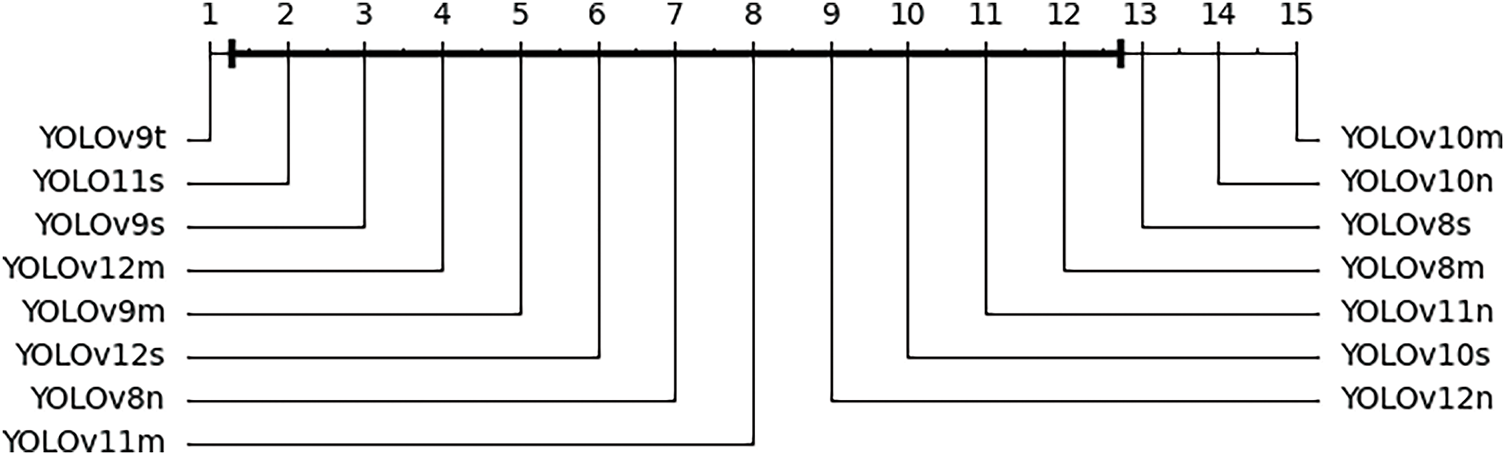
Figure 4: Critical distance diagram showing the results of Nemenyi test
Three types of loss functions are computed as described in Fig. 5.
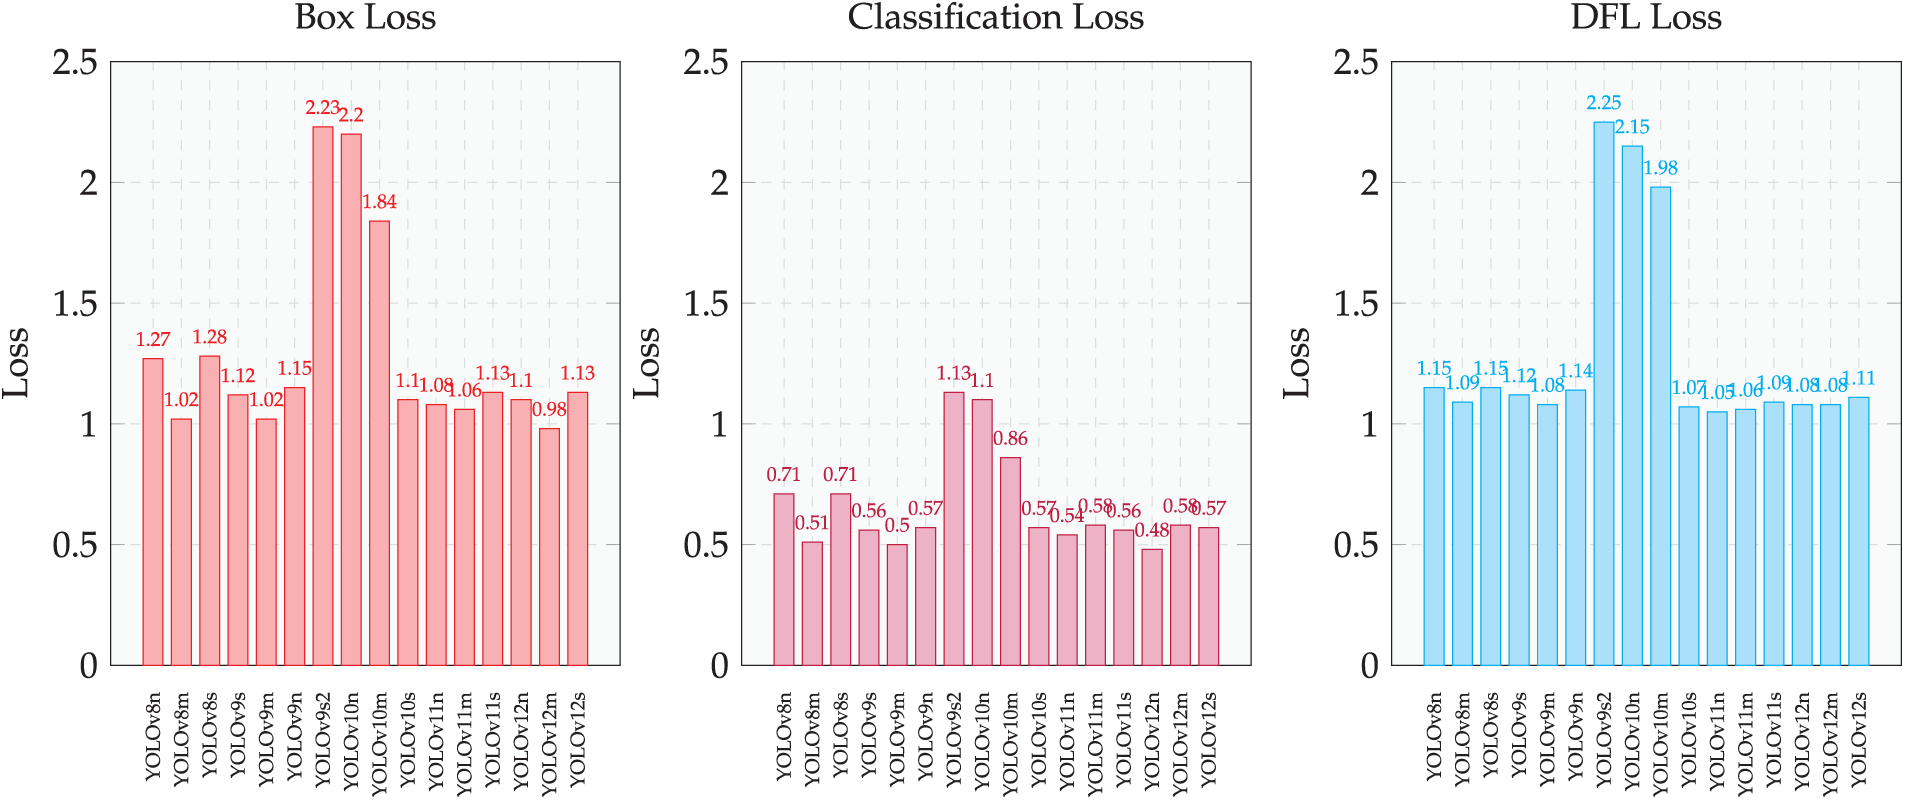
Figure 5: Separate bar charts for Box Loss, Classification Loss, and DFL Loss across YOLO models
Based on the loss values represented in Fig. 5, YOLOv12m emerges as the best-performing model, showing the lowest box loss (0.9863), classification loss (0.4873), and DFL loss (1.073) among all models. A lower loss indicates that the model can accurately predict trees’ locations, classifications, and distributions. YOLOv9m follows closely behind, with slightly higher but still competitive loss values. On the other hand, YOLOv10n and YOLOv10m perform the worst, showing significantly higher losses across all three categories, with Box Loss values exceeding 2.2, which suggests that these models struggle more with precise bounding box predictions and classification accuracy such as, the model tries to predict bounding boxes that are too large, too small, or shifted away from the actual tree canopies, which can lead to missed detections or overlapping boxes for neighboring trees. In general, YOLOv12m stands out as the most efficient model, making it the preferred choice for applications that require the highest accuracy and the lowest loss in tree detection. YOLOv12m shows exceptional performance by achieving the highest accuracy and lowest loss values in multiple evaluation metrics. The model quickly converges and attains its best results within the first 100 epochs, indicating efficient learning and optimization. Fig. 6 illustrates the different loss values recorded during training, providing insight into the performance of the model. The box loss (Fig. 6A) starts at a high value but rapidly decreases as the model learns to locate objects more accurately. The effectiveness of the selected loss function is demonstrated by the ability of the model to accurately detect the largest number of trees in the correctly labelled areas of the dataset. In particular, the model works well in challenging scenarios, such as images with densely grouped trees that are difficult to distinguish individual examples. The loss function contributes to this performance by guiding the model to learn fine differences, allowing it to identify most trees as separate entities, even within complex and overlapping structures. The loss of classification (Fig. 6B) shows the most rapid decline, stabilizing at a consistently low value, demonstrating the strong ability of the model to classify objects effectively. The smooth stabilization of this loss suggests minimal overfitting and a well-generalized classification capability. Meanwhile, the DFL loss (Fig. 6C) follows a steady downward trend, indicating improved refinement of bounding box predictions. In general, the combination of rapid convergence, low final loss values, and stable learning behavior solidifies YOLOv12m as the best-performing model for tree detection in this evaluation. Its superior learning efficiency and robustness in localization, classification, and bounding box refinement further emphasize its suitability for high-precision tree detection tasks.
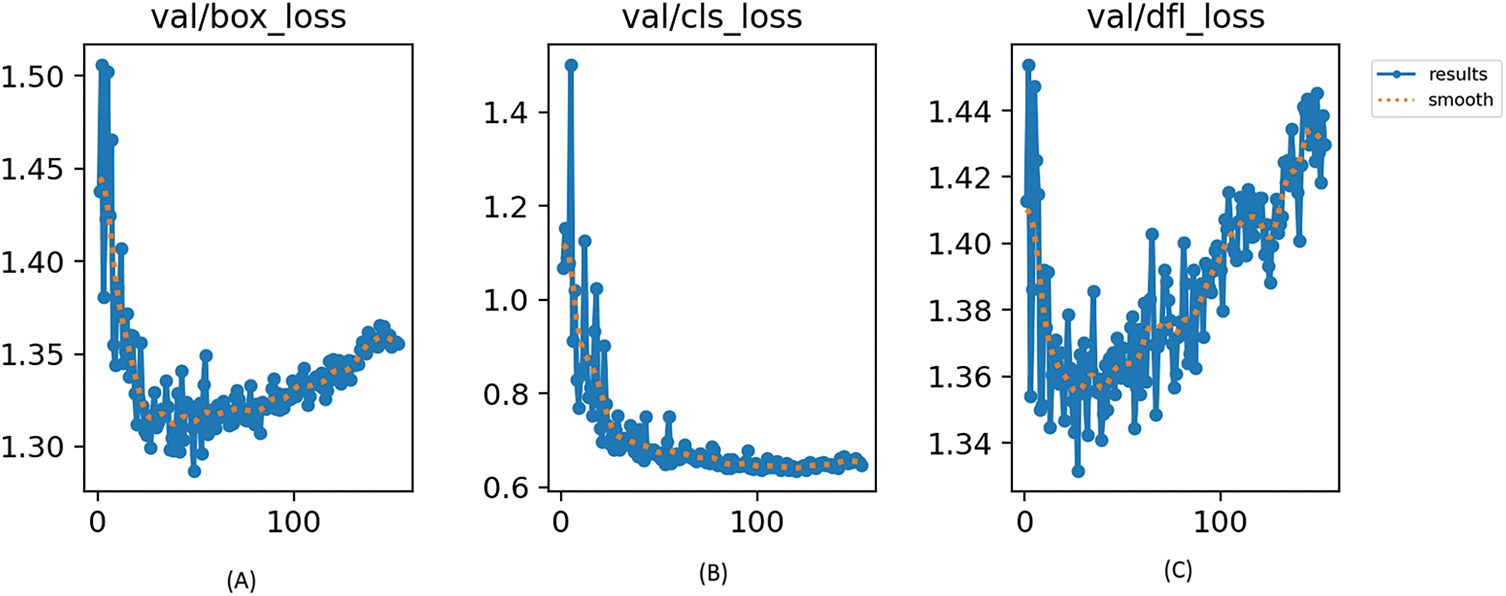
Figure 6: Comparison of loss functions across YOLO models
In this section, the results of the four best-performing models are visualized to facilitate performance comparison. Based on the experiments summarized in Table 3, the models with the highest accuracy and lowest loss values. According to the experiments and outputs, YOLOv12m (14), YOLOv9t (4), YOLOv11s (12), and YOLOv9s (6) from Table 3 are selected for comparison of testing results on 10 different plots. For each model, ten plots with the size of 416
The number of detected tresses is presented in Table 4 for YOLOv12m, YOLOv9t, YOLOv9s, and YOLOv11s. All trees identified by YOLOv12m are marked with blue squares, while those detected by YOLOv9t are colored red, YOLOv9 in yellow, and YOLOv11 in purple. In the first image, both YOLOv12m and YOLOv9t successfully detected 22 trees.
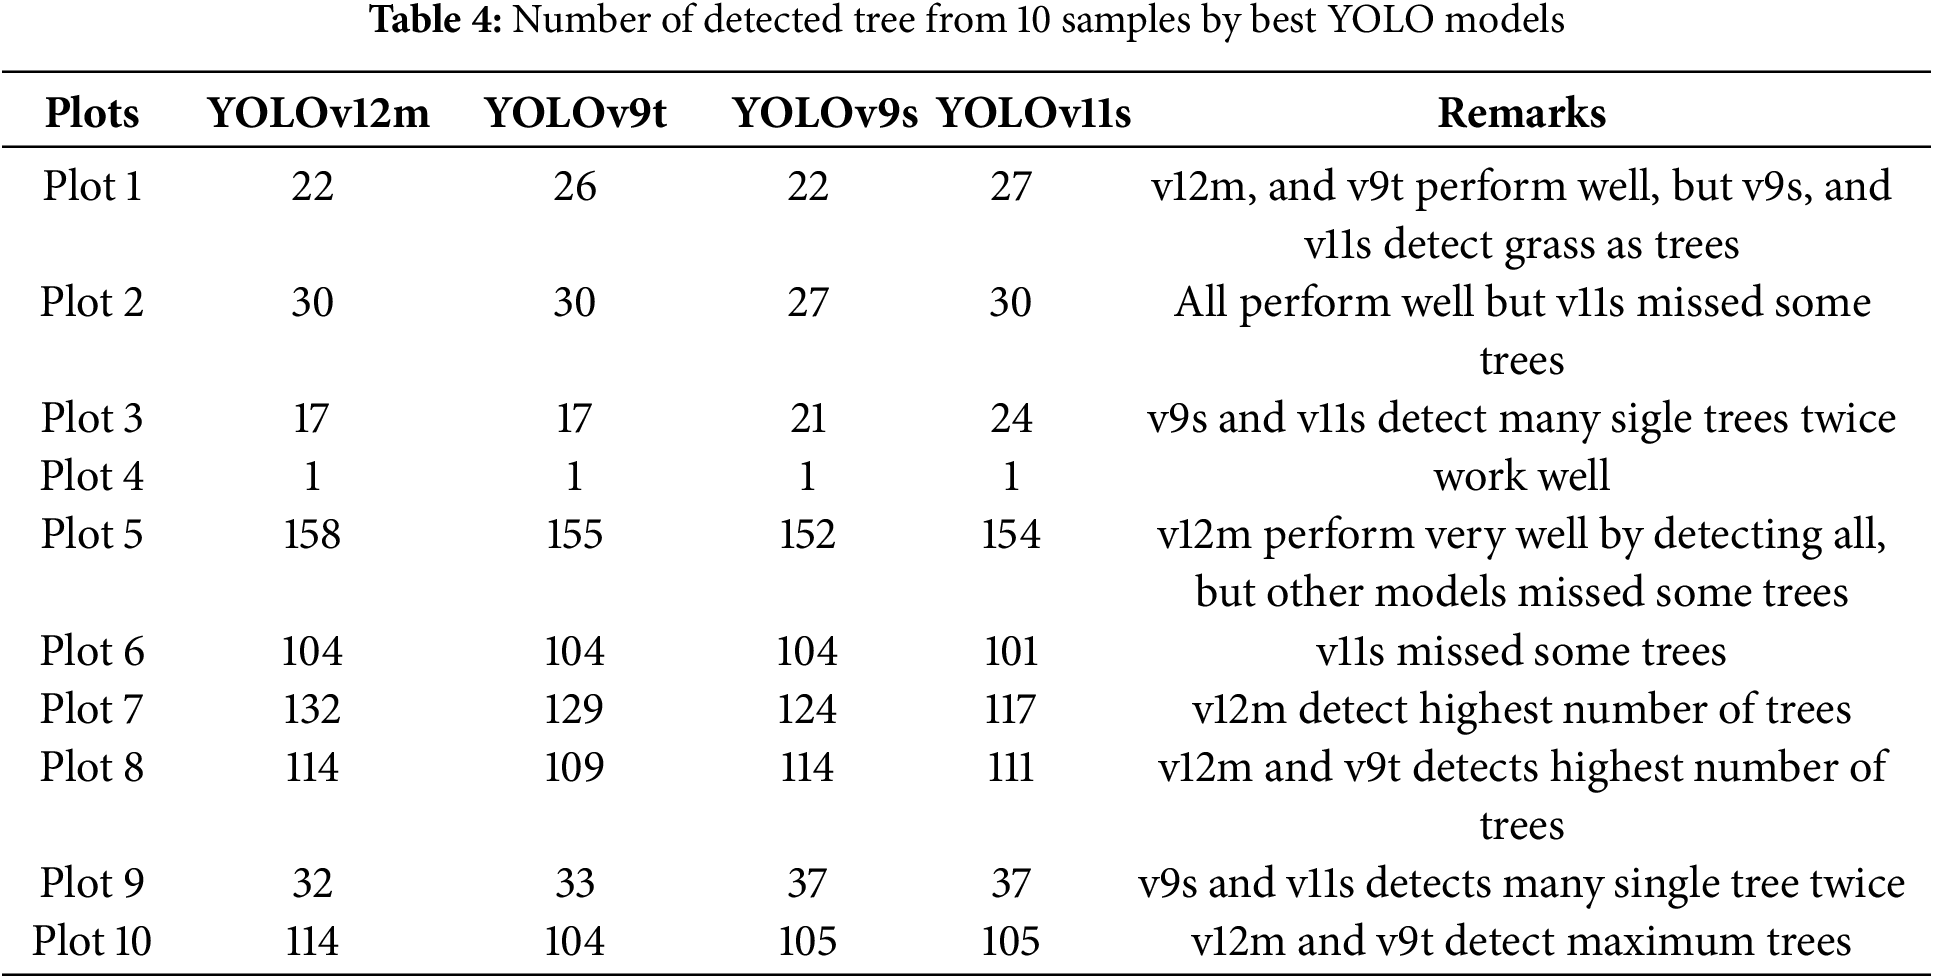
However, YOLOv9s and YOLOv11 identify additional trees that are not present and mark a single tree twice.
In plot 1, v12m and v9t detected the true number of trees and did not count the grass area. However, v9s and v11s misclassified the grass area as a single tree. In plot 2, all the best-performing models detected the correct number of trees. In plot 3, the first two models-v12m and v9t, accurately detected the individual trees. As shown in Fig. 7A, v11s recorded the spacing associated with the grass area as a single tree. Likewise, the v9s model accurately identified one tree, but then mislabeled a single tree as four separate trees, and reported on the spacing associated with the grass area as a tree (shown in Fig. 7B).
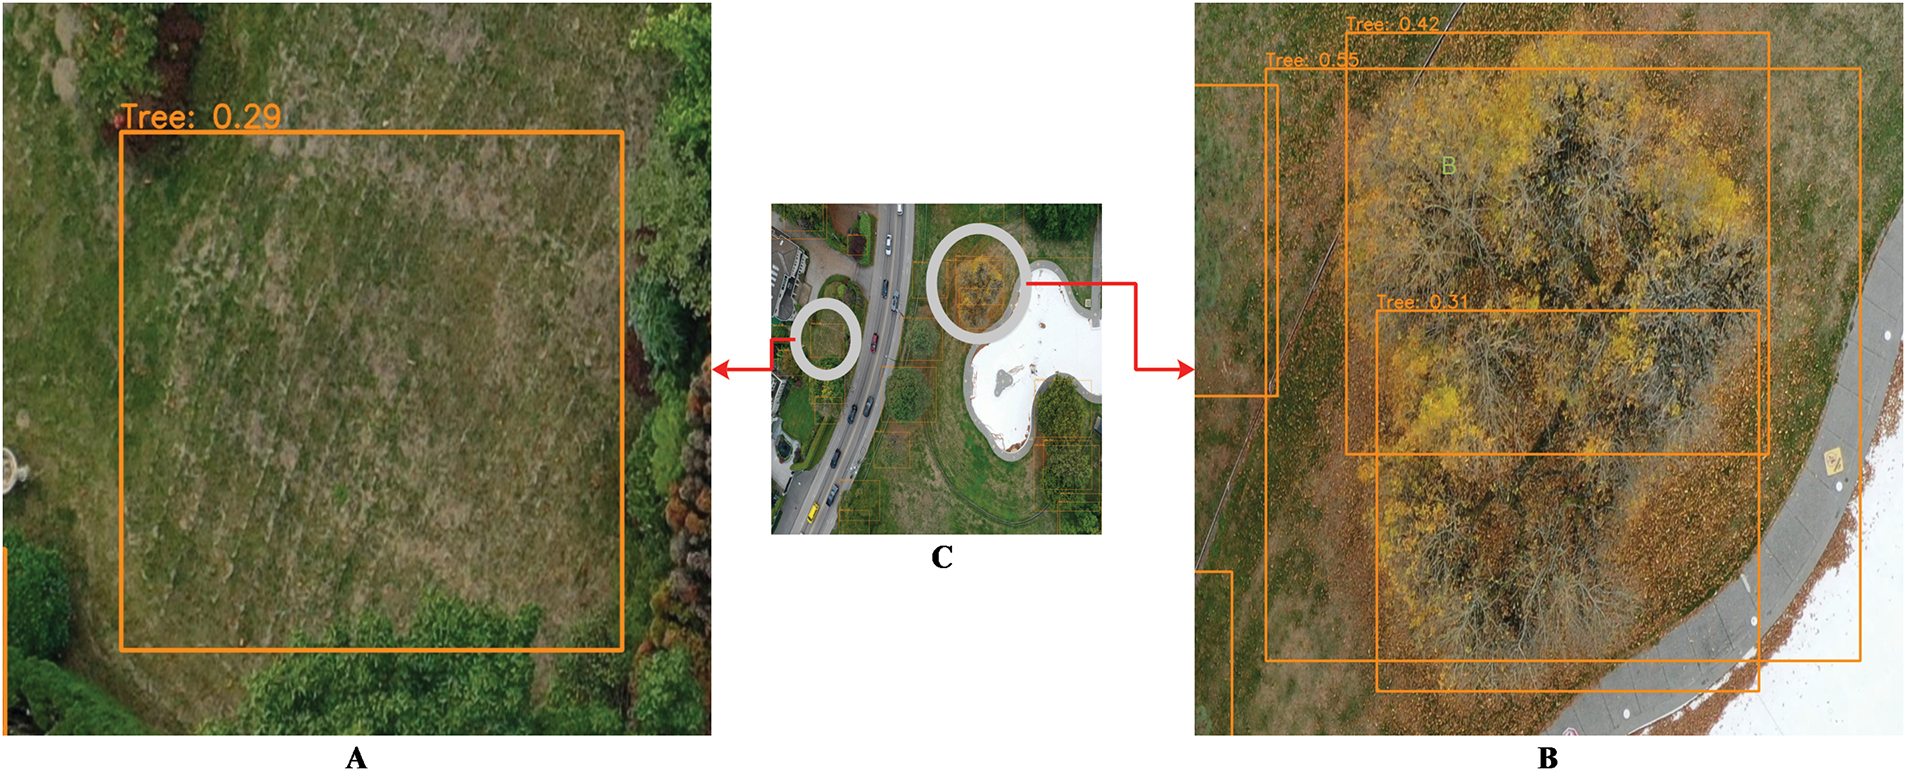
Figure 7: “A” represents the grass area mistakenly detected as a tree, while “B” represents a single tree incorrectly detected as multiple trees by YOLOv9s, “C” is the tested sample
In plot 4 there was only one tree, and all models detected it correctly. As shown in Figs. 8 and 4, the plot 5 for all models exhibits comparable performance in different numbers of detecting trees. YOLOv12m achieved the best result by correctly detecting all 158 trees in the image with 0 missing trees. In contrast, YOLOv9t detected 155 trees with missing of 3 trees; YOLOv11s detected 154 trees with missing 4 trees, and YOLOv9s detected 152 trees with a missing 6 trees. These discrepancies highlight the varying effectiveness of the models’ testing under their respective accuracy matrices and loss functions.
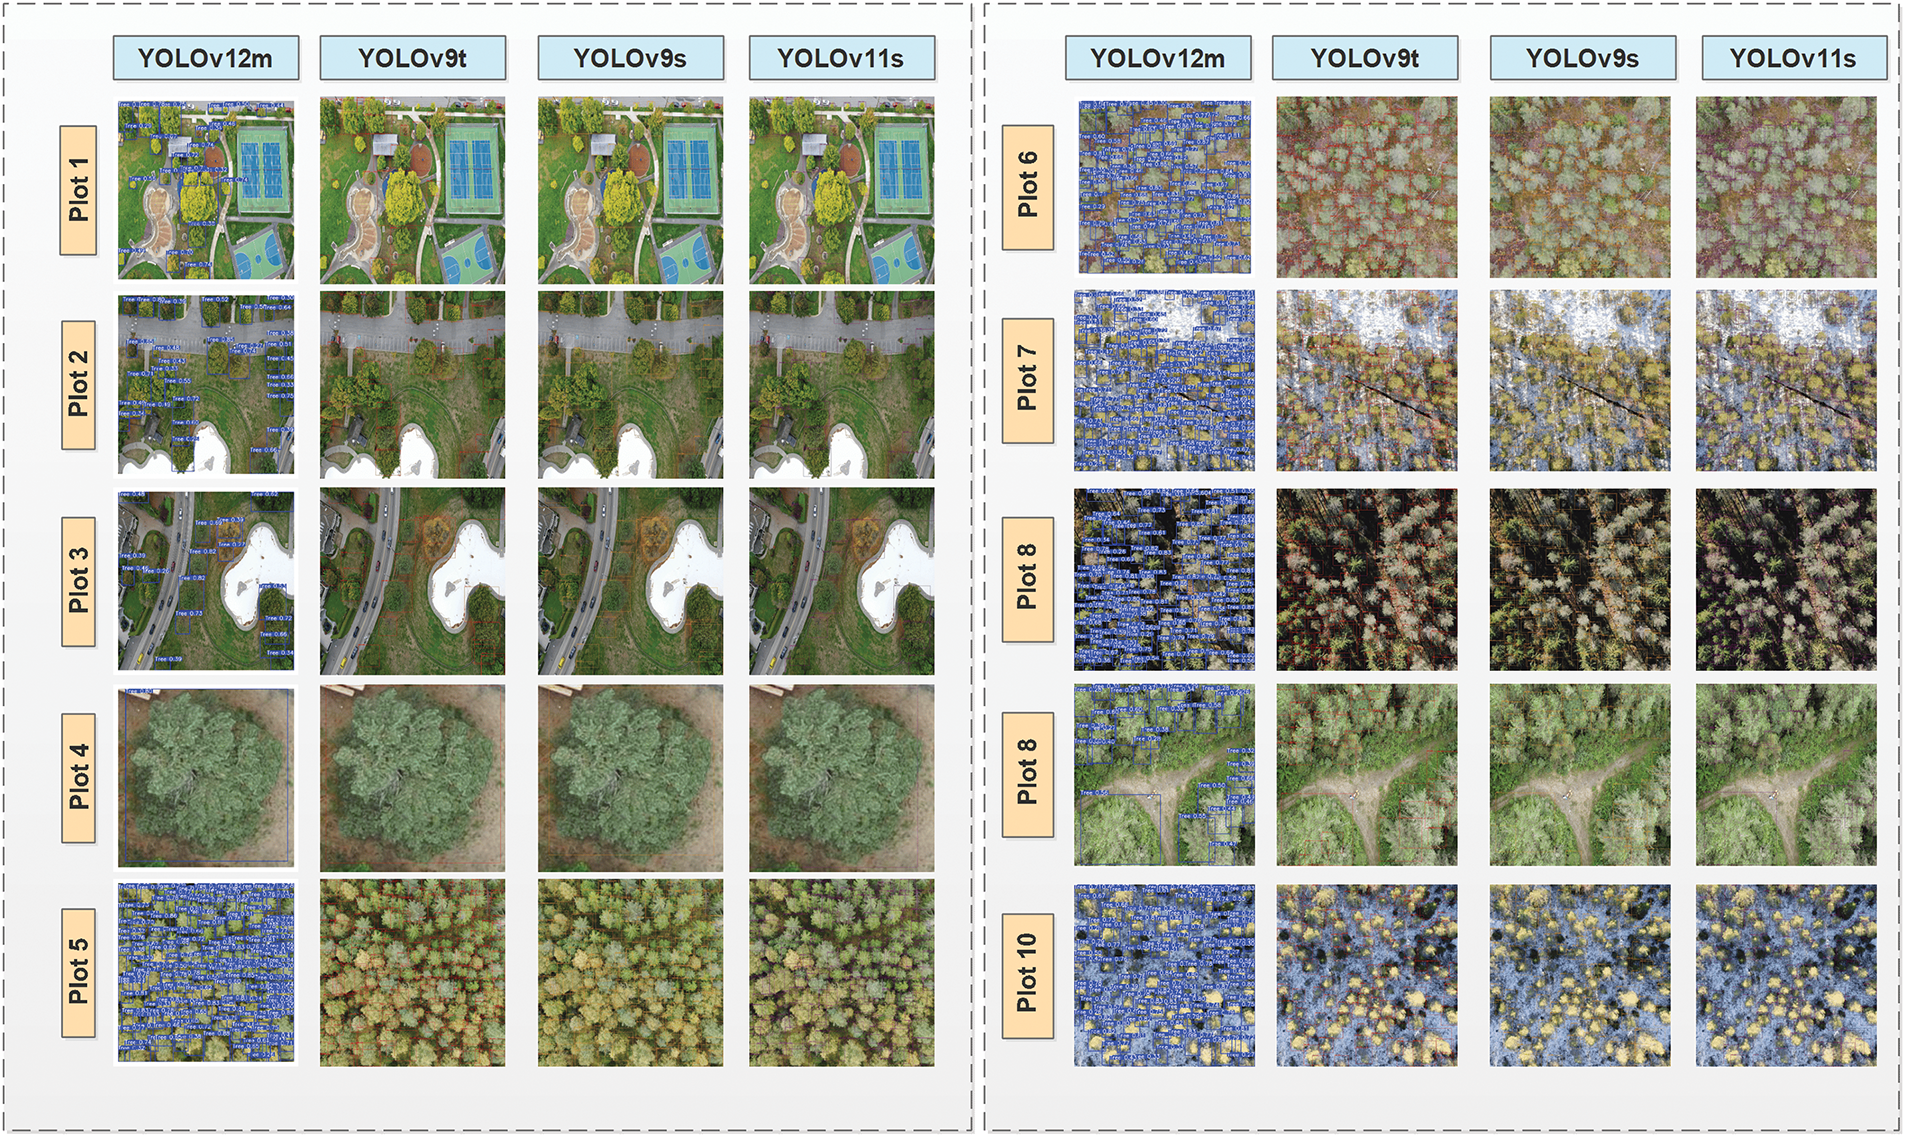
Figure 8: Table comprises four columns and ten rows, with each row representing a plot number and each column corresponding to a specific model. The detected trees for YOLOV12m are enclosed in blue squares. In the second column, the trees detected by YOLOv9t are highlighted in red. The third column displays the results for YOLOv9s, marked in yellow, while the last column presents the detected trees for YOLOv11s, indicated in purple
When used for Plot 6, a dense forest image that includes many clusters of trees, each of the best models, v12m, v9t, and v9s, detected all trees, and v11s only missed three trees. In each of Plots 7 and 8, 11s missed a few trees. In Plot 9, 12m detected all actual trees, whereas YOLOv11s may have overfitted by declaring additional objects to be trees. For plot 10, YOLOv12m detects 114 trees, but YOLOv9t, YOLOv9s, and YOLOv11s missed some trees and detect only 104, 105, and 105, respectively. It indicates the lowest loss and highest accuracy for the YOLOv12m. The superior performance of YOLOv12m suggests that its associated loss configuration enables better generalization, particularly in distinguishing closely clustered or partially occluded trees. The results for all the other plots are shown in Fig. 8.
In this research, the YOLOV12m model performs exceptionally well, while the YOLOv9t model also delivers strong performance. The YOLOv9s and YOLOv11s models show only average performance due to the detection of average number trees and model overfitting.
The ablation studies of this research were conducted to address many research questions such as comparison of the results of the best model with the results of other methods, performance of our best model in the other data set, and how does alternating the optimizer affect on the performance of the best model. In the start, different models with pre-trained weights such as Mask Region-based Convolutional Neural Network (Mask-R-CNN), RetinaNet, and DEtection TRansformer (DETR) are implemented on the dataset used for this research, where YOLOv12m better and achieved it’s best results. The results for all methods are shown in Table 5 below.
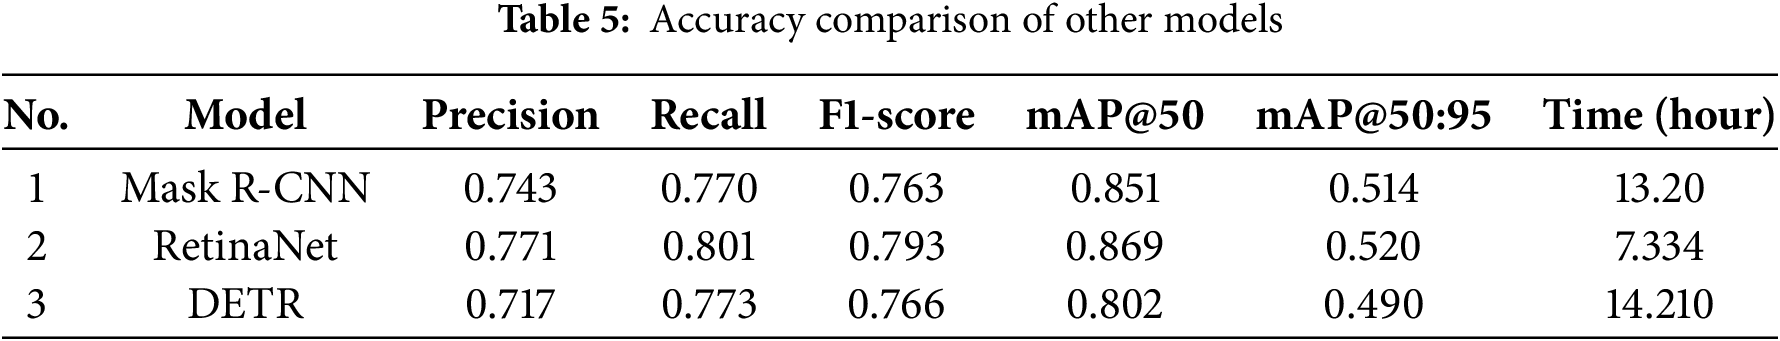
All these above models are tested on the same 10 plots sample data, but the performance of these models is poor as shown in Table 6.
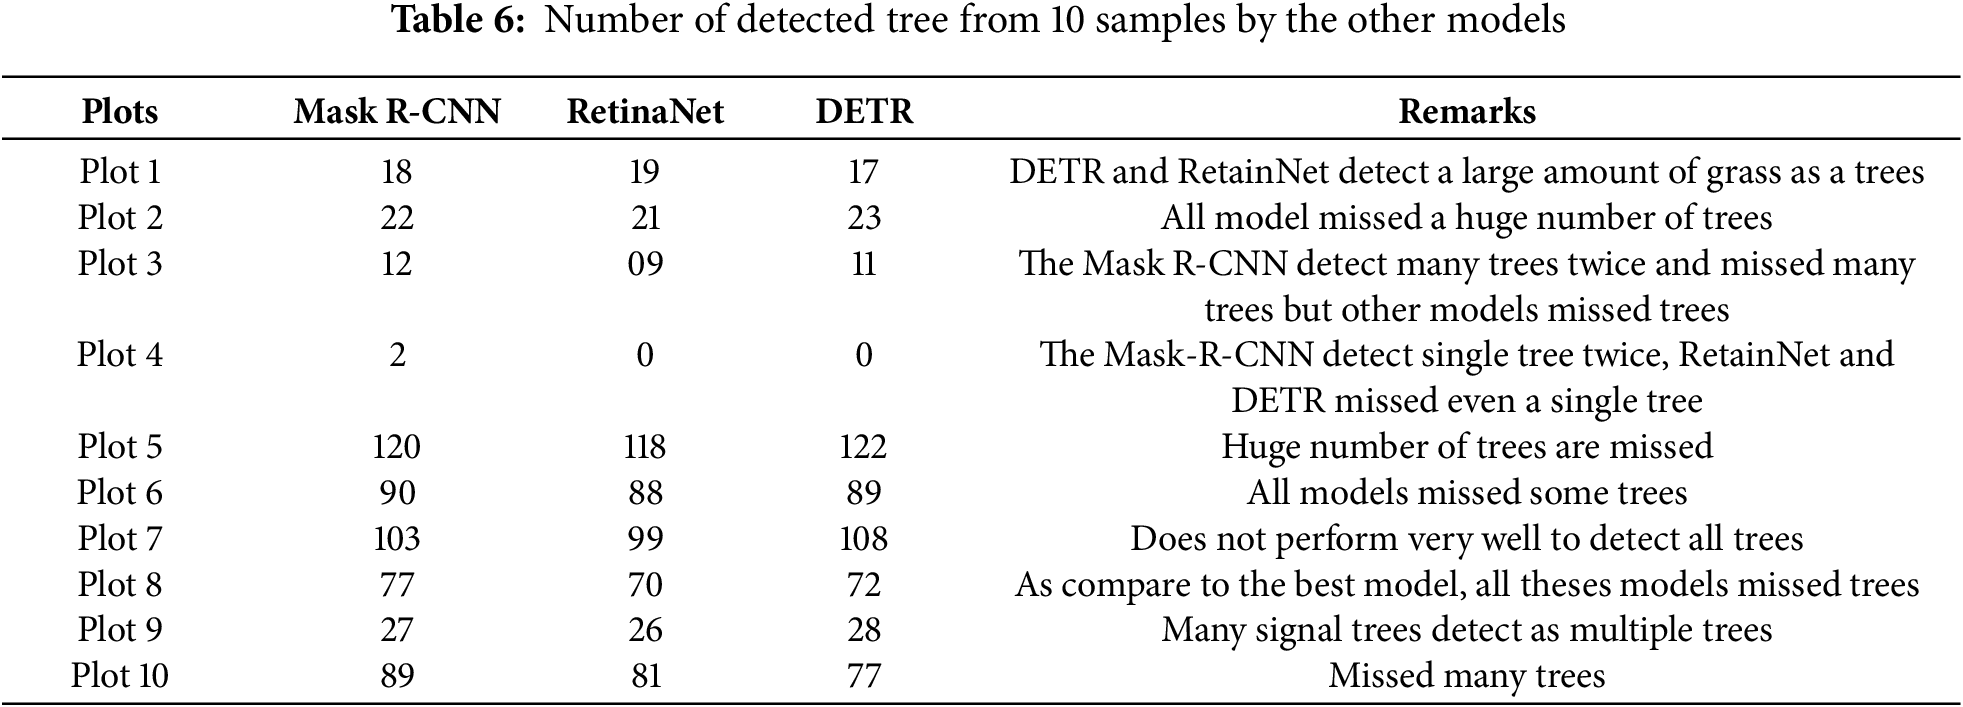
Table 6, represents the performance of MAsk R-CNN, RetainNet and DETR on the same 10 samples of different plots and try to count the number of trees from each plots, but does not perform very well.
After that, training and validation perform all the best models such as YOLOv12m, YOLOv9t, YOLOv9s and YOLOv11s with the different optimizer and by changing the learning rate. The Adam and AdamW optimizers are used to test the best model with a learning rate of 0.001 and to improve performance, but there are no significant improvements in the results. The results with the optimizations are given in Table 7 as follows.
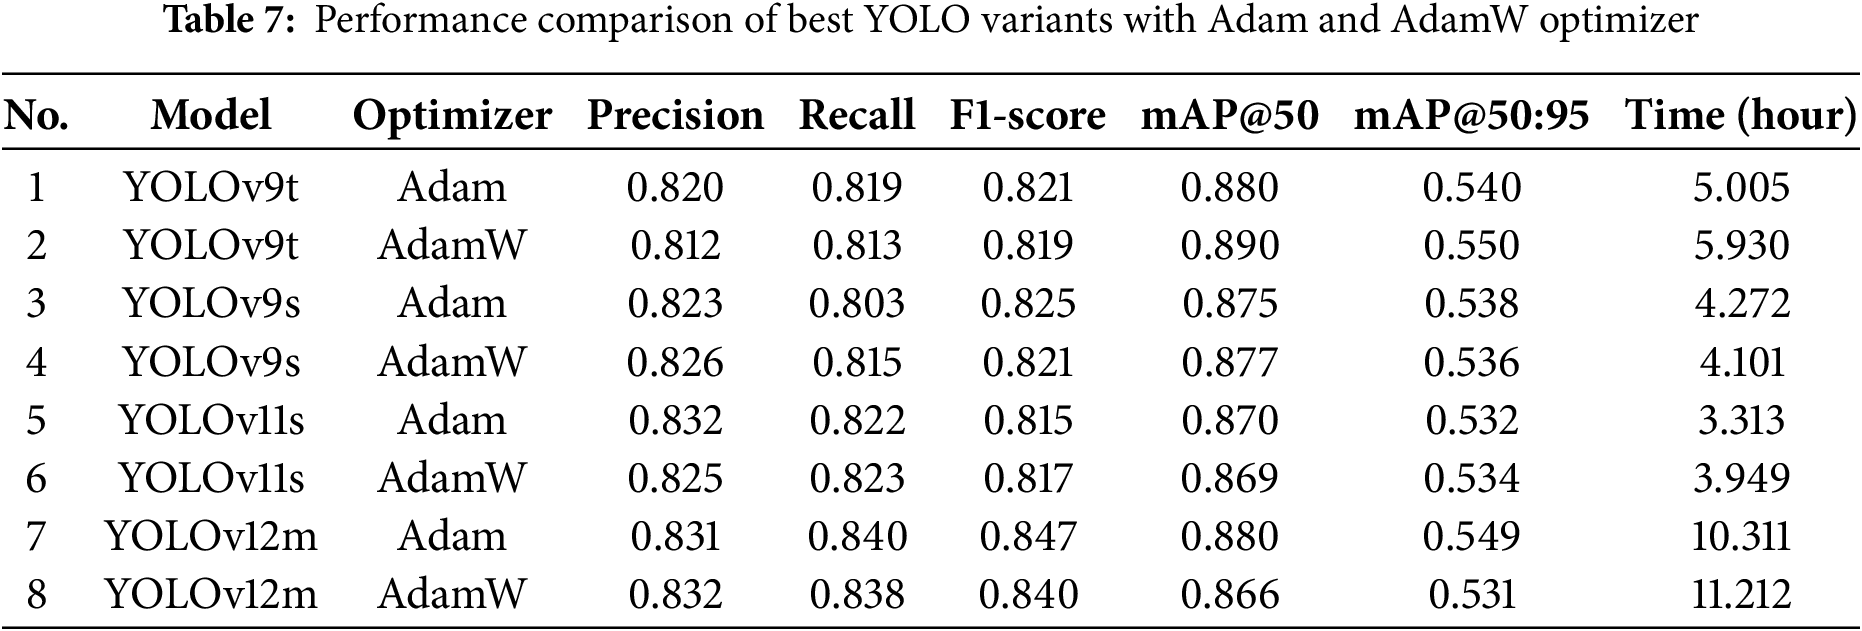
All four of the models that produced the best results were trained from the same set of data and for the same number of epochs for the sake of comparison. The models were trained from the same data, but we modified the optimization function to see how that impacted the result. These models perform very well with the SGD optimizer, and Adam and AdamW do not optimize the model performance and even increase the training time. The precision, recall,
This study explored the effectiveness of YOLO-based deep learning models for individual tree detection in RGB satellite imagery. Traditional methods for tree detection and forest monitoring, such as manual surveys and LiDAR-based techniques, are often costly, time-consuming, and require specialized equipment. In contrast, deep learning models, particularly the YOLO family of object detection networks, offer an efficient, accurate, and scalable alternative to monitoring forest and urban tree ecosystems.
Through a comprehensive evaluation of multiple variants of YOLO—YOLOv8, YOLOv9, YOLOv10, YOLOv11, and YOLOv12—this study identified YOLOv12m as the model that performs the best, achieving a mean average precision (mAP@50) of 0.908, mAP@50:95 of 0.581, recall of 0.851, precision of 0.852, and an
A key contribution of this research is the extensive benchmarking of data pre-processing and YOLO models with different hyperparameters, data training, and optimization strategies. The use of the stochastic gradient descent (SGD) method improved the performance of the model by fine-tuning parameters for improved detection capabilities. The study also highlights the importance of low-resolution training data, as the dataset used was preprocessed and augmented to optimize model generalization in various types of forests and urban areas.
This study demonstrates the practical applicability of YOLO-based tree detection in real-world scenarios. The ability to detect trees from RGB satellite imagery with high precision enables researchers, policy makers and conservationists to track deforestation, assess carbon stock, and monitor ecosystem health without relying on expensive LiDAR or UAV-based approaches. This AI-driven approach aligns with the growing demand for scalable and automated environmental monitoring solutions in the era of climate change and sustainable development. Based on the findings of this study, future research could explore several avenues of improvement. Combining RGB imagery with LiDAR, multispectral, or hyperspectral data could improve tree detection accuracy, species classification, and canopy segmentation. Additional techniques, such as instance segmentation models, U-Net-based Models or hybrid YOLO-transformer architectures, could be investigated to improve tree detection in densely packed forest environments.
Acknowledgement: The authors would like to thank Kaunas University of Technology for support and Horizon Europe Framework Program (HORIZON) for funding of this research.
Funding Statement: This research paper has received funding from Horizon Europe Framework Programme (HORIZON), call Teaming for Excellence (HORIZON-WIDERA-2022-ACCESS-01-two-stage)—Creation of the centre of excellence in smart forestry “Forest 4.0” No. 101059985. This research has been co-funded by the European Union under the project FOREST 4.0—“Ekscelencijos centras tvariai miško bioekonomikai vystyti” No.10-042-P-0002.
Author Contributions: Robertas Damaševicius and Irfan Abbas conceptualized the study, with Irfan Abbas conducting the experiments and analyzing the data. Irfan Abbas and Robertas Damaševicius contributed equally to the development of the YOLO-based methods for individual tree detection, model evaluation, and performance comparison. Robertas Damaševicius provided overall guidance and supervised the research. Both authors contributed to the writing, editing, and final approval of the manuscript. All authors reviewed the results and approved the final version of the manuscript.
Availability of Data and Materials: The dataset used for this study can be found in the Roboflow repository at https://universe.roboflow.com/test-dqo8y/forest-trees (accessed on 03 July 2025).
Ethics Approval: The study did not include human or animal subjects.
Conflicts of Interest: The authors declare no conflicts of interest to report regarding the present study.
References
1. Lozinska T, Zadorozhnyy A, Masalskiy V. Research of new technologies and innovations in the field of forestry. Agrobìologìâ. 2024;1(1):268–76. doi:10.33245/2310-9270-2024-187-1-268-276. [Google Scholar] [CrossRef]
2. Khachoo YH, Cutugno M, Robustelli U, Pugliano G. Mapping carbon dynamics: remote sensing insights into calabria’s landscapes (Southern Italy). In: 2024 IEEE International Workshop on Metrology for Living Environment (MetroLivEnv); 2024 Jun 12–14; Chania, Greece. p. 218–23. [Google Scholar]
3. Huang Y, Huang H, Qin F, Chen Y, Zou J, Liu B, et al. YOLO-IAPs: a rapid detection method for invasive alien plants in the wild based on improved YOLOv9. Agriculture. 2024;14(12):2201. doi:10.3390/agriculture14122201. [Google Scholar] [CrossRef]
4. Damaševicius R, Maskeliūnas R. Modeling forest regeneration dynamics: estimating regeneration, growth, and mortality rates in lithuanian forests. Forests. 2025;16(2):192. doi:10.3390/f16020192. [Google Scholar] [CrossRef]
5. Upadhyay T, Solberg B, Sankhayan PL. Use of models to analyse land-use changes, forest/soil degradation, and carbon sequestration with special reference to Himalayan region: a review and analysis. For Policy Econ. 2006;9(4):349–71. doi:10.1016/j.forpol.2005.10.003. [Google Scholar] [CrossRef]
6. Pettorelli N. Satellite remote sensing to support agriculture and forestry. In: Satellite remote sensing and the management of natural resources. Oxford, UK: Oxford Academic; 2019. [Google Scholar]
7. Verma P, Ghosh PK. The economics of forest carbon sequestration: a bibliometric analysis. Environ Dev Sustain. 2024;26(2):2989–3019. doi:10.1007/s10668-023-02922-w. [Google Scholar] [CrossRef]
8. Parr T. Role of biodiversity in climate change mitigation (ROBIN). Final Report; Brussels, Belgium: European Commission; CEH Project no. C04500. 2016; 2016. [Google Scholar]
9. Wilkinson M, Bell M, Baer T, Xenakis G. Measuring and monitoring trees and forests using a novel IoT approach. In: EGU General Assembly 2021; 2021 Apr 19–30; p. EGU21-887. [Google Scholar]
10. Husain A, Vaishya RC. Detection and thinning of street trees for calculation of morphological parameters using mobile laser scanner data. Remote Sens Appl Soc Environ. 2019;13(2):375–88. doi:10.1016/j.rsase.2018.12.007. [Google Scholar] [CrossRef]
11. Sedjo R, Sohngen B. Carbon sequestration in forests and soils. Annual Review Res Econ. 2012;4(1):127–44. doi:10.1146/annurev-resource-083110-115941. [Google Scholar] [CrossRef]
12. Damaševičius R, Mozgeris G, Kurti A, Maskeliūnas R. Digital transformation of the future of forestry: an exploration of key concepts in the principles behind Forest 4.0. Front For Glob Change. 2024;7:1424327. doi:10.3389/ffgc.2024.1424327. [Google Scholar] [CrossRef]
13. Maskeliunas R, Damaševičius R. D’alembert convolution for enhanced spatio-temporal analysis of forest ecosystems. Annals Comput Sci Intell Syst. 2024;2024:141–8. [Google Scholar]
14. Damaševičius R, Maskeliunas R. A reinforcement learning-based adaptive digital twin model for forests. In: 4th International Conference on Applied Artificial Intelligence (ICAPAI); 2024 Apr 16; Halden, Norway. p. 1–7. [Google Scholar]
15. Damaševičius R, Maskeliũas R. Distributed random forest for predicting forest wildfires based on weather data. Commun Comput Inf Sci. 2024;2091:305–20. doi:10.1007/978-3-031-64064-3_22. [Google Scholar] [CrossRef]
16. Qurthobi A, Damasevicius R, Barzdaitis V, Maskeliunas R. Robust forest sound classification using pareto-mordukhovich optimized MFCC in environmental monitoring. IEEE Access. 2025;13:20923–44. doi:10.1109/access.2025.3535796. [Google Scholar] [CrossRef]
17. Yang J, Gan R, Luo B, Wang A, Shi S, Du L. An improved method for individual tree segmentation in complex urban scene based on using multispectral LiDAR by deep learning. IEEE J Sel Top Appl Earth Obs Remote Sens. 2024;17:6561–76. doi:10.1109/jstars.2024.3373395. [Google Scholar] [CrossRef]
18. Xu S, Wang R, Shi W, Wang X. Classification of tree species in transmission line corridors based on YOLO v7. Forests. 2023;15(1):61. doi:10.3390/f15010061. [Google Scholar] [CrossRef]
19. Eitel JU, Höfle B, Vierling LA, Abellán A, Asner GP, Deems JS, et al. Beyond 3-D: the new spectrum of lidar applications for earth and ecological sciences. Remote Sens Environ. 2016;186(3):372–92. doi:10.1016/j.rse.2016.08.018. [Google Scholar] [CrossRef]
20. Bikuviene I, Mozgeris G. Testing the simultaneous use of laser scanning and aerial image data for estimation of tree crown density. In: Annual 16th International Scientific Conference Proceedings; 2010 May 19–21; Jelgava, Latvia. p. 201–7. [Google Scholar]
21. Qin H, Zhou W, Yao Y, Wang W. Individual tree segmentation and tree species classification in subtropical broadleaf forests using UAV-based LiDAR, hyperspectral, and ultrahigh-resolution RGB data. Remote Sens Environ. 2022;280:113143. doi:10.1016/j.rse.2022.113143. [Google Scholar] [CrossRef]
22. Li Q, Yan Y. Street tree segmentation from mobile laser scanning data using deep learning-based image instance segmentation. Urban For Urban Greening. 2024;92(22):128200. doi:10.1016/j.ufug.2023.128200. [Google Scholar] [CrossRef]
23. Liu H, Li W, Jia W, Sun H, Zhang M, Song L, et al. Clusterformer for pine tree disease identification based on UAV remote sensing image segmentation. IEEE Trans Geosci Remote Sens. 2024;62(4):5609215. doi:10.1109/tgrs.2024.3362877. [Google Scholar] [CrossRef]
24. Terekhov V, Bondarenko D, Ryzhkova I, Zelinskii D. Tree segmentation of LiDAR point clouds using a graph-based algorithm. In: 2024 6th International Youth Conference on Radio Electronics, Electrical and Power Engineering (REEPE); 2024 Feb 29–Mar 2; Moscow, Russian Federation. p. 1–6. [Google Scholar]
25. Pu Y, Xu D, Wang H, Li X, Xu X. A new strategy for individual tree detection and segmentation from leaf-on and leaf-off UAV-LiDAR point clouds based on automatic detection of seed points. Remote Sens. 2023;15(6):1619. doi:10.3390/rs15061619. [Google Scholar] [CrossRef]
26. Straker A, Puliti S, Breidenbach J, Kleinn C, Pearse G, Astrup R, et al. Instance segmentation of individual tree crowns with YOLOv5: a comparison of approaches using the ForInstance benchmark LiDAR dataset. ISPRS Open J Photogramm Remote Sens. 2023;9(3):100045. doi:10.1016/j.ophoto.2023.100045. [Google Scholar] [CrossRef]
27. Chen X, Jiang K, Zhu Y, Wang X, Yun T. Individual tree crown segmentation directly from UAV-borne LiDAR data using the PointNet of deep learning. Forests. 2021;12(2):131. doi:10.3390/f12020131. [Google Scholar] [CrossRef]
28. Cheng MF, Mukundan A, Karmakar R, Valappil MAE, Jouhar J, Wang HC. Modern trends and recent applications of hyperspectral imaging: a review. Technologies. 2025;13(5):170. doi:10.3390/technologies13050170. [Google Scholar] [CrossRef]
29. Yao S, Hao Z, Post CJ, Mikhailova EA, Lin L. Individual tree crown detection and classification of live and dead trees using a mask region-based convolutional neural network (Mask R-CNN). Forests. 2024;15(11):1900. doi:10.3390/f15111900. [Google Scholar] [CrossRef]
30. Putra YC, Wijayanto AW. Automatic detection and counting of oil palm trees using remote sensing and object-based deep learning. Remote Sens Appl Soc Environ. 2023;29(2):100914. doi:10.1016/j.rsase.2022.100914. [Google Scholar] [CrossRef]
31. Ahlswede S, Schulz C, Gava C, Helber P, Bischke B, Förster M, et al. TreeSatAI Benchmark Archive: a multi-sensor, multi-label dataset for tree species classification in remote sensing. Earth Syst Sci Data. 2023;15(2):681–95. doi:10.5194/essd-15-681-2023. [Google Scholar] [CrossRef]
32. He K, Zhang X, Ren S, Sun J. Deep residual learning for image recognition. In: Proceedings of the IEEE Conference on Computer Vision and Pattern Recognition; 2016 Jun 27–30; Las Vegas, NV, USA. p. 770–8. [Google Scholar]
33. Sparks AM, Smith AM. Accuracy of a lidar-based individual tree detection and attribute measurement algorithm developed to inform forest products supply chain and resource management. Forests. 2021;13(1):3. doi:10.3390/f13010003. [Google Scholar] [CrossRef]
34. Hao Z, Lin L, Post CJ, Mikhailova EA, Li M, Chen Y, et al. Automated tree-crown and height detection in a young forest plantation using mask region-based convolutional neural network (Mask R-CNN). ISPRS J Photogramm Remote Sens. 2021;178(7832):112–23. doi:10.1016/j.isprsjprs.2021.06.003. [Google Scholar] [CrossRef]
35. e Hani U, Munir S, Younis S, Saeed T, Younis H. Automatic tree counting from satellite imagery using YOLO V5, SSD and UNET models: a case study of a campus in Islamabad, Pakistan. In: 3rd International Conference on Artificial Intelligence (ICAI); 2023 Feb 22–23; Islamabad, Pakistan. p. 88–94. [Google Scholar]
36. Beloiu M, Heinzmann L, Rehush N, Gessler A, Griess VC. Individual tree-crown detection and species identification in heterogeneous forests using aerial RGB imagery and deep learning. Remote Sens. 2023;15(5):1463. doi:10.3390/rs15051463. [Google Scholar] [CrossRef]
37. test. forest trees Dataset. Roboflow; 2023 [Dataset]. [cited 2025 Feb 25]. Available from: https://universe.roboflow.com/test-dqo8y/forest-trees. [Google Scholar]
38. Redmon J, Divvala S, Girshick R, Farhadi A. You only look once: Unified, real-time object detection. In: Proceedings of the IEEE Conference on Computer Vision and Pattern Recognition; 2016 Jun 27–30; Las Vegas, NV, USA. p. 779–88. [Google Scholar]
39. Xue Z, Xu R, Bai D, Lin H. YOLO-Tea: a tea disease detection model improved by YOLOv5. Forests. 2023;14(2):415. doi:10.3390/f14020415. [Google Scholar] [CrossRef]
40. Geetha AS. What is yolov6? a deep insight into the object detection model. arXiv:2412.13006. 2024. [Google Scholar]
41. Cao L, Zheng X, Fang L. The semantic segmentation of standing tree images based on the Yolo V7 deep learning algorithm. Electronics. 2023;12(4):929. doi:10.3390/electronics12040929. [Google Scholar] [CrossRef]
42. Zhong J, Qian H, Wang H, Wang W, Zhou Y. Improved real-time object detection method based on YOLOv8: a refined approach. J Real-Time Image Process. 2025;22(1):1–13. doi:10.1007/s11554-024-01585-8. [Google Scholar] [CrossRef]
43. Yaseen M. What is yolov9: an in-depth exploration of the internal features of the next-generation object detector. arXiv:2409.07813. 2024. [Google Scholar]
44. Wang A, Chen H, Liu L, CHEN K, Lin Z, Han J, et al. YOLOv10: real-time end-to-end object detection. In: Globerson A, Mackey L, Belgrave D, Fan A, Paquet U, Tomczak J, et al., editors. Advances in neural information processing systems. Vol. 37. Red Hook, NY, USA: Curran Associates, Inc.; 2024. p. 107984–8011. [Google Scholar]
45. Khanam R, Hussain M. Yolov11: an overview of the key architectural enhancements. arXiv:2410.17725. 2024. [Google Scholar]
46. Tian Y, Ye Q, Doermann D. YOLOv12: attention-centric real-time object detectors. arXiv:2502.12524. 2025. [Google Scholar]
Cite This Article
 Copyright © 2025 The Author(s). Published by Tech Science Press.
This work is licensed under a Creative Commons Attribution 4.0 International License , which permits unrestricted use, distribution, and reproduction in any medium, provided the original work is properly cited.
 Downloads
 Citation Tools