
 Submit a Paper
 Propose a Special lssue
 Open Access
ARTICLE
An Optimization-Driven Design Scheme of Lightweight Acoustic Metamaterials for Additive Manufacturing
1 State Key Laboratory of Intelligent Manufacturing Equipment and Technology, Huazhong University of Science and Technology, Wuhan, 430074, China
2 Institute of Interdisciplinary Research for Mathematics and Applied Science, School of Mathematics and Statistics, Huazhong University of Science and Technology, Wuhan, 430074, China
* Corresponding Author: Qiong Wang. Email:
(This article belongs to the Special Issue: Optimization Design for Material Microstructures)
Computers, Materials & Continua 2025, 85(1), 557-580. https://doi.org/10.32604/cmc.2025.067761
Received 12 May 2025; Accepted 07 July 2025; Issue published 29 August 2025
 View Full Text
 Download PDF
Abstract
Simultaneously, reducing an acoustic metamaterial’s weight and sound pressure level is an important but difficult topic. Considering the law of mass, traditional lightweight acoustic metamaterials make it difficult to control noise efficiently in real-life applications. In this study, a novel optimization-driven design scheme is developed to obtain lightweight acoustic metamaterials with a strong sound insulation capability for additive manufacturing. In the proposed design scheme, a topology optimization method for an acoustic metamaterial in the acoustic-solid interaction system is implemented to obtain an initial cross-sectional topology of the acoustic microstructure during the conceptual design phase. Then, in the detailed design phase, the parametric model for a higher-dimensional design is formulated based on the topology optimization result. An adaptive Kriging interpolation approach is proposed to accurately reformulate a much easier surrogate model from the original parameterization formulation to avoid repeating calls for nonlinear analyses in the 3D acoustic-structure interaction system. A surrogate model was used to optimize a ready-to-print acoustic metamaterial with improved noise reduction performance. Experimental verification based on an impedance tube is implemented. Results demonstrate characteristics of the devised metamaterial as well as the proposed method.Keywords
Noise control and acoustic design for products have become major concerns in the engineering community [1,2]. Engineering acoustic problems usually exhibit the characteristics of unboundedness and broadband [3–5], which poses a challenging task in devising the required acoustic structures to enhance sound absorption capability. The problem becomes more difficult, especially in the application field of aeronautics and astronautics which have strict restrictions on structural weight and size [6]. Therefore, acoustic metamaterials, as a kind of artificial materials with sophisticated microstructures, are developed to break through the bottleneck of conventional acoustic materials [7–10]. They are usually recognized to have great potential in reducing weight but increasing multifunctional performance due to their design flexibility.
Metamaterial systems have provided novel acoustic functionalities and broadened the design space. Therefore, since their first occurrence, a variety of approaches have been proposed to design these artificial material microstructures. The core of these developed methods is to formulate an inverse design to determine the best topology, shape, and size of the microstructure within the given design domain. However, the selection of the optimal design parameters, which are used to describe the structural topology, shape, and size, is a difficult task given that there can be many possible combinations of these design parameters. Furthermore, several combinations of the design parameters will result in a similar material property, which is known as the no uniqueness of the solution of inverse design problems. So far, the most popular design method for metamaterials is defined in a physics-driven way [11]. In this method, the analytical model and numerical simulation are interactively used to synthesize a metamaterial microstructure with expected performances. However, this method mainly relies on designers’ knowledge. It will fail to work especially when a large number of design parameters and multiple functionalities are considered. Currently, systematic optimization methods for acoustic metamaterial design are still incomplete.
As an efficient optimization tool for devising high-performance structures and materials, topology optimization has been extensively investigated over the past decades. To date, researchers have proposed many topological optimization methods, including level set method (LSM) [12–14], solid isotropic material with penalization (SIMP) [15–17], the homogenization method [18], evolutionary structural optimization (ESO) [19], and explicit component-based method [20,21]. Topology optimization methods for designing acoustic metamaterials have also been developed. For example, a two-scale homogenization method is proposed to design acoustic metamaterials with directed wave propagation [22] and negative refraction [23]. Du et al. [24] combined the SIMP method with coupling physics to design a vibrating structure with optimal sound pressure properties in a surrounded acoustic medium. ESO and LSM-based topology optimization for the design of acoustic metamaterials have also been investigated [25–28]. Furthermore, taking into account the complexity of the solution space in the design of acoustic metamaterials, full-bandwidth and directional bandgap designs have been achieved in acoustic metamaterials through non-gradient topological optimization [29]. Meanwhile, the decoupled mechanism design approach is used to enable the design of multifunctional sound-absorbing and structural metamaterials [30]. A new class of multifunctional bioinspired micro-lattice inspired by bamboo was also designed with excellent acoustic absorption performance, damage resistance, and high strength-to-weight ratio [31]. Topology optimization can provide an effective tool for the conceptual design of acoustic metamaterials. However, most of the acoustic metamaterials designed are planar structures with complex topological configurations. As a result, these design results of acoustic metamaterials are not yet available for direct engineering applications or fabrications. Furthermore, it should be noted that the performance of acoustic metamaterials is more dependent on specific geometric parameters.
Parameter optimization is the process of detailed design for structural shape and size parameters [32,33], which can not only improve the properties of the initial structures by topology optimization but also meet the requirements of various sizes and shapes. At the same time, parameter optimization can simplify the topological configuration of a structure and make it easy to be manufactured, so that the optimized structures can be directly applied to actual engineering. However, the optimization design of the acoustic metamaterials is a strongly nonlinear problem. Scholars usually combine nonlinear finite element (FE) and boundary element methods (BEM) to analyze coupled acoustic-structure systems [34,35]. Therefore, the traditional parameter optimization methods make it difficult to solve the analysis and calculation issues of the high-dimensional design space of acoustic metamaterials, and the numerical solution is extremely expensive. To address this issue, a surrogate model (SM) [36,37] is used to overcome the insufficient computing power and complicated modeling of structures in traditional optimization methods. The SM is an analytical model generated and supported by existing data. Based on extensive data learning, the SM can integrate constraints, design variables, and objective functions into a unified framework while meeting certain precision requirements. By applying SM, not only can computational costs be reduced, but the precision of the results is comparable to that of high-precision commercial analysis software [38–40]. The Kriging interpolation model is both a typical SM and an unbiased estimation model that combines regression models and stochastic processes. This method is suitable for highly nonlinear problems. However, the Kriging interpolation model has shortcomings, such as complicated calculation steps, slow interpolation speed, and insufficient interpolation accuracy. To overcome the abovementioned shortcomings effectively, scholars have also improved the traditional Kriging algorithm [41,42].
All in all, the research on topology optimization of acoustic metamaterials is mostly in the conceptual design stage, and the acoustic metamaterials cannot be directly applied to the actual engineering. The topology optimization method needs to be combined with the parameter optimization method to give full play to the advantages of each design method. Furthermore, to meet the analysis requirements of nonlinear finite element and boundary element methods, it is necessary to establish an efficient and accurate SM. Therefore, it is urgent to study a systematic acoustic metamaterial design method, including topology optimization, parameter optimization, and performance verification.
In this study, a systematic optimization scheme for pressure modulation acoustic metamaterial (PMAM) under acoustic-structure interaction (ASI) system is developed. A density-based topology optimization method and a surrogate model-based parameter optimization approach are in turn used to devise the expected acoustic material microstructure from conceptual design to detailed design. In this fashion, the devised PMAM can be ready for additive manufacturing without any further post-processing. The impedance tube experiment is implemented on the additively manufactured samples to verify the characteristics of the designed metamaterial as well as the proposed method. This optimization-driven design scheme can provide a novel way to devise lightweight and high-performance acoustic metamaterials. The remaining sections of this paper are organized as follows: Section 2 provides a detailed description of the optimization problem of PMAM. Section 3 describes the topological optimization method used in PMAM. Section 4 develops the parameter optimization method based on topology optimization. Section 5 describes the experimental verifications of PMAM. Section 6 concludes the paper.
2 Acoustic Description of PMAM
The acoustic pressure is the foundation of acoustic studies, which can be controlled effectively in various ways. Specifically, the noise level in an ASI system is represented by the acoustic pressure. Hence, the acoustic pressure is regarded as a key indicator of acoustic metamaterials. In the ASI analysis, the acoustic wave equation reflects the functional relationship between the acoustic pressure, position, and time. Furthermore, it satisfies Newton’s second law, the law of mass conservation, and the state equation. The Helmholtz equation reveals the nature of plane acoustic waves in an ideal medium within the frequency domain, as described below [43].
where p represents sound pressure, and k represents wave number.
A harmonic excitation f(ω) is applied to the structure to obtain the expression about the displacement response u(ω), as follows [44]:
where A(ω) denotes the frequency response function, which is the dynamic stiffness matrix. ω represents the circular frequency.
A(ω) is expressed as:
where K is the static stiffness matrix, D is the damping matrix, and M is the mass matrix. i is an imaginary component i2 = −1.
When an acoustic wave enters a solid structure, it forms various angles with the coupling interface. In practical applications, the normal velocity of the acoustic wave is used for the acoustic calculation. Meanwhile, the normal velocity presents the radiation of acoustic waves through the coupling interface, and it is widely recognized to have a higher computing precision. Moreover, it facilitates the establishment of an acoustic radiation model in the structure-acoustic coupling system and improves calculation efficiency. The normal velocity of a structure is expressed as [45]:
The acoustic pressure response at a point inside the solid structure can be obtained by multiplying the velocity matrix with the influence coefficient matrix bT(ω) according to the BEM [46]. n is a normal vector. The frequency response of the internal acoustic pressure for the solid is expressed as:
where bT(ω) is calculated by the Helmholtz integral equation:
where G and H represent the global system matrices. g and h represent the column vectors of the two global system matrices, respectively. The nodes of the diagonal matrix Y contain the boundary conductance values. Therefore, the response speed of the acoustic-structural contact surface calculated using the FEM can be used for internal acoustic pressure calculations. The acoustic pressure response ps of the acoustic-structural coupling interface is obtained by adding the acoustic pressures of all elements:
In the structure-acoustic coupling system, the normal force at the coupling boundary is dominant. Thus, the normal force mainly results in the displacements of the structural surface and the inner surface of the acoustic field. The displacements of the structural surface and air in the acoustic field satisfy the following relationship [47]:
where us and ua represent the displacements of the structural surface and air surface at the boundary of the coupling structure, respectively. ns and na represent the normal vectors of the surface and air surface at the coupling boundary, respectively.
The displacement and surface force of the boundary node are obtained from the boundary element in the plane acoustic problem, which is equivalent to the external force on the solid design domain. In a coupled boundary system, the force fs of acoustic pressure p on the structure can be considered as an external load on that structure:
where Ns represents the interpolation function of a rectangular FE; Na represents the interpolation function of the coupled boundary element.
By the Helmholtz boundary integral equation [47], the acoustic pressure pss at the internal point p of a structure can be calculated with the acoustic pressure fs and normal velocity vn on the boundary Гs:
where G = e−ikr(4πR)−1 is the Green function. ρ represents the density of an isotropic medium. R represents the distance from point P inside the structure to a point on the acoustic-structural coupling interface Гs. φ is the space angle, which is expressed as:
Substituting Eq. (11) into Eq. (10), it yields the acoustic pressure at any point in the solid structural design domain:
To form a closed system of equations, point P traverses all nodes on the acoustic boundary, and the equations for each node are extended and integrated. Eq. (12) is solved using the BEM to obtain the steady boundary equation of the acoustic pressure and displacements:
where p denotes the total number of node pressure amplitudes on the coupled boundary. φ represents a diagonal matrix formed by the spatial angles at the nodes on the coupling boundary. G and H represent the overall matrices assembled by each element node of the first and second items at the right end of Eq. (10), respectively, which are the same as those in Eq. (6).
The distribution equation of acoustic pressure in the acoustic-structural coupling system is integrated using Eqs. (7) and (12), which can be expressed as:
The acoustic pressure distribution equation shown in Eq. (14) is a nonlinear equation group, which is analyzed using nonlinear finite element theory. Hence, the FEM is used to analyze the structural response and the BEM is used to address the acoustic radiation problem in this work.
3 Topology Optimization of PMAM
3.1 Modeling for Topology Optimization
The main purpose of this section is to design the primary structural configuration and its corresponding acoustic characteristics with the help of topology optimization [23,25,48]. For convenience, the following assumptions are made: (1) the acoustic structure dimensions are much smaller with respect to the acoustic wavelength for the subwavelength structures, which are more prone to reflection and refraction; (2) the reference points and integration boundaries in acoustic analysis remain unchanged in topological optimization iterative design [49]. Then, the sound pressure level (SPL) minimization of solid structures in the ASI system is taken as the objective function in this study. A corresponding topology optimization model can be established based on the SIMP method and combined with a projection basis filter [50]:
where xi is an optimization variable in the optimization model, representing the finite element relative density. vi represents the finite element relative volume. α represents the maximum volume fraction. V denotes the overall space volume of the structural design space. xmin is the minimum material density taken as 0.001 (non-zero to avoid singularity).
The sensitivities of the first two constraint functions in Eq. (15) can be directly calculated by taking the derivative of the design variable X:
Given that the size of the solid structure is much smaller than the wavelength of the acoustic wave, we have ∂f/∂X = 0. Thus, Eq. (16) can be transformed into the following expression:
By substituting Eq. (3) into Eq. (18), it yields:
Eq. (19) represents the sensitivity of the dynamic frequency response. Then, by substituting Eq. (17) into Eq. (18), we can have:
Since the reference points and integration boundaries remain unchanged during optimization, ∂G/∂X and ∂H/∂X are equal to zero. Thus, Eq. (20) can be converted into the following expression.
Eq. (21) denotes the sensitivity of the acoustic pressure of this optimization model. In this study, the derivative of u with respect to X is computed by the so-called adjoint variable method [49]. After obtaining the sensitivity information, the topology optimization formulation can be solved by the optimality criterion algorithm [13,51,52], which is widely accepted in the community of topology optimization.
3.2 Topology Optimization Design
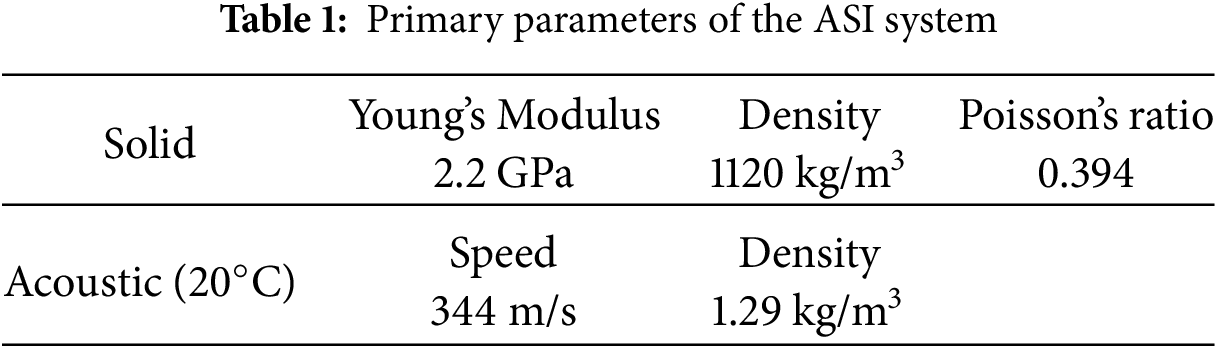
The ASI system is assumed to be a bounded and closed system, its relative position and dimensions are shown in Fig. 1. Fig. 1a,b is the 3D and plan schematic diagrams, respectively. The solid part represents the PMAM in the ASI system. Surfaces A and B are two opposite faces of the PMAM. Herein, A is the surface where the acoustic wave impacts. Its structural parameters primarily affect the noise consumption capacity. Meanwhile, B is the structural function surface, and its structural parameters affect the noise reduction performance. In this study, the specific optimization objective is to obtain PMAM with the lowest sound pressure level (SPL) in the ASI system. According to the acoustic pressure expression in Eq. (14), the objective function of topology optimization is minimizing the SPL of surface B, which can reflect the noise filtering level of the PMAM. The primary parameters of the ASI system are shown in Table 1.
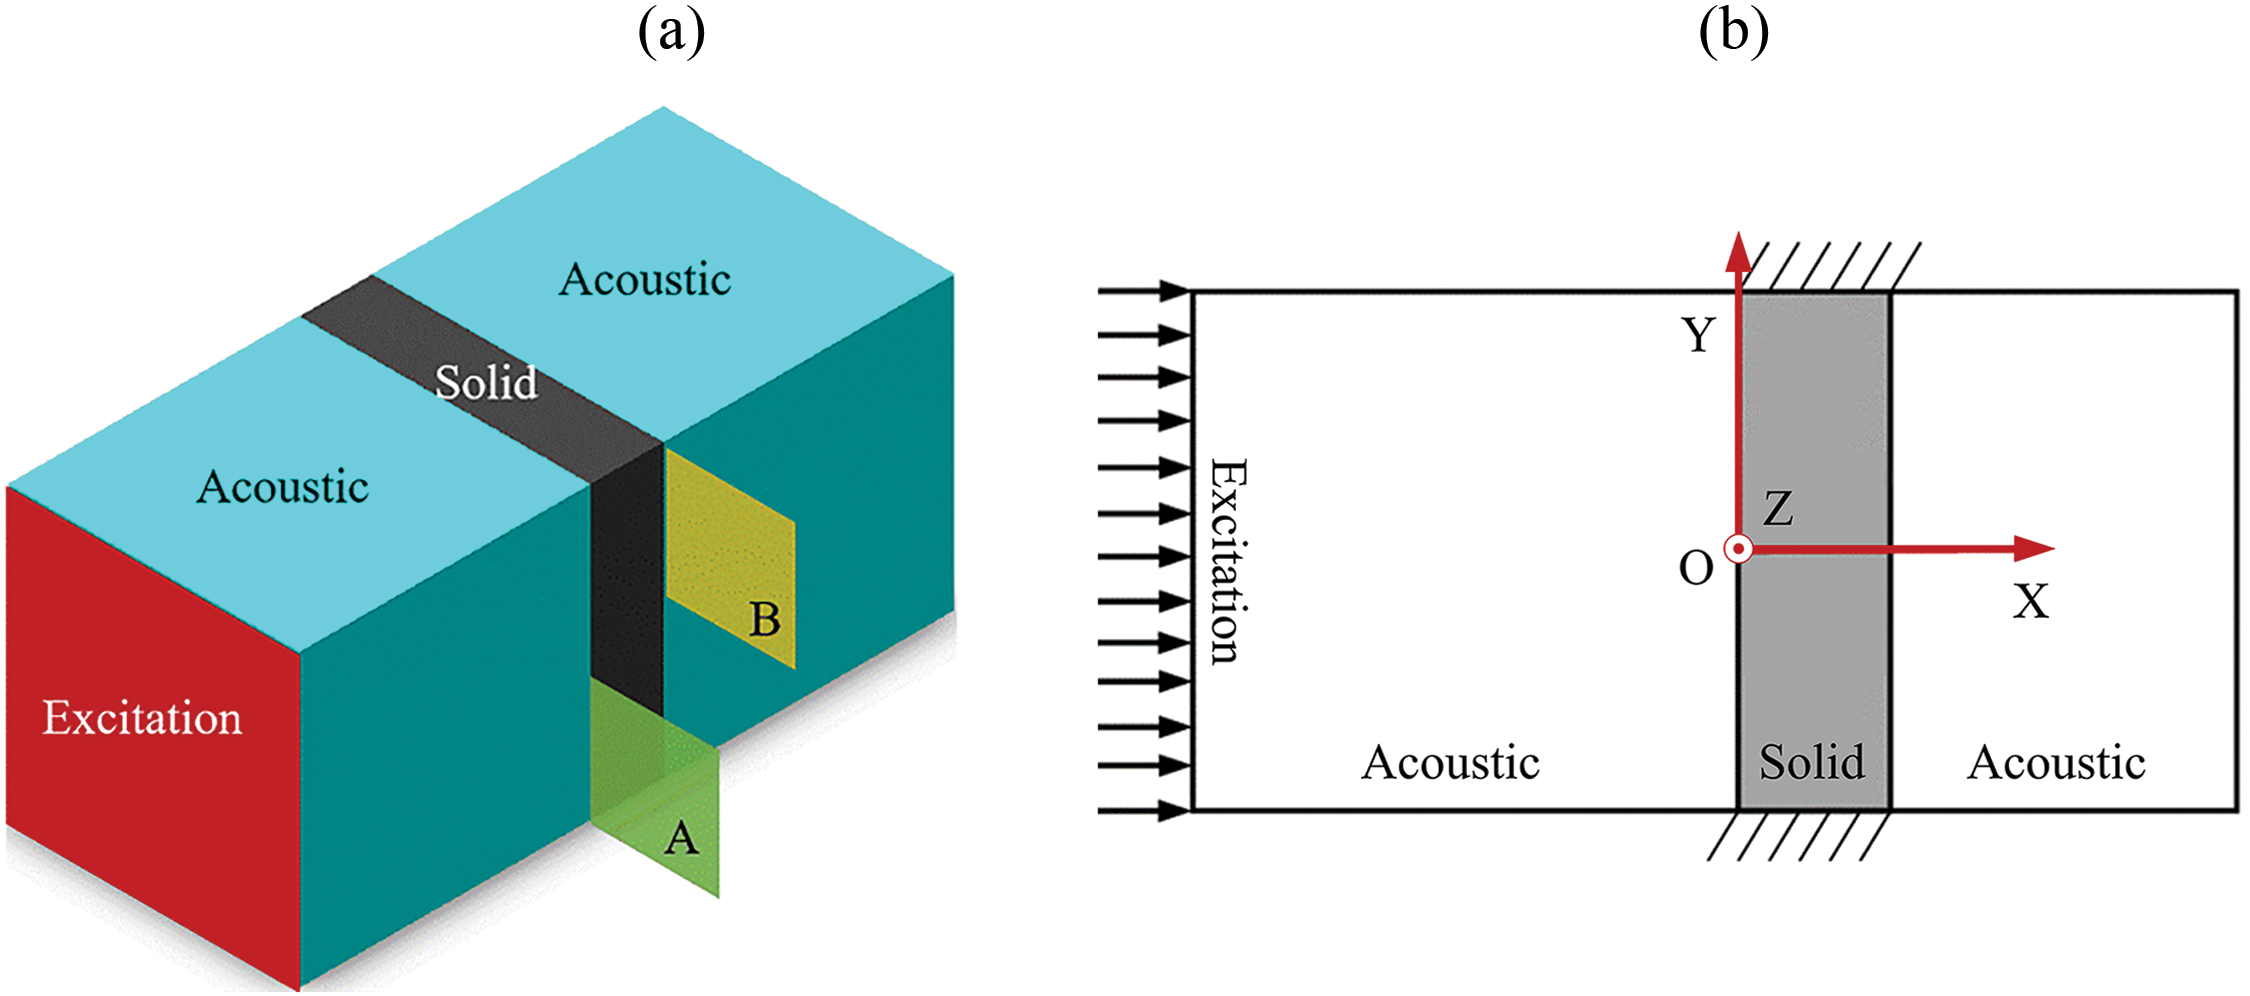
Figure 1: ASI system: (a) 3D diagram (b) plan schematic diagram
In this study, the solid region in Fig. 1 is assumed to be filled with uniform metamaterial microstructures. Thus, in the conceptual design phase using topology optimization, we simplify the solid structure in the ASI system as a planar structure. The 2D structure design domain is discretized by 100 × 100 quadrangle FEs. The volume fraction constraint is defined as 60%. The stimulated SPL is maintained at 70 dB. The initial design is completely solid, and the topology optimization iteration takes 82 steps to converge to an optimized design. The iterative history and several typical designs during the optimization process are plotted in Fig. 2.
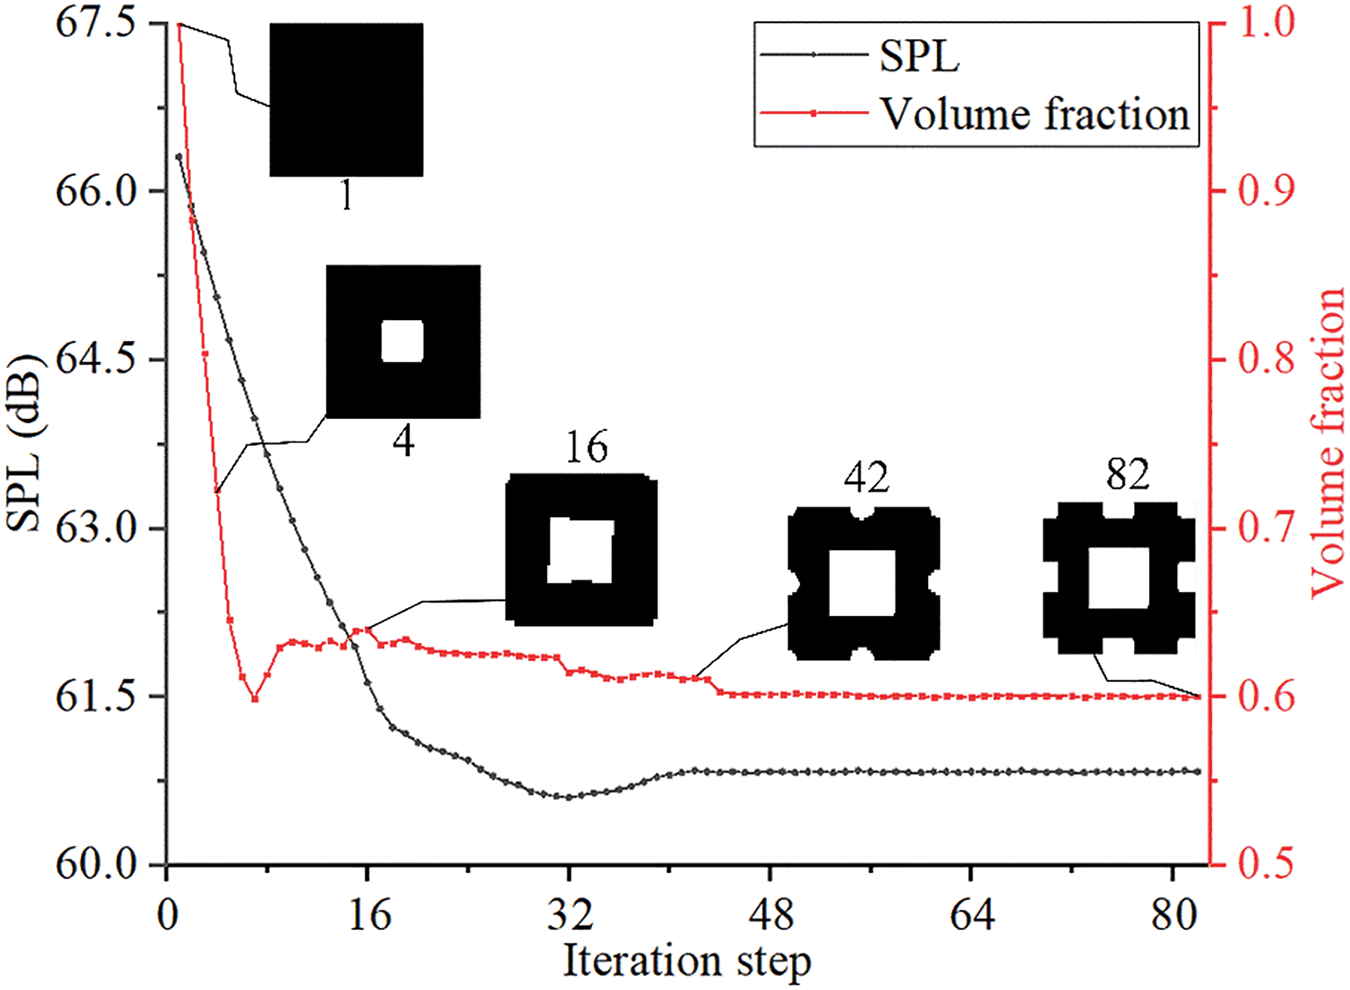
Figure 2: Iteration history of topology optimization
As can be seen from Fig. 2, the topologically optimized design (82th step) has several holes compared with the initial solid design (1st step). This characteristic facilitates the diffraction of acoustic waves during the propagation process and the friction of the cavity wall to consume energy. Hence, the sound absorption and noise reduction abilities of the PMAM can be improved. As shown in Fig. 2, the SPL of the initial structure is 66.31 dB. The SPL of the optimized structure is 60.83 dB, with a drop of 8.26%. Furthermore, the material usage of the optimized design is 40% less than that of the initial design. Therefore, a 2D conceptual design of lightweight PMAM can be obtained using the topology optimization design. To strengthen the sound absorption ability of the PMAM, it is necessary to optimize the structure parameters to achieve a detailed design with the manufacturable features.
4 SM-Based Parameter Optimization for PMAM
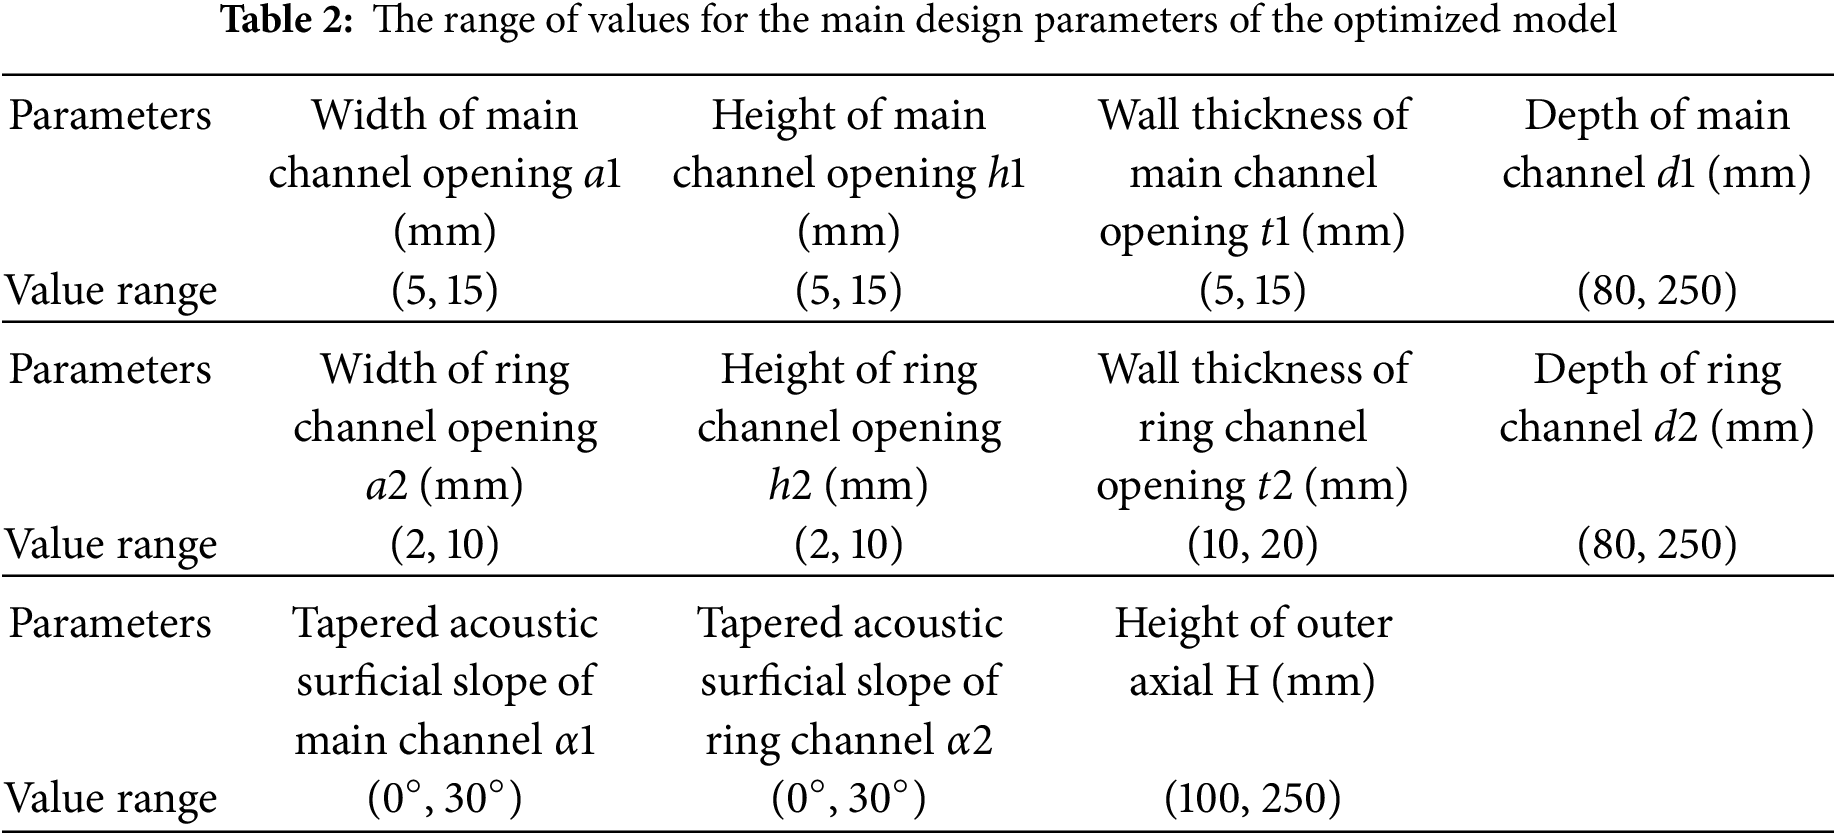
Parameter optimization of the 3D PMAM based on the conceptual design of topology optimization is performed to enhance its sound absorption and noise reduction performance. First, the 2D configuration obtained through topology optimization is remodelled, as shown in Fig. 3a. Then, the remodelled structure in Fig. 3a is taken as the cross-sectional shape of a 3D porous PMAM with the 10 × 10 periodicity, as shown in Fig. 3b. The porous structure has many repeated unit cells, which exhibit excellent noise reduction and sound absorption properties. Finally, the 3D porous PMAM in Fig. 3c is obtained by stretching the 2D structure in Fig. 3b. As shown in Fig. 4, the parameter settings for the structured unit cell reflect the dimensions of the entire 3D PMAM structure. Table 2 shows the range of values for the main design parameters of the optimized model. Additionally, setting a1 > a2, h1 > h2 is necessary due to the application requirement. In both literature and engineering [53–56], the tapered acoustic surficial slope of the main channel is one of the key parameters to control the sound pressure along the Z direction. Therefore, we considered these parameters when constructing the parametric design model. Referring to the above literature and relevant values in engineering, we gave a range of values for the slope of the conical acoustic surface of the main channel in this study.
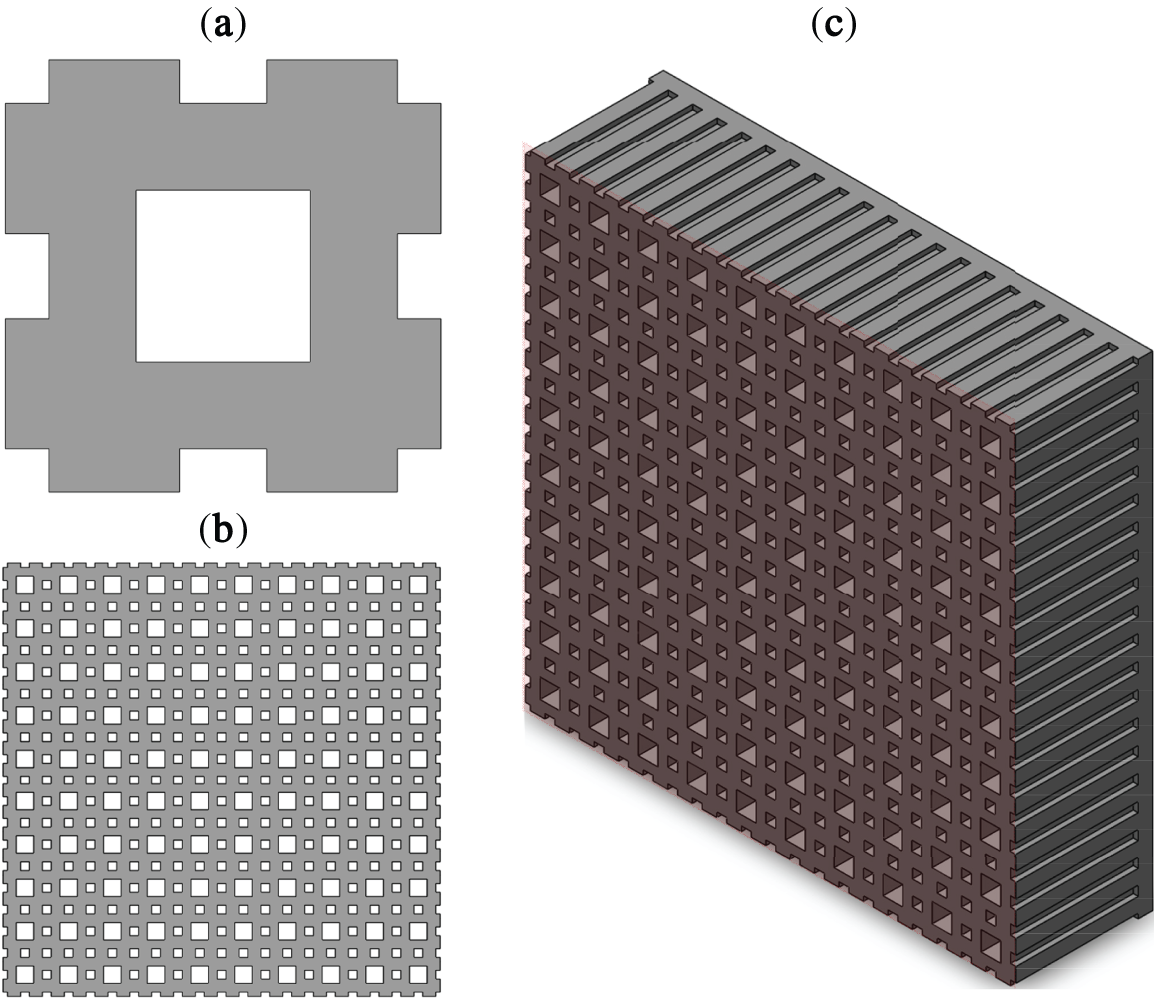
Figure 3: Parametric modelling process for 3D PMAM (a) remodelled 2D configuration (b) cross-sectional shape of PMAM (c) 3D porous PMAM
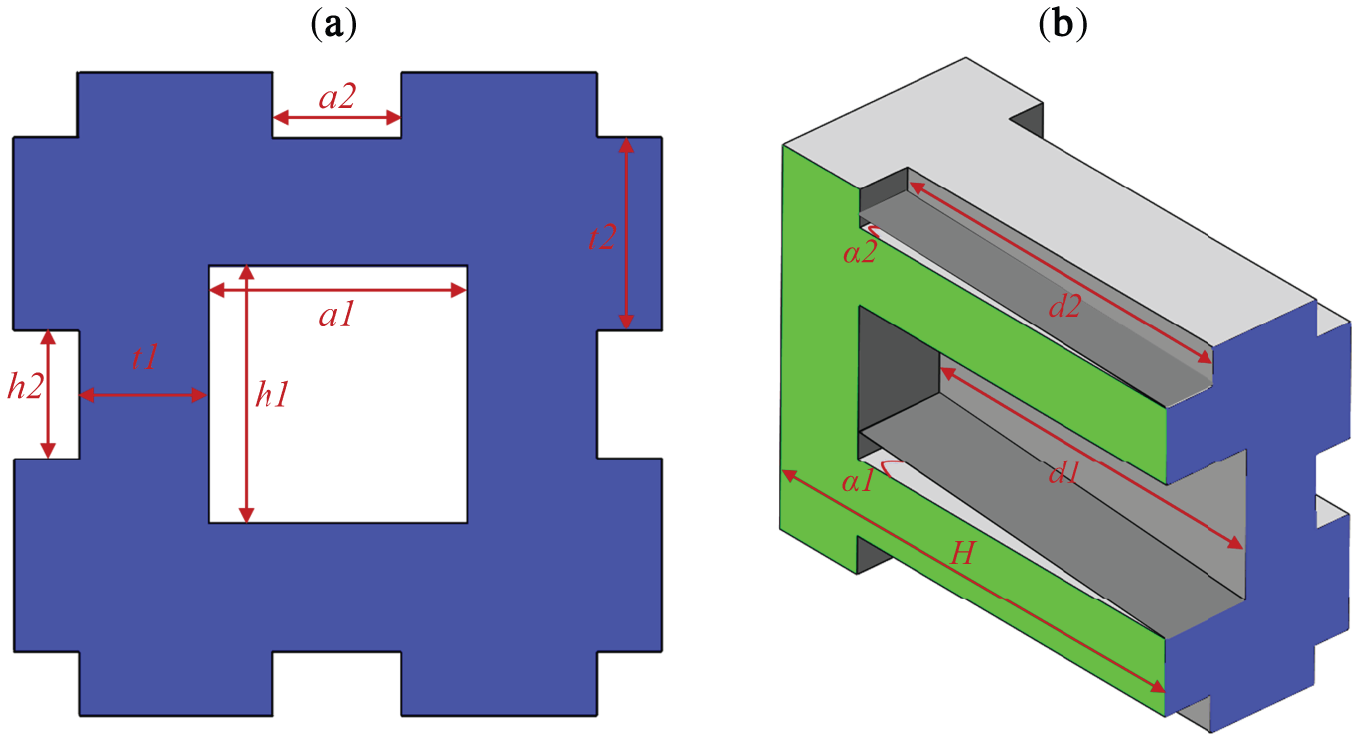
Figure 4: Parameters of PMAM (a) parametric definition of cross-sectional size (b) parametric definition in the third dimension
4.2 Detailed Optimization Based on SM
Parameter optimization is a key element for the proposed optimization design scheme. The accuracy and efficiency of the parameter optimization directly determine the effectiveness of the proposed scheme. In this study, the parameter optimization of acoustic metamaterials is realized based on the SM. The deformation of a solid structure in the ASI system is a complex elastoplastic process with strong geometric, physical, and boundary nonlinearity. Hence, it is extremely difficult to obtain the strains that are essential for the optimization. SM, based on statistical theory, can construct the explicit function relationship of the complex objective function in a multidimensional design space. The explicit function can significantly reduce the difficulty of structural strain calculation, and thus help to efficiently solve the concerned nonlinear optimization problem.
In the actual design process, if all the microstructures are subjected to finite element analysis, not only will a lot of time be wasted repeating on the setting of boundary conditions, but also each analysis may take several minutes. This will undoubtedly bring a large amount of computational cost. In contrast, by using the SM, the response of the positional points can be predicted by performing only the finite element analysis of the sample points. By training the SM model in advance, we can get the required structural performance results in a few seconds. Compared to repetitive finite element analyses, SM models provide an exponential increase in efficiency.
The core of SM is to use as few initial model solutions as possible to build an alternative model that is as accurate as possible. The essence of SM is to use the response value of sample points in the experimental design to predict the response value of unknown points in the design space. Therefore, we can construct an approximate relationship (i.e., the so-called SM) of input-output parameters with only a little precomputation. The accuracy and efficiency of the optimization can be guaranteed. Fig. 5 shows a typical flowchart of SM for the parametric design of PMAM.
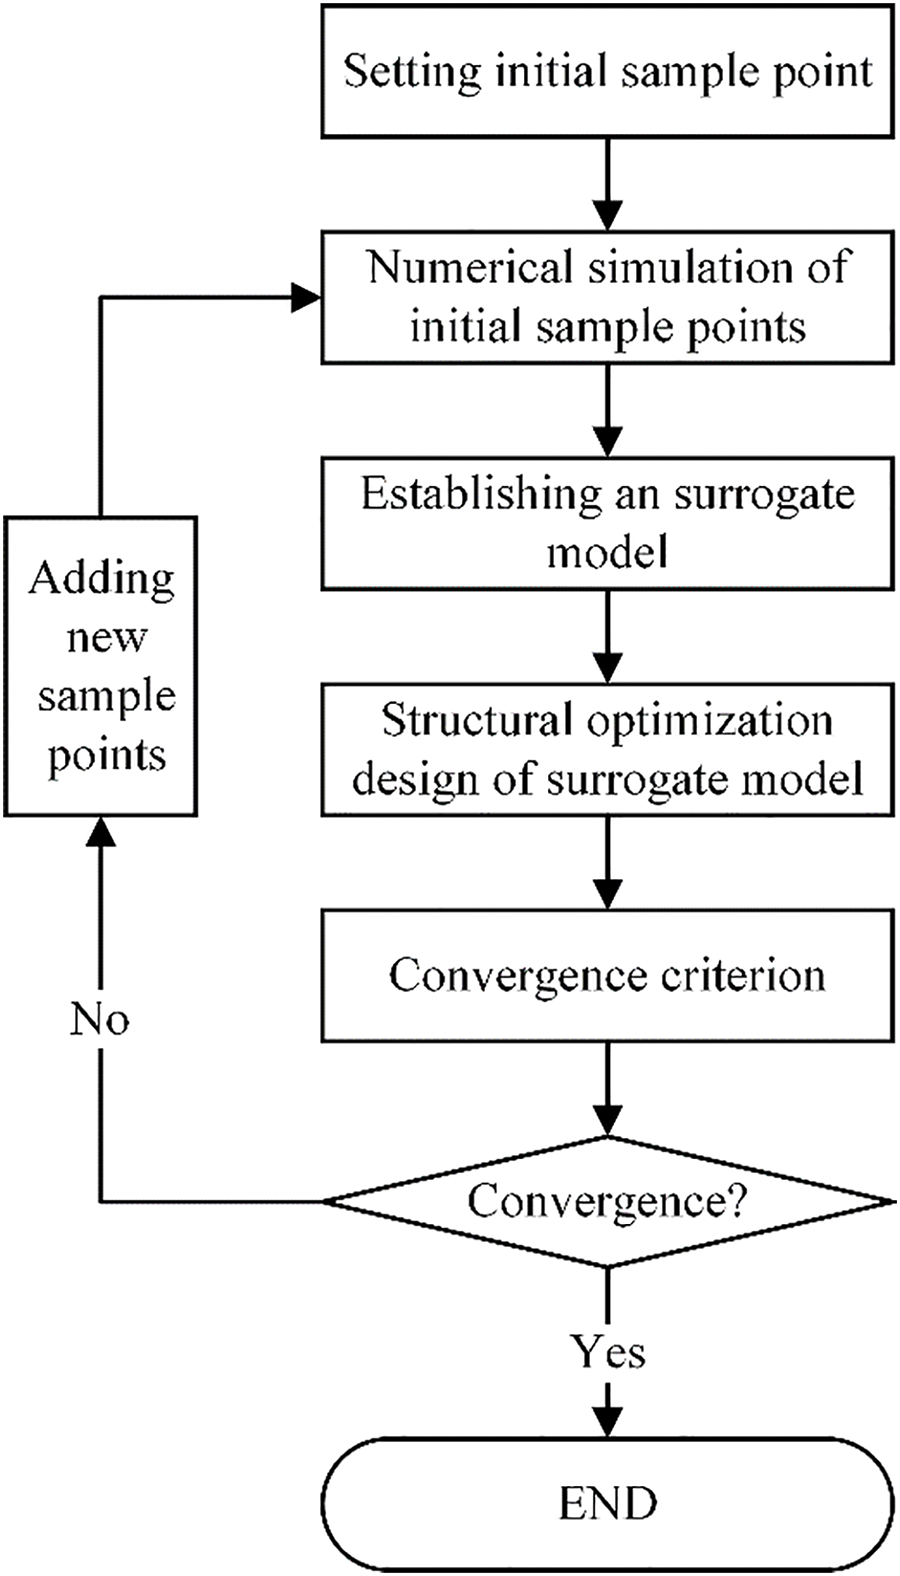
Figure 5: Flow chart of SM for PMAM
This study combines the adaptive weight method with the Kriging interpolation model, which can effectively avoid SM being stuck in a local optimum solution. In doing so, the global and local search capabilities of the optimization algorithm are also improved. Based on the Kriging model, the association equation between the design variables (X = [x1, x2, …, xm]T, xi ∈ Rn) and the response dependent variables (Y = [y1, y2, …, ym]T, yi ∈ Rq) in the system could be represented by the equation below:
among these, Z(X) follows an independent and identically distributed distribution and represents a systematic bias. It has the following statistical properties: Var[Z(X)] = σ2, E[Z(X)] = 0, cov[Z(xi), Z(xj)] = σ2R(c, xi, xj), where xi and xj are any two sample points. Meanwhile, g(X) = [g1(X), g2(X), …, gk(X)]T is the deterministic component. It could be represented by using k known regression functions. Here, σ2 denotes the process variance. R(c, xi, xj) denotes a spatial correlation function containing the parameter c, such as the Gaussian function R(X) = exp(−X2/c2), etc. Moreover, the parameter c is solved with the following equation:
where R is the relevance matrix. By linearly weighting and interpolating the response dependent variable yi based on the independent variable xi of the sample points, the response dependent variable of the measurement point X can be calculated as follows:
where w(X) = [w1, w2, …, wn] is the weighted coefficient of the solution. Based on conditions of minimum variance and unbiasedness, the final weights vector can be determined by integration using the Lagrange multiplier method:
where G = [gT(x1), gT(x2), …, gT(xn)]T is an expanded matrix with n rows and k columns. Among them, gT(xi) is obtained by transposing g(X). Inserting Eq. (25) into Eq. (24) yields the corresponding Kriging model, which is expressed as follows:
where β∗ = (GTR−1G)−1GTR−1Y is the corresponding estimated value of β obtained by the least squares method. Among them, r(X) = (R(c, x1, X), (R(c, x2, X), …, (R(c, xn, X))T. In addition, R = [Rij]n×n = [R(c, xi, xj)]n×n. Here, an adaptive weighting method based on a particle swarm optimization (PSO) algorithm is presented to automatically adjust the weight coefficients in Eq. (24). For more details of the standard PSO, the readers can refer to [57,58]. In the optimization of SM, the fitness value of the sample pi is set as the response value yi of the sample point xi. The optimal sample fitness value is the initial response value ym, and the average fitness value of the particle swarm is
Herein, the particles in the PSO are divided into three subgroups according to yi, ym, and yavg. Different adaptive procedures are performed in each subgroup. Theoretically, in the standard PSO algorithm, increasing the weight coefficient can improve the global search ability, whereas reducing the weight coefficient can improve the local search ability. The method for adjusting the inertial weight coefficient w is shown below. (1) If yi > y′avg, wi = wi − (wi − wmin)| (yi − y′avg)/(ym − y′avg)|. (2) If y′avg ≤ yi ≤ ym, wi remains unchanged. (3) If yi ≤ y′avg, wi = 1.5 − 1/(1 + k1·exp(−k2·Δ)). Herein, k1 and k2 are corresponding control parameters. Among them, k1 is responsible for the upper limit control of w, while k2 is responsible for the adjustment control of wi = 1.5 − 1/(1 + k1·exp(−k2·Δ)). When the algorithm finishes running, if the sample distribution results are scattered at this point, Δ increases and wi decreases. Then, the localized searching capability of this algorithm will be enhanced, and this group will show a convergence trend. If the sample distribution results of the cluster are obtained, Δ decreases and wi increases. In this fashion, the algorithm has a stronger detection capability for deviating from local optimal solutions.
In this study, the PMAM is optimized by using the SM to minimize the sound acoustic pressure. Combinations of different parameters of the PMAM are regarded as the initial sample points. At the same time, these sampling points are also input variables in the SM. Herein, P is the output variable associated with the sampled points, employed to assess the noise attenuation capability of the optimized configuration. Structures with 10 × 10 unit cells are adopted in the simulation process for the SM. These optimized configurations more accurately reflect practical implementation scenarios like stress states, which encompass forces between adjacent unit cells.
In order to get an optimal configuration of a PMAM, the input variable of SM is set to the structural sizes. The simulated SPL on surface B is the output variable Pout for the SM. In the final phase, both input and output variables are synchronously integrated to establish the SM that creates a deterministic linkage across the parameter space:
where Pi is the input variable of the SM, and its value range is Ψ.
The widely adopted Latin hypercube approach generates a maximally effective and representative sampling distribution space within the SM [59,60]. Consequently, the parametric coordinate allocation across the design matrix achieves maximal equidistribution to guarantee SM fidelity throughout the parameter domain [61,62]. Scholars have established consensus through systematic benchmarking of viable methodologies. Specifically, the initial SM input domain originates from 5-dimensional (5D) functional analysis, achieving convergence through sequential refinement to yield optimized solutions satisfying precision thresholds upon completion of 11-dimensional (11D) high-fidelity simulations [63–65]. In this study, D = 11. There are 55 points in the initial sample space, and the SM must calculate 66 points. In total, there are 121 points after the optimization. Here, all the sample points (e.g., PMAM with different combinations of parameters) are analyzed in the environment of software COMSOL Multiphysics.
4.3 Analysis of Optimization Results
The simulation analysis diagram of the acoustic wave intensity for the optimized PMAM is plotted in Fig. 6. Fig. 6a,b shows the x-y and y-z cross-sectional views of the obtained PMAM, respectively. Compared with the initial structure in Fig. 3c, it is noted that the typical structure size of the optimized PMAM has changed. It is obvious that the acoustic wave intensity on surface B is significantly reduced when compared to that of surface A. The optimized parameters of the PMAM are shown in Table 3. To examine parameter evolution across structural variables at identical scales, all parameters undergo standardization during optimization. The main design variables’ progression within the SM-assisted optimization framework is depicted in Fig. 7.
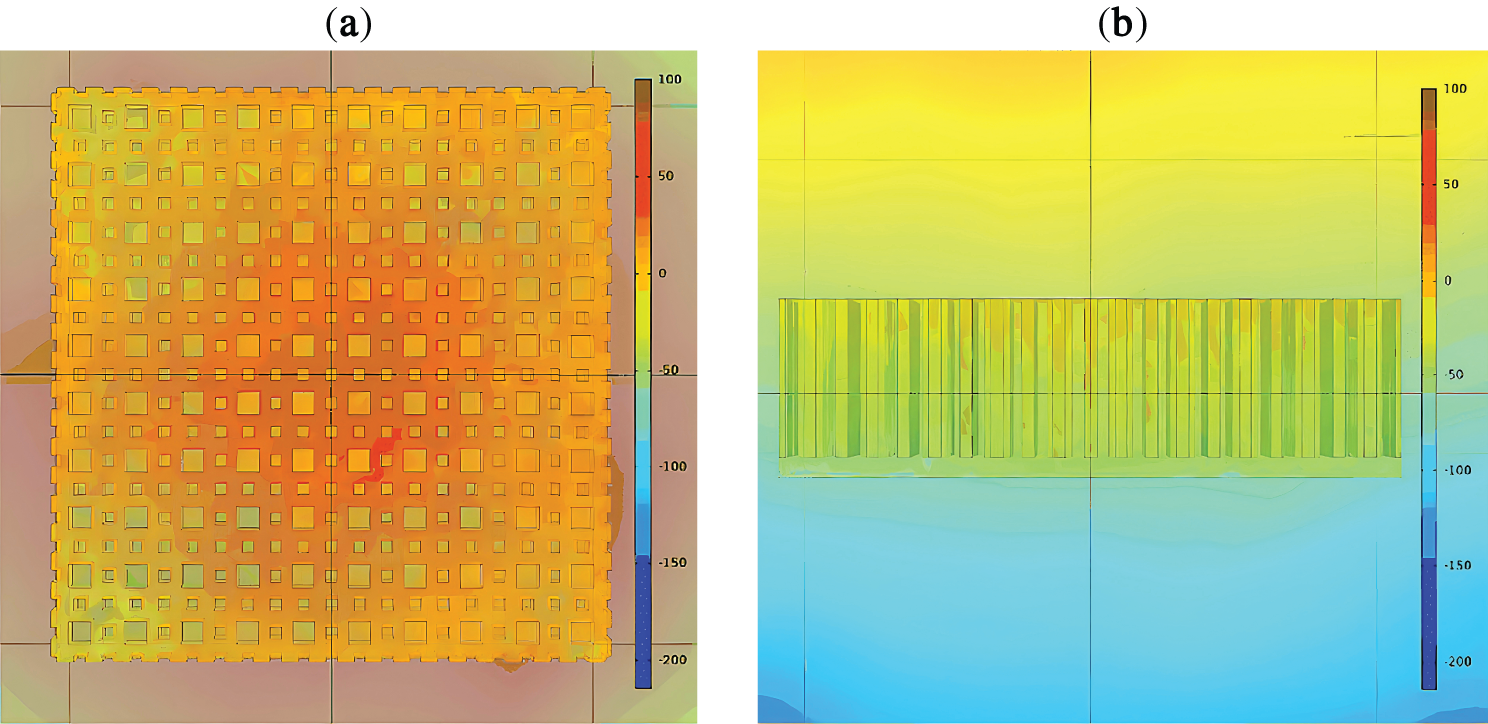
Figure 6: Simulation analysis of acoustic wave intensity for optimized PMAM (a) x-y cross-sectional views (b) y-z cross-sectional views
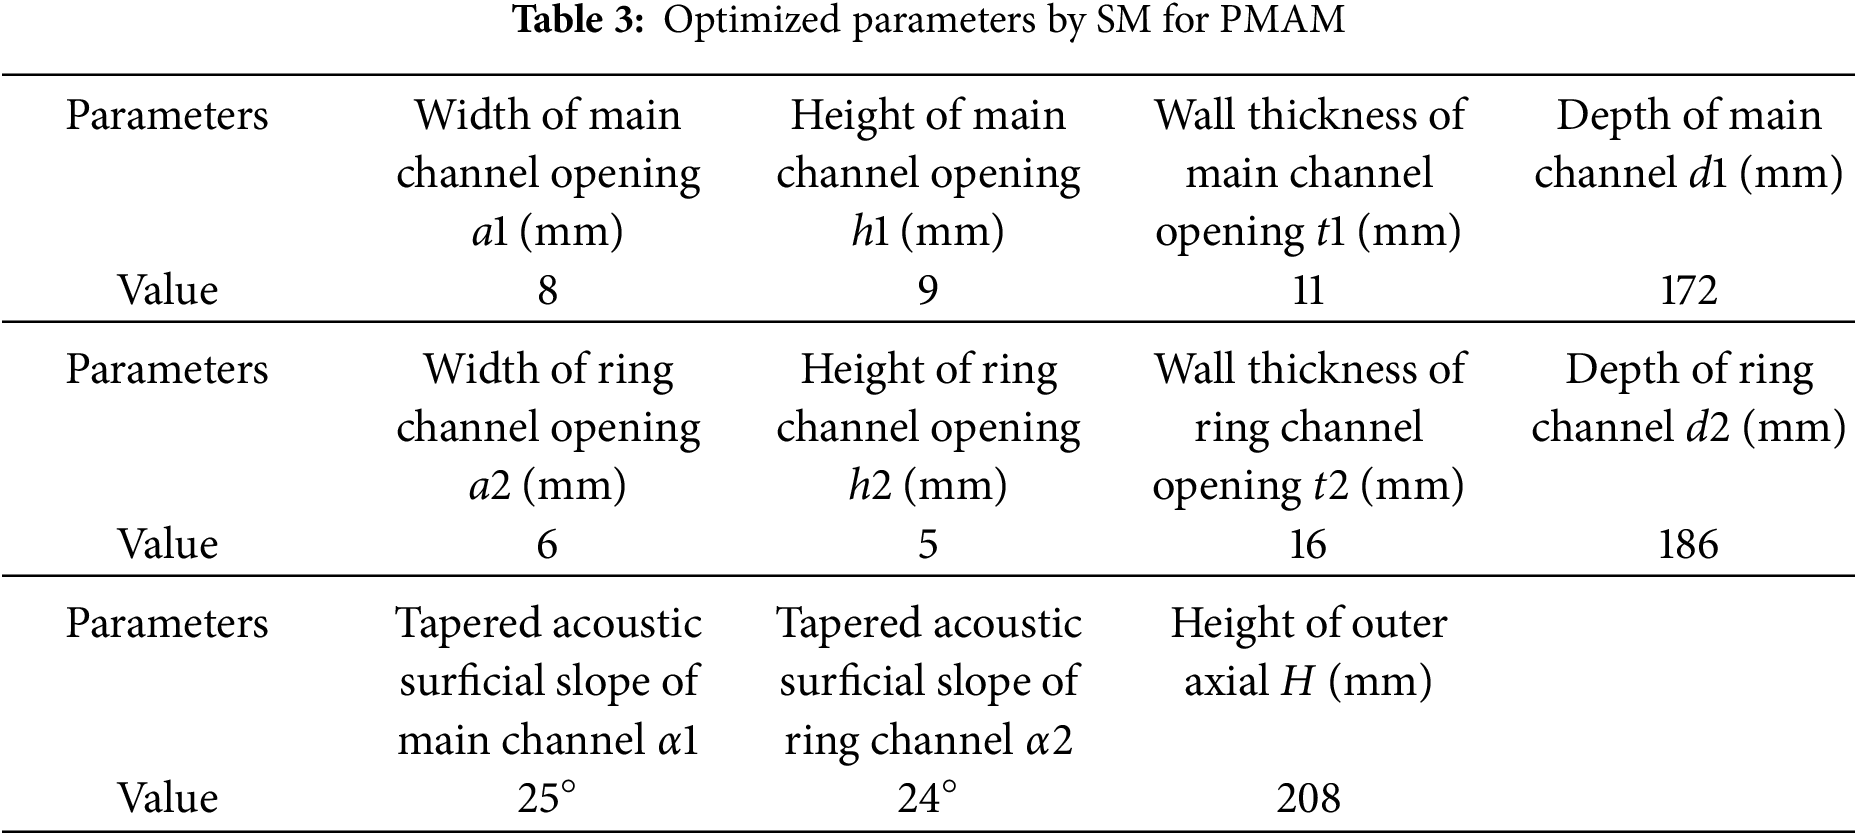
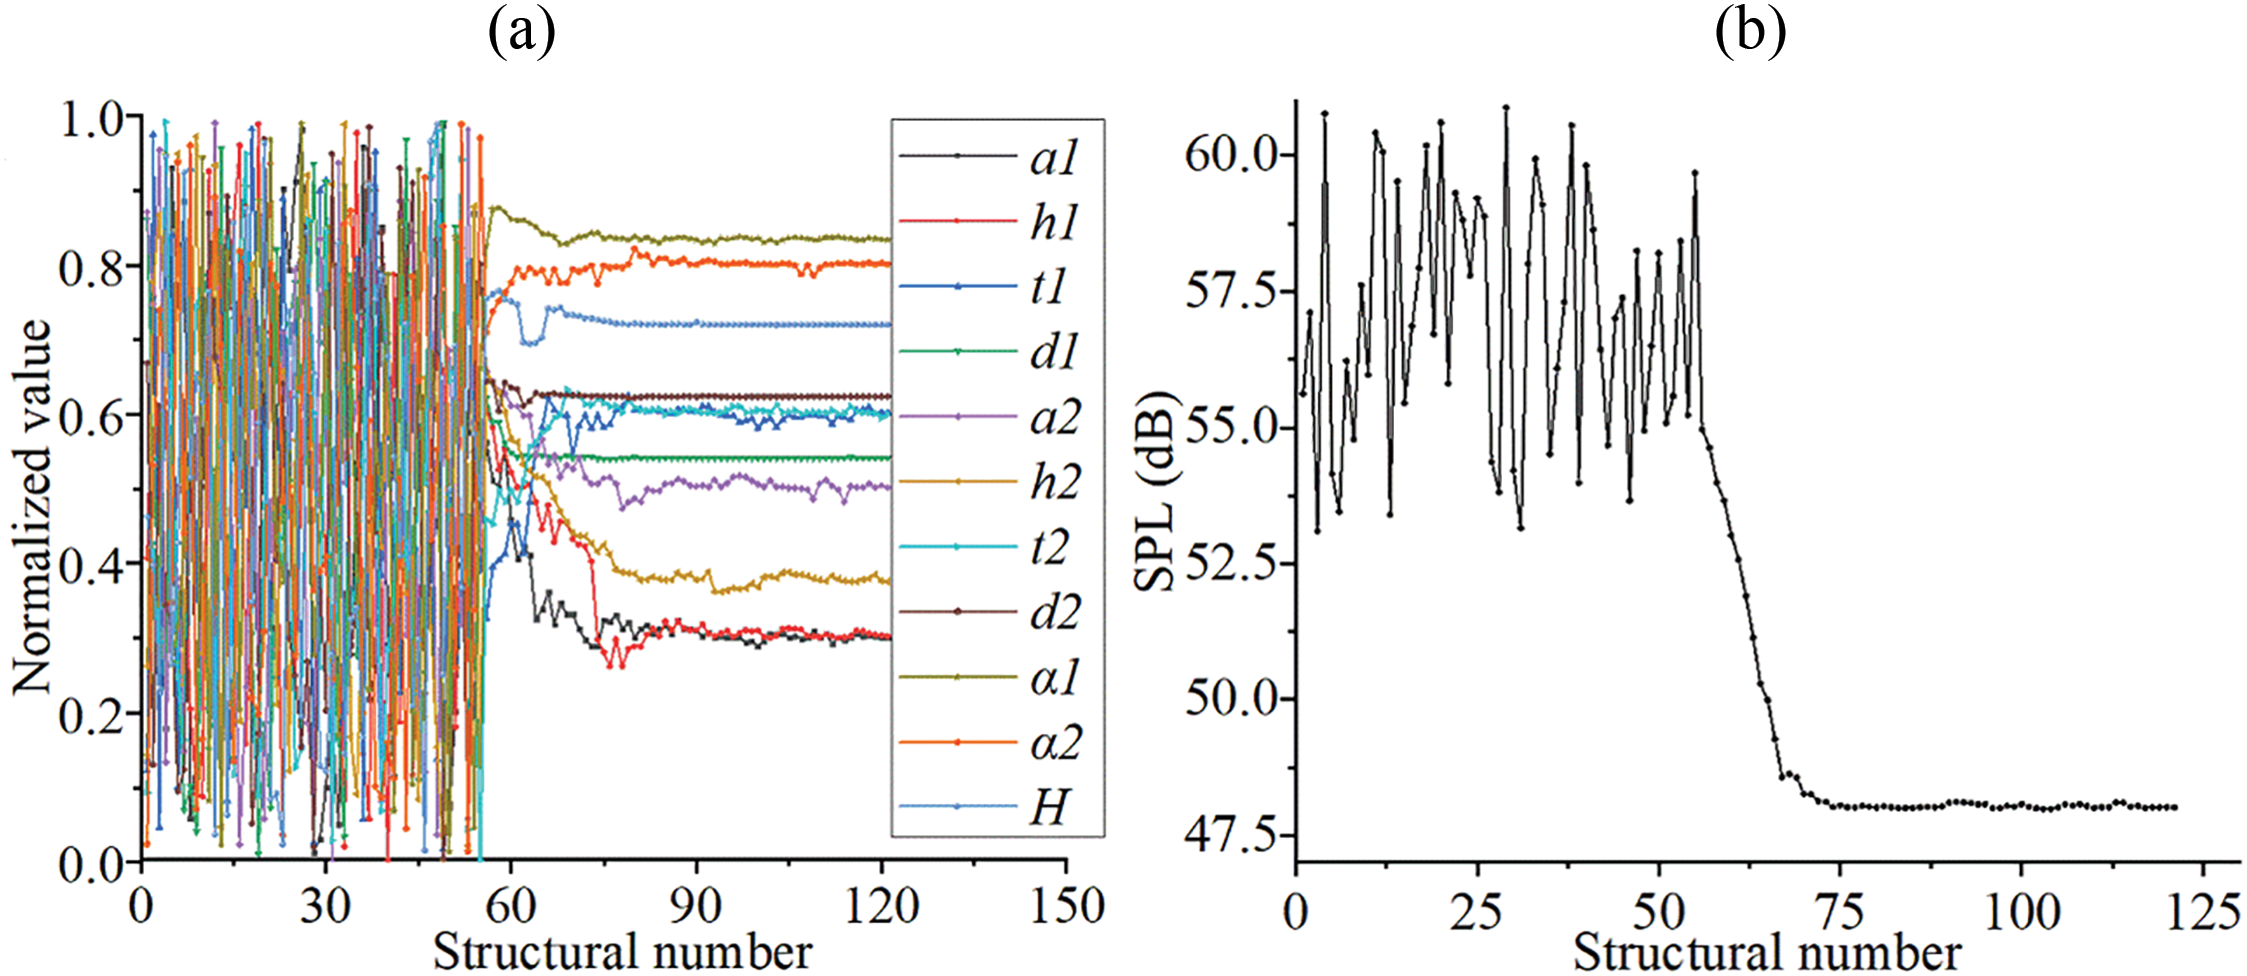
Figure 7: The main design variables’ progression within the SM-assisted optimization framework (a) input parameters (b) output parameters. Structural number denotes the sample number in the SM
As shown in Fig. 7a, d1, d2, and H exhibit fast convergence speed and small steady-state fluctuations. This phenomenon illustrates that d1, d2, and H are not sensitive to the change of output (SPL). The other parameters fluctuated significantly during the convergence process. These parameters are more sensitive to the change in SPL. As shown in Fig. 7b, the SPL approached a constant value of 48 dB after the PMAM was optimized by the SM-based method. Note that the SPL of the initial structure is 60.83 dB, and the SPL in the initial sample space is within [53, 61 dB]. It is seen that the SPL of devised PMAM is significantly reduced. Therefore, parameter optimization based on the SM is effective for the detailed design of PMAM.
During the parameter optimization of SPL for the PMAM, PMAM structures with different parameter combinations are obtained. As previously discussed, there are 121 sample points to be considered in the parameter optimization, which means that the total optimization step as well as the parameter set of PMAM structures during the optimization are all equal to 121. To further verify the effectiveness of the optimized structures in terms of sound insulation and noise reduction, we select typical structures during the parameter optimization to implement simulation analysis.
In a PMAM, surface A is an acoustically consuming surface that consumes the energy of an acoustic wave through the friction, reflection, and refraction of the PMAM. Surface B is an acoustic impacting surface, and the acoustic wave transmittance or reflectance on this surface directly reflects the primary noise consumption capacity. Therefore, the reduction ratio of the acoustic wave for different structures at different locations during the optimization process is analyzed, as shown in Fig. 8a. The reduction ratio of acoustic waves is a critical indicator that measures the absorption of acoustic waves for a PMAM. It represents the quotient between sound pressure amplitudes at a given boundary and the reference interface (i.e., surface A). The range of the reduction ratio is [0, 1], and the initial ratio is set to 1. Note that the location in Fig. 8a denotes the distance from the current surface to surface A. In addition, the SPL change at different locations (starting from surface A) of the optimized structure under different excitation frequencies is analyzed, as shown in Fig. 8b. The typical excitation frequencies of acoustic sources are set to 500, 1500, and 2500 Hz, which represent the noise in low-, medium-, and high-frequency bands, respectively.
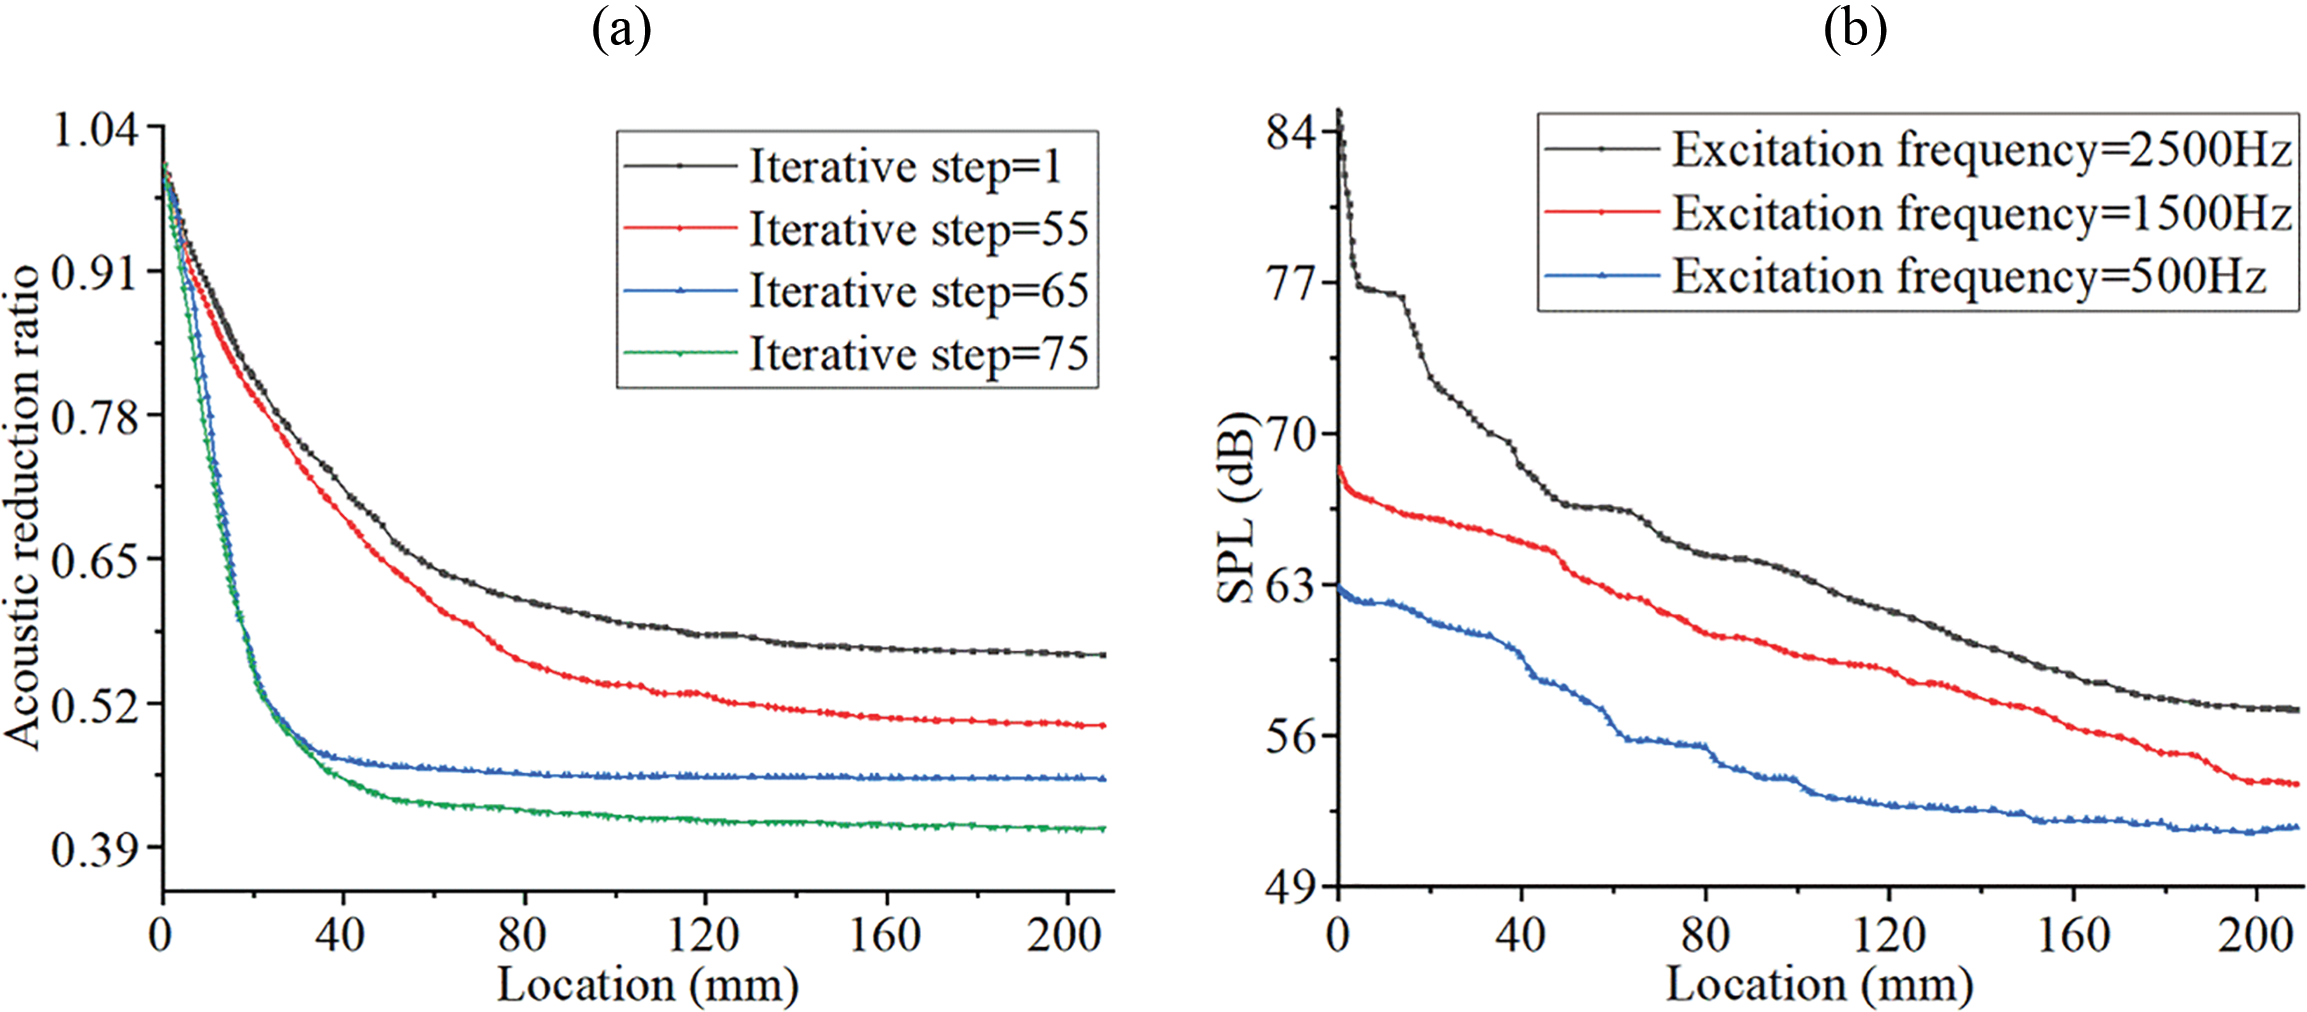
Figure 8: Characteristics of acoustic wave at different locations of the PMAM (a) acoustic wave attenuation curve (b) SPL attenuation curve
As shown in Fig. 8a, noise reduction ratios of various PMAM structures are very large at the locations near the start surface. It again confirms that d1, d2, and H in Fig. 7a are insensitive to the SPL. Moreover, by comparing the acoustic wave reduction curves corresponding to various structures during the optimization, it can be observed that parameter optimization based on SM can effectively improve the noise consumption capacity of the PMAM. As shown in Fig. 8b, the excitation frequency of the acoustic source has a significant influence on the SPL of the PMAM. A higher excitation frequency will always cause a higher SPL at different locations in the PMAM and lead to a slower SPL reduction rate. It implies that the devised PMAM by SM-based parameter optimization can have the potential to absorb the acoustic wave with a lower frequency, which is important and challenging in real-world applications.
The change of maximum amplitude under different excitation frequencies of acoustic waves is also studied. As shown in Fig. 9a, the maximum amplitude on the surface B of optimized PMAM is smaller than that of the initial structure. It indicates that the acoustic wave attenuation ability of the optimized structure is enhanced. Furthermore, attenuation magnitude in the optimized configuration exhibits significantly reduced levels relative to the baseline design under increasing excitation frequency. The widening inter-amplitude divergence demonstrates superior vibration acoustic attenuation characteristics in the optimized configuration relative to its baseline counterpart. Fig. 9b shows the influence of excitation acoustic waves on the hole and solid areas of the devised PMAM. The overall SPL of the hole area is smaller than that of the solid area, which indicates that the porous structure helps improve the noise reduction performance of the PMAM. An explanation of the principle of the formula similar to our experimental results can be found in reference [66].
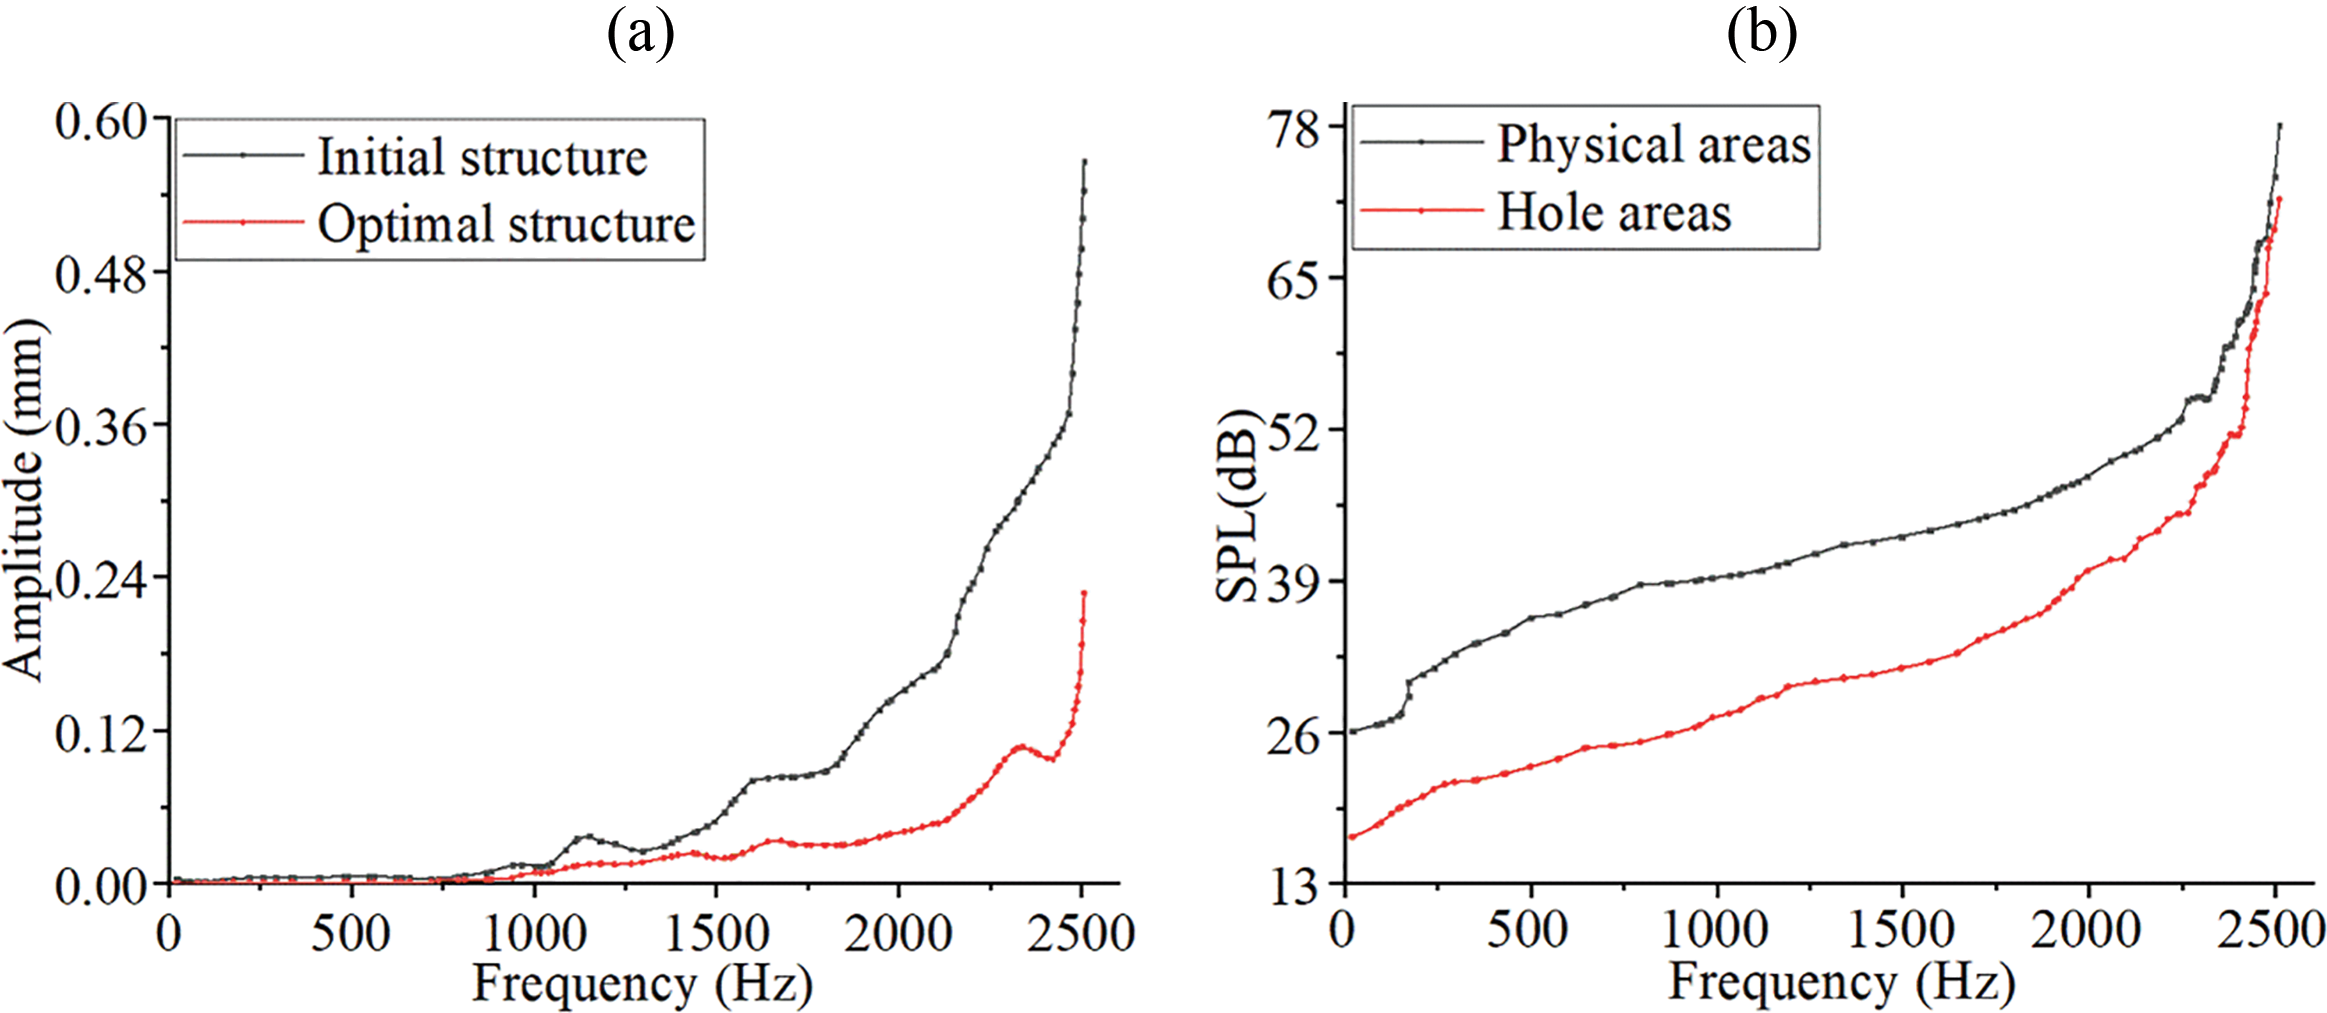
Figure 9: Influence of excitation frequency on acoustic characteristics of the PMAM (a) Amplitude changes under different excitation frequencies (b) SPL changes under different excitation frequencies
5 Experimental Verifications of PMAM
5.1 Additive Manufacturing and Experimental Setup
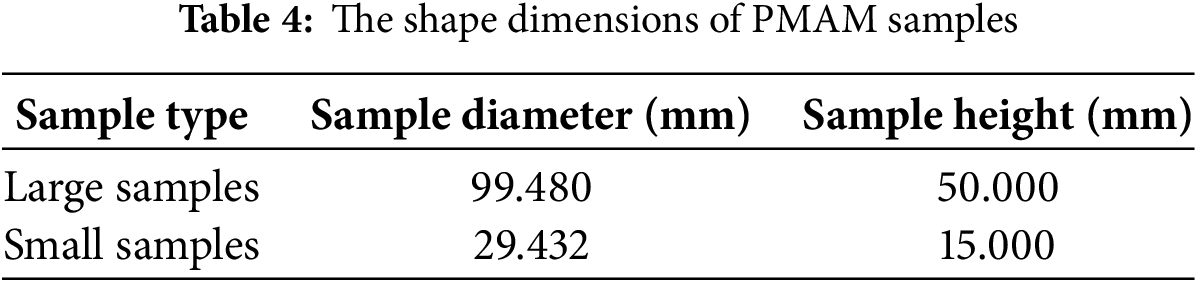
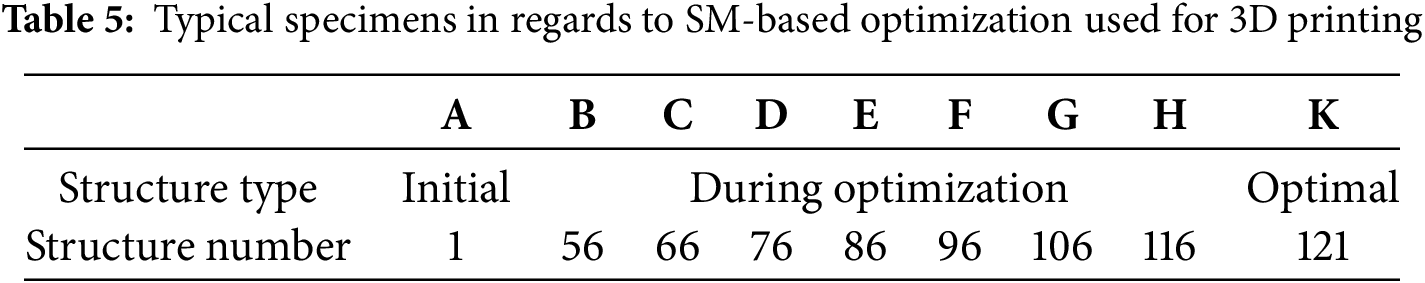
Due to extreme miniaturization and convoluted internal features in the PMAM design, traditional production techniques cannot achieve required tolerances. Therefore, additive manufacturing is employed in this study [67]. This makes it possible to manufacture complex structures that are previously restricted by traditional manufacturing methods. High-molecular-weight polymers have excellent viscoelasticity and damping characteristics, which are beneficial for integrating their damping properties with other acoustic absorption mechanisms to improve the acoustic absorption properties of a structure. Therefore, the polymer is used as the base material for 3D printing in this work, with a Poisson’s ratio of 0.394 and an elastic modulus of 2.2 GPa. According to the structural unit cell obtained by the above parameter optimization, the particular-shaped PMAMs with repeated unit cells are fabricated by additive manufacturing. Fig. 10a shows the preprocessing models in two sizes, and Fig. 10b presents the printed samples. Particularly, the round silhouette of the PMAM samples is determined by the impedance tube experiment. Table 4 lists the specific shape dimensions of two different sizes of PMAM samples. Table 5 presents a list of typical samples used for 3D printing.
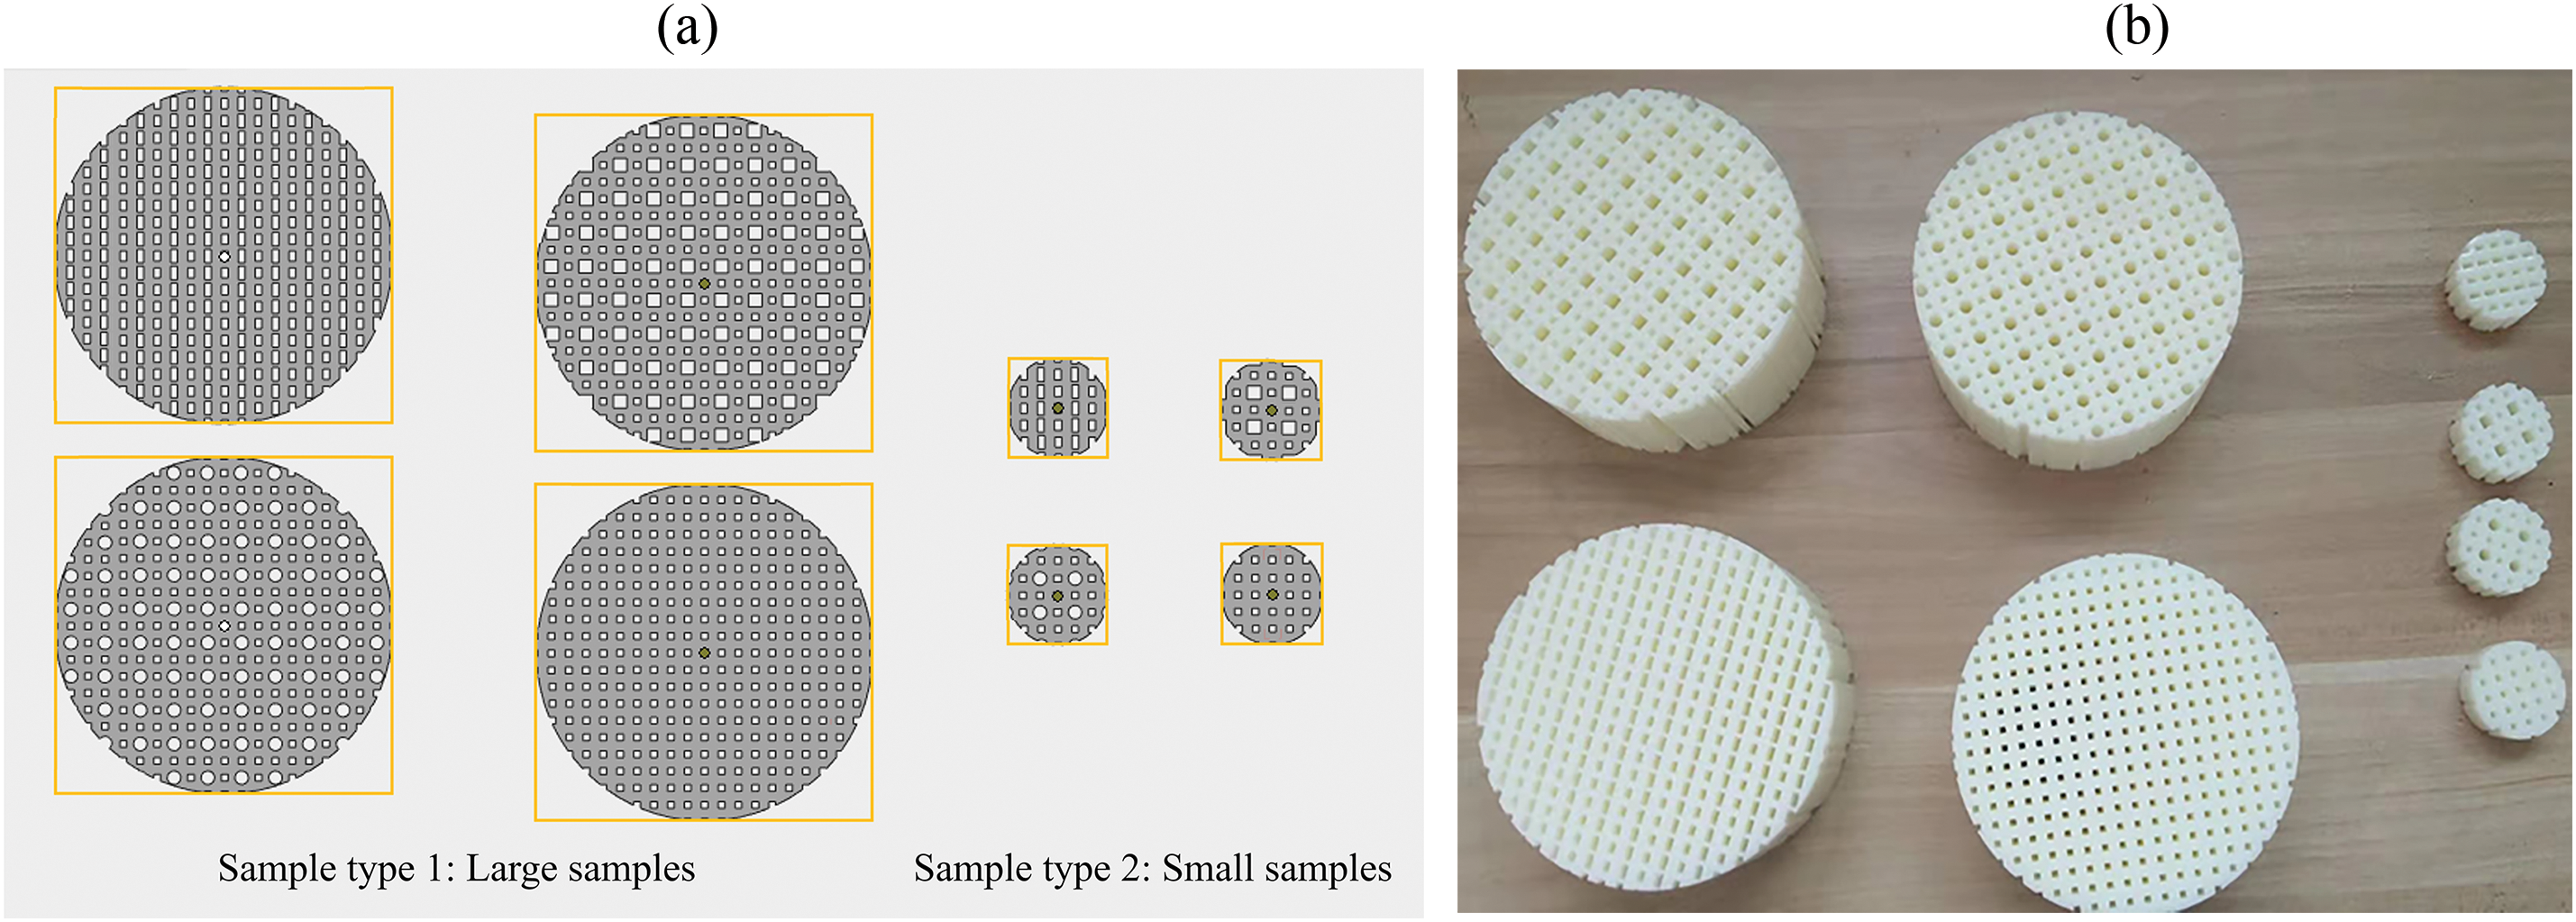
Figure 10: Additive manufacturing process for PMAM samples (a) pre-processing models (b) printed structures
Herein, printed PMAM samples are used for experimental verification to analyze their acoustic characteristics of noise reduction. The sound absorption coefficient is an important index for evaluating the noise reduction performance of the PMAMs. In this paper, the impedance tube test is implemented, which only requires a small sample without utilizing a standard reverberation room. These advantages make the impedance tube suitable for the acoustic test of the devised PMAM. The test system of the impedance tube consists of free-field speakers, impedance tubes, acoustic acquisition cards, signal processing equipment, and signal generators. Fig. 11 shows a schematic of the acoustic impedance tube, wherein ①–⑥ are the acoustic source, acoustic source tube, PMAM sample, sample tube, acoustic collection tube, and microphone, respectively.
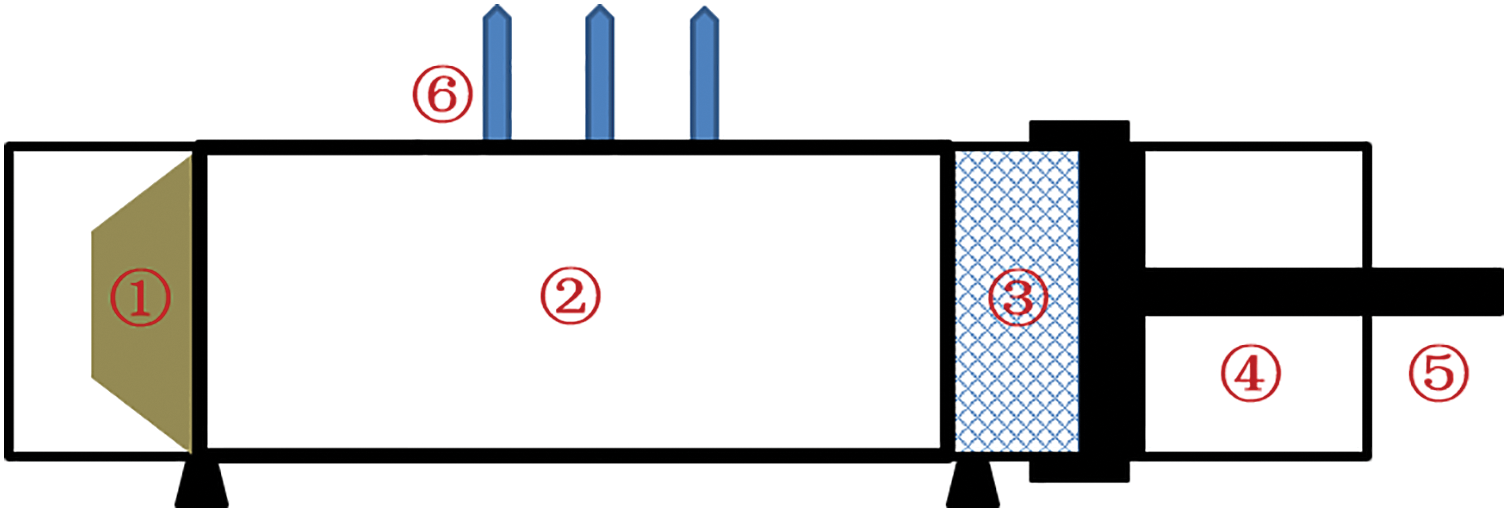
Figure 11: Structure of the impedance tube
The structure of the impedance tube is shown in Fig. 11. Tests with different frequency ranges refer to different tube diameters. The diameter of the large tube is 100 mm, and the test frequency range is [63, 1600 Hz]. The lengths of the large-impedance tube and specimen tube are 520 and 100 mm, respectively. In addition, the diameter of the small tube is 30 mm. The test frequency range is [1600, 6300 Hz]. The lengths of the small-impedance tube and sample tube are 380 and 45 mm, respectively. Therefore, to ensure that the PMAM sample meets the size requirement of the impedance tube, it is necessary to select an appropriate impedance tube according to the test requirements before conducting test experiments.
Two points must be considered when installing the PMAM samples on the impedance tube. Firstly, the PMAM sample should not be excessively compressed when it is installed on the test piece cylinder, and the surface of the sample should be flat to coincide with the reference surface. Secondly, the inner surface of the sample should be leaned on the bottom plate behind the impedance tube to avoid generating an air layer. In this study, the diameters of impedance pipes are 30 and 100 mm, respectively. The test frequency range is [50, 2500 Hz], which means the acoustic wavelength range is approximately [136, 6800 mm]. The unit cells in each printed sample or topology optimization model have a uniform length of 10 mm (i.e., X or Y direction), much smaller than the acoustic wavelength. Acoustic frequencies are discriminated and collected by an experimental device through frequency bands rather than a single frequency. Therefore, the frequency band division method (i.e., the 1/3 octave) for acoustic wave analysis is used in this study.
Through acoustic experiments, the acoustic characteristics of PMAM are analyzed, such as the sound absorption coefficient measured by an impedance tube. Subsequently, the acoustic characteristic change curve of the PMAM is obtained. Finally, the corresponding acoustic absorption coefficient of the 1/3 octave frequency is calculated. Fig. 12 shows the test sites of impedance tubes, including the acoustic absorption test equipment, acoustic insulation test equipment, low-frequency impedance tube, and high-frequency impedance tube.
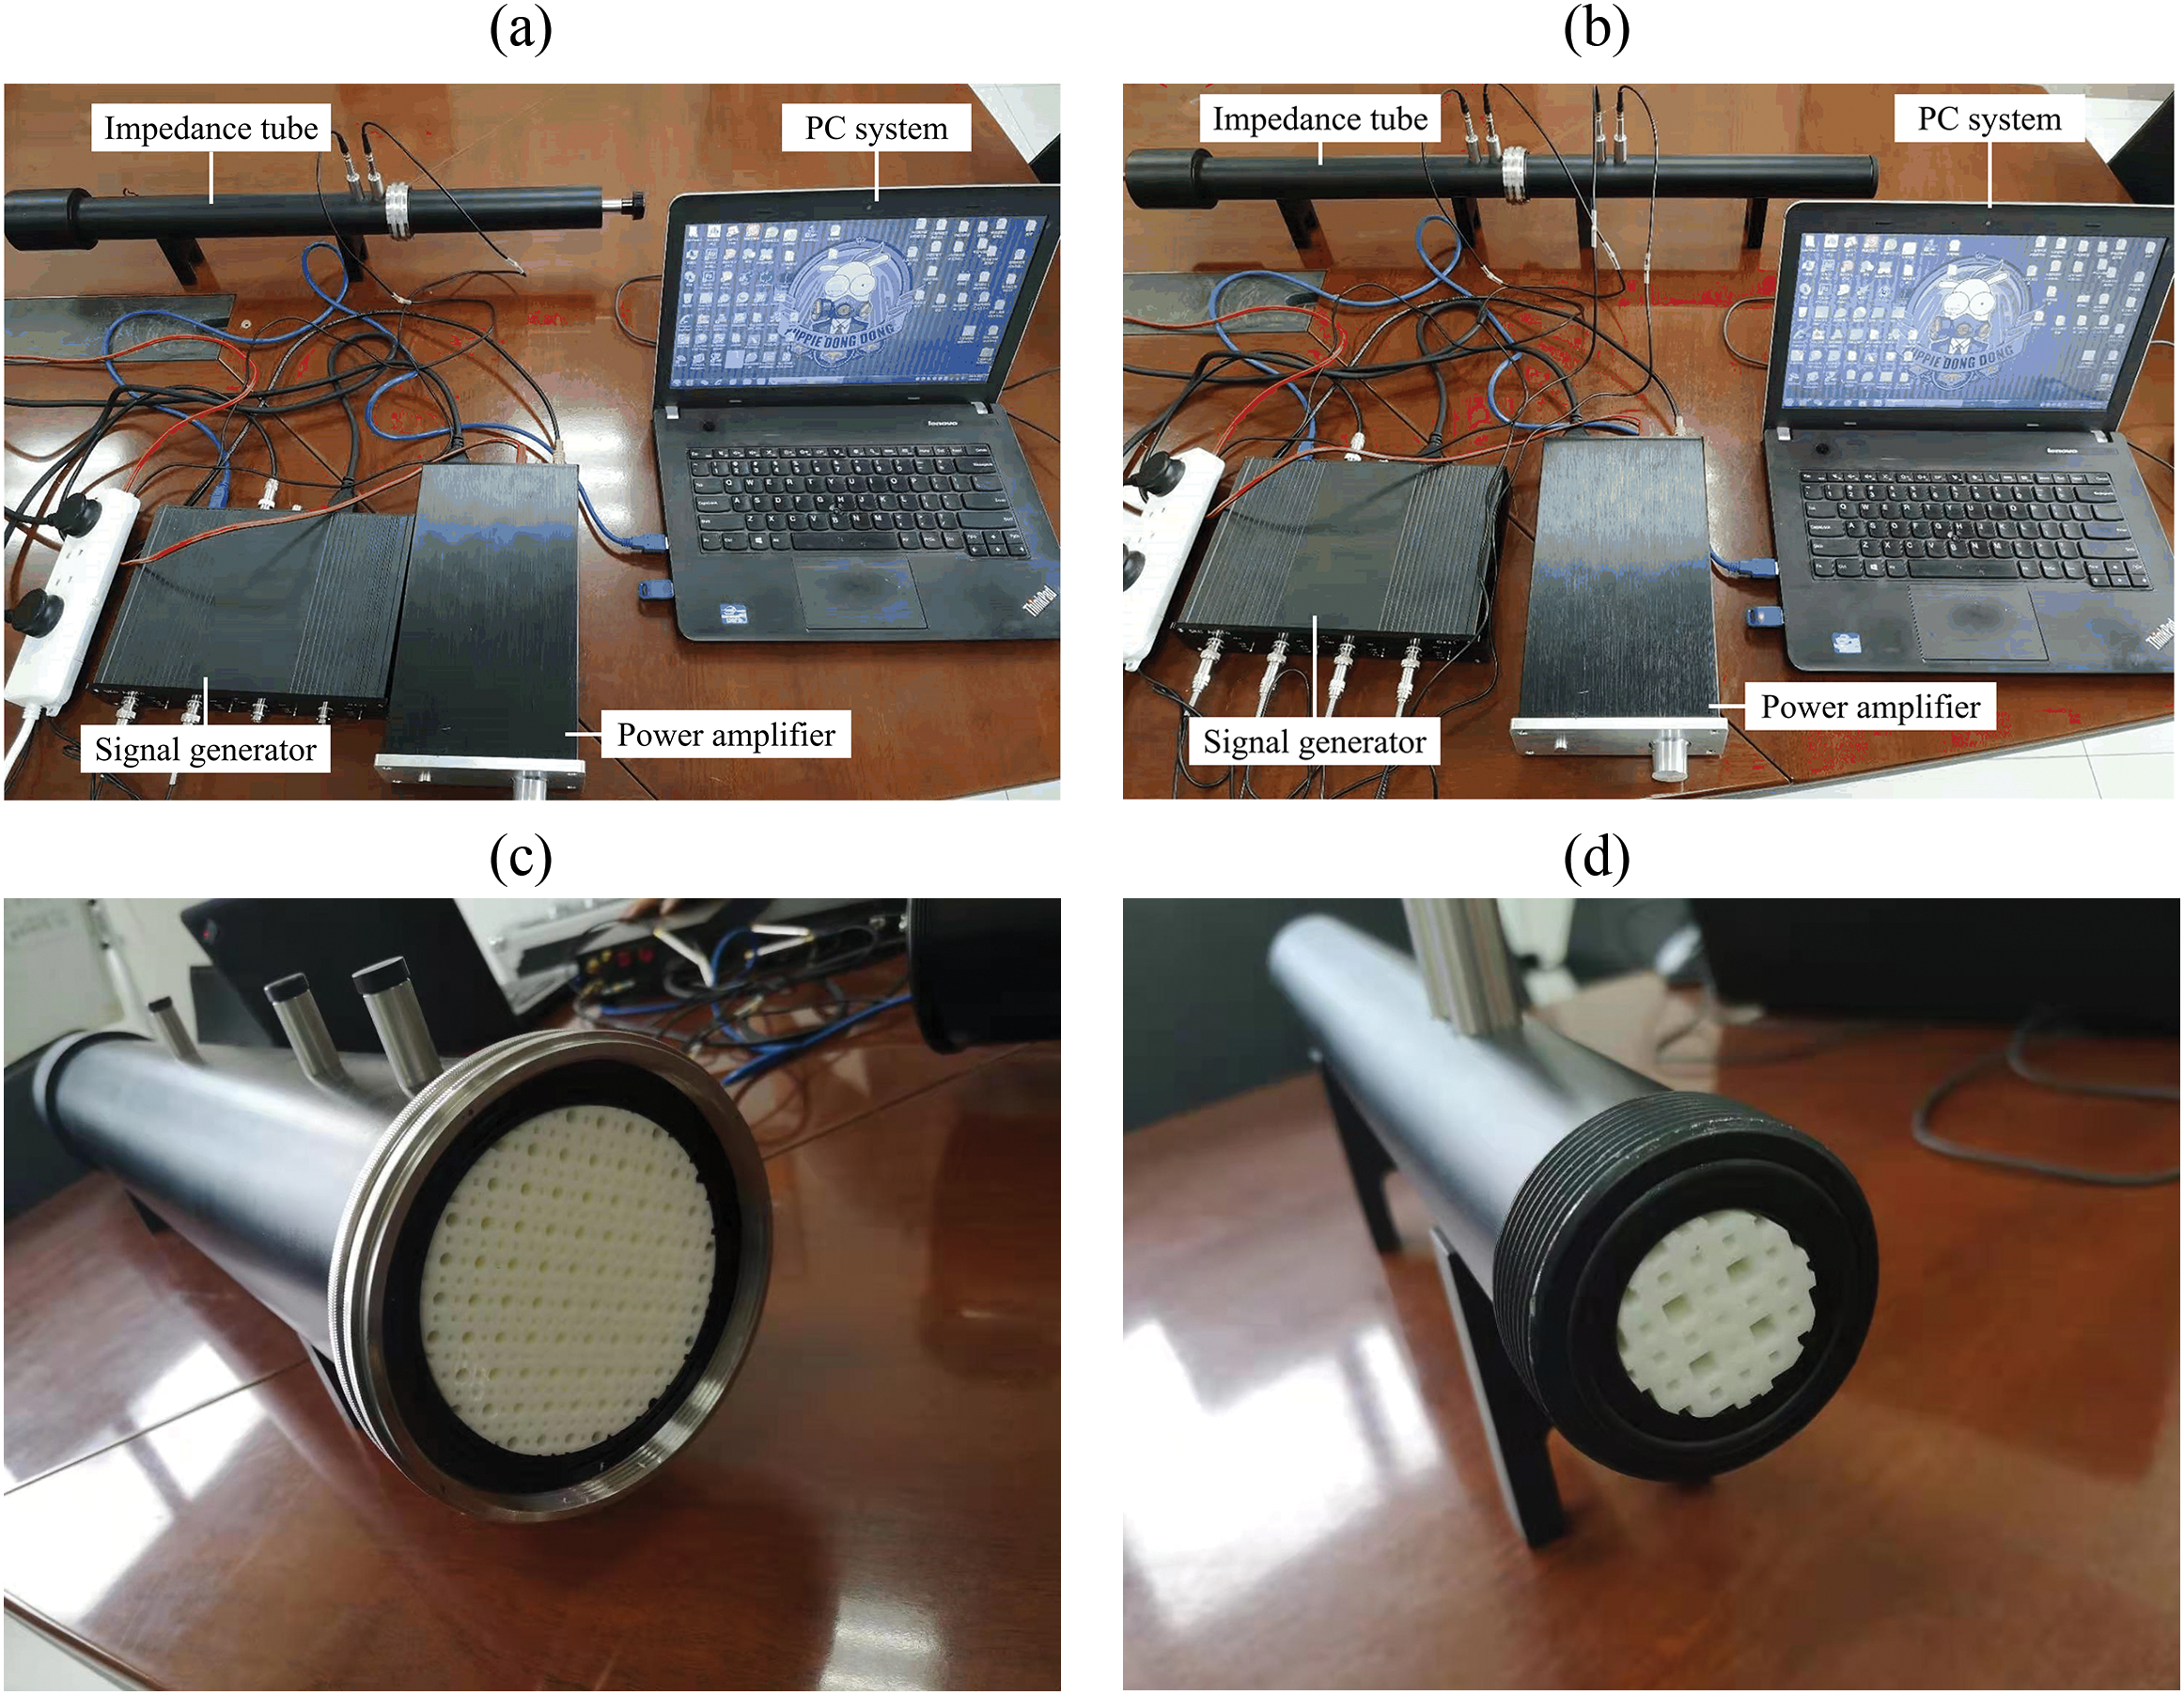
Figure 12: Test site of PMAMs based on impedance tubes (a) acoustic absorption test equipment (b) acoustic insulation test equipment (c) low-frequency impedance tube with a sample (d) high-frequency impedance tube with a sample
There are two types of acoustic parameters tested with the impedance tube, including the acoustic absorption coefficient and acoustic insulation coefficient. The acoustic absorption coefficient represents the noise absorption capacity of a structure. The acoustic absorption coefficient equals the proportion of dissipated acoustic energy (including transmitted acoustic energy) assimilated within the PMAM relative to the total incident acoustic energy impinging upon the PMAM surface. Thus, the value of the acoustic absorption coefficient ranges from 0 and 1. The larger the acoustic absorption coefficient is, the better the acoustic absorption performance of the PMAM will be. The acoustic insulation coefficient is also referred to as the acoustic transmission loss. Its value is equal to the incident SPL minus the transmitted SPL. Both the acoustic absorption and insulation coefficients are closely related to the frequency of acoustic waves. Fig. 13 shows the acoustic curves of typical PMAM structures (including No. 1, No. 56, and No. 121) generated during the parameter optimization. Fig. 13a shows the curve of the acoustic absorption coefficient, and Fig. 13b plots the curve of the acoustic insulation coefficient.
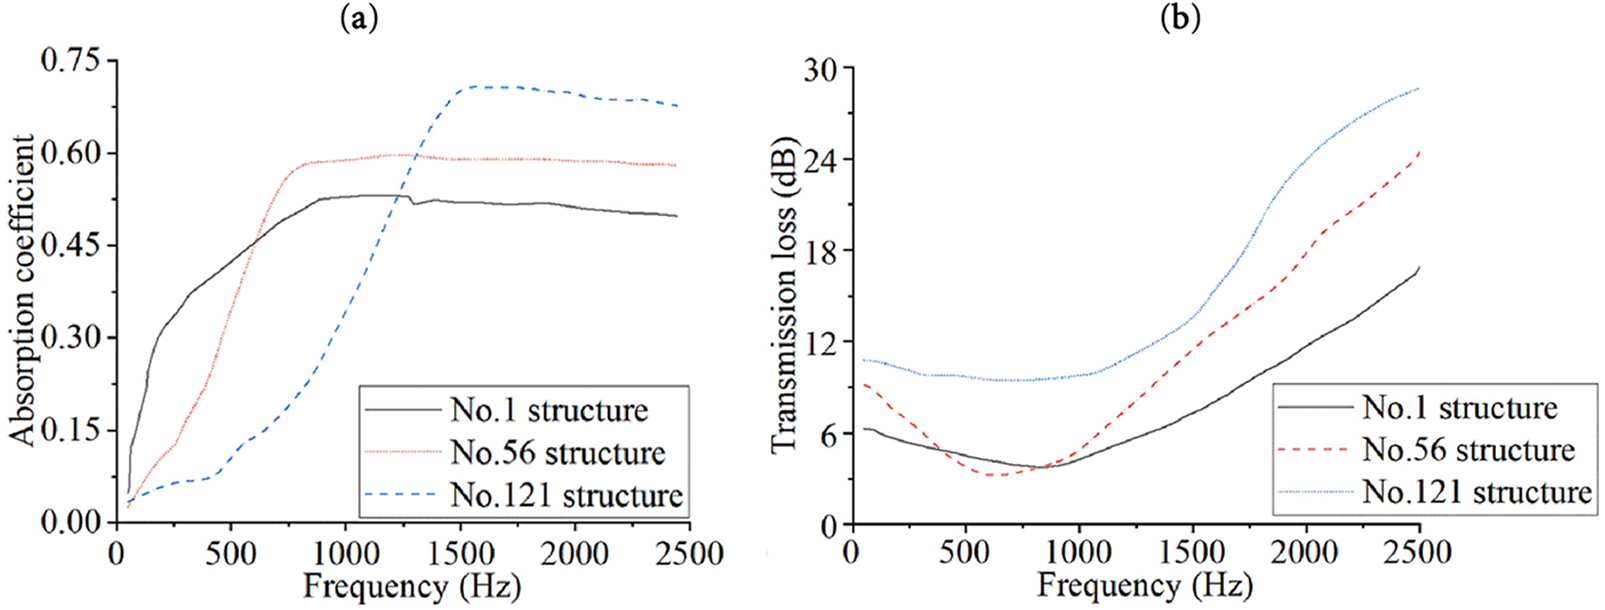
Figure 13: Acoustic curves of devised PMAMs (a) curve of acoustic absorption coefficient (b) curve of acoustic insulation coefficient
The acoustic absorption coefficient shown in Fig. 13a continues to increase with an increase in the excitation frequency. Then, it is stabilized after reaching a peak. Comparing the curves of PMAM No. 1, No. 56, and No. 121 (No. 121 is the final optimized design), it shows that the parameter optimization design improves the acoustic absorption capability of PMAM especially in the moderate and high frequency ranges. Fig. 13b shows that as the excitation frequency of acoustic waves increases, the acoustic transmission loss of the PMAM first decreases and then increases. In particular, the increase rate is larger than the decrease rate. Moreover, the acoustic transmission loss is lower at low frequencies and higher at high frequencies.
Fig. 14 shows the comparison of experimental and simulated acoustic transmission losses in regards to the optimized PMAM at five typical excitation frequencies, e.g., 500, 1000, 1500, 2000, and 2500 Hz. As indicated in Fig. 14, the numerical error between the simulation results and the experimental results is less than 10% at each excitation frequency, which is within the acceptable range [68]. The experimental results of the additively manufactured sample validate the feasibility of the suggested method and devised PMAM [69].
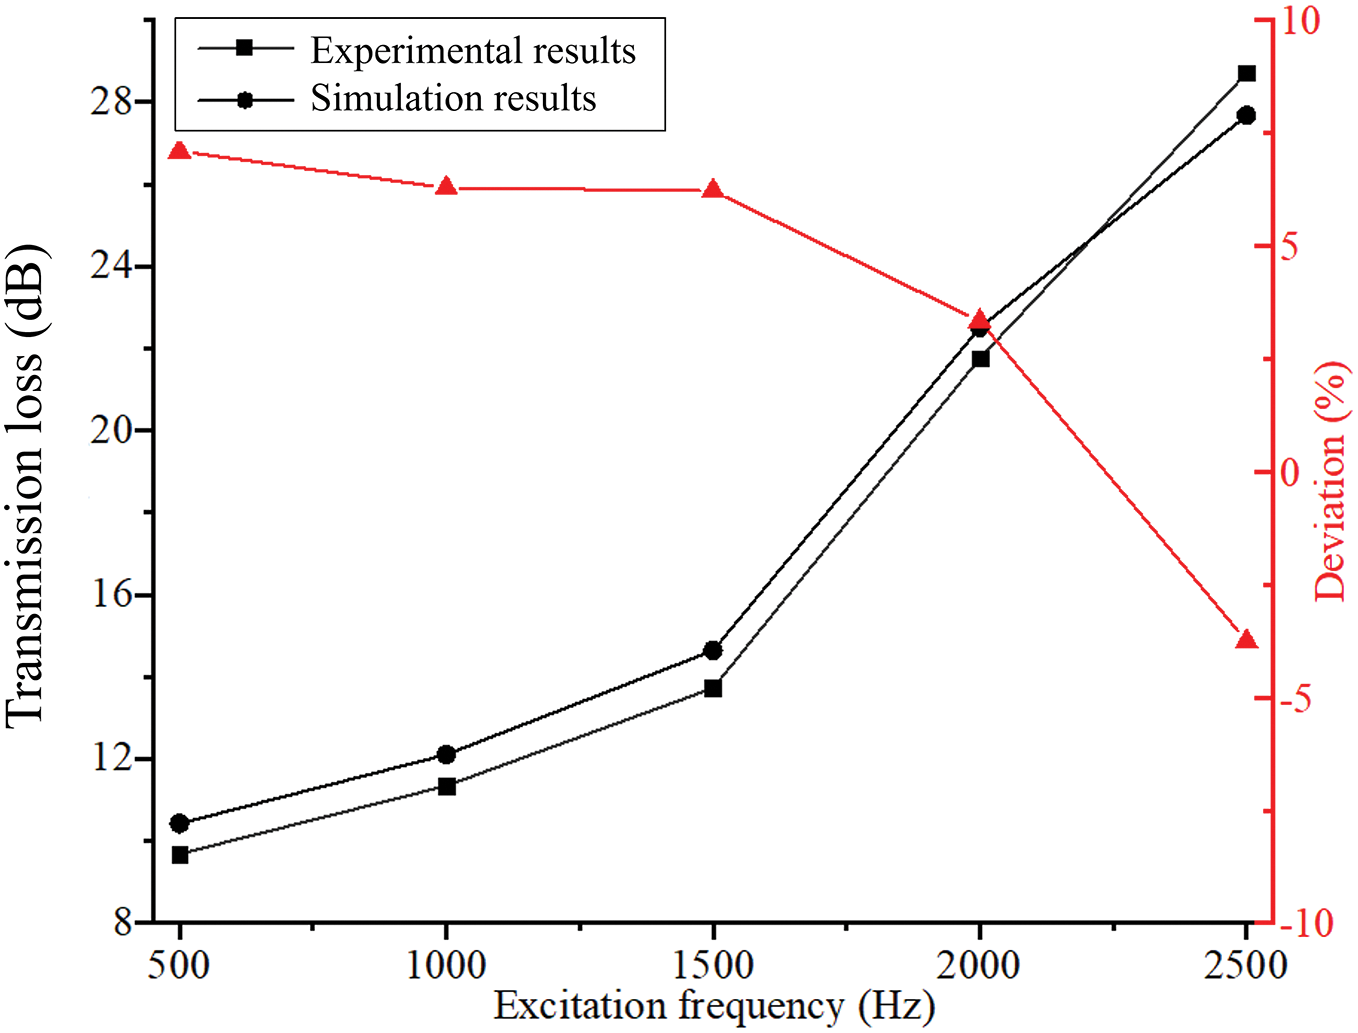
Figure 14: Comparative analysis of experimental and simulation results
In this study, an optimization-driven design scheme of lightweight acoustic metamaterials for additive manufacturing is proposed. In this scheme, we use a density-based topology optimization method and a surrogate model-based parameter optimization approach to design pressure modulation acoustic metamaterial (PMAM) that fits the preconceptions from conceptual design to detailed design. Firstly, a topology optimization model for the PMAM with the objective of minimizing acoustic pressure is developed in this study, which provides a conceptual design architecture for the following structural parameter optimization. This study elevates the 2D-based initial configuration of the PMAM to the 3D model, which greatly simplifies the computational cost while maintaining the structural performance requirements. Then, this study formulates a high-dimensional parameterization model corresponding to the topology optimization results. We develop an adaptive Kriging interpolation method and construct a surrogate model based on the original parameterization formulation. Compared with the original finite element analysis model, our surrogate model not only achieves accurate performance prediction, but also greatly simplifies the analysis process and time. The surrogate model can optimize the PMAM using only a few sampling points, which greatly reduces the number of calls for repeated analysis of the algorithm. A ready-to-manufacture PMAM is devised by using the proposed optimization scheme. Eventually, a test platform based on an impedance tube is built in this study. Experimental validation confirms the exceptional acoustic absorption coefficient and acoustic insulation of the additively manufactured PMAM specimens. The simulation and experiment results are both implemented and analyzed.
In summary, the lightweight acoustic metamaterials (i.e., the PMAM) for additive manufacturing with excellent sound absorption and noise reduction performance are obtained in this study. The results demonstrate the effectiveness and accuracy of the proposed optimization-driven design scheme. Simulation and experiment results verify the effectiveness and correctness of the proposed method. In the future, the proposed optimization-driven design scheme can be extended to solve different types of metamaterial design problems for additive manufacturing, aiming at real-world engineering applications.
Acknowledgement: The authors would like to express their gratitude to the editors and reviewers for their thorough review and valuable recommendations.
Funding Statement: This research was supported by the National Key Research and Development Program of China (No. 2023YFB4604800), the National Natural Science Foundation of China (No. 52075195), and the Intelligent Manufacturing Equipment and Technology Open Foundation (No. IMETKF2023016).
Author Contributions: The authors confirm contribution to the paper as follows: study conception and design: Ying Zhou, Mengli Ye; picture drawing: Jiayang Yuan, Zhengtao Shu; analysis of results: Zhengtao Shu, Mengli Ye, Jiayang Yuan; draft manuscript preparation: Ying Zhou, Jiayang Yuan, Mengli Ye, Liang Gao, Qiong Wang. All authors reviewed the results and approved the final version of the manuscript.
Availability of Data and Materials: Not applicable.
Ethics Approval: Not applicable.
Conflicts of Interest: The authors declare no conflicts of interest to report regarding the present study.
References
1. Li X, Chua JW, Yu X, Li Z, Zhao M, Wang Z, et al. 3D-printed lattice structures for sound absorption: current progress, mechanisms and models, structural-property relationships, and future outlook. Adv Sci. 2024;11(4):e2305232. doi:10.1002/advs.202305232. [Google Scholar] [PubMed] [CrossRef]
2. Sekar V, Cantwell WJ, Liao K, Berton B, Jacquart PM, Abu Al-Rub RK. Additively manufactured metamaterials for acoustic absorption: a review. Virtual Phys Prototyp. 2024;19(1):e2435562. doi:10.1080/17452759.2024.2435562. [Google Scholar] [CrossRef]
3. Zhou Z, Huang S, Li D, Zhu J, Li Y. Broadband impedance modulation via non-local acoustic metamaterials. Natl Sci Rev. 2022;9(8):nwab171. doi:10.1093/nsr/nwab171. [Google Scholar] [PubMed] [CrossRef]
4. Bai Y, Li X, Zhou X, Li P, Beer M. Soil-expended seismic metamaterial with ultralow and wide bandgap. Mech Mater. 2023;180(3):104601. doi:10.1016/j.mechmat.2023.104601. [Google Scholar] [CrossRef]
5. Li X, Yu X, Zhao M, Li Z, Wang Z, Zhai W. Multi-level bioinspired microlattice with broadband sound-absorption capabilities and deformation-tolerant compressive response. Adv Funct Mater. 2023;33(2):2210160. doi:10.1002/adfm.202210160. [Google Scholar] [CrossRef]
6. Gai XL, Guan XW, Cai ZN, Li XH, Hu WC, Xing T, et al. Acoustic properties of honeycomb like sandwich acoustic metamaterials. Appl Acoust. 2022;199(1):109016. doi:10.1016/j.apacoust.2022.109016. [Google Scholar] [CrossRef]
7. Huang Y, Lu X, Liang G, Xu Z. Pentamodal property and acoustic band gaps of pentamode metamaterials with different cross-section shapes. Phys Lett A. 2016;380(13):1334–8. doi:10.1016/j.physleta.2016.01.041. [Google Scholar] [CrossRef]
8. Noguchi Y, Yamada T, Izui K, Nishiwaki S. Optimum design of an acoustic metamaterial with negative bulk modulus in an acoustic-elastic coupled system using a level set-based topology optimization method. Numer Meth Eng. 2018;113(8):1300–39. doi:10.1002/nme.5616. [Google Scholar] [CrossRef]
9. Chen M, Jiang H, Zhang H, Li D, Wang Y. Design of an acoustic superlens using single-phase metamaterials with a star-shaped lattice structure. Sci Rep. 2018;8(1):1861. doi:10.1038/s41598-018-19374-2. [Google Scholar] [PubMed] [CrossRef]
10. Zheng Y, Wang Y, Lu X, Liao Z, Qu J. Evolutionary topology optimization for mechanical metamaterials with auxetic property. Int J Mech Sci. 2020;179(11):105638. doi:10.1016/j.ijmecsci.2020.105638. [Google Scholar] [CrossRef]
11. Wu RT, Liu TW, Jahanshahi MR, Semperlotti F. Design of one-dimensional acoustic metamaterials using machine learning and cell concatenation. Struct Multidiscip Optim. 2021;63(5):2399–423. doi:10.1007/s00158-020-02819-6. [Google Scholar] [CrossRef]
12. Osher S, Sethian JA. Fronts propagating with curvature-dependent speed: algorithms based on Hamilton-Jacobi formulations. J Comput Phys. 1988;79(1):12–49. doi:10.1016/0021-9991(88)90002-2. [Google Scholar] [CrossRef]
13. Sethian JA, Wiegmann A. Structural boundary design via level set and immersed interface methods. J Comput Phys. 2000;163(2):489–528. doi:10.1006/jcph.2000.6581. [Google Scholar] [CrossRef]
14. Wang MY, Wang X, Guo D. A level set method for structural topology optimization. Comput Meth Appl Mech Eng. 2003;192(1–2):227–46. doi:10.1016/s0045-7825(02)00559-5. [Google Scholar] [CrossRef]
15. Zhou M, Rozvany GIN. The COC algorithm, part II: topological, geometrical and generalized shape optimization. Comput Meth Appl Mech Eng. 1991;89(1–3):309–36. doi:10.1016/0045-7825(91)90046-9. [Google Scholar] [CrossRef]
16. Bendsøe MP, Sigmund O. Material interpolation schemes in topology optimization. Arch Appl Mech. 1999;69(9):635–54. doi:10.1007/s004190050248. [Google Scholar] [CrossRef]
17. Sigmund O. A 99 line topology optimization code written in Matlab. Struct Multidiscip Optim. 2001;21(2):120–7. doi:10.1007/s001580050176. [Google Scholar] [CrossRef]
18. Bendsøe MP, Kikuchi N. Generating optimal topologies in structural design using a homogenization method. Comput Meth Appl Mech Eng. 1988;71(2):197–224. doi:10.1016/0045-7825(88)90086-2. [Google Scholar] [CrossRef]
19. Xie YM, Steven GP. A simple evolutionary procedure for structural optimization. Comput Struct. 1993;49(5):885–96. doi:10.1016/0045-7949(93)90035-C. [Google Scholar] [CrossRef]
20. Guo X, Zhang W, Zhong W. Doing topology optimization explicitly and geometrically—a new moving morphable components based framework. J Appl Mech. 2014;81(8):081009. doi:10.1115/1.4027609. [Google Scholar] [CrossRef]
21. Norato JA, Bell BK, Tortorelli DA. A geometry projection method for continuum-based topology optimization with discrete elements. Comput Meth Appl Mech Eng. 2015;293(4):306–27. doi:10.1016/j.cma.2015.05.005. [Google Scholar] [CrossRef]
22. Noguchi Y, Yamada T. Topology optimization of acoustic metasurfaces by using a two-scale homogenization method. Appl Math Model. 2021;98(4):465–97. doi:10.1016/j.apm.2021.05.005. [Google Scholar] [CrossRef]
23. Noguchi Y, Yamada T. Level set-based topology optimization for graded acoustic metasurfaces using two-scale homogenization. Finite Elem Anal Des. 2021;196(5485):103606. doi:10.1016/j.finel.2021.103606. [Google Scholar] [CrossRef]
24. Du J, Olhoff N. Topological design of vibrating structures with respect to optimum sound pressure characteristics in a surrounding acoustic medium. Struct Multidiscip Optim. 2010;42(1):43–54. doi:10.1007/s00158-009-0477-y. [Google Scholar] [CrossRef]
25. Noguchi Y, Matsushima K, Yamada T. Level set-based topology optimization for the design of labyrinthine acoustic metamaterials. Mater Des. 2022;219(5485):110832. doi:10.1016/j.matdes.2022.110832. [Google Scholar] [CrossRef]
26. Noguchi Y, Yamada T, Izui K, Nishiwaki S. Topology optimization for hyperbolic acoustic metamaterials using a high-frequency homogenization method. Comput Meth Appl Mech Eng. 2018;335(4):419–71. doi:10.1016/j.cma.2018.02.031. [Google Scholar] [CrossRef]
27. Li YF, Huang X, Meng F, Zhou S. Evolutionary topological design for phononic band gap crystals. Struct Multidiscip Optim. 2016;54(3):595–617. doi:10.1007/s00158-016-1424-3. [Google Scholar] [CrossRef]
28. Chen Y, Meng F, Sun G, Li G, Huang X. Topological design of phononic crystals for unidirectional acoustic transmission. J Sound Vib. 2017;410:103–23. doi:10.1016/j.jsv.2017.08.015. [Google Scholar] [CrossRef]
29. Zhang X, Xing J, Liu P, Luo Y, Kang Z. Realization of full and directional band gap design by non-gradient topology optimization in acoustic metamaterials. Extrem Mech Lett. 2021;42:101126. doi:10.1016/j.eml.2020.101126. [Google Scholar] [CrossRef]
30. Li Z, Li X, Wang Z, Zhai W. Multifunctional sound-absorbing and mechanical metamaterials via a decoupled mechanism design approach. Mater Horiz. 2023;10(1):75–87. doi:10.1039/d2mh00977c. [Google Scholar] [PubMed] [CrossRef]
31. Li Z, Wang X, Li X, Wang Z, Zhai W. New class of multifunctional bioinspired microlattice with excellent sound absorption, damage tolerance, and high specific strength. ACS Appl Mater Interfaces. 2023;15(7):9940–52. doi:10.1021/acsami.2c19456. [Google Scholar] [PubMed] [CrossRef]
32. Li Y, Assouar BM. Acoustic metasurface-based perfect absorber with deep subwavelength thickness. Appl Phys Lett. 2016;108(6):063502. doi:10.1063/1.4941338. [Google Scholar] [CrossRef]
33. Li L, Diao Y, Wu H, Jiang W. Thickness-designable acoustic metamaterial for passive phased arrays. Appl Acoust. 2022;198(5):108942. doi:10.1016/j.apacoust.2022.108942. [Google Scholar] [CrossRef]
34. Coox L, Atak O, Vandepitte D, Desmet W. An isogeometric indirect boundary element method for solving acoustic problems in open-boundary domains. Comput Meth Appl Mech Eng. 2017;316:186–208. doi:10.1016/j.cma.2016.05.039. [Google Scholar] [CrossRef]
35. Sathyan S, Aydin U, Belahcen A. Acoustic noise computation of electrical motors using the boundary element method. Energies. 2020;13(1):245. doi:10.3390/en13010245. [Google Scholar] [CrossRef]
36. Belyaev M, Burnaev E, Kapushev E, Panov M, Prikhodko P, Vetrov D, et al. GTApprox: surrogate modeling for industrial design. Adv Eng Softw. 2016;102(1):29–39. doi:10.1016/j.advengsoft.2016.09.001. [Google Scholar] [CrossRef]
37. Jin R, Chen W, Simpson TW. Comparative studies of metamodelling techniques under multiple modelling criteria. Struct Multidiscip Optim. 2001;23(1):1–13. doi:10.1007/s00158-001-0160-4. [Google Scholar] [CrossRef]
38. Zhou Y, Gao L, Li H. Graded infill design within free-form surfaces by conformal mapping. Int J Mech Sci. 2022;224:107307. doi:10.1016/j.ijmecsci.2022.107307. [Google Scholar] [CrossRef]
39. Kudela J, Matousek R. Recent advances and applications of surrogate models for finite element method computations: a review. Soft Comput. 2022;26(24):13709–33. doi:10.1007/s00500-022-07362-8. [Google Scholar] [CrossRef]
40. Li K, Yu Y, He J, Lin Y. An integrated beam-plate structure multi-level optimal design framework based on bi-directional evolutionary structural optimization and surrogate model. Adv Eng Softw. 2018;115:230–47. doi:10.1016/j.advengsoft.2017.09.011. [Google Scholar] [CrossRef]
41. He W, Xu Y, Zhou Y, Li Q. A novel improvement of Kriging surrogate model. Aircr Eng Aerosp Technol. 2019;91(7):994–1001. doi:10.1108/aeat-06-2018-0157. [Google Scholar] [CrossRef]
42. Shang X, Su L, Fang H, Zeng B, Zhang Z. An efficient multi-fidelity Kriging surrogate model-based method for global sensitivity analysis. Reliab Eng Syst Saf. 2023;229(4):108858. doi:10.1016/j.ress.2022.108858. [Google Scholar] [CrossRef]
43. Wang YZ, Ma L. Sound insulation performance of membrane-type metamaterials combined with pyramidal truss core sandwich structure. Compos Struct. 2021;260(5):113257. doi:10.1016/j.compstruct.2020.113257. [Google Scholar] [CrossRef]
44. Marburg S. Efficient optimization of a noise transfer function by modification of a shell structure geometry—part I: theory. Struct Multidiscip Optim. 2002;24(1):51–9. doi:10.1007/s00158-002-0213-3. [Google Scholar] [CrossRef]
45. Hargreaves JA. A tutorial on the finite and boundary element methods in acoustics. J Acoust Soc Am. 2021;149(4_Suppl):A92. doi:10.1121/10.0004613. [Google Scholar] [CrossRef]
46. Marburg S, Beer HJ, Gier J, Hardtke HJ, Rennert R, Perret F. Experimental verification of structural-acoustic modelling and design optimization. J Sound Vib. 2002;252(4):591–615. doi:10.1006/jsvi.2001.4037. [Google Scholar] [CrossRef]
47. Christensen ST, Sorokin SV, Olhoff N. On analysis and optimization in structural acoustics: part I: problem formulation and solution techniques. Struct Optim. 1998;16(2):83–95. doi:10.1007/BF01202818. [Google Scholar] [CrossRef]
48. Li H, Luo Z, Zhang N, Gao L, Brown T. Integrated design of cellular composites using a level-set topology optimization method. Comput Meth Appl Mech Eng. 2016;309:453–75. doi:10.1016/j.cma.2016.06.012. [Google Scholar] [CrossRef]
49. Zhao W, Chen L, Chen H, Marburg S. Topology optimization of exterior acoustic-structure interaction systems using the coupled FEM-BEM method. Int J Numer Meth Eng. 2019;119(5):404–31. doi:10.1002/nme.6055. [Google Scholar] [CrossRef]
50. Kawamoto A, Matsumori T, Yamasaki S, Nomura T, Kondoh T, Nishiwaki S. Heaviside projection based topology optimization by a PDE-filtered scalar function. Struct Multidiscip Optim. 2011;44(1):19–24. doi:10.1007/s00158-010-0562-2. [Google Scholar] [CrossRef]
51. Fu J, Li H, Xiao M, Gao L, Chu S. Topology optimization of shell-infill structures using a distance regularized parametric level-set method. Struct Multidiscip Optim. 2019;59(1):249–62. doi:10.1007/s00158-018-2064-6. [Google Scholar] [CrossRef]
52. Li H, Gao L, Li H, Tong H. Spatial-varying multi-phase infill design using density-based topology optimization. Comput Meth Appl Mech Eng. 2020;372:113354. doi:10.1016/j.cma.2020.113354. [Google Scholar] [CrossRef]
53. Liu Z, Feng L, Rumpler R. Design of broadband acoustic metamaterials for low-frequency noise insulation. J Acoust Soc Am. 2017;141(5_Suppl):3574. doi:10.1121/1.4987600. [Google Scholar] [CrossRef]
54. Nan J, Zong N, Chen Q, Zhang L, Zheng Q, Xia Y. A structure design method for reduction of MRI acoustic noise. Comput Math Methods Med. 2017;2017:6253428. doi:10.1155/2017/6253428. [Google Scholar] [PubMed] [CrossRef]
55. Noguchi Y, Yamamoto T, Yamada T, Izui K, Nishiwaki S. A level set-based topology optimization method for simultaneous design of elastic structure and coupled acoustic cavity using a two-phase material model. J Sound Vib. 2017;404(10):15–30. doi:10.1016/j.jsv.2017.05.040. [Google Scholar] [CrossRef]
56. Yang Y, Zhu M, Shields MD, Guest JK. Topology optimization of continuum structures subjected to filtered white noise stochastic excitations. Comput Meth Appl Mech Eng. 2017;324(3):438–56. doi:10.1016/j.cma.2017.06.015. [Google Scholar] [CrossRef]
57. Venter G, Sobieszczanski-Sobieski J. Particle swarm optimization. AIAA J. 2003;41(8):1583–9. doi:10.2514/2.2111. [Google Scholar] [CrossRef]
58. Shi Y, Liu H, Gao L, Zhang G. Cellular particle swarm optimization. Inf Sci. 2011;181(20):4460–93. doi:10.1016/j.ins.2010.05.025. [Google Scholar] [CrossRef]
59. Helton JC, Davis FJ. Latin hypercube sampling and the propagation of uncertainty in analyses of complex systems. Reliab Eng Syst Saf. 2003;81(1):23–69. doi:10.1016/S0951-8320(03)00058-9. [Google Scholar] [CrossRef]
60. Olsson A, Sandberg G, Dahlblom O. On Latin hypercube sampling for structural reliability analysis. Struct Saf. 2003;25(1):47–68. doi:10.1016/S0167-4730(02)00039-5. [Google Scholar] [CrossRef]
61. Viana FAC, Venter G, Balabanov V. An algorithm for fast optimal Latin hypercube design of experiments. Numer Meth Eng. 2010;82(2):135–56. doi:10.1002/nme.2750. [Google Scholar] [CrossRef]
62. Li X, Ma J, Chen Z, Wen X, Qiu H. Reliability-based design optimization using inherited Latin hypercube sampling and local kriging approximation. Comput Integr Manuf Syst. 2018;24(12):3107–19. doi:10.13196/j.cims.2018.12.018. [Google Scholar] [CrossRef]
63. Wang H, Jin Y, Doherty J. Committee-based active learning for surrogate-assisted particle swarm optimization of expensive problems. IEEE Trans Cybern. 2017;47(9):2664–77. doi:10.1109/TCYB.2017.2710978. [Google Scholar] [PubMed] [CrossRef]
64. Yu H, Tan Y, Sun C, Zeng J. A generation-based optimal restart strategy for surrogate-assisted social learning particle swarm optimization. Knowl Based Syst. 2019;163:14–25. doi:10.1016/j.knosys.2018.08.010. [Google Scholar] [CrossRef]
65. Cai X, Qiu H, Gao L, Wei L, Shao X. Adaptive radial-basis-function-based multifidelity metamodeling for expensive black-box problems. AIAA J. 2017;55(7):2424–36. doi:10.2514/1.j055649. [Google Scholar] [CrossRef]
66. Yamamoto T, Maruyama S, Nishiwaki S, Yoshimura M. Topology design of multi-material soundproof structures including poroelastic media to minimize sound pressure levels. Comput Meth Appl Mech Eng. 2009;198(17–20):1439–55. doi:10.1016/j.cma.2008.12.008. [Google Scholar] [CrossRef]
67. Zhang L, Song B, Zhao A, Liu R, Yang L, Shi Y. Study on mechanical properties of honeycomb pentamode structures fabricated by laser additive manufacturing: numerical simulation and experimental verification. Compos Struct. 2019;226(3):111199. doi:10.1016/j.compstruct.2019.111199. [Google Scholar] [CrossRef]
68. Zhou Y, Gao L, Li H. A ready-to-manufacture optimization design of 3D chiral auxetics for additive manufacturing. Eng Comput. 2024;40(3):1517–38. doi:10.1007/s00366-023-01880-1. [Google Scholar] [CrossRef]
69. Zong H, Zhang H, Wang Y, Wang MY, Fuh JYH. On two-step design of microstructure with desired Poisson’s ratio for AM. Mater Des. 2018;159(9):90–102. doi:10.1016/j.matdes.2018.08.032. [Google Scholar] [CrossRef]
Cite This Article
 Copyright © 2025 The Author(s). Published by Tech Science Press.
This work is licensed under a Creative Commons Attribution 4.0 International License , which permits unrestricted use, distribution, and reproduction in any medium, provided the original work is properly cited.
 Downloads
 Citation Tools