
 Submit a Paper
 Propose a Special lssue
 Open Access
ARTICLE
CARE: Comprehensive Artificial Intelligence Techniques for Reliable Autism Evaluation in Pediatric Care
1 Department of Data Science, Duksung Women’s University, Seoul, 01369, Republic of Korea
2 Department of AI and Big Data, Soonchunhyang University, Asan, 31538, Republic of Korea
* Corresponding Author: Jiyoung Woo. Email:
(This article belongs to the Special Issue: Bridging the Gap: AutoML and Explainable AI for Industrial and Healthcare Innovations)
Computers, Materials & Continua 2025, 85(1), 1383-1425. https://doi.org/10.32604/cmc.2025.067784
Received 12 May 2025; Accepted 29 July 2025; Issue published 29 August 2025
 View Full Text
 Download PDF
Abstract
Improving early diagnosis of autism spectrum disorder (ASD) in children increasingly relies on predictive models that are reliable and accessible to non-experts. This study aims to develop such models using Python-based tools to improve ASD diagnosis in clinical settings. We performed exploratory data analysis to ensure data quality and identify key patterns in pediatric ASD data. We selected the categorical boosting (CatBoost) algorithm to effectively handle the large number of categorical variables. We used the PyCaret automated machine learning (AutoML) tool to make the models user-friendly for clinicians without extensive machine learning expertise. In addition, we applied Shapley additive explanations (SHAP), an explainable artificial intelligence (XAI) technique, to improve the interpretability of the models. Models developed using CatBoost and other AI algorithms showed high accuracy in diagnosing ASD in children. SHAP provided clear insights into the influence of each variable on diagnostic outcomes, making model decisions transparent and understandable to healthcare professionals. By integrating robust machine learning methods with user-friendly tools such as PyCaret and leveraging XAI techniques such as SHAP, this study contributes to the development of reliable, interpretable, and accessible diagnostic tools for ASD. These advances hold great promise for supporting informed decision-making in clinical settings, ultimately improving early identification and intervention strategies for ASD in the pediatric population. However, the study is limited by the dataset’s demographic imbalance and the lack of external clinical validation, which should be addressed in future research.Keywords
Autism spectrum disorder (ASD) is a complex neurodevelopmental condition characterized by ongoing challenges in social communication and interaction, as well as restricted and repetitive behaviors [1]. The term “spectrum” emphasizes the variability of symptoms and severity among individuals with ASD, necessitating highly individualized diagnostic and therapeutic approaches [2]. These inherent complexities present significant challenges for clinicians, particularly in achieving early and accurate diagnoses, which are critical for effective intervention [3]. Traditional diagnostic methods often rely heavily on clinical observation and standardized tests that can be time-consuming, subjective, and prone to variability across practitioners. In contrast, AI techniques offer opportunities to standardize assessments, reduce diagnostic delays, and enhance accuracy through data-driven insights. Early diagnosis of ASD, typically between 2 and 3 years of age, is essential to mitigate potential developmental challenges and improve long-term outcomes [4]. Early identification allows for targeted interventions that can significantly improve a child’s social, cognitive, and behavioral development [5]. However, the subtle and diverse nature of ASD symptoms often complicates early identification, delaying critical interventions and negatively impacting developmental trajectories [3,6]. This underscores the urgent need for complementary tools that can support early and accurate identification of ASD features and guide families and caregivers toward timely and appropriate professional evaluation [7].
Recent advances in machine learning (ML) and artificial intelligence (AI) have shown significant potential to aid diagnostic processes in various medical fields, including ASD [8–10]. AI-driven models, such as support vector machines (SVMs) and deep neural networks, have demonstrated high accuracy in identifying ASD-related patterns in complex datasets [11]. Despite their promise, these models have significant limitations. First, many advanced ML models operate as “black boxes”, providing little transparency into their decision-making processes, which can limit trust and hinder adoption in clinical settings where interpretability is essential [12,13]. Second, the use of these models often requires advanced technical expertise, which can be challenging for clinicians whose primary focus is patient care rather than data science [14]. This underscores the importance of developing AI tools that are not only technically robust but also accessible to non-experts so that healthcare professionals can use them as supportive tools rather than as replacements for clinical judgment [15].
In response to these challenges, this study introduces the Comprehensive Artificial intelligence techniques for Reliable autism Evaluation (CARE) framework. The CARE framework is specifically designed to serve as a preliminary screening tool in non-clinical settings such as homes, schools, and community centers, providing families and caregivers with initial insights into potential ASD characteristics. These AI-driven insights are designed to complement clinical expertise by helping families identify early signs of ASD and seek timely evaluation from healthcare professionals. By combining robust data preprocessing, exploratory data analysis (EDA), advanced ML modeling, and explainable AI (XAI) techniques, the CARE framework ensures that its predictions are both reliable and interpretable. The use of Python-based tools ensures that the framework remains accessible, streamlines the data analysis process for both data analysts and clinicians, and aligns with the principles of personalized medicine.
The objectives of this study are as follows:
• To evaluate the feasibility of using data preprocessing and EDA to improve the reliability and credibility of pediatric ASD datasets;
• To evaluate the effectiveness of advanced ML algorithms in analyzing complex, high-dimensional data to support early ASD screening;
• To explore the applicability of automated ML (AutoML) tools to develop accessible and interpretable predictive models for families, caregivers, and clinicians without the need for extensive technical expertise;
• To investigate the ability of XAI techniques to improve model interpretability, thereby promoting trust and usability for non-expert users.
This study is not intended to replace clinical expertise but rather to provide a complementary tool to bridge the gap between early concerns raised by families or educators and comprehensive professional assessments. By providing interpretable insights into potential features of ASD, the CARE framework can help families make informed decisions about seeking appropriate medical care. Such tools can facilitate earlier intervention, particularly in underserved areas where access to specialists is limited, thereby contributing to better outcomes for children with ASD.
This paper contributes the following to the fields of ASD diagnosis and personalized medicine:
• We present the CARE framework, which integrates advanced AI techniques to improve the reliability and accessibility of ASD screening tools in pediatric care. This framework provides a structured and flexible template for applying sophisticated ML solutions in both clinical and non-clinical settings, such as schools or community centers.
• Leveraging Python’s extensive ecosystem, we implement rigorous data preprocessing and EDA to ensure the integrity and quality of input data. These processes address common issues such as missing values and data normalization while incorporating expert domain knowledge to refine the dataset, improving the accuracy and reliability of subsequent analyses.
• By integrating PyCaret, an open-source, low-code ML library in Python, we streamline the ML workflow and make it accessible to families, caregivers, and clinicians the need for extensive technical expertise. PyCaret simplifies tasks such as model training, evaluation, and deployment, lowering barriers to entry and enabling broader participation in early ASD screening.
• We demonstrate the effectiveness of CatBoost, a categorical boosting algorithm specifically designed to handle high cardinality categorical variables, on complex pediatric ASD datasets. By comparing CatBoost to models generated by PyCaret’s AutoML tools, we highlight its superior performance and suitability for ASD screening, particularly in efficiently handling prevalent categorical data in ASD-related datasets.
• We apply Shapley additive explanations (SHAP), an XAI technique, to our CatBoost models to provide clear insights into trait contributions. This transparency fosters greater confidence and understanding among non-expert users, enabling families and caregivers to understand potential ASD traits while ensuring that clinicians can easily interpret the models to support early screening and timely medical evaluations.
The remainder of this paper is structured as follows: Section 2 reviews existing studies pertinent to ASD diagnosis and ML application in this domain. Section 3 details the data sources, preprocessing techniques, and EDA conducted using Python and introduces our comprehensive approach, which includes the implementation of CatBoost, PyCaret, and SHAP. Section 4 evaluates the performance of various ML models, comparing CatBoost with models derived from PyCaret’s AutoML suite and interpreting the results using XAI techniques. Section 5 focuses on the implications of sampling methods and dataset characteristics, emphasizing their influence on model performance and reliability. Finally, Section 6 summarizes the key findings of the study, discusses their clinical implications, and suggests directions for future research.
The application of ML techniques in predicting and diagnosing ASD has evolved significantly from 2018 to 2024. Table 1 provides an overview of major studies conducted during this period, highlighting the methodologies, datasets, and performance outcomes. This overview advances understanding of the field and identifies the unique contributions of our research compared to existing studies.
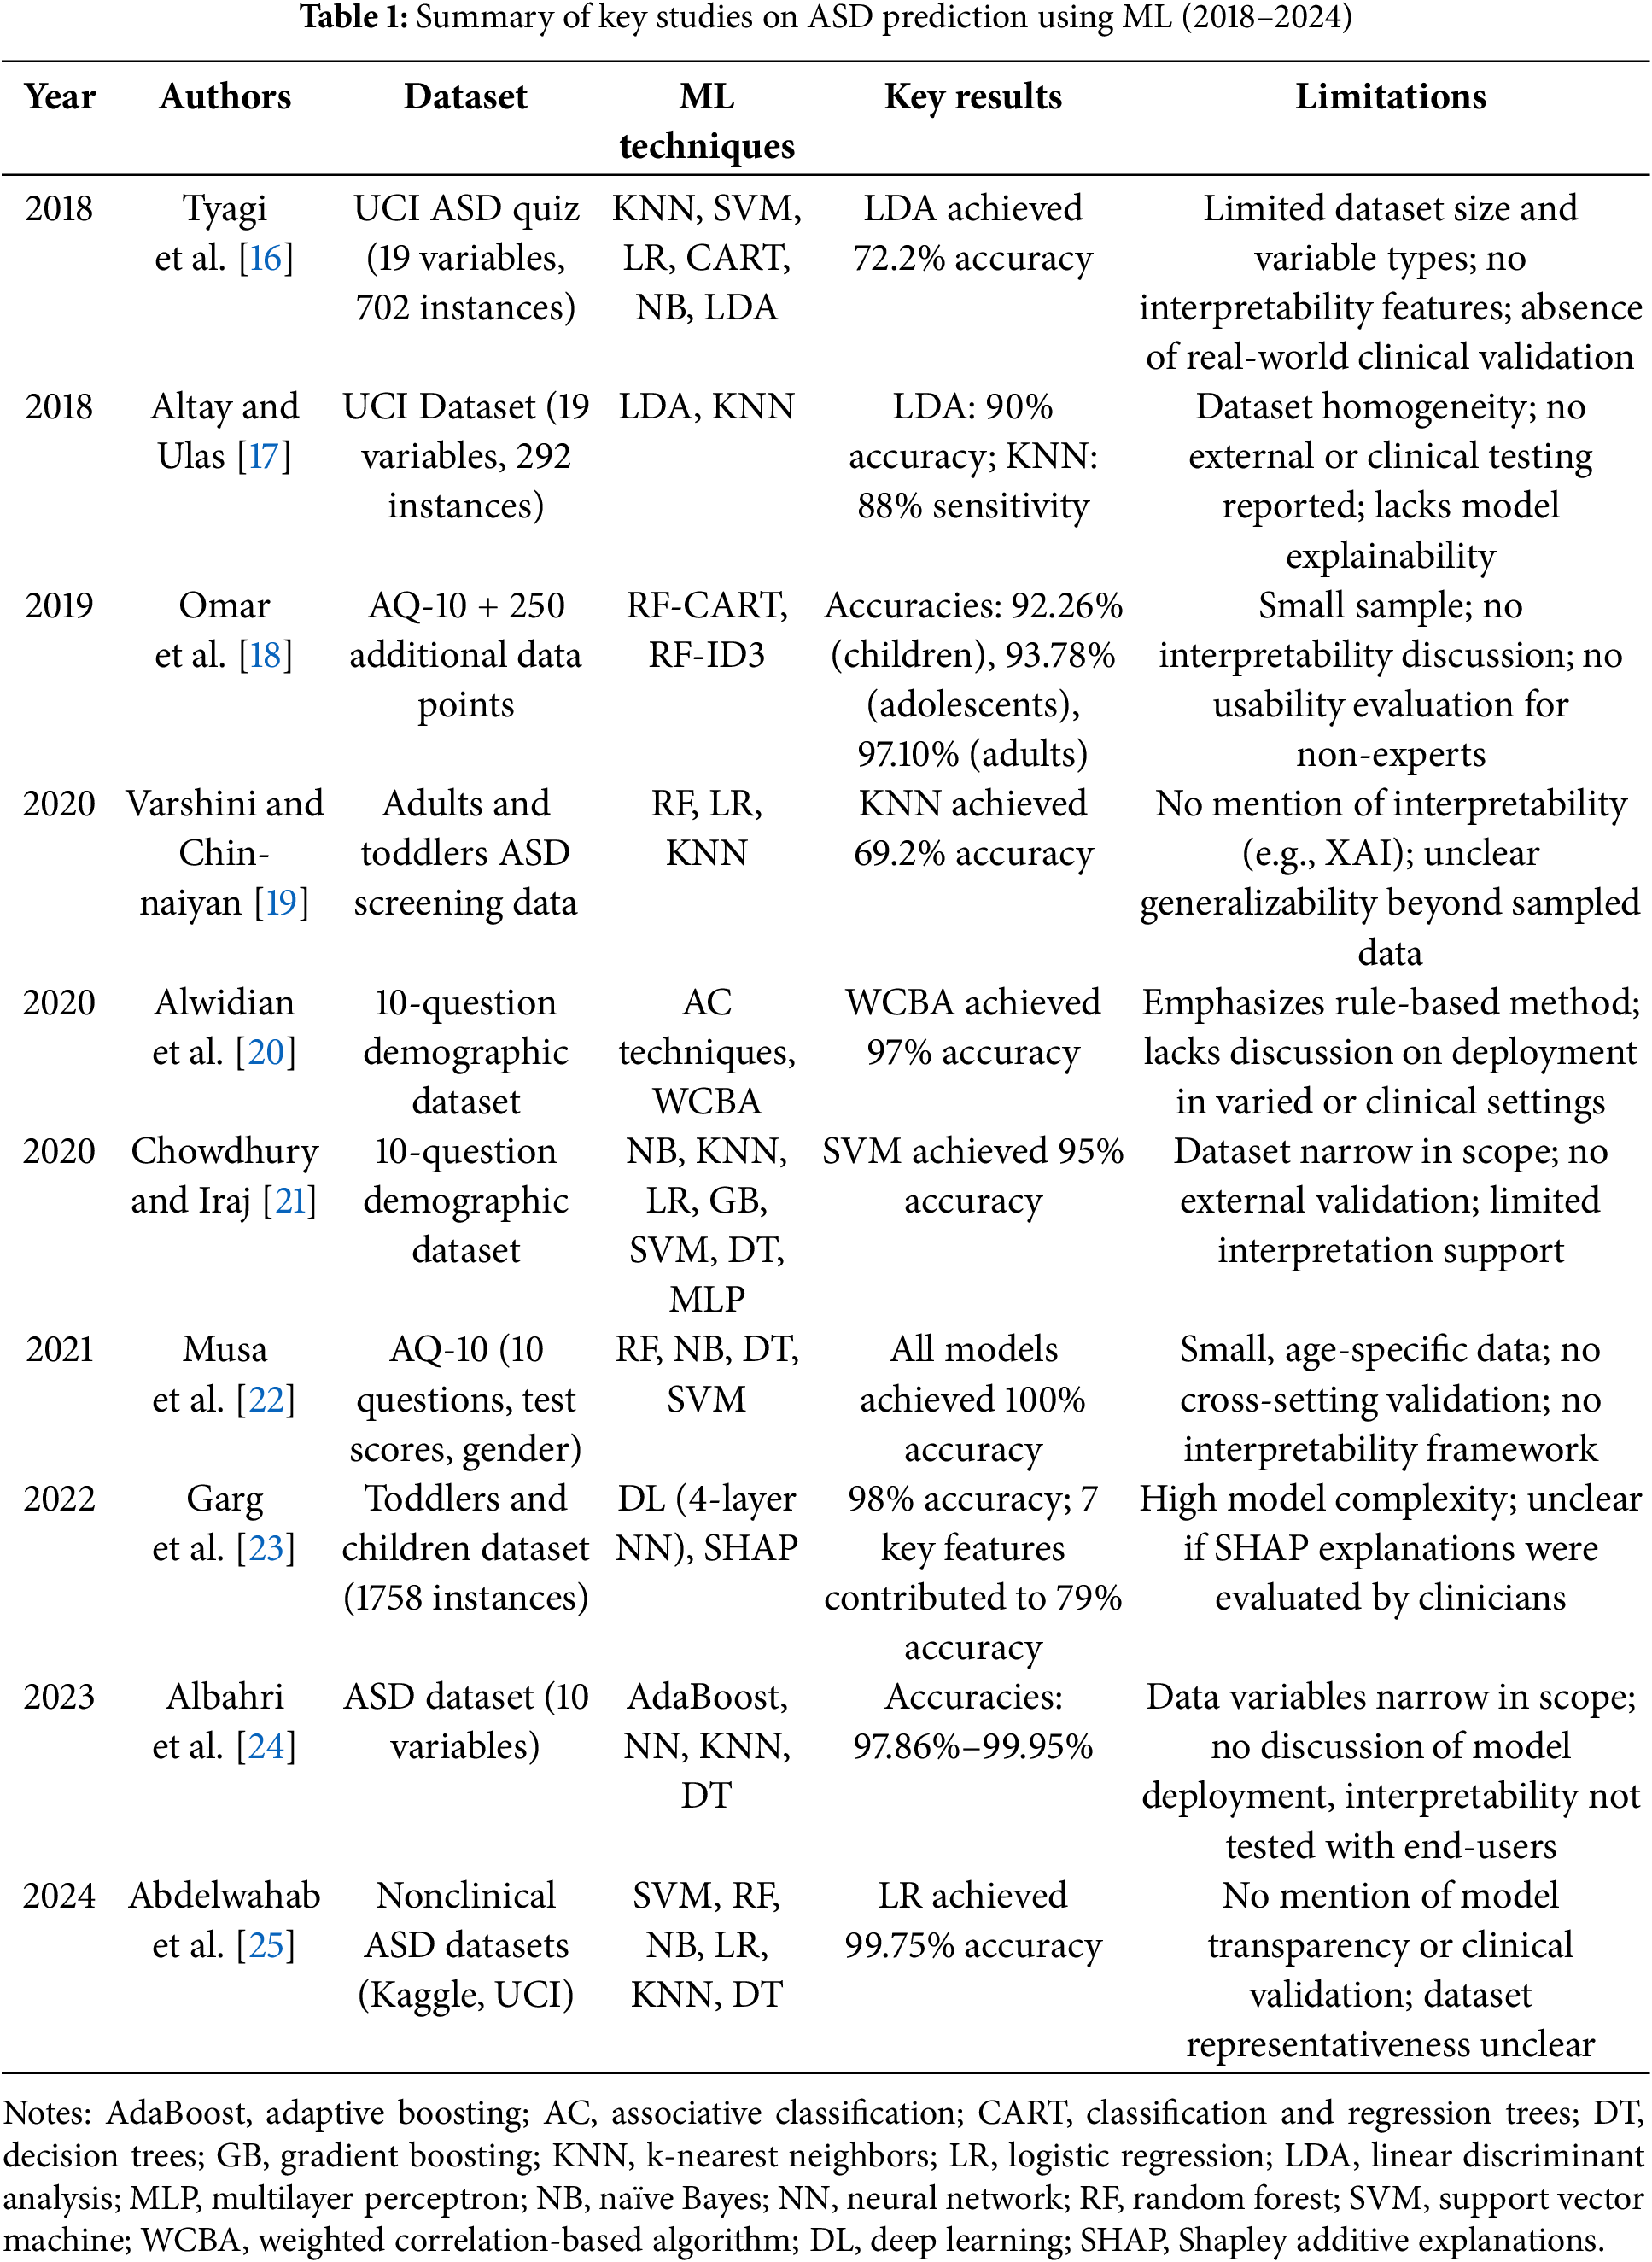
Early efforts to use ML for ASD prediction focused primarily on traditional classification algorithms. For instance, Tyagi et al. [16] used algorithms such as k-nearest neighbors (KNNs), SVMs, logistic regression (LR), classification and regression trees (CARTs), naïve Bayes (NB), and linear discriminant analysis (LDA) on the ASD quiz application dataset from the University of California, Irvine (UCI) Machine Learning Repository. This dataset comprised 19 variables and 702 instances, with LDA outperforming other models, achieving an accuracy of 72.2%. Similarly, Altay and Ulas [17] examined the performance of LDA and KNN algorithms on a dataset of children aged 4 to 11, containing 19 variables and 292 instances. Their findings indicated that LDA reached an accuracy of 90%, while KNN excelled in sensitivity (88%), effectively identifying ASD cases.
In 2019, Omar et al. [18] expanded the scope of ASD prediction by developing a versatile prediction model that can be applied across different age groups. Using the 10-item autism-spectrum quotient (AQ-10) dataset, supplemented with an additional 250 data points, they integrated random forest (RF)-CART and RF-iterative dichotomizer 3 (ID3) algorithms into a hybrid model. This model achieved impressive accuracies of 92.26%, 93.78%, and 97.10% for children, adolescents, and adults, respectively. In addition, they developed an easy-to-use mobile application based on their predictive model, facilitating easy assessment of autism traits. This application extended model usability beyond traditional research environments, providing practical benefits for early ASD screening. However, these studies focused primarily on traditional ML techniques, lacking advanced model tuning and interpretability features.
In 2020, researchers began integrating more sophisticated ML classifiers and exploring optimized classification approaches for ASD prediction. Varshini and Chinnaiyan [19] developed classification models using RF, LR, and KNNs on datasets comprising adults and infants, with KNN achieving the highest accuracy of 69.2%, outperforming both LR and RF. Alwidian et al. [20] investigated associative classification (AC) techniques using a dataset featuring 10 questions and additional demographic variables. Among the seven AC algorithms tested, the weighted correlation-based algorithm (WCBA) delivered the highest accuracy of 97%, highlighting the potential of AC methods in ASD prediction. Chowdhury and Iraj [21] examined various ML classifiers, including NB, KNN, LR, gradient boosting machine (GBM), SVM, decision trees (DTs), and multilayer perceptron (MLP), on a dataset containing 10 questions and demographic attributes. Their study found that SVM achieved the highest accuracy of 95%, suggesting its robustness for ASD prediction.
In 2021, Musa et al. [22] focused on using data mining techniques for predicting ASD in infants and children, leveraging the AQ-10 dataset that includes 10 questions, test scores, and gender variables. By selecting 12 significant features through correlation analysis, they applied supervised learning algorithms such as RF, NB, DTs, and SVM. Remarkably, all algorithms tested achieved perfect accuracy (100%), demonstrating the effectiveness of their feature selection and classification approach. Garg et al. [23] introduced an explainable deep learning framework for early ASD prediction. Combining deep learning with XAI techniques, they used a four-layer neural network (NN) trained on a dataset of 1758 infants and children. Their model achieved up to 98% accuracy, with precision, recall, and F1-score of 0.99, 0.97, and 0.98, respectively. By utilizing SHAP for feature importance analysis, they identified seven key features that accounted for 79% of the prediction accuracy, enhancing interpretability for medical professionals.
Albahri et al. [24] developed an automated prediction model to diagnose ASD in children, using a dataset featuring 10 variables, including parental age and birth-related factors. Their approach involved the use of ML models such as adaptive boosting (AdaBoost), NNs, KNNs, and DTs, achieving high accuracy rates from 97.86% to 99.95%. AdaBoost, in particular, demonstrated the highest performance across multiple evaluation metrics. In addition, their correlation sensitivity analysis revealed significant links between parental age and ASD susceptibility. Abdelwahab et al. [25] focused on improving ASD prediction in children by applying various ML techniques, including SVMs, RF, NB, LR, KNNs, and DTs. Using three publicly available nonclinical ASD datasets from Kaggle and UCI ML repositories, their study emphasized data preprocessing steps such as noise reduction, missing value imputation, and feature engineering. Among these methods, LR emerged as the most accurate model with an accuracy of 99.75%, demonstrating the effectiveness of their comprehensive approach for early ASD detection.
Recent studies have actively explored deep learning–based approaches to ASD diagnosis. Ding et al. [26] conducted a meta-analysis of 11 deep learning studies on ASD classification, reporting high overall performance with a pooled sensitivity of 0.95, specificity of 0.93, and an area under the curve (AUC) of 0.98. Kasri et al. [27] proposed a hybrid model combining Vision Transformer (ViT) and Vision Mamba based on eye-tracking data, achieving an accuracy of 0.96 and an F1-score of 0.95, thereby enhancing both efficiency and interpretability. Liu et al. [28] developed a deep ensemble model named MADE-for-ASD using resting-state functional magnetic resonance imaging (fMRI) data. They reported 75.2% accuracy on the full Autism Brain Imaging Data Exchange (ABIDE) dataset and up to 96.4% on specific subsets. Serna-Aguilera et al. [29] introduced a deep learning–based video classification model analyzing children’s reactions to sensory stimuli. Despite limited data, the model demonstrated stable generalization performance.
These studies demonstrate high performance by leveraging diverse data types (e.g., images, eye-tracking, fMRI, and video) and advanced architectures such as convolutional neural networks (CNNs), Transformers, and ensemble models. However, they often face limitations in terms of model interpretability, real-world clinical applicability, and accessibility for non-expert users. In contrast, CARE distinguishes itself as a practical and explainable early screening tool, featuring interpretability through CatBoost and SHAP, enhanced accessibility via PyCaret AutoML, and minimal preprocessing requirements. Our study addresses several critical limitations observed in previous machine learning–based approaches to ASD diagnosis. Although earlier research has demonstrated high predictive accuracy with models such as SVMs and RFs, these methods are often hindered by notable drawbacks:
• Many models function as black-box systems, lacking interpretability and thereby limiting clinical trust and adoption.
• Most studies are based on relatively small or homogeneous datasets, which constrains the generalizability of their findings to broader, more diverse populations.
• Existing tools frequently require advanced technical expertise for implementation and interpretation, making them inaccessible to non-specialist users, including pediatricians, caregivers, and educators.
• Few models are designed with practical deployment in mind, especially in non-clinical environments where early screening is crucial.
To address these challenges, we introduce the CARE framework, a user-friendly and interpretable solution for ASD detection. CARE incorporates CatBoost to handle complex, high-cardinality categorical features without extensive preprocessing; PyCaret AutoML to streamline model development for users with limited technical backgrounds; and SHAP to provide transparent, interpretable explanations of model predictions. This integration yields a reliable, accessible, and explainable tool for early ASD screening, advancing the real-world applicability of AI-driven healthcare solutions.
Fig. 1 illustrates the structured workflow used in this study, which integrates the CARE framework with TRIPOD-compliant (short for Transparent Reporting of a Multivariable Prediction Model for Individual Prognosis or Diagnosis) methodology. This section is divided into three main parts: data preprocessing (3.1), which addresses missing and imbalanced data; exploratory data analysis (3.2), which examines trends and features of the dataset; and the CARE framework (3.3), which includes model development with CatBoost (3.3.1), AutoML integration with PyCaret (3.3.2), and interpretability with SHAP (3.3.3). This workflow ensures transparency and rigor in the development of predictive models for ASD detection.
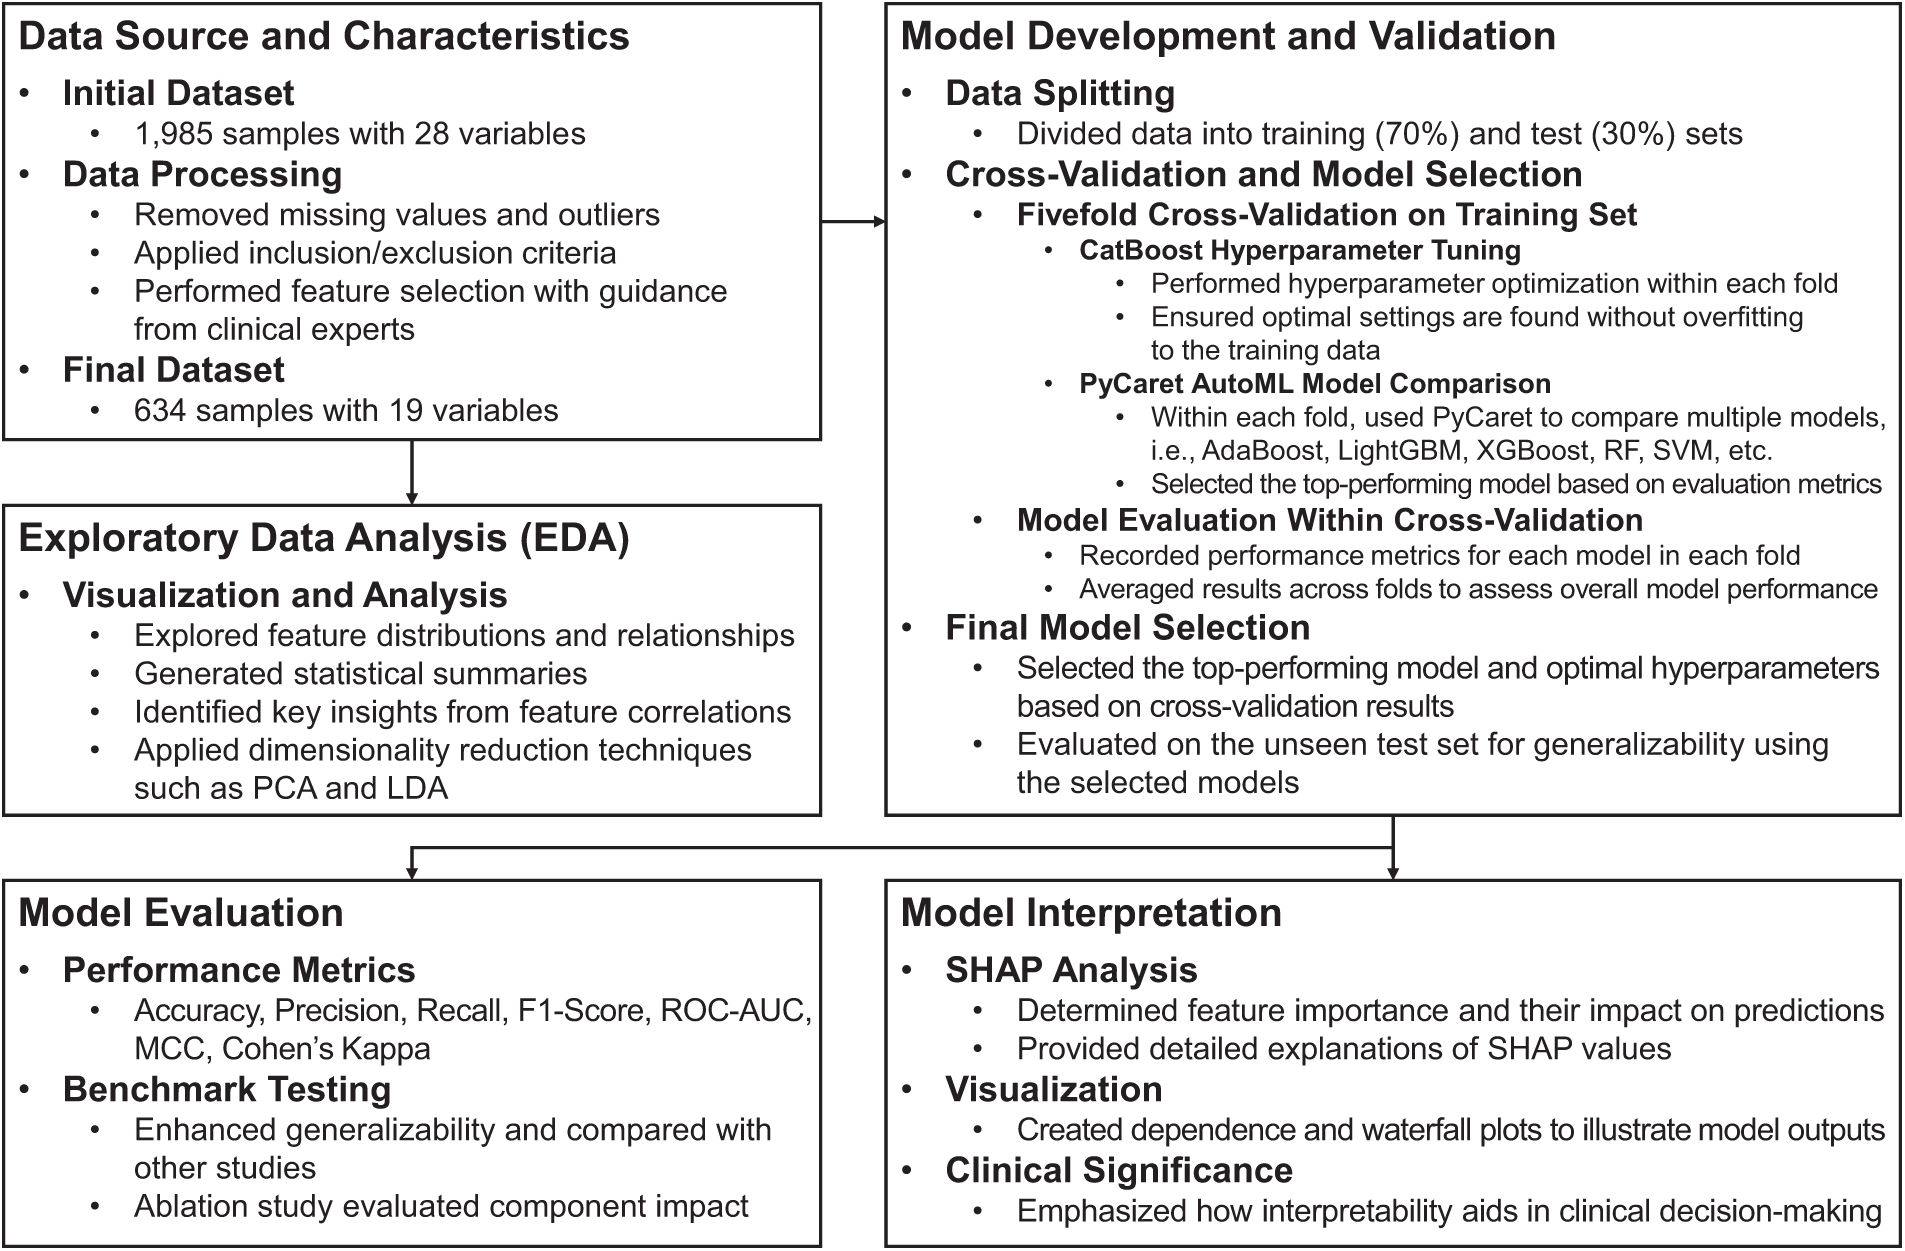
Figure 1: CARE framework integrated with TRIPOD-compliant methodology for ASD prediction
The research utilizes the ASD Children Traits dataset [30], a comprehensive resource encompassing a wide range of characteristics pertaining to children diagnosed with ASD. This dataset includes critical variables such as age, gender, diagnostic criteria, behavioral characteristics, and parental socioeconomic status. Table 2 provides a comprehensive overview of these variables and their attributes.
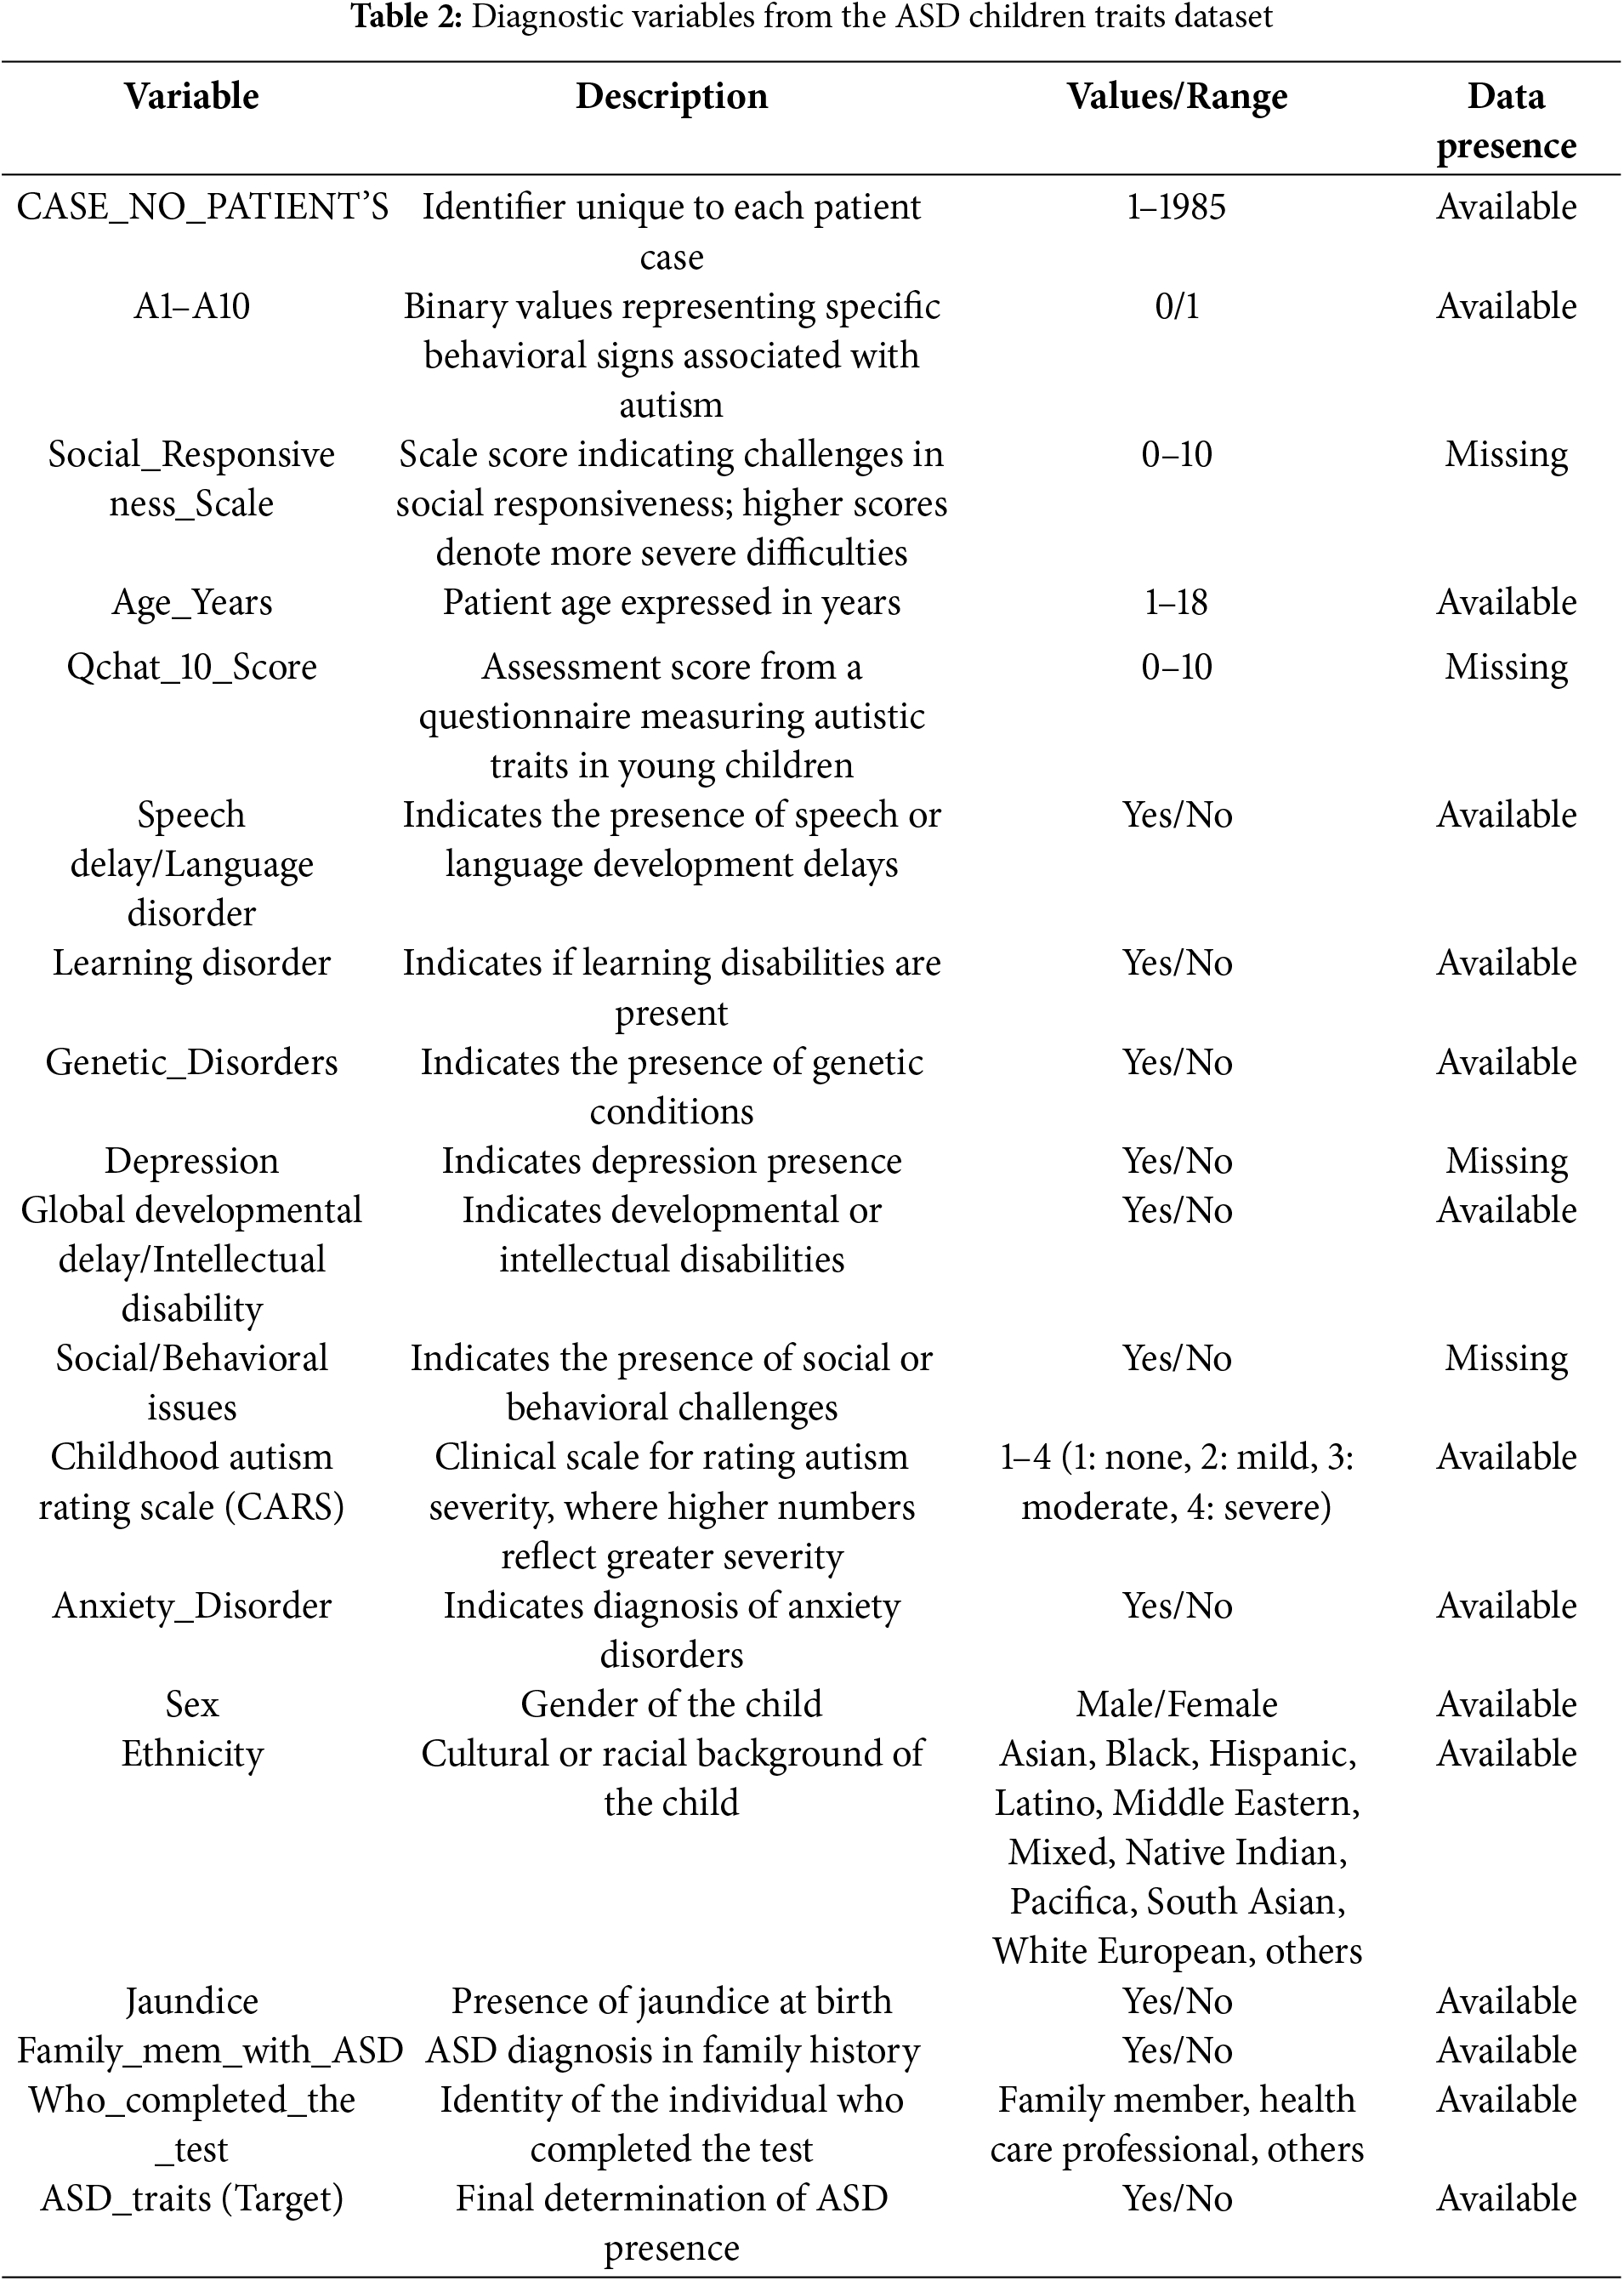
Each of the 1985 unique cases is identified by the label “CASE_NO_PATIENT’S”. The “Social_Responsiveness_Scale” (SRS) is rated from 0 to 10, excluding items not assessed. The “Age_Years” variable accurately covers ages from 1 to 18 years, consistently recorded across all entries. The “Qchat_10_Score” which assesses specific ASD traits, also ranges from 0 to 10, although some values are missing. Binary attributes, such as “Speech Delay/Language Disorder”, “Learning Disorder”, and “Genetic Disorders” are clearly marked as “Yes” or “No”, with no missing data. However, fields like “Depression” and “Social/Behavioral Issues” offer binary responses (i.e., “Yes” or “No”) that have some missing entries. Lastly, “Ethnicity” is categorized into 11 distinct types, all well-represented without missing data.
The overall workflow of data preprocessing steps is illustrated in Fig. 2, which details how the dataset was refined from its initial 1985 samples and 28 variables to the final 634 samples and 19 variables. This workflow highlights the key steps, including missing value and outlier removal, feature selection, and expert-driven refinements, that were essential to improving the quality of the dataset and its suitability for ML analysis.
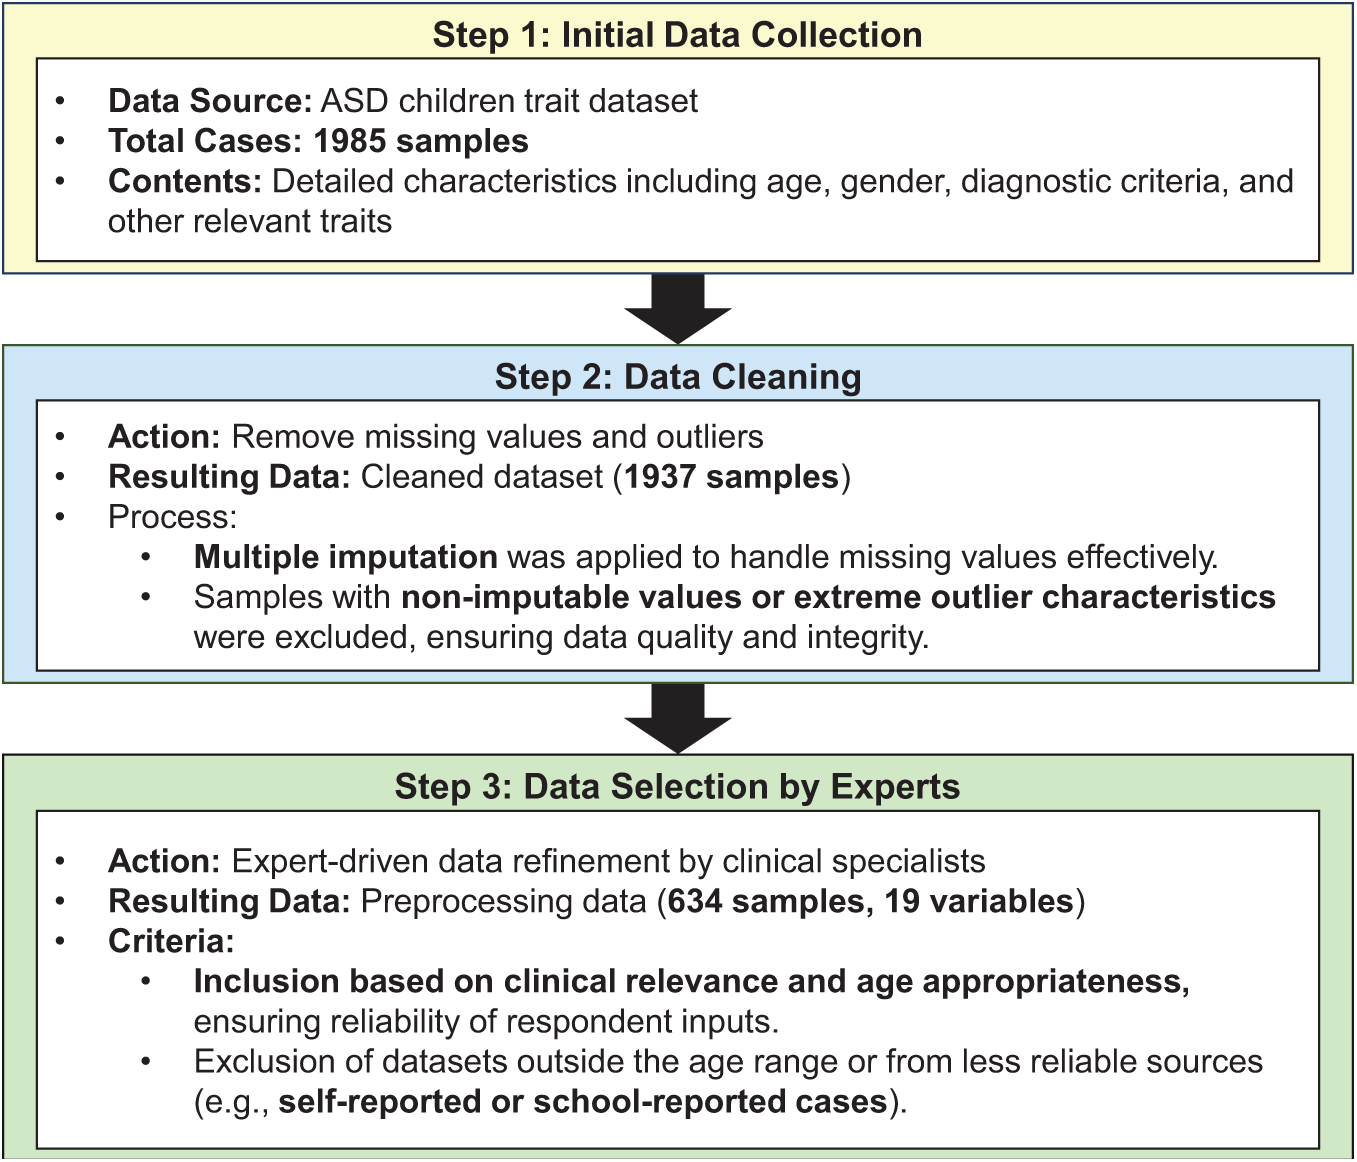
Figure 2: Workflow of data preprocessing for ASD trait analysis
Data preprocessing began with rigorous data cleaning procedures established in our prior work [31], where missing values were handled through a combination of multiple imputation via chained equations (MICE) and expert-driven exclusion criteria. Specifically, imputation was applied when feasible to preserve multivariate integrity, particularly for behavioral and parent-reported items with ~10%–15% missingness. When imputation could compromise validity—such as in incomplete SRS items or age-inappropriate screening tool responses—those cases were excluded in line with clinical recommendations. Outliers were detected using the interquartile range (IQR) method, with any value below Q1 − 1.5 × IQR or above Q3 + 1.5 × IQR was flagged and removed. Additionally, records with implausible or non-discriminative response patterns (e.g., all-zero answers on diagnostic traits) were filtered out to improve model reliability and reduce prediction noise. Feature selection was then performed with guidance from clinical experts, focusing on retaining the most critical variables relevant to ASD diagnosis while eliminating redundant or irrelevant features. This process not only improved analytical precision but also reduced data dimensionality, optimizing the dataset for ML applications.
As part of the study, the dataset underwent comprehensive transformation to ensure its suitability for analyzing ASD-associated traits. Specific transformations were applied to each variable within the dataset to enhance data quality and consistency. The original “Sex” variable, including gender as “F” for female and “M” for male, was transformed into “Gender”, with males encoded as “1” and females as “2” for straightforward numerical analysis. The “Age_Years” variable was retained without modifications, accurately representing the children’s ages for consistency in age-related analyses. The “Ethnicity” variable, initially comprising diverse ethnic descriptors, was recoded into numeric identifiers for modeling standardization, assigning “1” to Asian, “2” to Black, “3” to Hispanic, and “11” to White European. The “Family_mem_with_ASD” variable, originally “Yes” or “No”, was converted into a binary format, with “Yes” coded as “1” and “No” as “2”, thus facilitating familial ASD presence analysis.
The “Who_completed_the_test” variable was simplified and redefined as the “Rater” variable. This reclassification categorizes respondents according to their relationship to the subject or their professional capacity, with family members assigned a value of “1” and healthcare professionals assigned “2”. The “ASD_traits” variable was maintained in a binary format but encoded numerically, with “Yes” encoded as “1” and “No” as “2”, to facilitate analysis. Where present, the “Social Responsiveness Scale (SRS)” scores were preserved, ranging from “1” to “10” to assess social responsiveness severity, providing a measurable index of symptoms. The “Childhood Autism Rating Scale (CARS)” was integrated into the “CARS” variable, consolidating multiple diagnostic metrics into a unified score that classifies autism severity from “Nothing” to “Severe”, thereby standardizing ASD severity assessments. The “Qchat_10_Score” variable was renamed “AQ10” in the cleaned dataset, maintaining a scale from 1 to 10, to standardize diagnostic outcomes across different assessments.
Variables labeled from “A1” to “A10”, reflecting various diagnostic criteria or behavioral observations, were retained and possibly renamed to ensure consistency across datasets, enhancing the analytical utility of the data. These meticulous data transformations not only enhanced the analytical clarity of the study but also aligned the dataset with established data processing standards, ensuring robust and reliable outcomes in our ASD-related analyses. In social science research, ensuring data reliability is crucial as it directly affects the validity and accuracy of the findings. In this study, data reliability was rigorously assessed through statistical validation and expert review during the preprocessing phase. A panel of clinical experts specializing in ASD diagnosis reviewed the dataset to identify any inconsistencies or anomalies that automated methods might miss. Their insights were invaluable in distinguishing behavioral variability and removing erroneous data, thereby enhancing the dataset reliability.
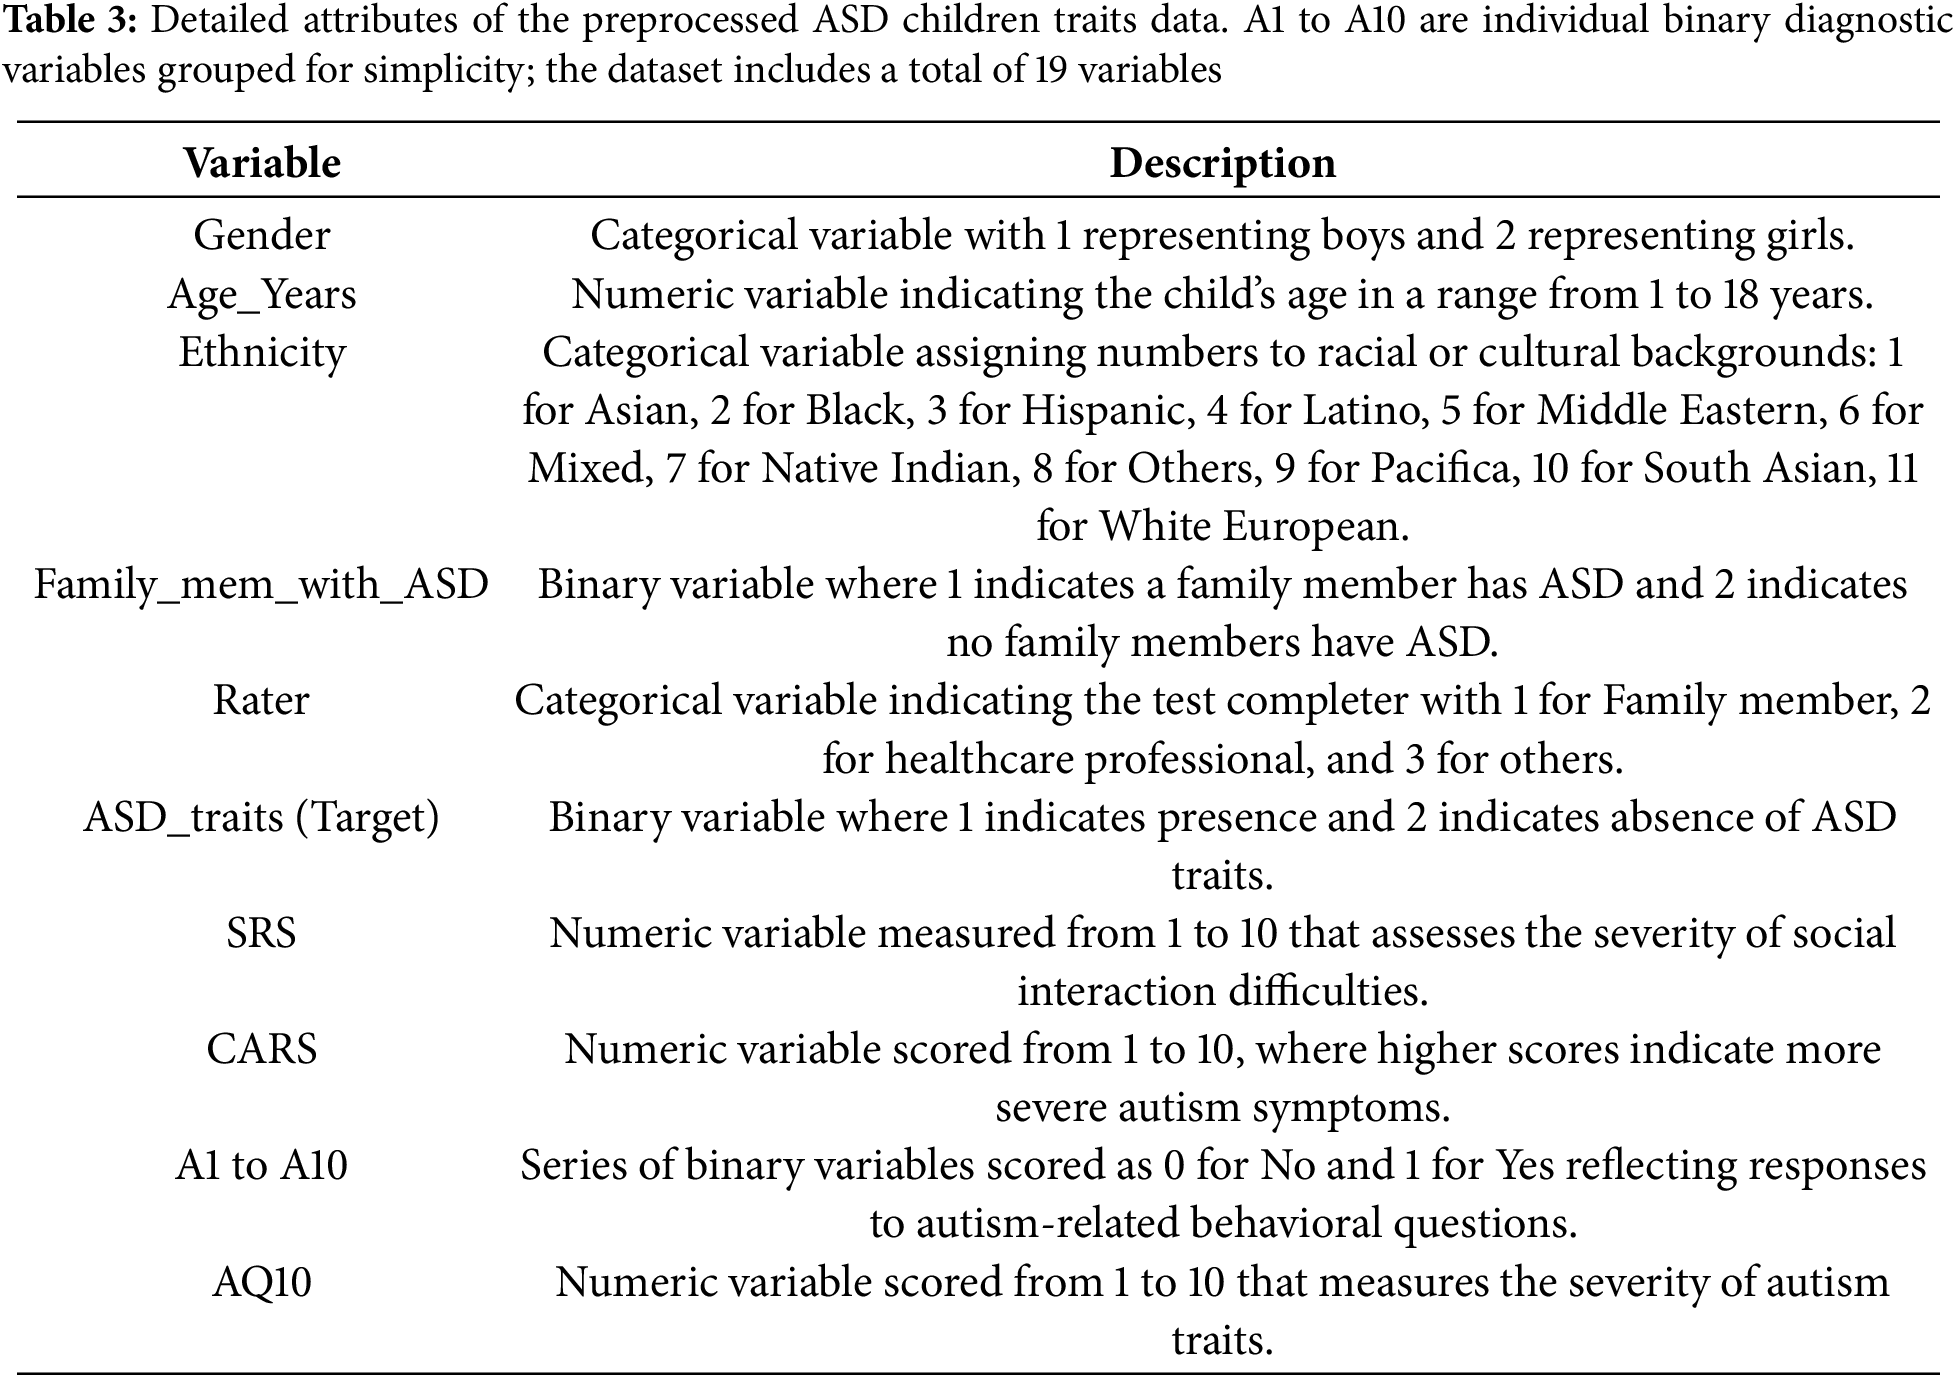
Table 3 complements this workflow by summarizing the final variables used in the analysis. Although 10 variables are explicitly listed in the table for simplicity, the variables “A1 to A10” represent different binary diagnostic criteria, each coded as “1” if applicable and “0” otherwise. These variables are grouped in the table for ease of presentation but are treated individually in the analysis. Together they contribute to the total of 19 variables in the final dataset. This aggregation ensures clarity for the reader while maintaining the full analytical utility of the dataset and consistency with the preprocessing steps described in the methodology.
In the EDA presented in Figs. 3–6, we first examine the distribution of the dependent “ASD_traits” variable in Fig. 3. The pie chart shows that Category 1 (Yes) constitutes 72.9% of the data, while Category 2 (No) accounts for 27.1%. This distribution indicates a clear imbalance in the dataset, with a larger proportion of subjects exhibiting traits corresponding to Category 1.
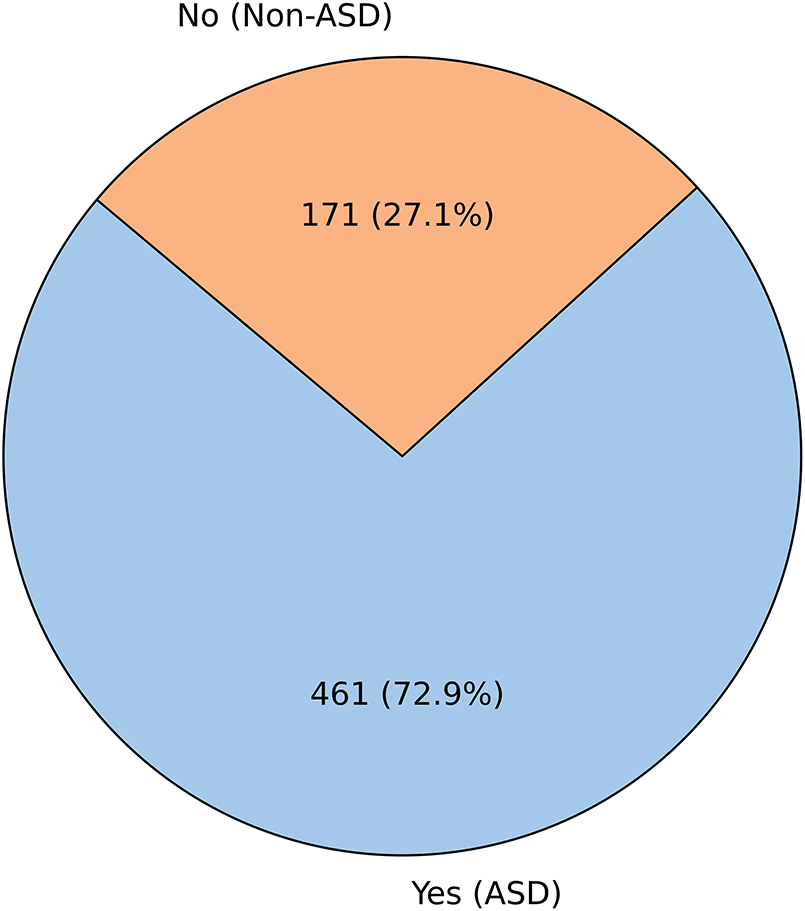
Figure 3: Distribution of the dependent (ASD_traits) variable
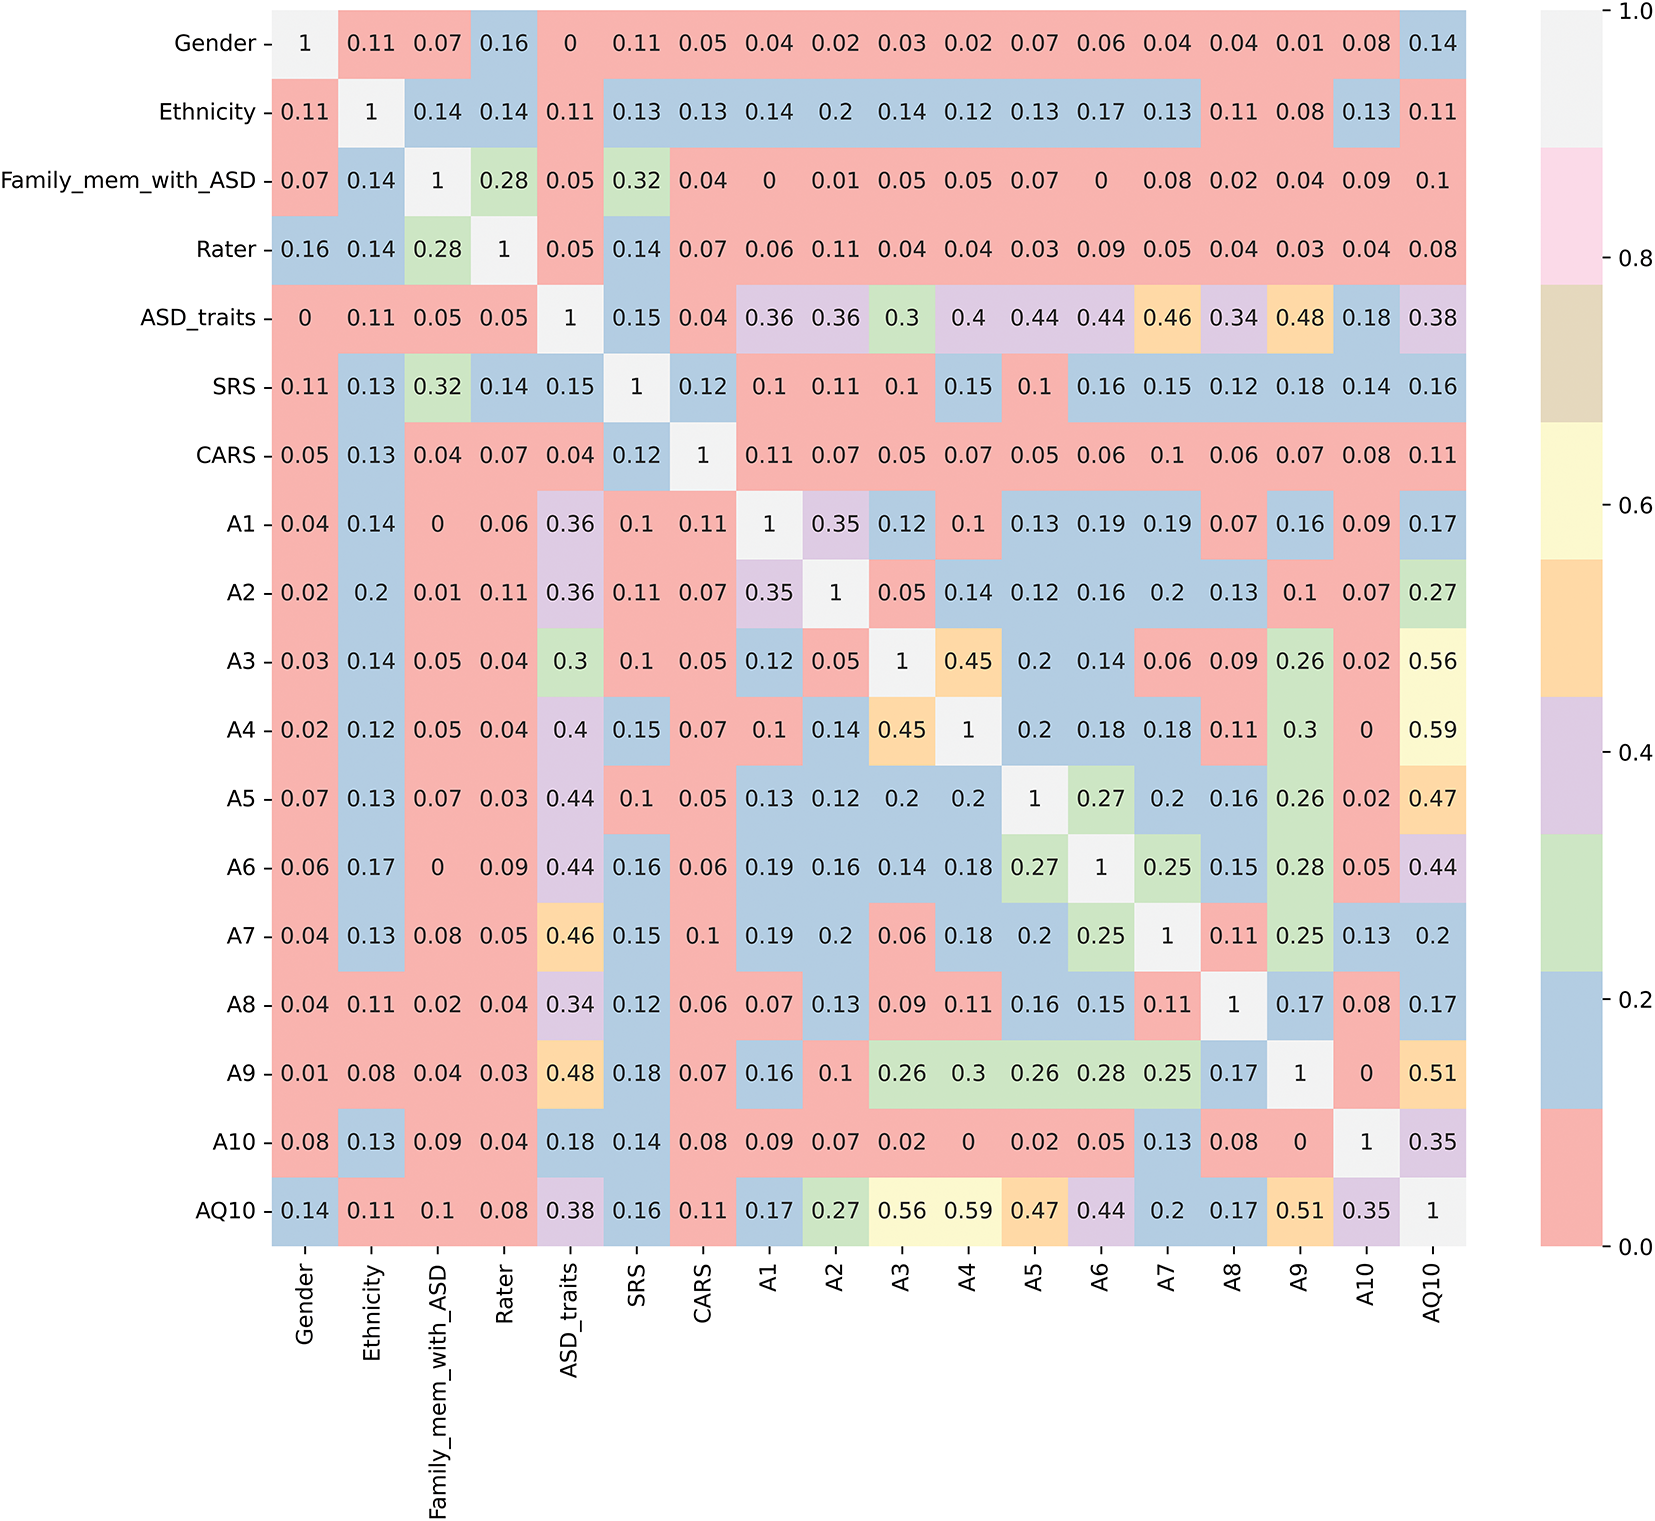
Figure 4: Cramer’s V correlation matrix between dependent and categorical variables
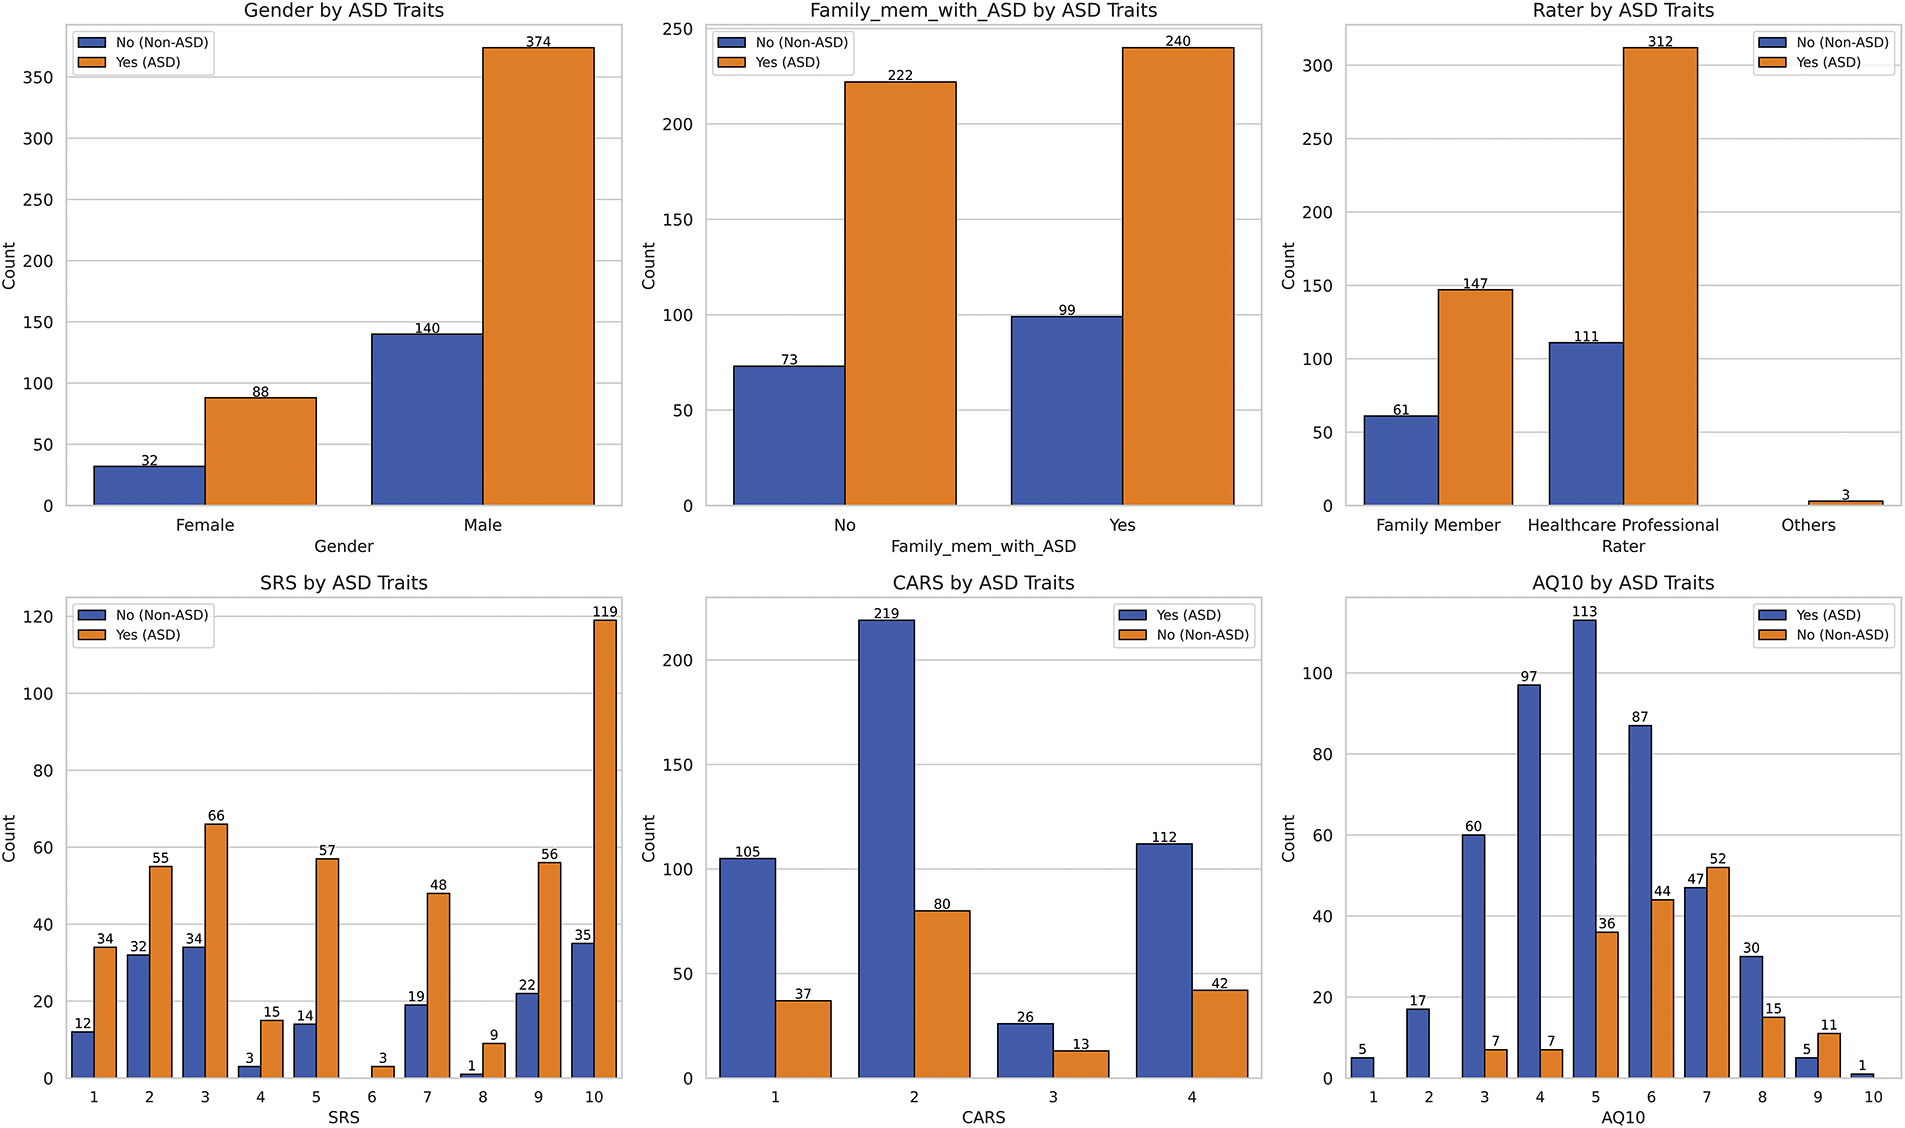
Figure 5: Distribution of the dependent variable across multiple categorical variables
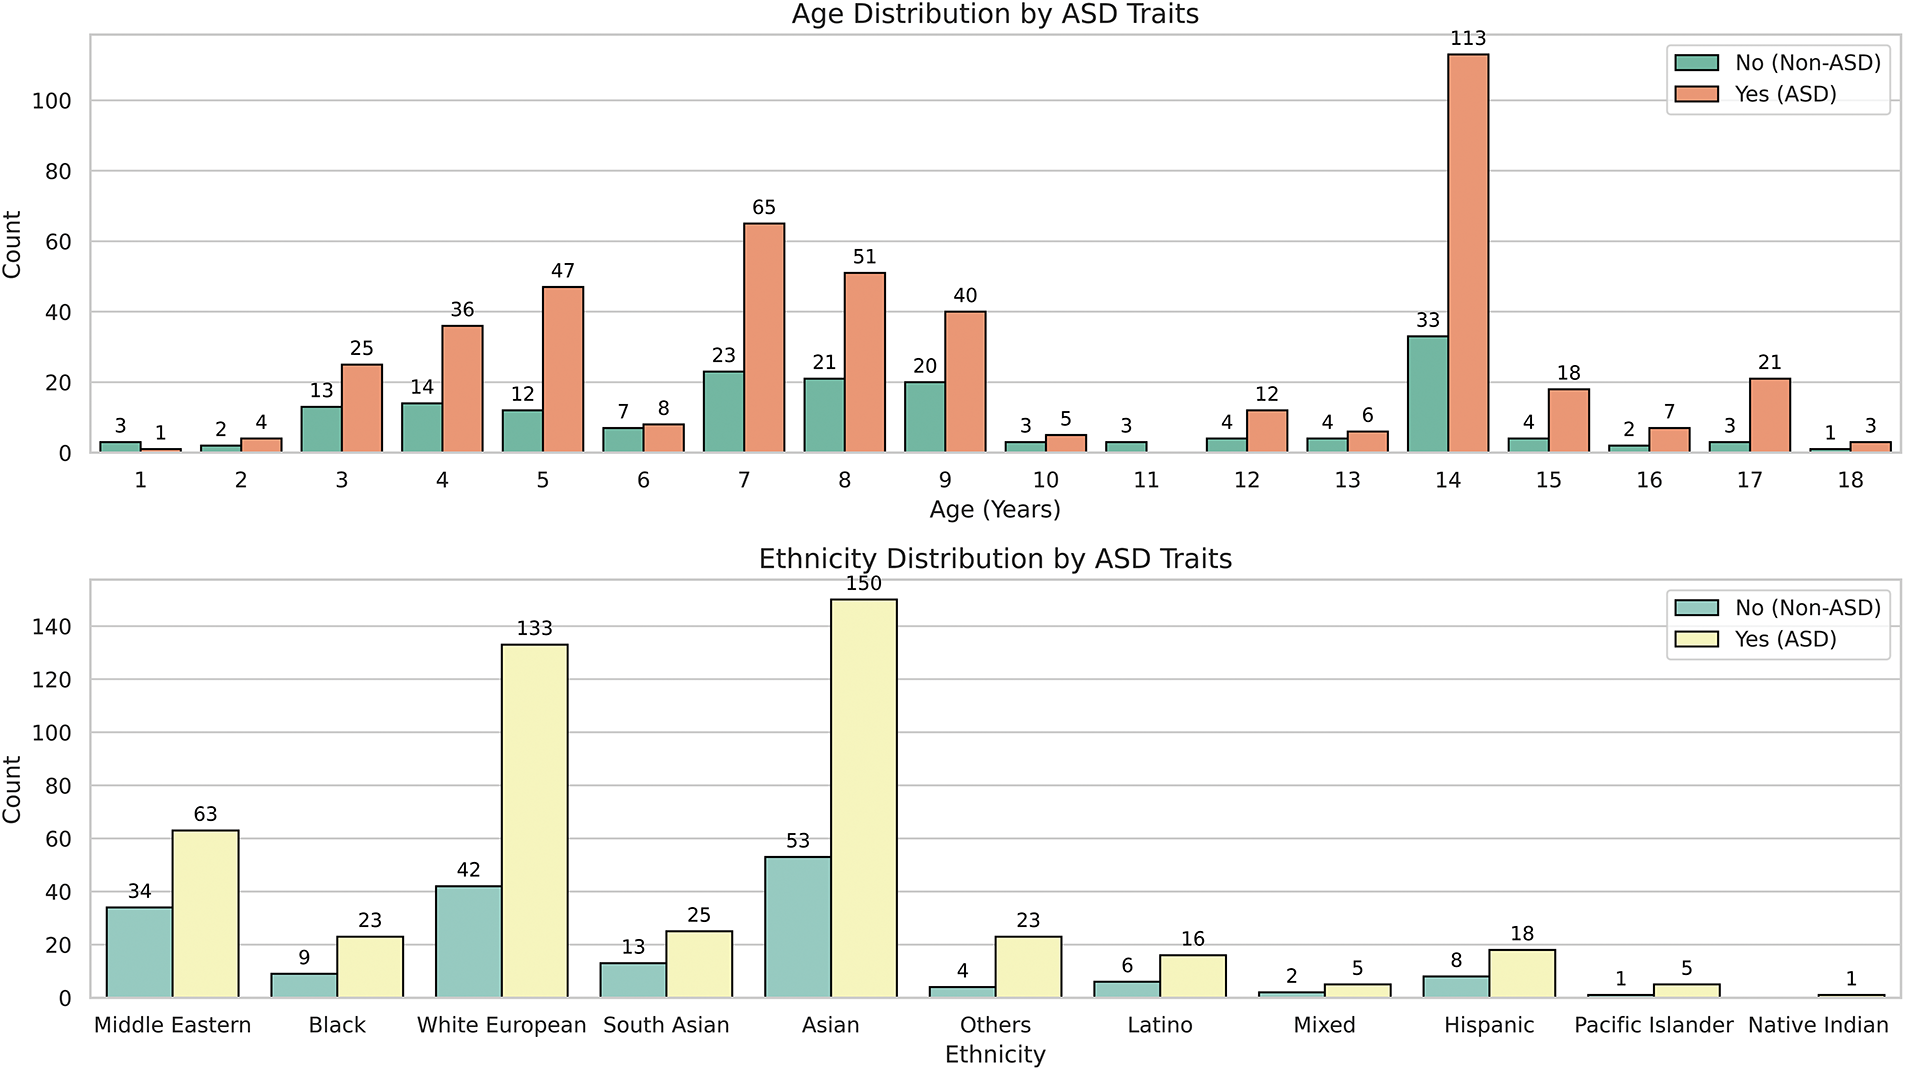
Figure 6: Distribution of the dependent variable across the “Age_Years” and “Ethnicity” variables
We examine the relationships between various categorical variables and the dependent “ASD_traits” variable, using both Cramer’s V correlations and visual distribution plots in Figs. 4–6. Fig. 4 employs Cramer’s V, a robust measure of association for categorical variables, especially when they have multiple categories, as seen in many independent variables of this study [32]. Since “ASD_traits” is a binary categorical variable (1 and 2), Cramer’s V effectively quantifies the strength of association with other categorical variables, providing insights that go beyond simple counts or visual observations.
Fig. 4 illustrates the Cramer’s V correlation matrix, showing the relationships between “ASD_traits” and several independent categorical variables, excluding the numerical “Age_Years” variable. The analysis revealed that certain variables such as “A7”, “A9”, “A5”, and “A6” show relatively higher correlations with “ASD_traits”, while “A10” exhibits a weaker relationship. This suggests that these specific variables may significantly influence or reflect the presence of ASD traits.
Despite “SRS” and “CARS” being tools for assessing autistic traits, they exhibited only weak correlations with “ASD_traits”. This indicates that these instruments might not fully capture the multifaceted and complex nature of ASD, potentially underscoring the need for more comprehensive diagnostic tools that consider a broader range of behavioral and cognitive factors.
In addition, variables such as “Ethnicity” and “Gender” demonstrated negligible associations with “ASD_traits”, suggesting that these demographic factors may have limited direct influence on the presence of ASD traits within the analyzed dataset. These findings are consistent with the understanding that autism is a complex neurodevelopmental condition that is not strongly associated with these demographic indicators.
Fig. 5 provides insight into the distribution of several categorical variables concerning the presence or absence of ASD traits, revealing key patterns related to SRS, family history of ASD, gender distribution, and other autism-related measures.
Starting with the SRS, individuals with ASD traits tend to have higher scores, primarily ranging from three to eight, with a median score of six. A notable number of individuals score around ten, reflecting significant difficulties with social responsiveness. Conversely, individuals without ASD traits show a slightly lower median score of five, emphasizing that challenges in social responsiveness are more prevalent among those with ASD traits.
When examining the CARS, scores range from one to four, with most individuals scoring around two, indicating mild autism traits. Fewer individuals exhibit more severe traits, suggesting mild traits are more common than moderate or severe ones within the dataset. The AQ10 scores, primarily ranging between four and eight, with a median of six, show a relatively normal distribution pattern, indicating that most individuals fall within the typical range autism traits.
Table 4 summarizes the distribution of responses for the behavioral questionnaire items (A1–A10) that capture key characteristics associated with ASD. Each item represents a specific behavioral or diagnostic characteristic that is assessed using a binary response format: “yes” (value = 1) or “no” (value = 2). Response frequencies are presented separately for individuals classified as ASD and non-ASD, providing insight into the patterns that distinguish the two groups.
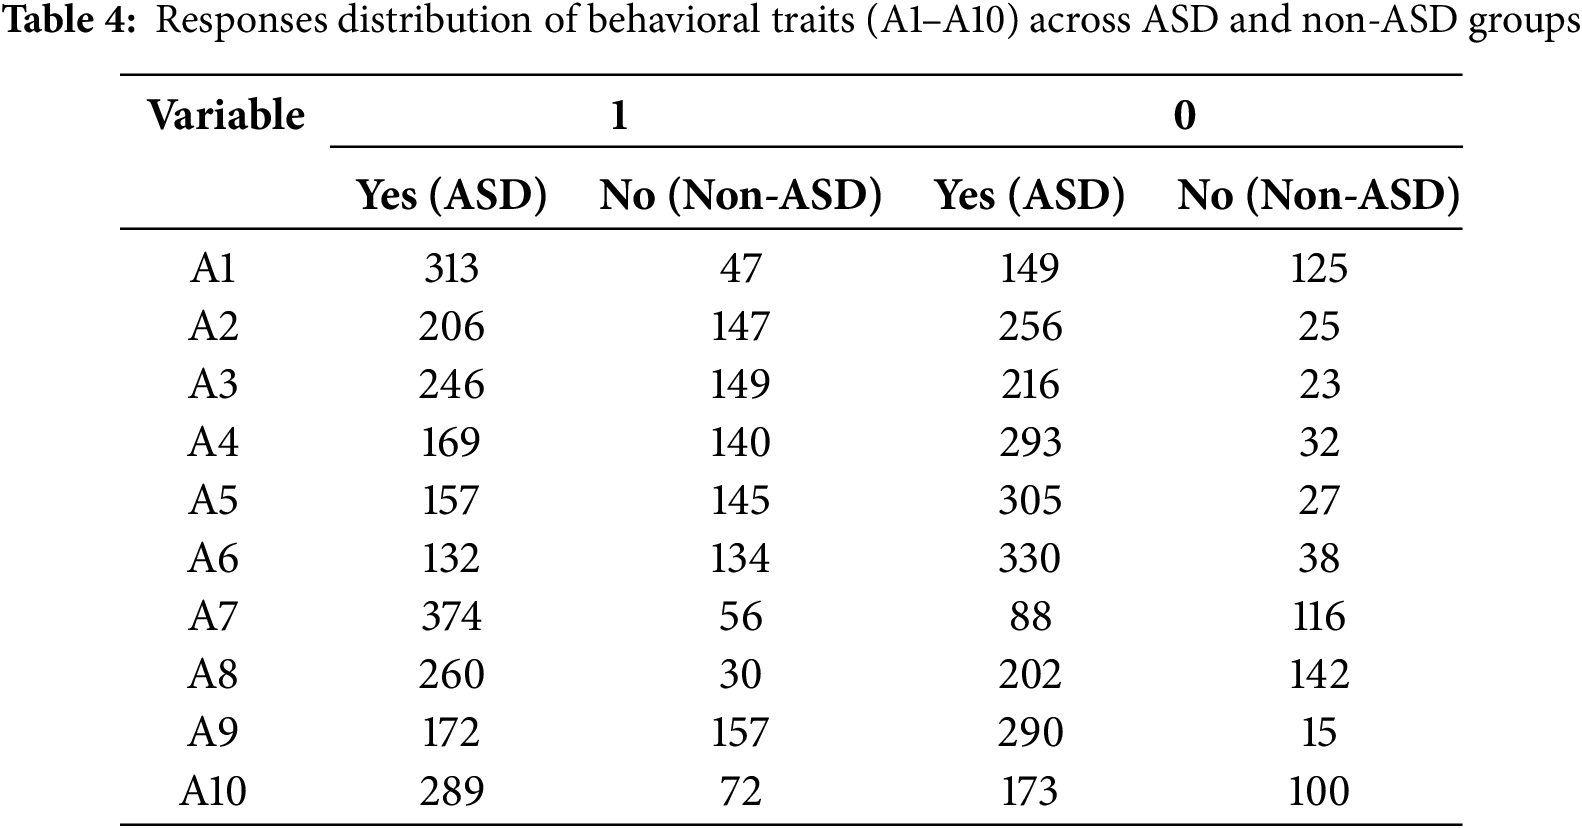
The behavioral items (A1–A10) are designed to measure specific characteristics associated with ASD, such as social interactions, repetitive behaviors, and communication challenges. For example:
• A7 (social interaction): This variable has a significantly higher frequency of “yes” responses in the ASD group (374) compared to the non-ASD group (56), reflecting its strong relevance in distinguishing ASD characteristics.
• A8 (repetitive behaviors): Similarly, A8 shows a high concentration of “yes” responses in the ASD group (260), in contrast to a relatively balanced distribution in the non-ASD group, suggesting its diagnostic importance.
• A6 (communication skills): On the other hand, A6 shows a more balanced distribution of “yes” and “no” responses, suggesting that it may play a complementary role in the classification process.
The analysis of family history of ASD reveals that having a family member with ASD does not significantly distinguish between individuals with and without ASD traits, as both groups show similar distributions. Although genetics is often considered a factor in ASD, these findings imply that family history alone may not be a strong independent predictor of ASD traits in this dataset.
The gender distribution in the dataset reveals a significant imbalance, with males outnumbering females by approximately five to one. This discrepancy likely explains the higher frequency of ASD traits observed among males in the dataset. However, this overrepresentation suggests that the dataset may not fully capture gender differences in the prevalence of ASD traits, warranting cautious interpretation of gender-related conclusions as these may not accurately reflect the true gender distribution of ASD traits.
Finally, the data indicate that SRS and CARS scores are strongly associated with the presence of ASD traits, indicating significant social and behavioral challenges faced by individuals with these traits. However, demographic factors such as gender and ethnicity exhibit different trends, with males and certain ethnic groups being more strongly represented. Despite this, family history of ASD appears to have limited influence on predicting ASD traits in this dataset, highlighting the multifactorial nature of ASD.
In summary, the dataset presents a complex picture of ASD traits, driven by multiple factors, including social responsiveness, autism severity, and demographic characteristics. These findings underscore the need for a multifaceted approach to understanding and treating ASD since the interplay among different variables can vary significantly depending on individual circumstances.
Fig. 6 illustrates the age distribution of individuals with ASD traits, spanning from 1 to 18 years. Notably, ages 7 and 14 show significant spikes in the prevalence of ASD traits, with 113 individuals at age 14 compared to just 33 without, and 65 diagnosed at age 7 compared to 23 without. Meanwhile, the age range between 8 and 13 displays a more balanced distribution although individuals with ASD traits remain more prevalent. This pattern suggests that certain age groups, particularly ages 7 and 14, may be key periods for ASD trait diagnosis or detection. The reduced diagnoses in early childhood (ages 1 to 5) and late adolescence (ages 15 to 18) could indicate lower detection rates or less data available for these age groups.
In terms of ethnicity, as shown in Fig. 6, the dataset comprises Asian (1), Caucasian (11), and Middle Eastern (5) individuals. For example, there are 150 Asians with ASD traits compared to 53 without and 133 Caucasians with ASD traits compared to 42 without, indicating a higher presence of ASD traits within these groups. Conversely, ethnicities such as Mixed Race (6), Native American (7), and Pacific Islander (9) are underrepresented, with few individuals in each category. For example, the Native American group includes only 6 individuals, all showing ASD traits, which complicates reliable conclusions regarding ASD prevalence in this group due to the small sample size. This underscores the need for caution when interpreting ASD prevalence in these groups because the limited data could lead to sample bias.
Fig. 7 shows the results of several dimensionality reduction techniques applied to the input variables: principal component analysis (PCA) [32] and LDA [33]. These techniques help visualize the data in reduced dimensions and provide insights into how well individuals with and without ASD traits can be separated.
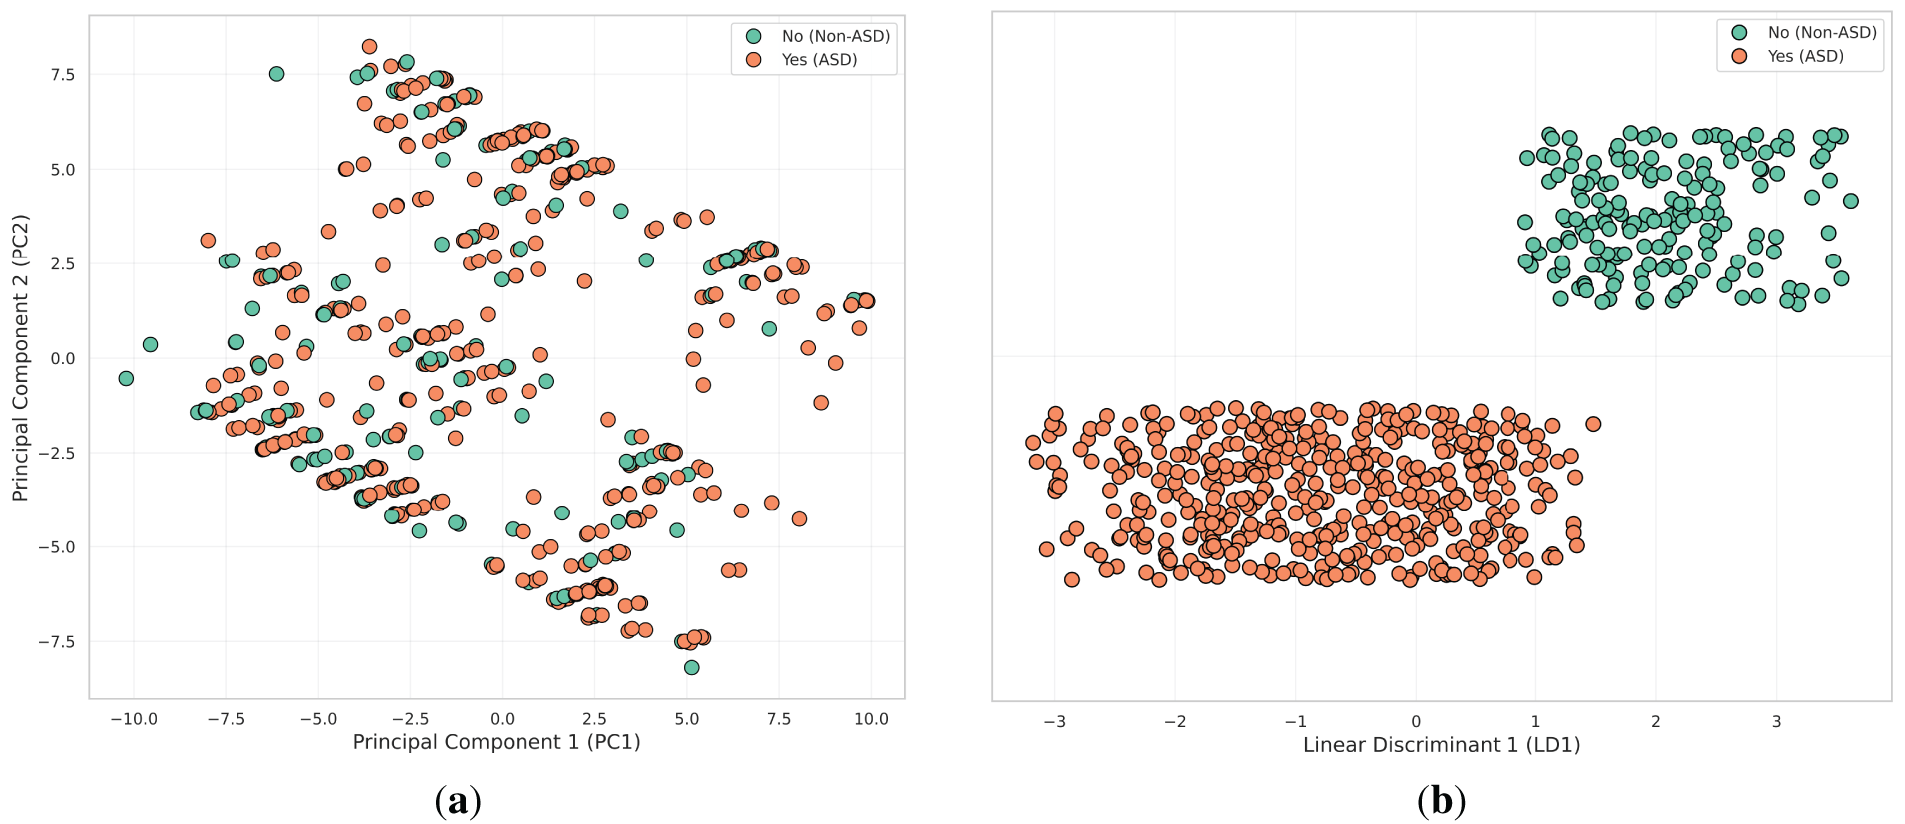
Figure 7: Visualization of dimensionality reduction techniques applied to ASD trait data. (a) PCA; (b) LDA
• PCA plots the data along the first two principal components (PC1 and PC2). However, the variance captured by PCA does not clearly separate individuals with ASD traits (1) and those without (2), as there is a significant overlap. This indicates that PCA’s linear approach may not adequately capture the complex relationships within the data, suggesting a need for more advanced non-linear techniques for better separation.
• LDA produces the strongest separation between the two groups. By creating a clear boundary along the LD1 axis, LDA effectively distinguishes individuals with ASD traits (1) from those without (2). Its focus on maximizing class separability makes LDA the most effective method for distinguishing between the groups, as evidenced by the near-complete separation observed in this plot.
Our methodological approach leverages the strengths of CatBoost, PyCaret, and SHAP to develop, optimize, and interpret classification models for predicting ASD traits. CatBoost excels in handling high-cardinality categorical variables, while PyCaret automates the ML workflow, rendering advanced techniques accessible to non-experts. SHAP provides transparent model interpretations, enhancing trust and enabling informed decision-making. This integrated approach ensures robust model performance, user-friendliness, and interpretability.
3.3.1 Developing Classification Models with CatBoost
We selected CatBoost over traditional models such as RF and SVMs due to its superior ability to handle high-cardinality categorical features, which are prevalent in ASD datasets. These features include family history indicators, behavioral checklist responses, and parental metadata. Unlike SVM, which necessitates extensive preprocessing to convert categorical variables into numerical formats, or Random Forest, which typically relies on one-hot encoding—resulting in increased data dimensionality—CatBoost inherently supports categorical data through advanced encoding techniques and an ordered boosting algorithm. This enables the model to capture complex, non-linear relationships while reducing the risk of overfitting. Moreover, CatBoost’s resilience to missing values and minimal preprocessing requirements make it particularly well-suited for pediatric clinical data, where data completeness and quality often vary.
CatBoost [34], developed by Yandex, is a state-of-the-art gradient boosting algorithm known for its exceptional ability to effectively handle categorical variables, especially those with high cardinality. Unlike traditional ML algorithms, which typically require categorical variables to be transformed into numerical formats through techniques such as one-hot encoding or label encoding [35], CatBoost inherently handles these variables through advanced permutation-based techniques. This approach preserves the order of categorical data and effectively reduces dimensionality, minimizing preprocessing effort and the risk of losing important ordinal relationships [36]. Fig. 8 presents a detailed view of the CatBoost training workflow, focusing on the unique techniques such as handling categorical features with minimal preprocessing, ordered boosting to reduce overfitting, and symmetric tree construction for balanced model training.
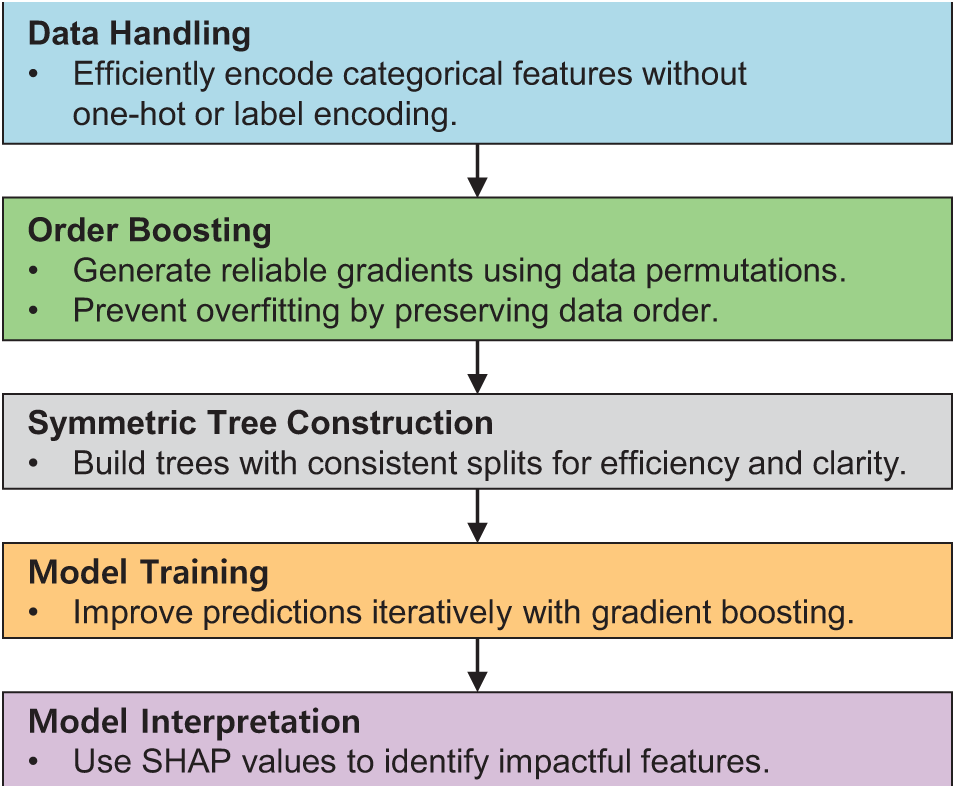
Figure 8: Simplified framework for CatBoost workflow
A key feature of CatBoost is its use of gradient boosting, a sequential approach that iteratively builds models to minimize a given loss function, such as logistic loss for classification tasks. CatBoost extends the traditional gradient boosting framework by introducing two important innovations: ordered boosting and symmetric trees. Ordered boosting helps reduce overfitting by generating unbiased gradient estimates through dataset permutations, and symmetric trees ensure uniform splits across all trees, improving computational efficiency and interpretability [37].
For the classification of ASD traits in this study, our dataset contains multiple categorical variables, such as “Ethnicity” and “Rater”, each with many unique categories. CatBoost excels at handling these high cardinality features without requiring extensive preprocessing. CatBoost’s default hyperparameter settings are typically sufficient to handle such complexity effectively, as noted by its developers [34], simplifying the model-building process and making advanced ML techniques accessible to non-expert users.
The main advantages of using CatBoost in our study are:
• Efficient handling of high cardinality categorical variables, reducing preprocessing requirements while preserving meaningful ordinal relationships.
• Mitigation of overfitting through the combination of ordered boosting and symmetric trees, leading to improved generalization.
• Faster training times, especially when using graphical processing units (GPUs) for large datasets, thus improve time efficiency.
• Improved interpretability through a built-in ability to compute feature importance metrics and SHAP values, increasing the transparency of model decisions.
By following the guidelines provided by the developers of CatBoost, we demonstrate that ML models can be both user-friendly and technically sound, making them accessible to people with limited ML expertise.
3.3.2 Applying AutoML with PyCaret
AutoML [38] automates the ML workflow, enabling individuals without specialized expertise to construct effective classification models with minimal effort. By automating tasks such as model selection, hyperparameter tuning, and performance evaluation, AutoML significantly reduces the time and effort required for model development. PyCaret [39,40], a Python-based AutoML library, exemplifies this automation by allowing users to apply and compare various ML algorithms using just a few lines of code.
The PyCaret workflow covers everything from data preprocessing to model training, evaluation, and comparison [40]. During setup, the setup function configures the dataset, specifies the target variable, and sets the experimental parameters. This function includes automatic options for detecting automatic data types, imputing missing values, detecting outliers, and scaling data, all of which are critical to preparing data for modeling. Properly configuring these options is essential as they significantly affect model performance and reliability.
The compare_models function simplifies model comparison by automatically evaluating the performance of different classification algorithms and ranking them based on predefined performance metrics such as accuracy, precision, recall, F1-score, and receiver operating characteristic area under the curve (ROC-AUC). PyCaret supports a wide range of algorithms, including LR, DTs, RFs, and extreme gradient boosting (XGBoost). By evaluating multiple models simultaneously, PyCaret helps identify the most appropriate model for a given classification challenge.
Once a model is selected, the tune_model function performs automated hyperparameter optimization. It uses techniques such as grid search (GS) or random search to explore different hyperparameter configurations to find the optimal combination that maximizes classification performance, effectively seeking the best-tuned model defined by the chosen performance. This process incorporates k-fold cross-validation to improve the model generalizability by providing a reliable estimate of its performance across different data subsets.
The predict_model function generates predictions on a validation dataset, allowing the model performance to be evaluated using classification metrics such as accuracy, precision, recall, F1-score, and ROC-AUC. This comprehensive evaluation ensures that the selected model excels not only on the training data but also generalizes effectively to new, unseen data.
PyCaret is particularly useful in healthcare and therapy owing to its several key advantages:
• Its user-friendly interface simplifies complex ML tasks with intuitive features, allowing non-experts to build and deploy models with minimal coding.
• The platform supports a wide range of classification algorithms, ensuring flexibility in model selection.
• Automated hyperparameter tuning optimizes model performance, reducing the need for manual adjustments.
• PyCaret uses multiple classification metrics to deliver a detailed understanding of model performance.
• Seamless integration with visualization tools facilitates the generation of visual insights that aid in model interpretation and validation.
By leveraging PyCaret, we are democratizing access to sophisticated ML techniques and empowering clinicians and occupational therapists to effectively use data-driven insights.
3.3.3 Interpreting Classification Models with SHAP
Understanding how ML models make decisions is crucial for building trust and enabling informed decision-making, especially in clinical settings. To achieve this, we used SHAP [41,42], a model-agnostic interpretation technique based on cooperative game theory, to elucidate the role of each feature in the model predictions.
SHAP assigns a Shapley value to each feature, quantifying its contribution to the prediction and ensuring that the prediction is fairly distributed among all features. For any given instance and model, SHAP values are calculated by examining all possible combinations of feature subsets and assessing the impact of including each feature. This method is rooted in the Shapley concept from game theory, which ensures that each feature’s contribution is fairly valued across all possible feature contributions [43]. This is critical to maintaining local accuracy, where the sum of the SHAP values for all features equals the difference between the actual prediction and the base value (average model output).
In classification tasks, SHAP values provide insights into how each trait influences the likelihood of a particular class. For example, when predicting ASD traits, SHAP can elucidate how traits such as “SRS” or “Ethnicity” affect the likelihood of an individual exhibiting ASD traits. Implementing SHAP provides several key benefits:
• Increased transparency is an additional benefit of SHAP, providing transparent, quantifiable insights into how each feature affects predictions, enabling a deeper understanding of the model’s decision process.
• Ranking of feature importance identifies the most influential factors in predicting ASD traits, aiding in feature selection and guiding data collection strategies.
• SHAP reveals the most complex interactions among traits, uncovering relationships that traditional measures might miss.
• Building trust and validation is a fundamental component of any scientific endeavor; the model promotes understanding and confidence in its predictions among clinicians and non-experts, enabling data-driven decision-making in clinical settings.
• Key considerations when implementing SHAP include:
• Ensuring that the ML model used, such as CatBoost, is compatible with SHAP as tree-based models efficiently calculate SHAP values.
• Considering computational requirements is critical, as SHAP calculations can be intensive for large datasets. Using approximation techniques or sampling methods can improve efficiency without significantly compromising accuracy.
• Choosing appropriate visualization tools is critical to effectively represent feature contributions to the target variable. Visual representations should be accessible to non-experts to aid in interpreting model behavior.
• Establishing appropriate SHAP value thresholds is critical in classification tasks to balance sensitivity and specificity, especially in clinical diagnostics.
By carefully integrating SHAP into our ASD feature classification pipeline, we achieve not only high predictive performance but also ensure that the model decisions are interpretable and actionable. This dual focus on accuracy and transparency is critical to fostering trust and encouraging the adoption of ML tools in clinical practice.
4.1 Experimental Setup and Evaluation Metrics
Effective evaluation of ML models begins with a carefully designed methodology that ensures both robust optimization and fair assessment of performance. In this study, we divided our dataset into a training set (443 samples) and a test set (191 samples) using a 70:30 split. During this division, stratified sampling was used to preserve the original class distribution and to ensure that the test set remained representative of the entire dataset. This step is critical to provide an independent test bed to validate the generalizability of the models, addressing the critical need for external validation in predictive modeling.
Within the training set, we implemented fivefold cross-validation to optimize the hyperparameters for CatBoost and identify the best-performing model in PyCaret. This approach, applied only to the training data, partitions the set into five folds to iteratively train and validate the model. By isolating the test set from the cross-validation process, we eliminate the risk of data leakage and ensure that the final score on the test set remains unbiased. This methodology balances robust model tuning with reliable performance evaluation, making it well suited for our dataset.
To optimize the CatBoost model, we performed a focused grid search on its key hyperparameters: learning rate (η), depth (d), and L2 regularization (λ). Learning rate controls the step size during optimization, depth defines the maximum tree depth, which affects model flexibility, and L2 regularization mitigates overfitting by penalizing large coefficients. The grid contained a range of values—learning rate (0.03 and 0.1), depth (4, 6, and 10), and L2 regularization (1, 3, 5, 7, and 9)—that allowed the model to effectively adapt to the dataset while maintaining robust classification performance [44].
We also used PyCaret’s AutoML framework to systematically evaluate a diverse set of classification algorithms. Specifically, we focused on the 15 classifiers supported by PyCaret, excluding those incompatible with “Turbo” mode to ensure efficient and scalable evaluation. This approach allowed us to balance computational efficiency with a comprehensive exploration of algorithmic performance. The algorithms evaluated include:
• Traditional classifiers: Logistic regression (lr), k-neighbors classifier (knn), naive bayes (nb), decision tree classifier (dt), ridge classifier (ridge), and dummy classifier (dummy), which provide interpretable and robust baselines.
• Ensemble-based methods: Random forest (rf), adaboost (ada), gradient boosting (gbc), and extra trees classifier (et), which are known for their ability to generalize well across datasets by combining predictions from multiple trees.
• Advanced gradient boosting techniques: Extreme gradient boosting (xgboost) and light gradient boosting machine (lightgbm), which represent state-of-the-art implementations of gradient boosting, optimized for efficiency and scalability.
• Kernel-based methods: support vector machine with a linear kernel (svm), which is effective for high-dimensional datasets with a linear decision boundary.
• Linear discriminant analysis models: Linear discriminant analysis (lda) and quadratic discriminant analysis (qda), which provide probabilistic and geometric approaches to classification.
To comprehensively evaluate the performance of the classification models, we used several standard evaluation metrics, including accuracy, precision, recall, F1-score, and ROC-AUC. These metrics provide a detailed understanding of the model’s performance in terms of correctly classifying instances, balancing precision and recall, and measuring the model’s ability to discriminate between classes across all classification thresholds. These metrics, widely used in ML, provide a comprehensive understanding of model performance and form the basis of our evaluation framework.
In addition, we included the Matthews correlation coefficient (MCC) and Cohen’s Kappa to address class imbalance. The MCC assesses classification quality by considering all elements of the confusion matrix, with scores ranging from −1 (complete disagreement) to +1 (perfect prediction). Cohen’s Kappa measures agreement beyond chance, accounting for unbalanced class distributions. Both metrics provide deeper insight into model performance and complement traditional metrics in imbalanced dataset scenarios.
4.2 Ablation Study: Impact of Feature Subsets on Model Performance
This section evaluates the performance of different classification algorithms and examines how specific subsets of features influence model performance through a structured ablation study. We designed six different cases, ranging from minimal to full feature sets, as summarized in Table 5. Each case examines a unique combination of features to provide insight into their contribution to the detection of ASD features.
To ensure robust evaluation, the StratifiedKFold method from the sklearn.model_selection library was used for fivefold cross-validation, with data shuffling and a fixed random seed (random_state = 42) to improve reproducibility and mitigate order bias [45]. Cross-validation was applied only to the training set to avoid data leakage and to ensure an unbiased evaluation on the test set.
For each case, we evaluated model performance using two methods:
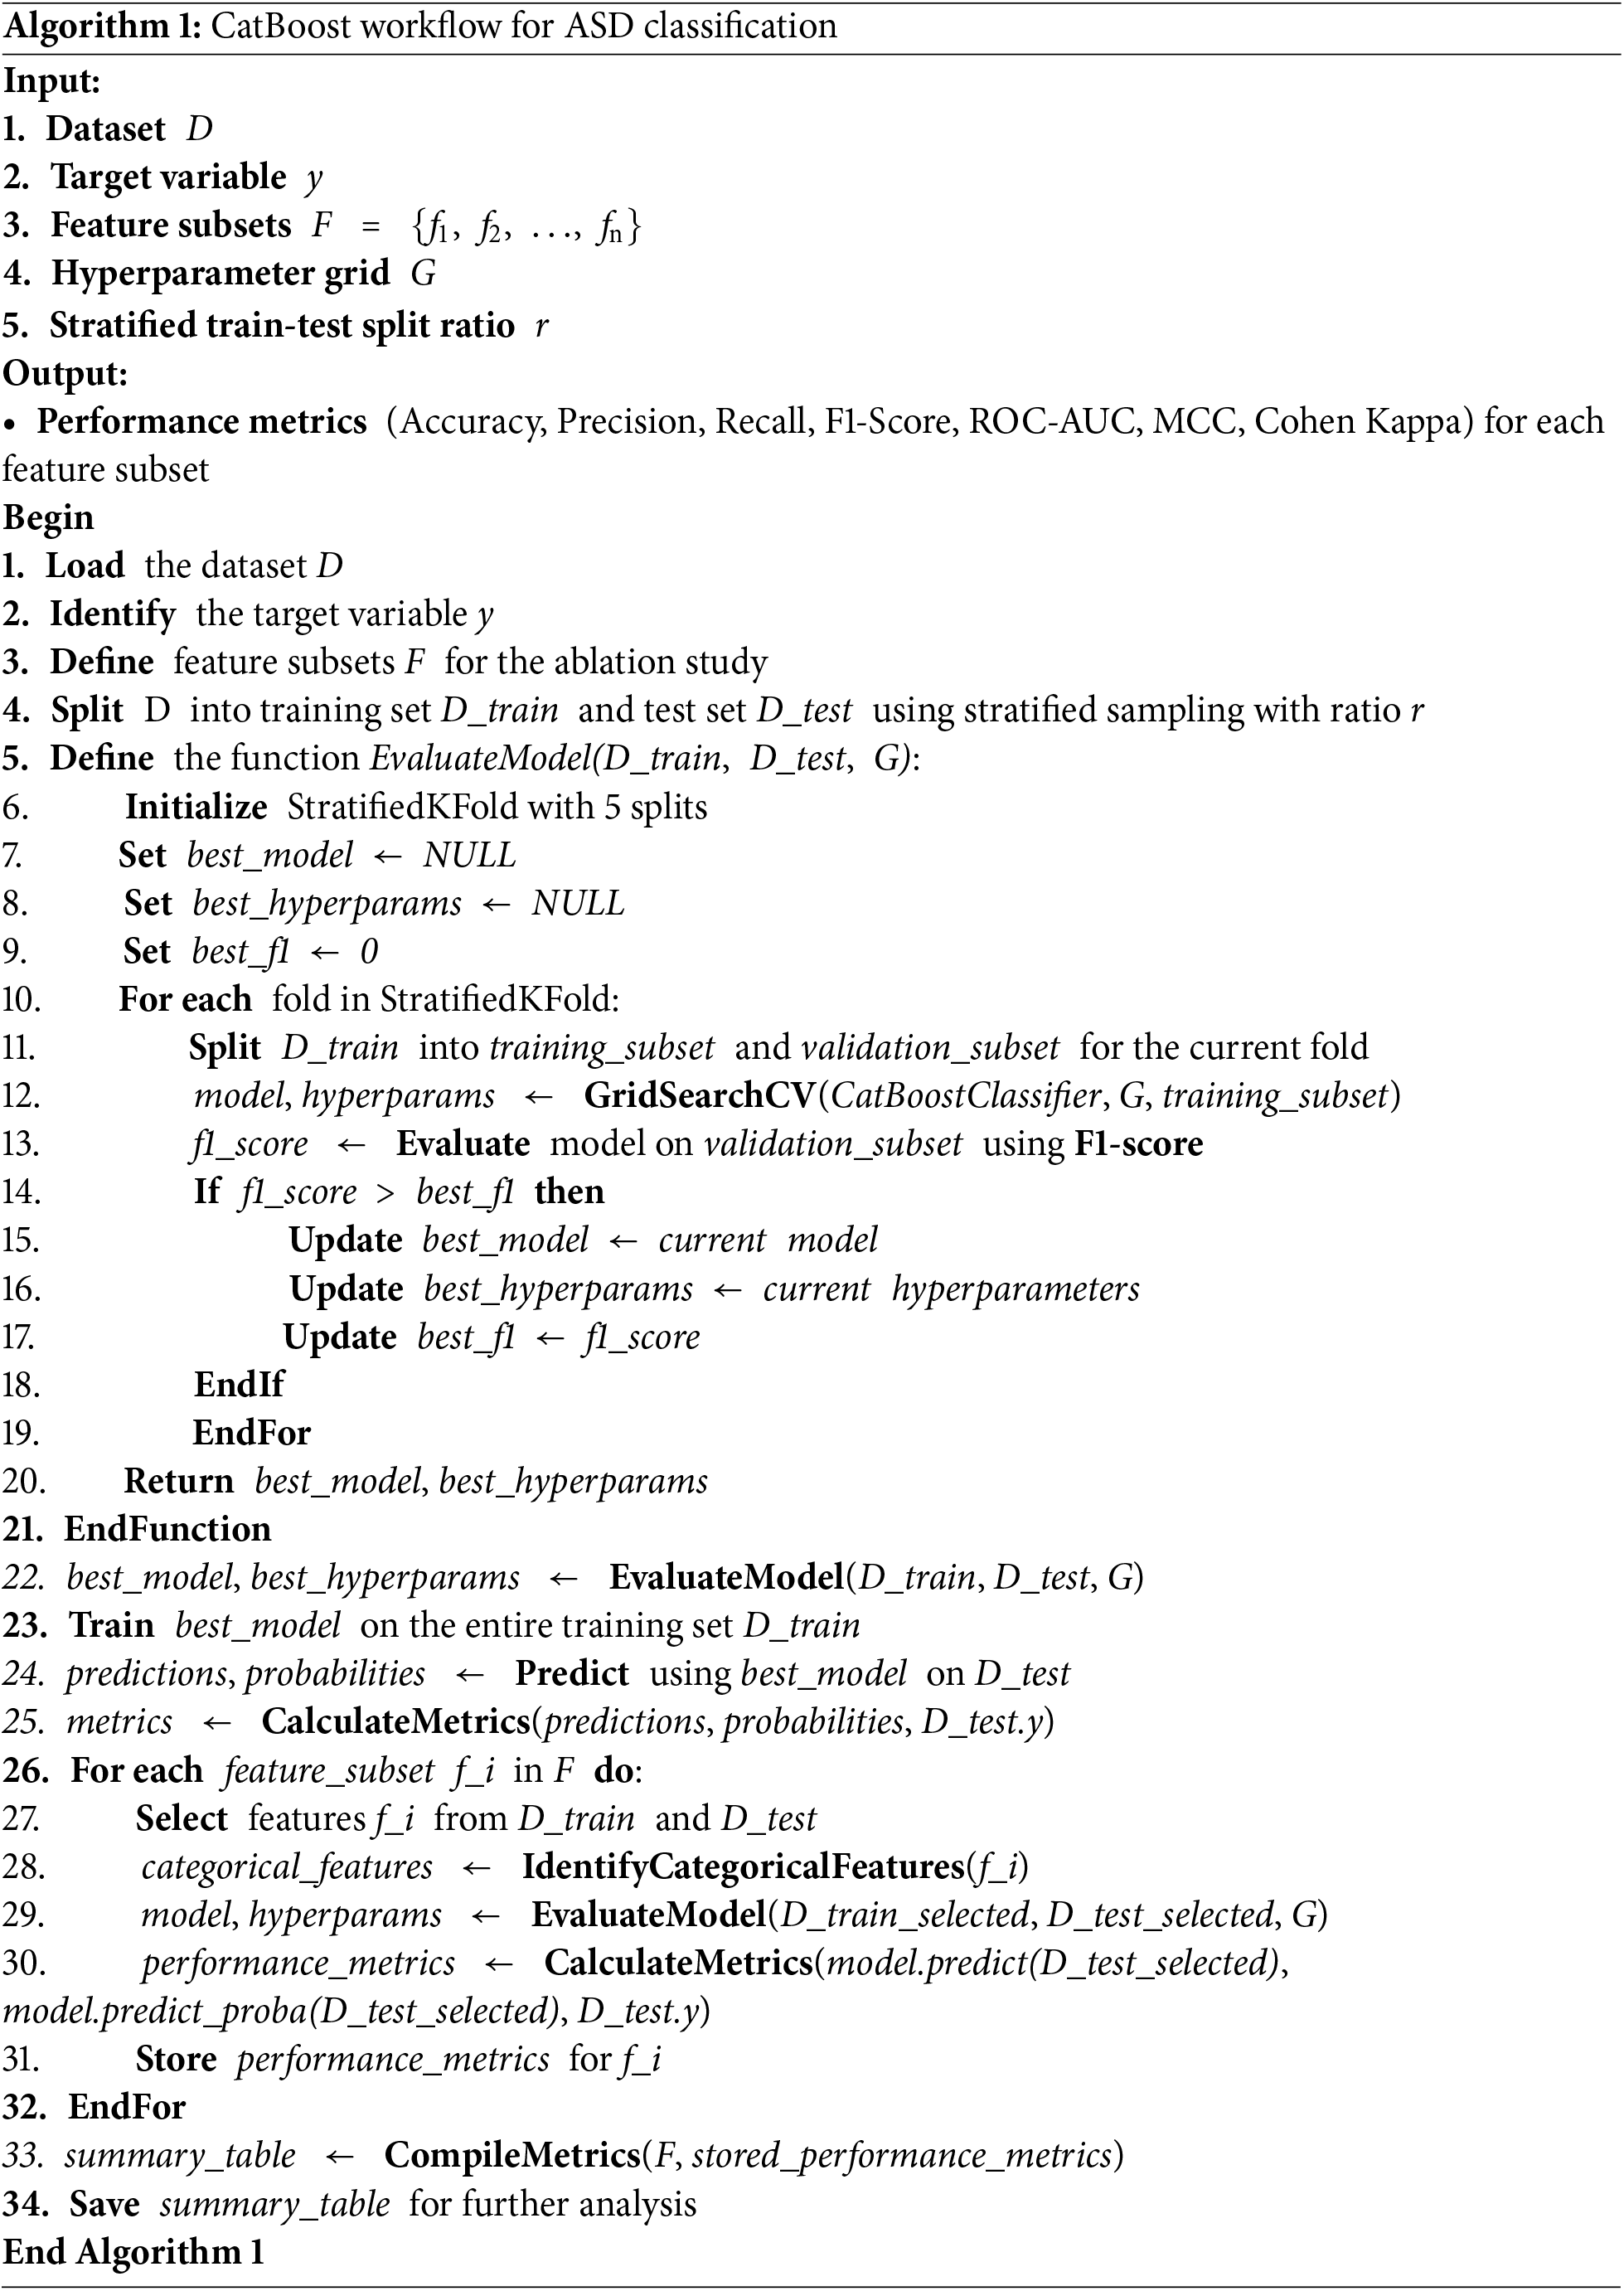
• CatBoost: Hyperparameter optimization was performed using grid search to identify the best configuration for detecting ASD features (refer to Algorithm 1 for the detailed workflow).
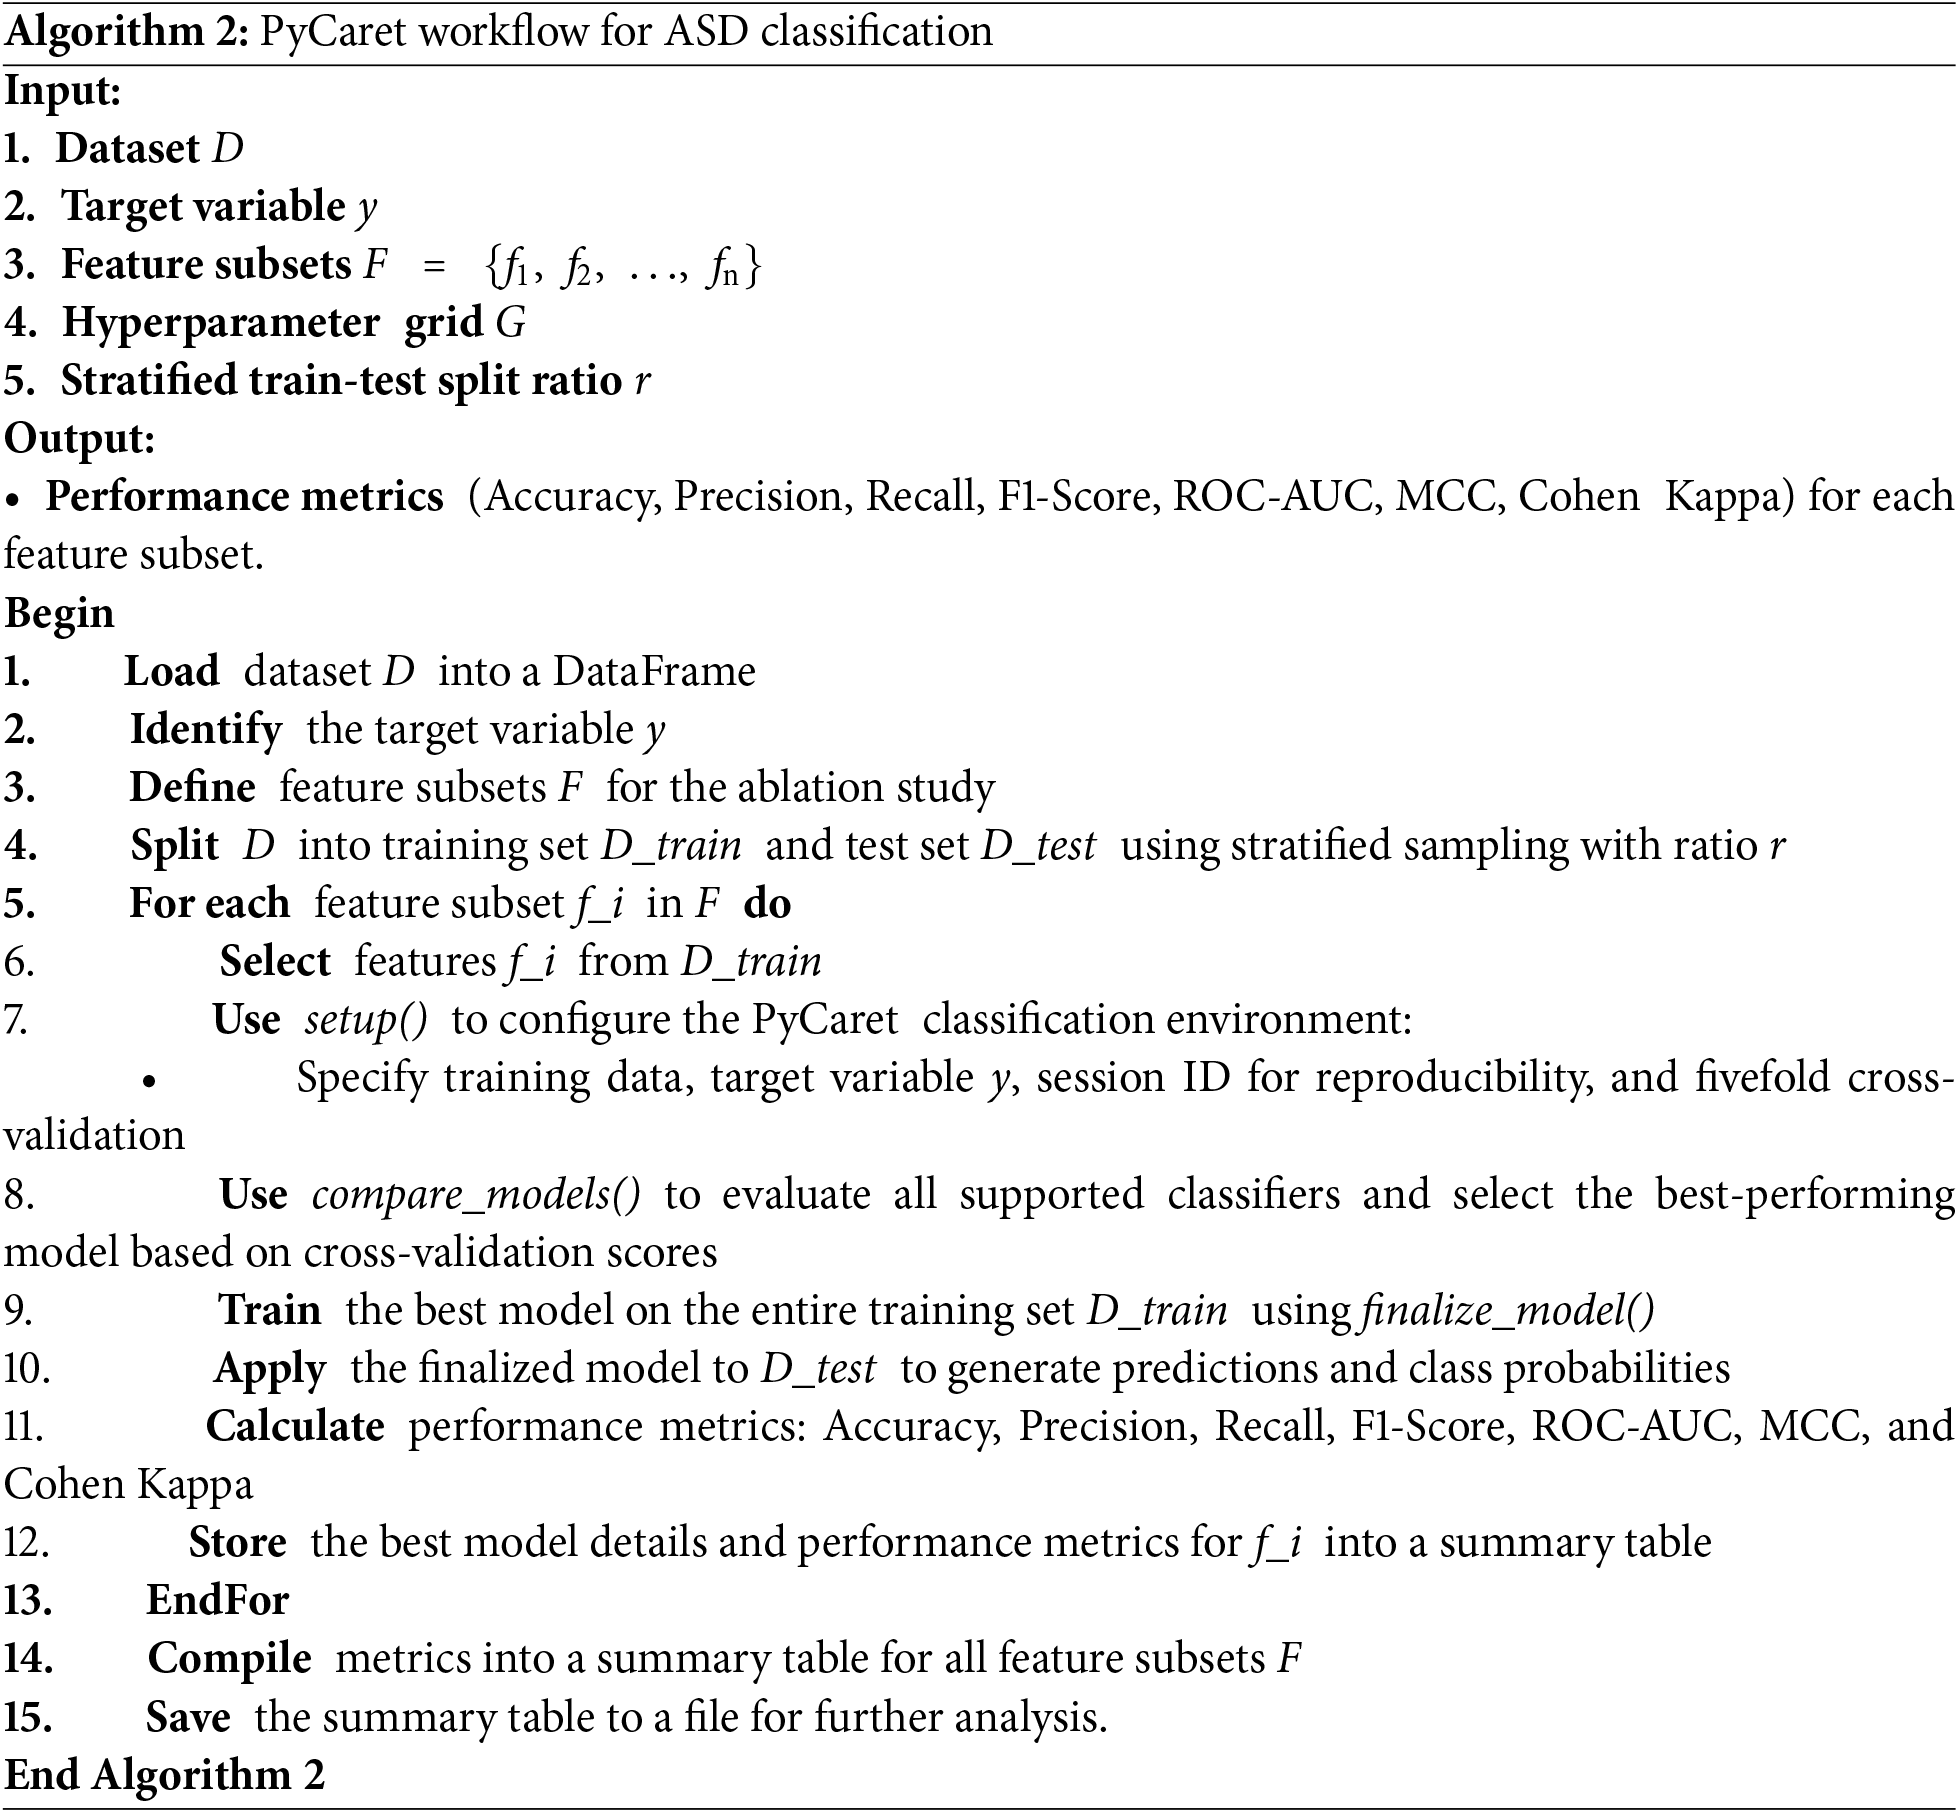
• PyCaret: The best-performing model was automatically selected from a set of algorithms based on cross-validation results (refer to Algorithm 2 for the detailed workflow).
The detailed feature subsets for each case are presented in Table 5, while the performance metrics and model configurations for CatBoost and PyCaret are presented separately in Tables 6 and 7. This comprehensive evaluation highlights how different feature subsets affect both model robustness and prediction accuracy.
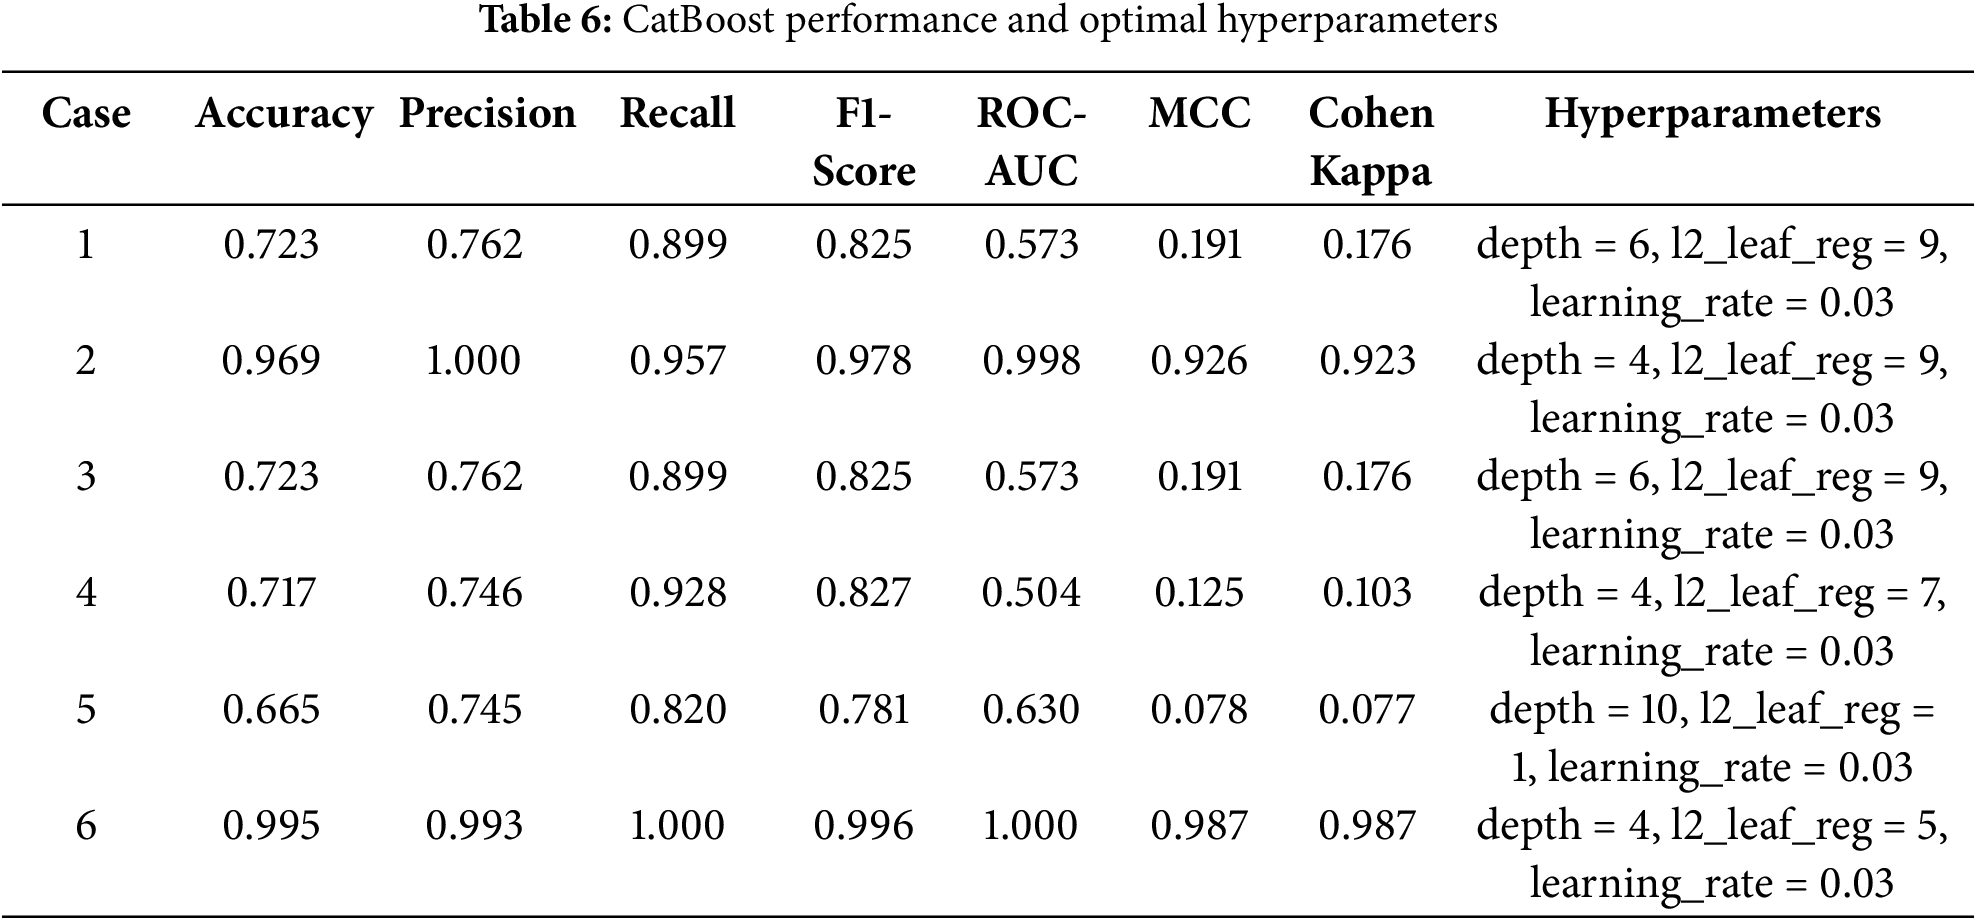
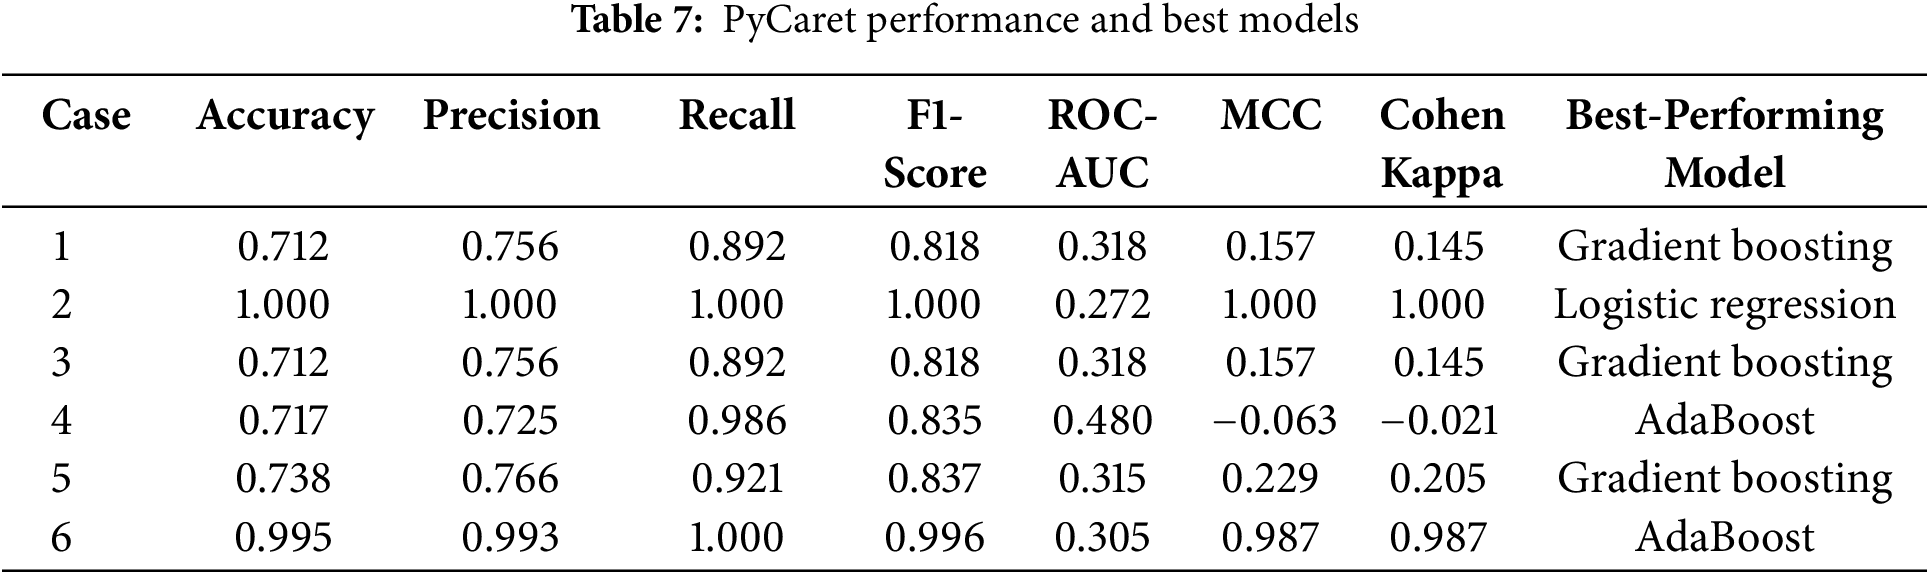
Among the models evaluated, CatBoost showed superior performance in Case 6, achieving an accuracy of 0.990, a perfect recall (1.000), and a ROC-AUC of 1.000. Its high MCC (0.974) and Cohen’s Kappa (0.973) further highlight its robust classification ability across all metrics. The optimal hyperparameter configuration for the case—depth = 4, l2_leaf_reg = 3, and learning_rate = 0.03—allowed CatBoost to effectively handle the full feature set, leveraging its ability to model complex interactions while avoiding overfitting.
In comparison, logistic regression in Case 2 achieved perfect scores for most metrics due to the strong agreement between the binary diagnostic variables (A1 to A10) and the target variable. However, its low ROC-AUC (0.272) reflects limitations in handling more nuanced decision boundaries, highlighting its reduced robustness when features are less directly correlated with the target.
Similarly, AdaBoost performed well in Case 6, with an accuracy of 0.995 and an F1-score of 0.996. Despite these strong results, its slightly lower MCC (0.987) and ROC-AUC (0.305) indicate a limited ability to fully capture the complex relationships inherent in the full feature set. This limitation stems from its reliance on sequential weak learners, which may struggle to generalize optimally in high-dimensional spaces.
In summary, while models such as logistic regression in Case 2 and AdaBoost in Case 6 excel in specific scenarios, their limitations in robustness and generalizability are apparent. CatBoost in Case 6 emerges as the most reliable and adaptable solution, achieving exceptional predictive performance and scalability when applied to the comprehensive feature set. These results reinforce the utility of CatBoost for detecting ASD traits in complex datasets.
4.3 Identification of Relevant Studies Using the ASD Children Traits Dataset
To ensure the robustness and relevance of our work, we conducted a focused review of studies using the ASD Children Traits dataset, which serves as the foundation for our research. Using Google Scholar with the search term “ASD Children Traits”, we identified four key studies published after 2023 that used this dataset to explore ASD classification and analysis. These studies provided valuable benchmarks for comparison and are summarized below:
• Zheng et al. (2023) [46]: This study focuses on feature selection techniques, including correlation, chi-squared tests, and mutual information, to identify the most important features for ASD classification. Using RF as the classification model, the authors validated the effectiveness of feature selection in improving model performance.
• Leeon et al. (2024) [47]: Leeon et al. investigated different ML algorithms for predicting learning disabilities in children with ASD. RF tuned by grid search and random search emerged as the best-performing model. The study also used local interpretable model-agnostic explanations (LIME) to interpret the model, highlighting the role of specific features in prediction.
• Jeon et al. (2024) [31]: Our previous work demonstrated the effectiveness of GBM, XGBoost, and neural networks for ASD classification using tenfold cross-validation. However, that study was conducted in an R environment with the caret package, while our experiments were implemented in Python, making direct comparisons challenging due to differences in platform optimizations.
• Dikbaş and Arslan (2023) [48]: This study applied automatic programming methods to feature selection and ASD classification. However, its implementation was excluded due to language and technical barriers, as it was conducted in Turkish using proprietary tools.
We replicated the methods of Zheng et al. [46] and Leeon et al. [47] to ensure a fair comparison with our CatBoost implementation. The results of each study were incorporated into our analysis to evaluate how the proposed method compares in terms of classification accuracy, robustness, and feature importance.
By leveraging the insights from these studies, we not only validated the strengths of our model but also ensured that our experimental framework is aligned with the state-of-the-art research on the ASD Children Traits dataset. This alignment underscores the novelty and applicability of our work in the broader context of ASD detection and diagnosis.
Table 8 is a comprehensive summary of the performance metrics for the models evaluated in the referenced studies, as well as our proposed CatBoost model. The table provides insight into the strengths and comparative performance of each approach, highlighting accuracy, precision, recall, F1-score, ROC-AUC, MCC, and Cohen’s Kappa.
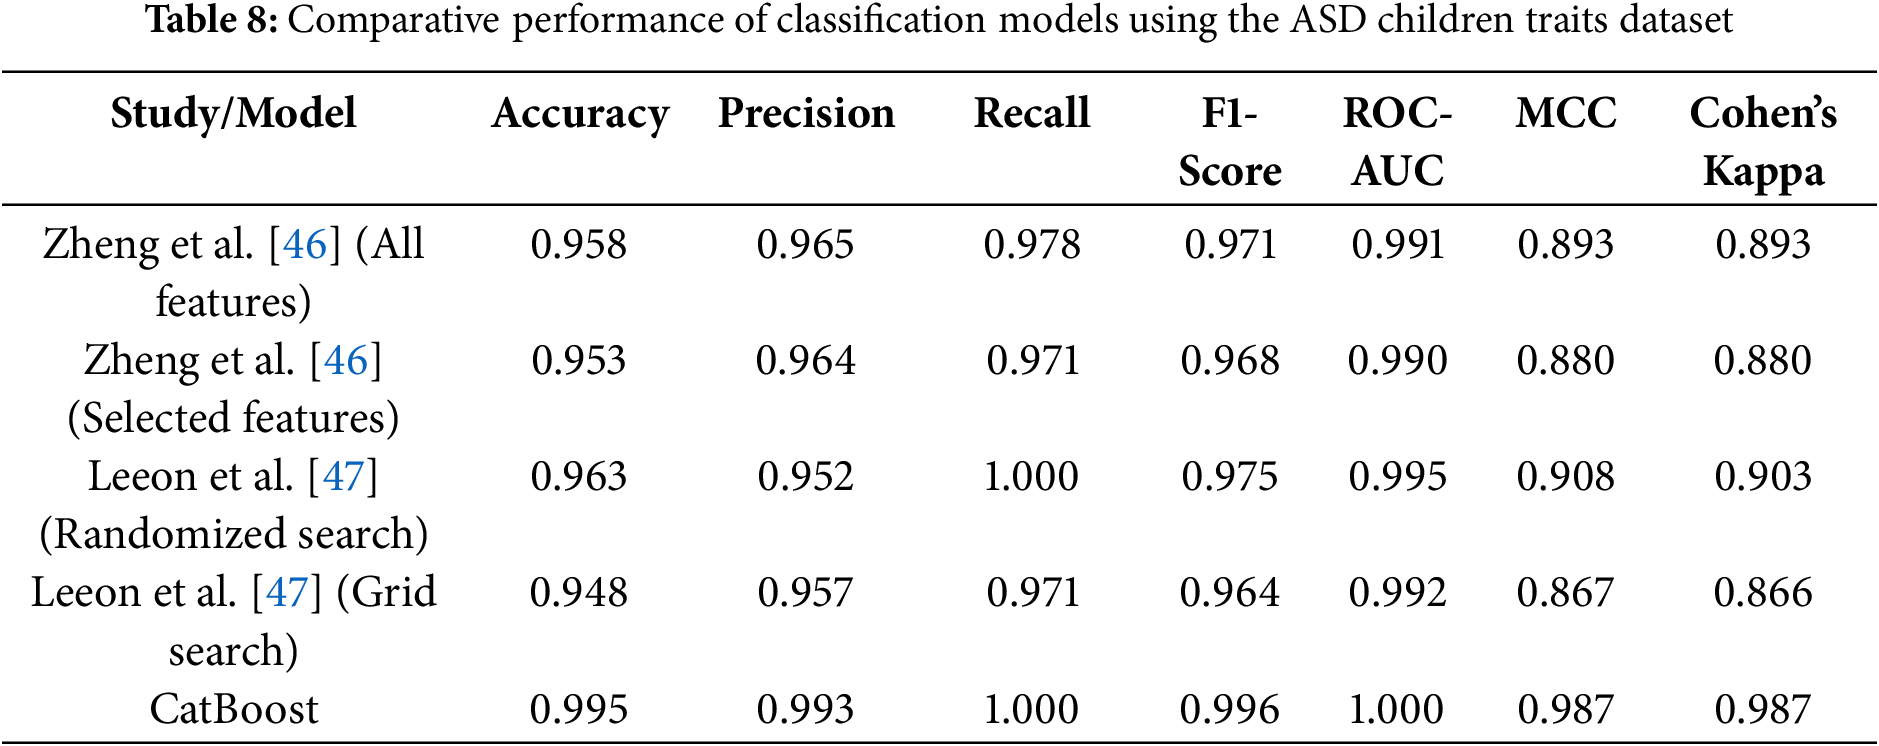
The results show strong performance across all models, with several key findings:
• Feature selection and RF (Zheng et al.): Zheng et al. [46] reported high performance with both full and selected feature sets, achieving over 95% accuracy and ROC-AUC close to 0.99. However, the slightly lower MCC and Cohen’s Kappa compared to CatBoost suggest challenges in handling more nuanced class distributions.
• Hyperparameter optimization (Leeon et al.): Leeon et al. [47] demonstrated the effectiveness of hyperparameter tuning, with RandomizedSearchCV outperforming GridSearchCV. While the accuracy and recall of the randomized search reached 96% and 100%, respectively, the MCC (0.908) and Cohen’s Kappa (0.903) were slightly lower than those of the proposed CatBoost model.
The analysis highlights the distinct advantages of different models in tackling complex classification problems. CatBoost emerges as a particularly robust and user-friendly approach that combines computational efficiency with strong predictive performance. These characteristics make it an excellent choice for ASD classification, especially when ease of implementation, scalability, and interpretability are critical considerations.
4.4 Model Robustness across Demographic Subgroups
To ensure the fairness and generalizability of the model across diverse populations, we conducted stratified analyses based on three clinically relevant variables: CARS scores, family history of ASD, and gender. These variables were selected for their importance in clinical assessment and their potential to reveal systematic biases in algorithmic decision-making.
CARS serves as a validated measure of ASD symptom severity, ranging from mild to severe presentations. By analyzing model performance across different CARS strata, we evaluated its reliability not only in well-defined cases but also in borderline or ambiguous profiles—where both clinical and computational assessments are most susceptible to misclassification. High performance across all CARS groups indicates that the model effectively captures a wide range of behavioral phenotypes without overfitting to prototypical cases.
Family history of ASD, a binary indicator, reflects known heritability and can act as a proxy for genetic and environmental predispositions. Stratifying by this variable allowed us to assess whether the model disproportionately relies on familial risk factors. The results demonstrate consistent performance regardless of family history, suggesting that the model primarily leverages behavioral and developmental features rather than inherited bias.
Gender is a critical fairness dimension, as ASD is historically underdiagnosed in females due to subtler manifestations and male-centric diagnostic tools. Ensuring equitable performance across sexes is therefore essential. Subgroup analyses revealed that the classifiers employed—AdaBoost, CatBoost, and Gradient Boosting—achieved balanced accuracy across male and female groups, indicating that the CARE framework effectively mitigates gender-related biases in ASD detection.
As shown in Tables 9 and 10, ensemble models—including AdaBoost, CatBoost, and Gradient Boosting—consistently achieved high accuracy and F1-scores across all examined subgroups, with minimal performance variability. Notably, AdaBoost maintained near-perfect accuracy across nearly all categories, while CatBoost exhibited only slight performance reductions in more complex subgroup analyses. In contrast, baseline models such as the Dummy Classifier and Naive Bayes demonstrated significant performance degradation under the same conditions, underscoring the importance of advanced ensemble techniques for robust and equitable prediction.
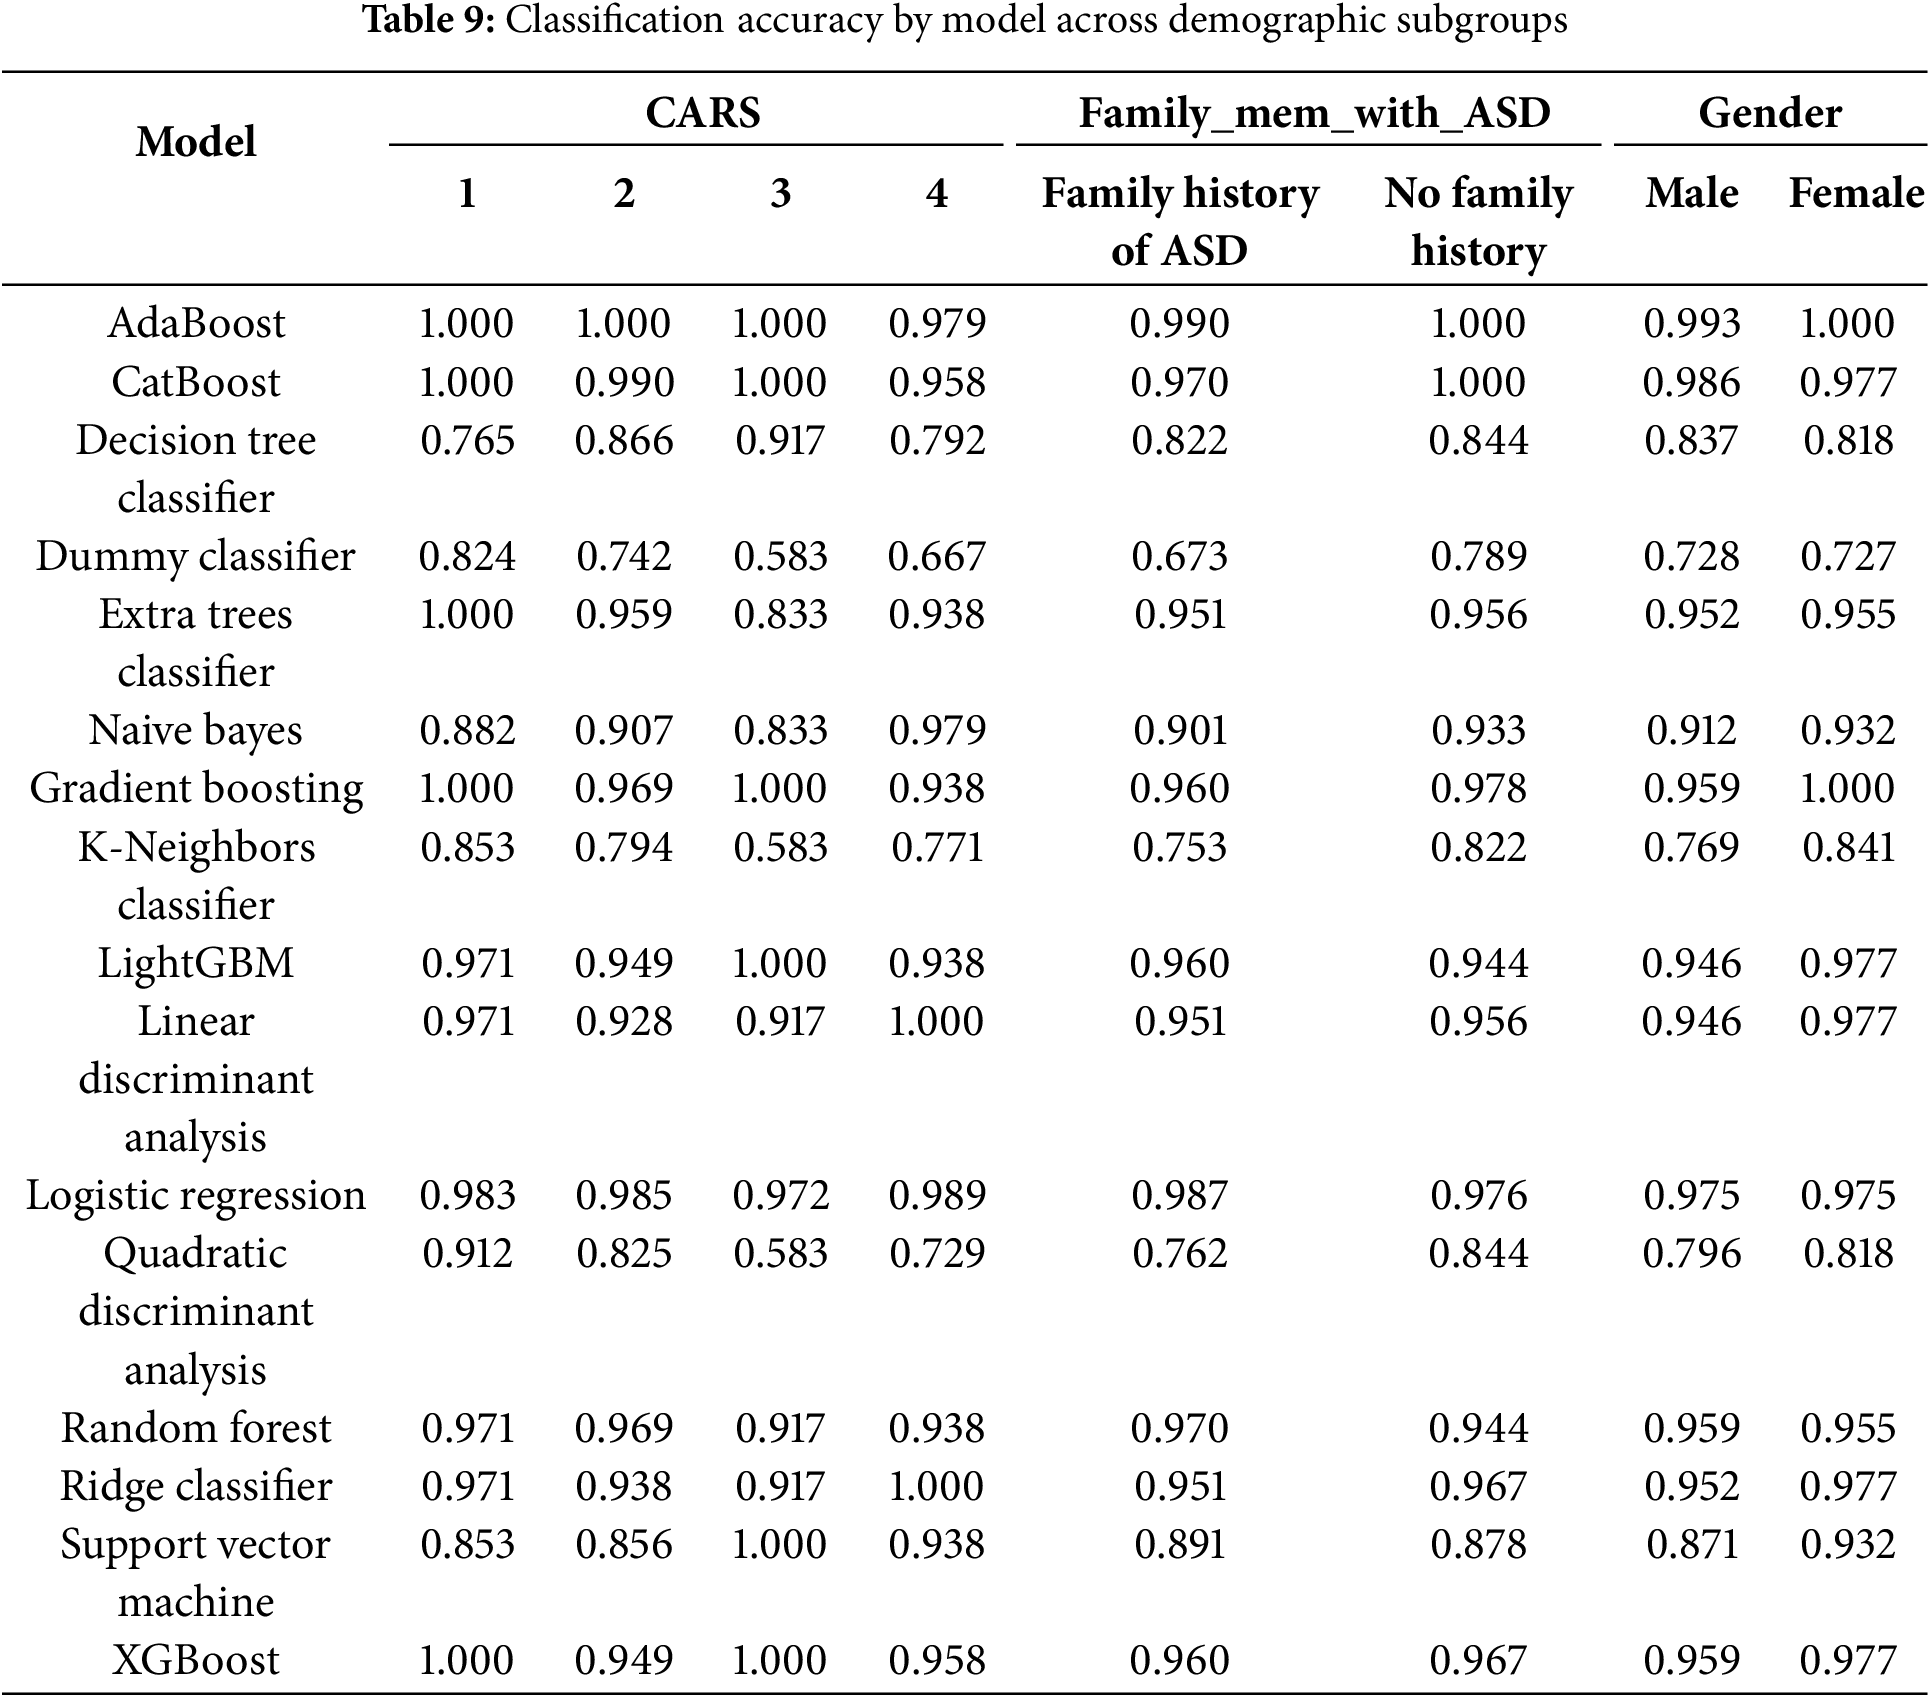
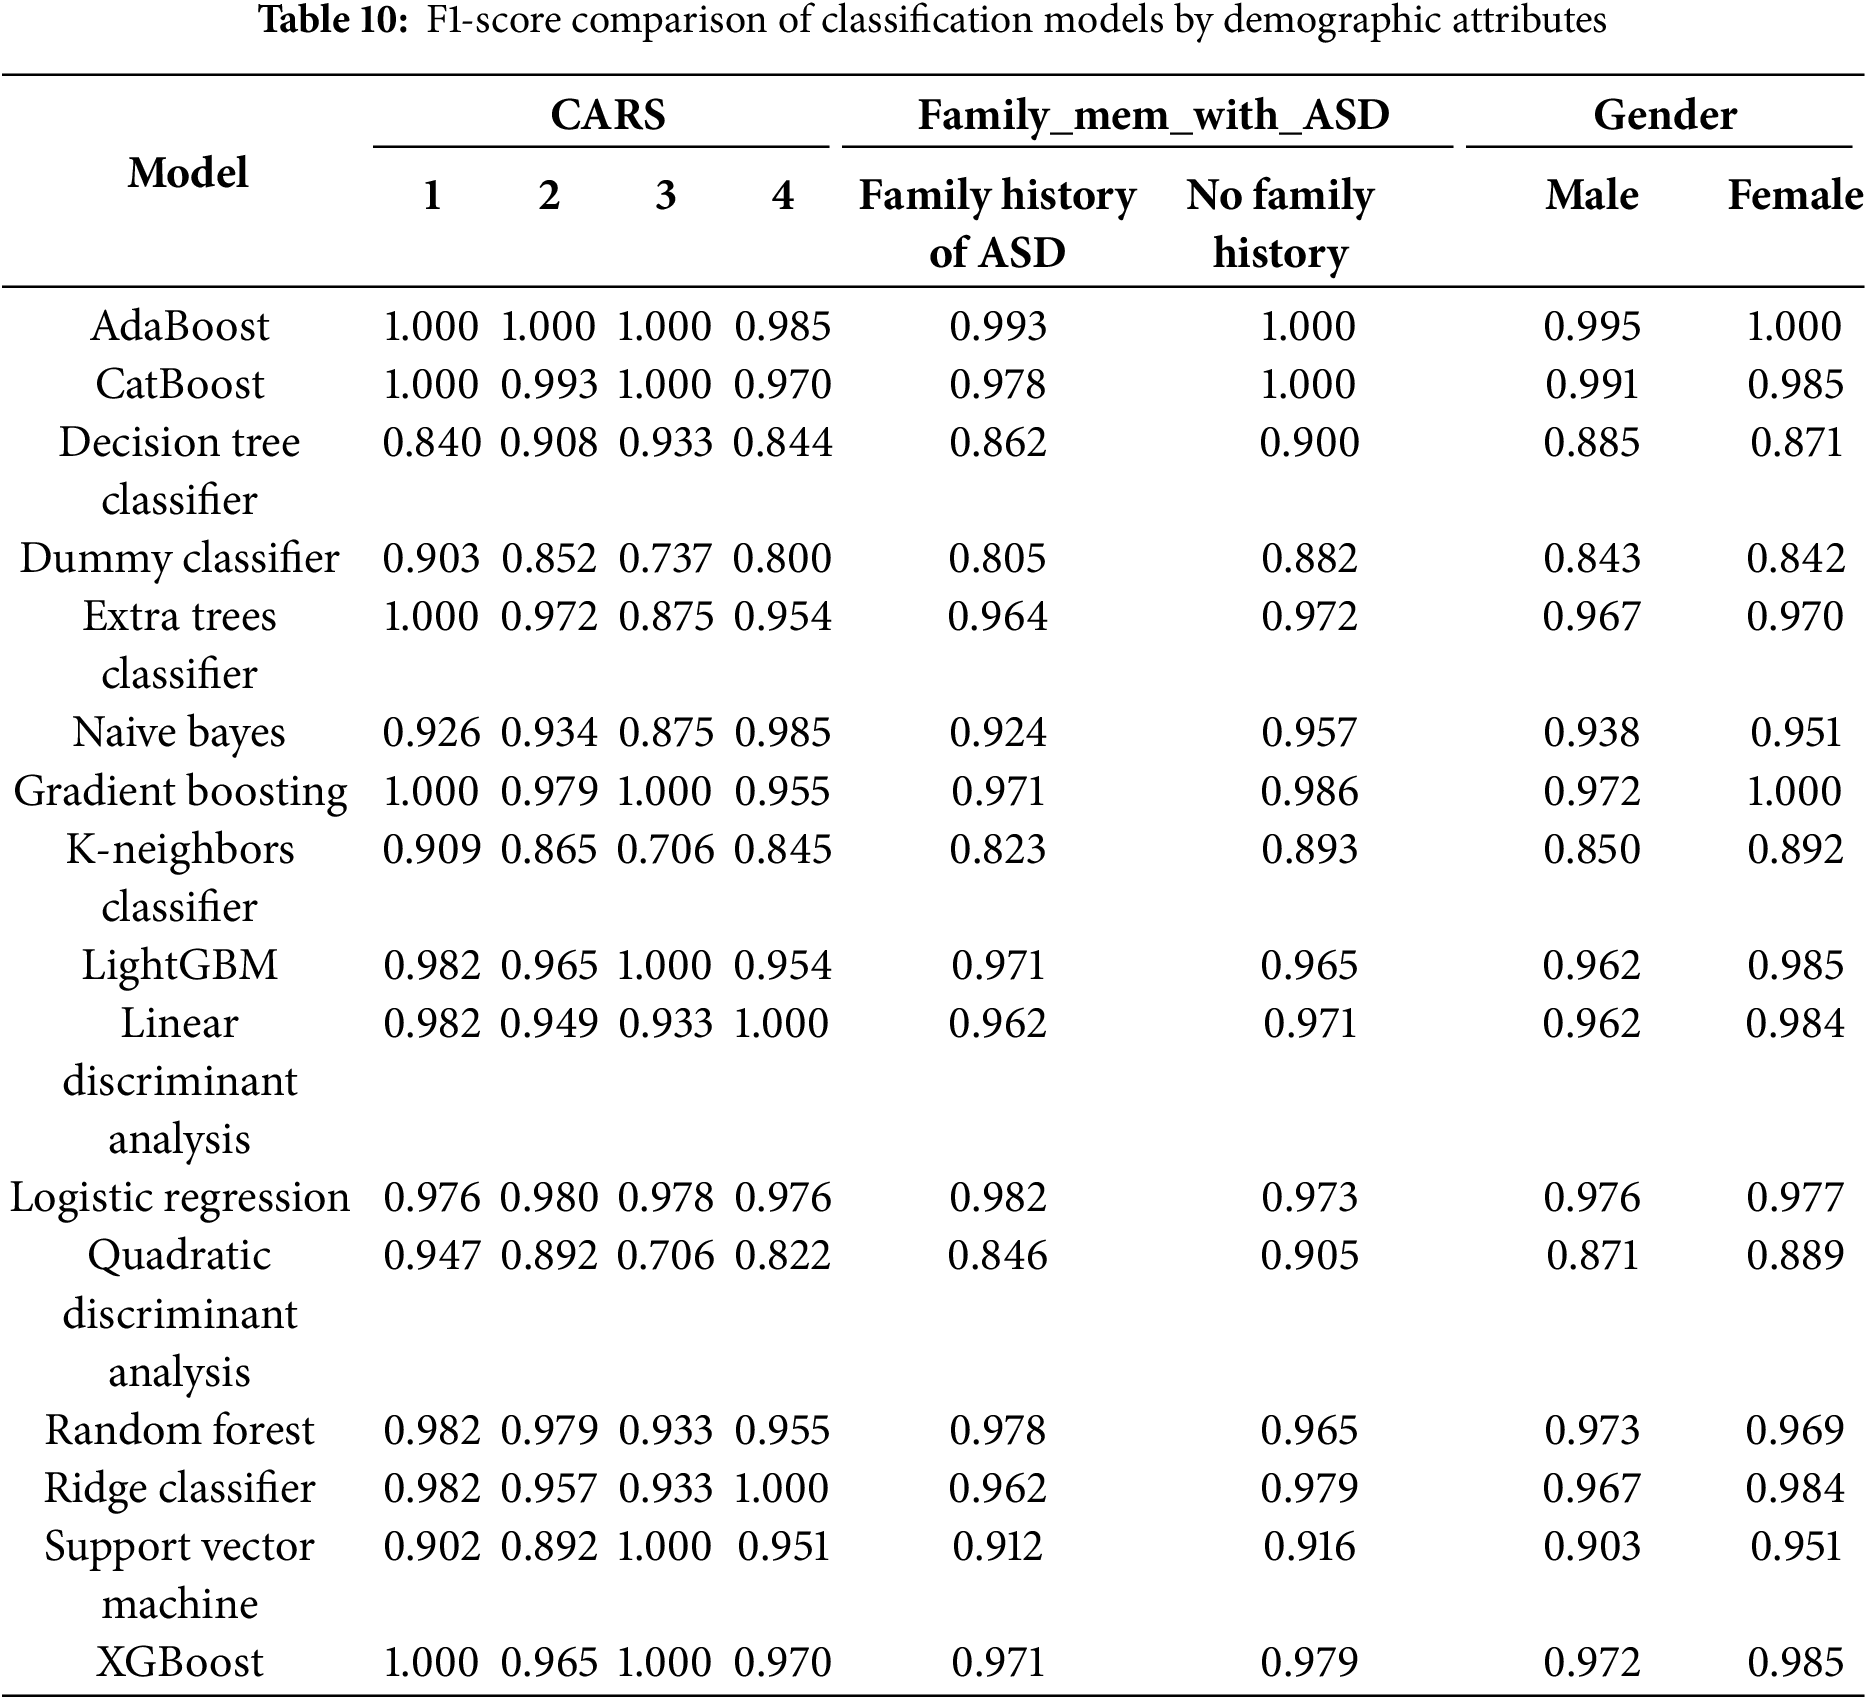
These findings highlight the scalability, fairness, and clinical applicability of the CARE framework. By demonstrating consistent performance across clinically significant subgroups, the model directly addresses key ethical and practical concerns related to algorithmic bias and generalizability. This positions CARE as a viable candidate for future integration into real-world pediatric ASD screening workflows.
To ensure full transparency and reproducibility, the CARE-ASD-Modeling GitHub repository (https://github.com/johnnyone89/CARE-ASD-Modeling (accessed on 09 July 2025)) provides open access to the dataset used in this study, titled “ASD Children Traits” along with the complete analysis pipeline. This resource enables independent researchers to replicate the study and verify its findings with ease.
4.5 Interpretable SHAP-Based Analysis of CatBoost Model for ASD Trait Detection
Using the test set results from the CatBoost model optimized with the best hyperparameters after grid search, SHAP visualizations were applied to assess feature importance and understand the contribution of specific features to the model’s predictions for ASD traits. These analyses highlight the potential of SHAP to provide interpretable, data-driven insights into ASD traits, consistent with the overarching goal of the CARE framework to serve as an early screening tool for ASD in non-clinical settings such as schools, homes, and community centers. By identifying key behaviors indicative of ASD, this framework empowers families and caregivers to seek timely and appropriate clinical evaluations, bridging the gap between initial concerns and professional care.
Fig. 9 presents a SHAP bar plot summarizing the mean absolute SHAP values for each feature used in the CatBoost model to predict ASD traits. This plot highlights the average magnitude of each feature’s impact on the model’s predictions. Behavioral traits, such as A8, A1, A7, and A10, exhibit the highest mean SHAP values, signifying their critical role in the model’s decision-making process. Features such as AQ10, A9, and A2 also contribute meaningfully, albeit to a lesser extent. Demographic variables, including Gender, Ethnicity, and Age_Years, show comparatively low SHAP values, indicating minimal influence on the model’s predictions.
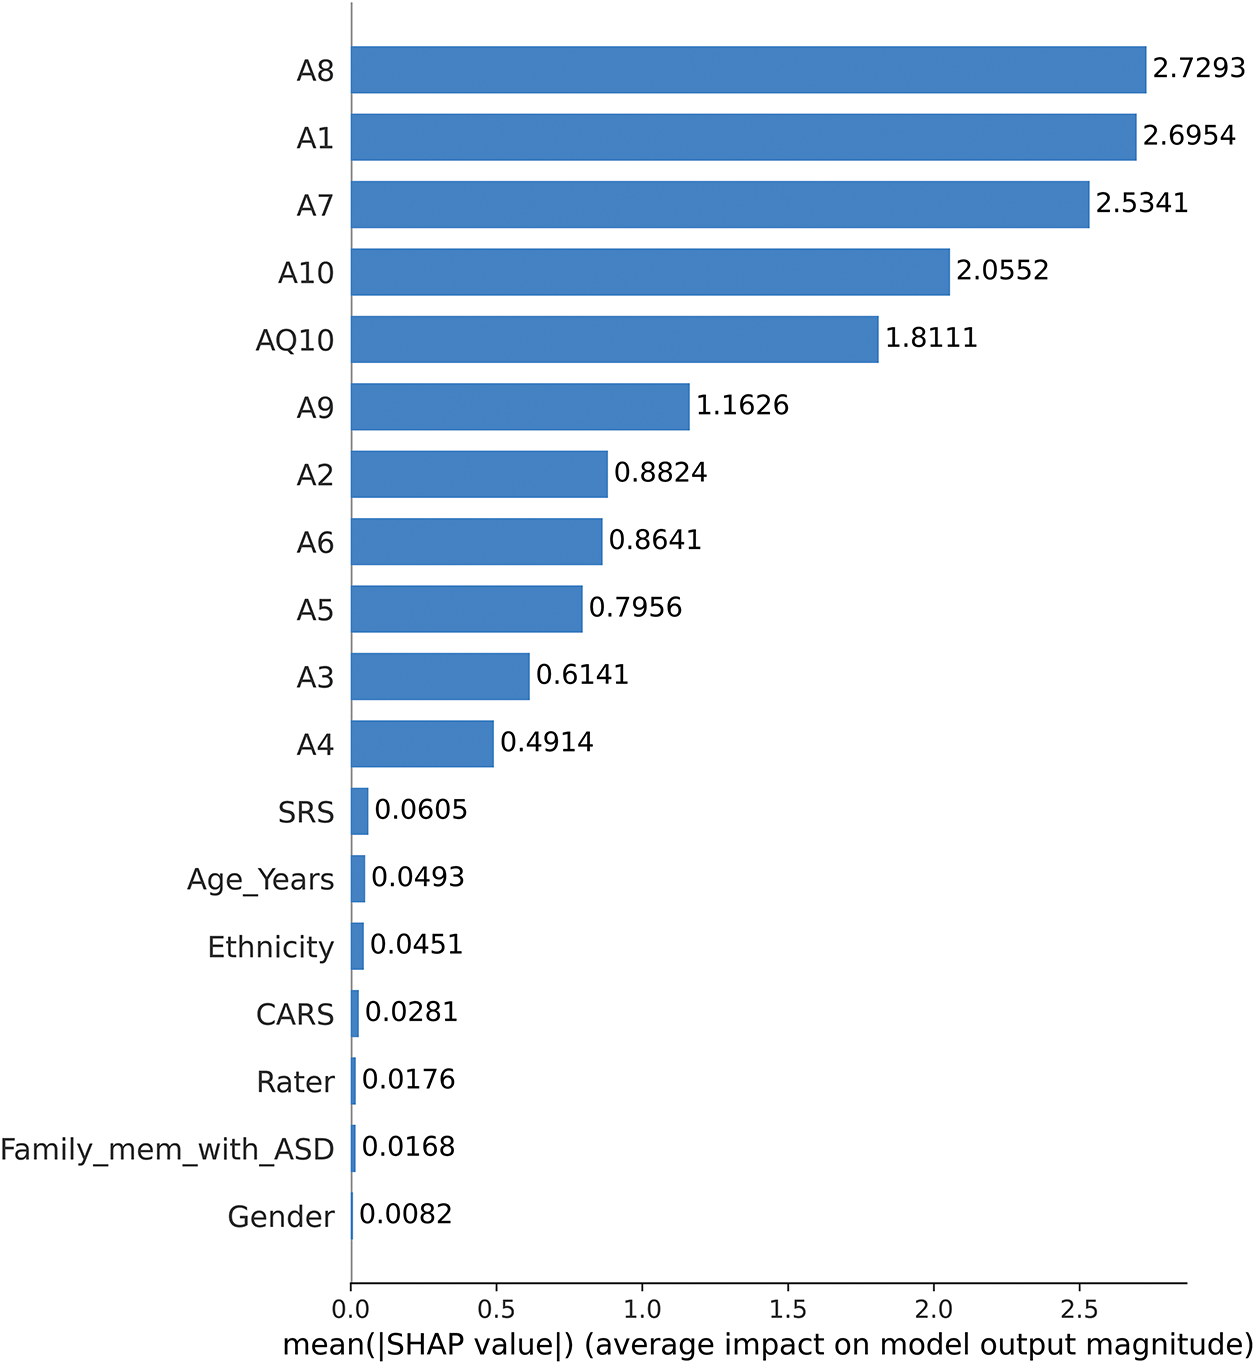
Figure 9: SHAP bar plot of mean feature importance
Fig. 10 provides a SHAP summary plot that visualizes how specific feature values influence the CatBoost model’s predictions for ASD traits (1 = ASD presence, 2 = ASD absence). The color gradient represents feature values, with red indicating higher values and blue representing lower values.
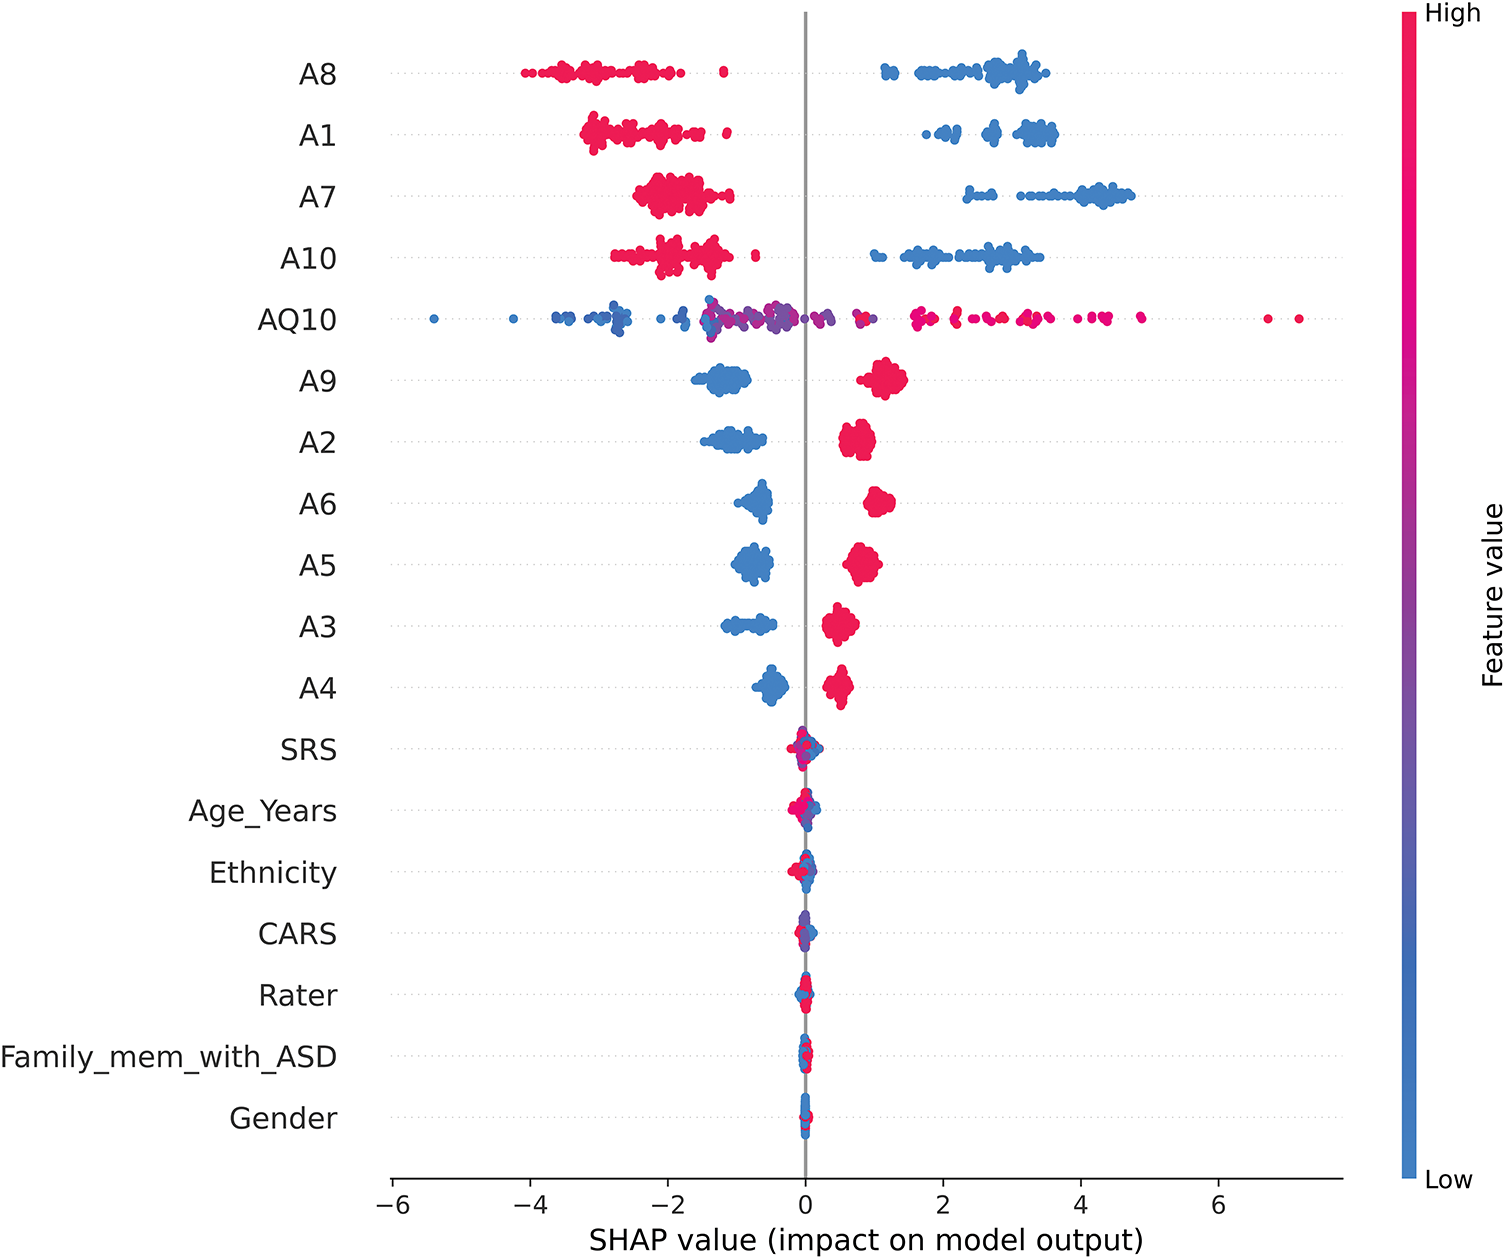
Figure 10: SHAP summary plot
This visualization highlights the following key patterns:
1. Features Negatively Correlated with ASD Presence (A8, A1, A7, and A10)
• Higher values (red) for these traits reduce their SHAP contributions, favoring predictions of ASD absence (label = 2).
• Lower values (blue), on the other hand, increase their SHAP contributions, biasing predictions toward ASD presence (label = 1).
• This inverse relationship suggests that lower values for these traits may be more indicative of ASD, reflecting their importance in distinguishing ASD-related traits.
2. Features Positively Correlated with ASD Presence (AQ10, A9, A2, and A6)
• Higher values (red) for these traits increase their SHAP contributions, strongly aligning with predictions of ASD presence (label = 1).
• Lower values (blue) decrease their contributions, biasing predictions toward ASD absence (label = 2).
• Notably, as an ordinal variable, AQ10 captures nuanced gradations of ASD traits, enhancing the model’s ability to refine predictions based on ordered trait levels.
3. Behavioral Questionnaire Considerations
• The dominance of high SHAP values among traits coded as A1–A10 highlights the critical role of behavioral indicators in ASD classification. However, the contrasting trends between features (e.g., A8 vs. AQ10) underscore the complexity of these traits and the potential for nuanced interactions in ASD diagnosis.
• The model’s reliance on these traits raises questions about their construction and balance within the questionnaire, suggesting that future refinements should carefully address potential biases to improve robustness.
4. Lesser Influential Features (Gender, Ethnicity, and Age_Years)
• Demographic characteristics, including Gender, Ethnicity, and Age_Years, show minimal SHAP contributions, indicating their relatively minor influence on the model’s predictions. This finding supports the contention that behavioral characteristics are the primary drivers of ASD classification, while demographic variables play a complementary but limited role.
The SHAP summary plot highlights the interpretability of the CARE framework by providing clear insight into how specific trait scores influence predictions. By highlighting both positive and negative correlations, the model provides transparency, enabling caregivers, educators, and clinicians to understand the underlying patterns that drive predictions. These findings reinforce the value of AI as a complementary tool in early ASD screening while underscoring the importance of careful trait design to minimize bias and enhance generalizability.
Fig. 11 visualizes the instance-level contributions of features to the CatBoost model’s predictions for ASD traits. The heatmap plots the SHAP values for each feature (rows) across multiple instances (columns), providing a detailed perspective on how individual features influence model predictions. The color gradient conveys the direction and magnitude of the contributions: red indicates positive contributions to the prediction of ASD presence (label = 1), while blue indicates negative contributions, favoring predictions of ASD absence (label = 2).
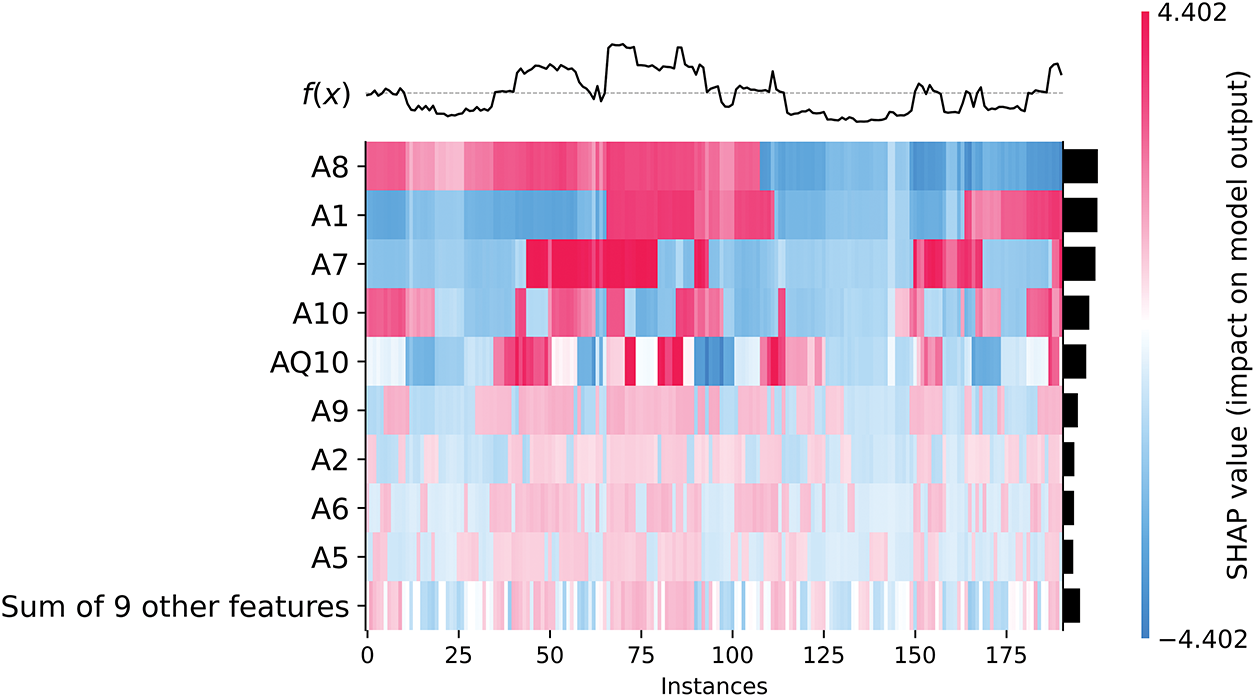
Figure 11: SHAP heatmap of instance-level feature contributions
Behavioral traits such as A8, A1, A7, and A10 show strong contributions to predictions, but in contrasting ways: (1) Higher values for these traits (indicated in red) decrease their contributions, consistent with predictions of ASD presence (label = 1). (2) Lower values (blue) increase their contributions, favoring predictions of ASD absence (label = 2). This behavior highlights their role in discriminating ASD presence from absence while underscoring the inverse relationship between their values and model predictions.
Conversely, features such as AQ10, A9, A2, and A6 show consistent patterns: (1) Higher values of these features increase their contributions to ASD presence (label = 1), as indicated in red. (2) Lower values decrease their contributions, biasing predictions toward ASD absence (label = 2). These distinctions reflect the different ways in which these traits interact with the model, providing nuanced insights into how behavioral traits shape prediction. The most important observations are the following:
• Clustered influence across instances: The heatmap shows clusters of instances where certain features, such as A8 and A1, show consistent patterns of influence. These clusters indicate common features across groups of instances, suggesting that these features may serve as reliable predictors for specific subgroups within the dataset.
• Feature interactions in particular instances: The visualization shows how multiple features interact to influence predictions within individual instances. For example, AQ10 often works in conjunction with A9 and A2 to increase the model’s confidence in predicting the presence of ASD. This layered understanding of feature interactions adds depth to the interpretability of the model.
• Role of secondary features: The row labeled “Sum of 9 other features” aggregates the collective contributions of less dominant features. While their individual SHAP values are smaller, their combined effect can still influence predictions, especially in cases where the dominant features (e.g., A8 or AQ10) play a less critical role.
• Effect of data imbalance: The heatmap also illustrates the effect of data imbalance (72.9% ASD presence vs. 27.1% ASD absence). This imbalance affects the model’s predictions, often favoring ASD presence. For example, cases with high values on AQ10 and A9 are more likely to be classified as having ASD, even when other features give mixed signals.
This instance-level analysis enhances the interpretability of the CARE framework by allowing users—whether clinicians, caregivers, or educators—to understand the contribution of each feature to each prediction. Such transparency builds trust in AI models and enables informed decisions about whether further clinical evaluation is warranted. The findings also highlight the need to refine questionnaire design to address potential biases in feature importance, ensuring that predictions are robust and generalizable.
In Fig. 12, the SHAP dependence plot for AQ10 shows a clear positive correlation between AQ10 scores and SHAP values, with higher AQ10 scores consistently increasing their contribution to predicting the presence of ASD (label = 1). This suggests that AQ10 is a critical feature in the model’s decision-making process, particularly at higher scores [49].
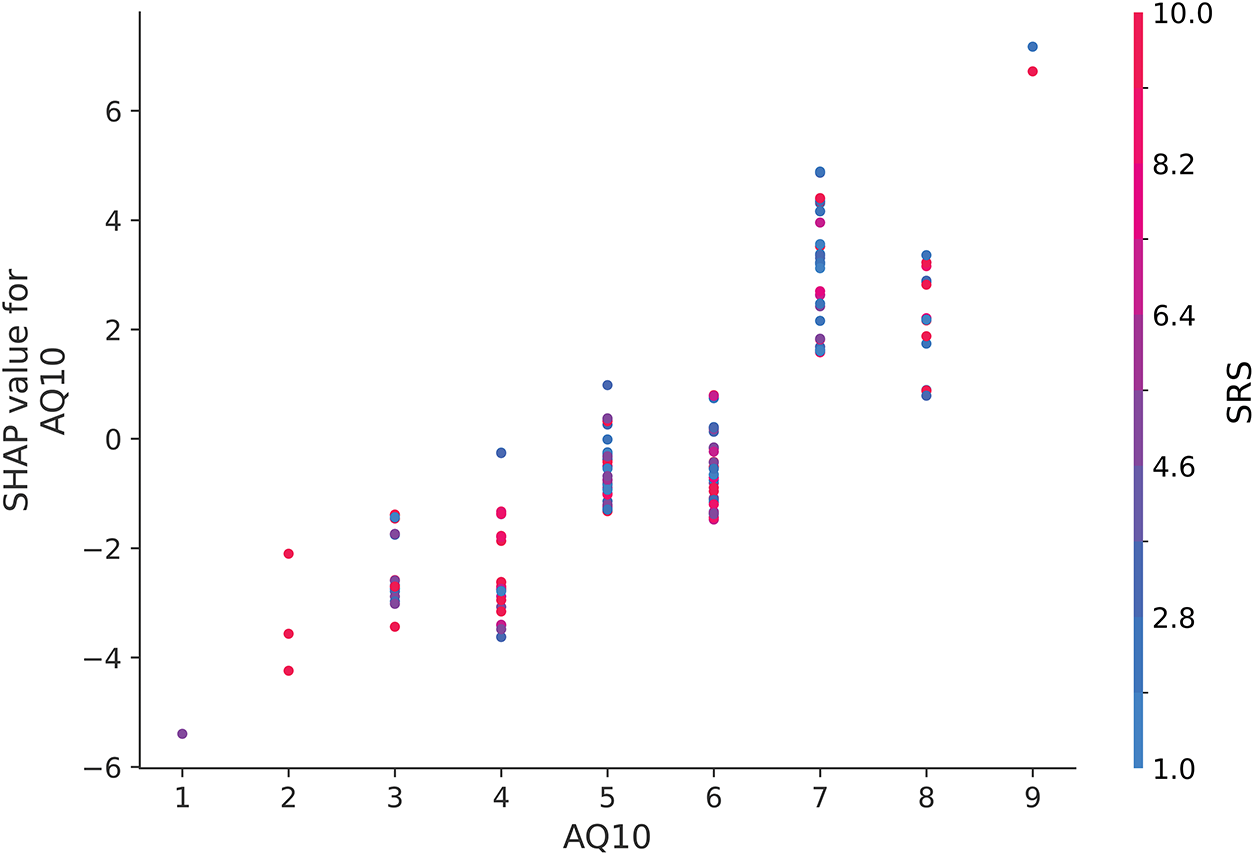
Figure 12: SHAP dependence plot for AQ10 when interacting with SRS
Interestingly, while SRS values are represented by the color spectrum (red for higher values and blue for lower values), there is no discernible interaction pattern between SRS and AQ10 in this plot. The distribution of red and blue points along the AQ10 axis appears random, suggesting that the relationship between AQ10 and SHAP values is largely unaffected by SRS. This finding underscores the independent importance of AQ10 in influencing model predictions for ASD, with minimal dependence on SRS scores.
Fig. 13 illustrates the interaction between CARS and AQ10. Contrary to traditional expectations of CARS as a critical diagnostic feature [50], the plot does not show a clear pattern where higher AQ10 values consistently override the influence of lower CARS values. Instead, the SHAP values for CARS remain relatively stable across different AQ10 levels, suggesting that the model does not strongly prioritize interactions between these two features. This result likely reflects the questionnaire-heavy composition of the dataset, where features such as AQ10 have a more direct influence on predictions compared to CARS.
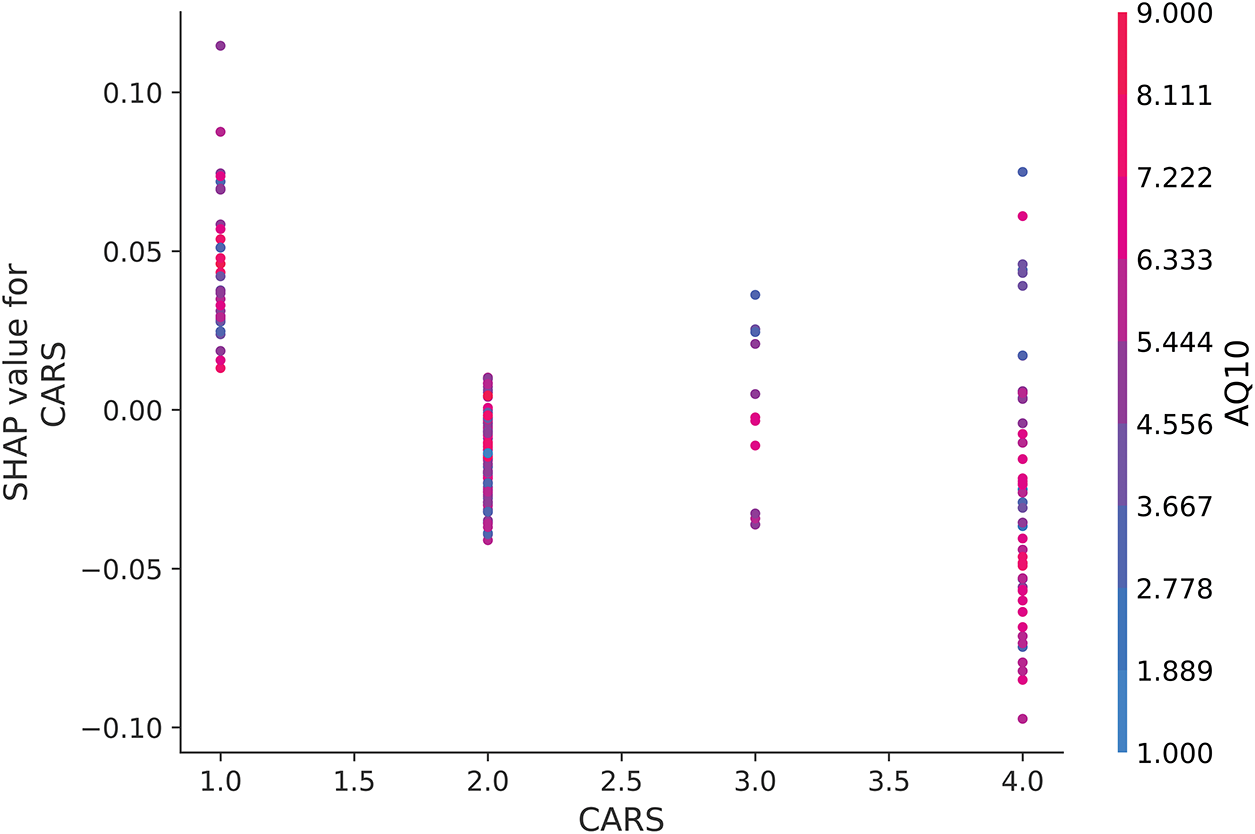
Figure 13: SHAP dependence plot for CARS when interacting with AQ10
Fig. 14 examines the dependence of SRS on CARS, but there is no clear relationship between these two features. While higher SRS values slightly increase SHAP values, the overall contribution of SRS remains limited, especially when considered alongside CARS. The distribution of SHAP values suggests that the model does not disproportionately rely on SRS to make ASD predictions when CARS scores are low. This reinforces the observation that while questionnaire items such as A1–A10 dominate the dataset, their interactions with traditional clinical scores such as CARS and SRS are not as influential in driving model predictions as initially expected.
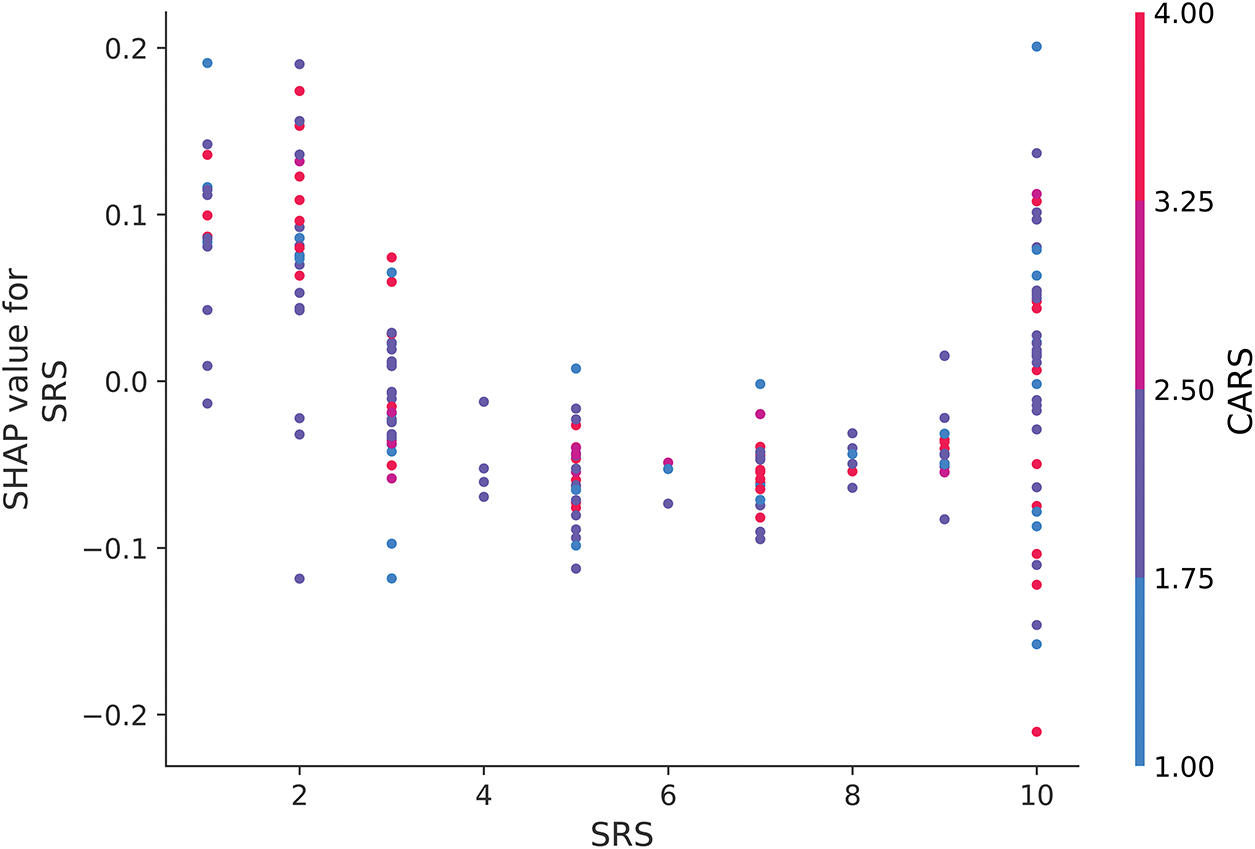
Figure 14: SHAP dependence plot for SRS when interacting with CARS
Figs. 12 and 13 provide nuanced insights into how traditional clinical features such as SRS and CARS interact with questionnaire-based measures such as AQ10. In contrast to the clear trends observed in Fig. 14, the lack of strong interaction patterns in these figures highlights the model’s primary reliance on individual features, such as AQ10, rather than their combined influence. These findings highlight the importance of interpreting ML models in the context of dataset composition and feature dominance to ensure that predictions are evaluated in line with broader clinical practice.
Figs. 15 and 16 show the SHAP waterfall plots, providing a detailed breakdown of how each feature contributes to the CatBoost model predictions for two specific cases—one predicted as ASD No (2) and the other predicted as ASD Yes (1). It is important to emphasize that the SHAP values indicate the direction (positive or negative) and magnitude of influence for each feature and do not directly correspond to the predicted labels. Instead, these values quantify how much each feature biases the prediction toward ASD Yes (1) or ASD No (2).
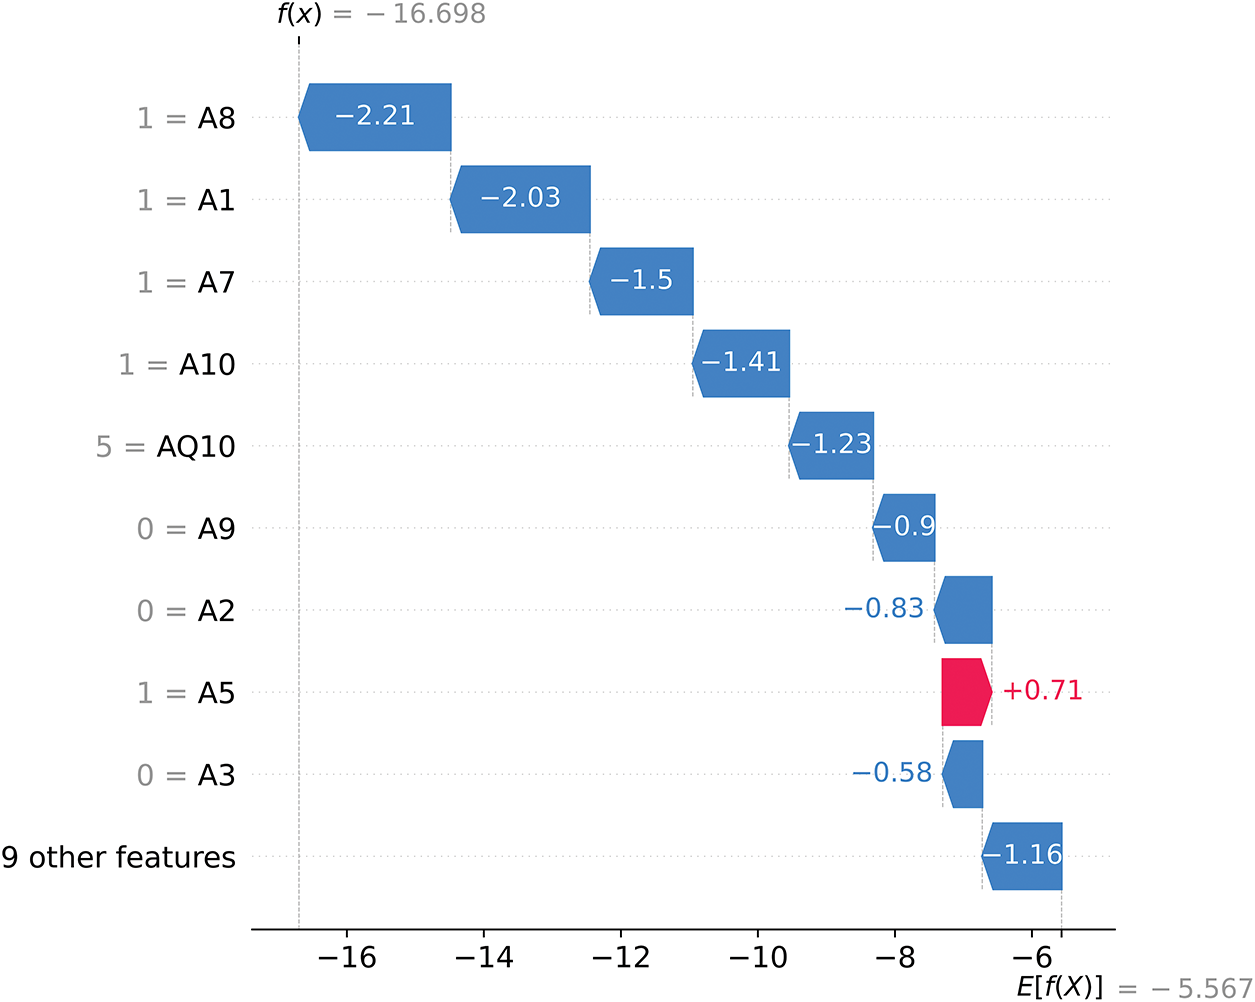
Figure 15: SHAP waterfall plot for ASD No (2)
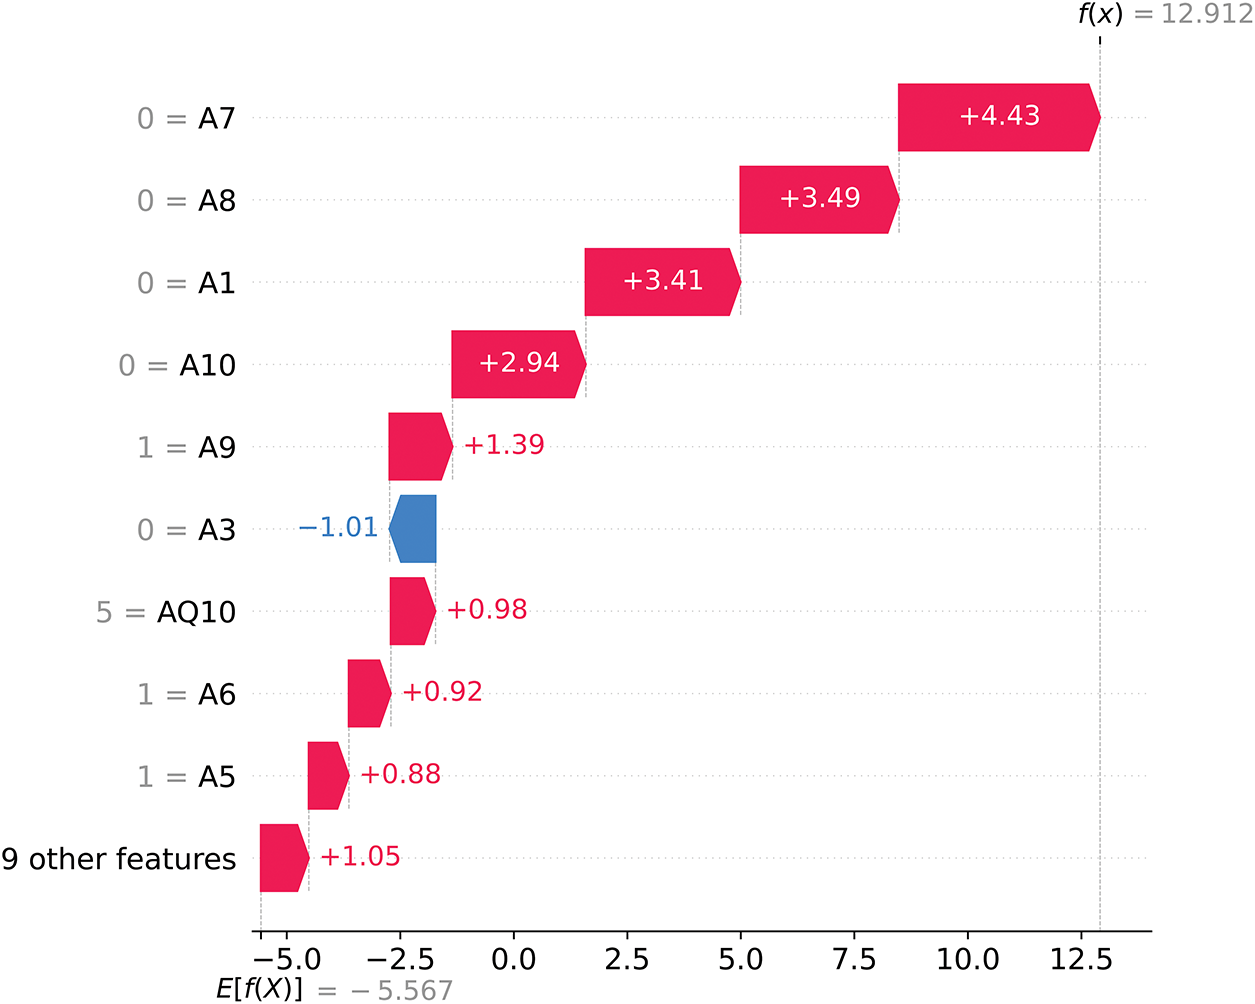
Figure 16: SHAP waterfall plot for ASD Yes (1)
In Fig. 15, the final SHAP model output is f(x) = −16.698, starting from a base value of E[f(X)] = −5.567. Since f(x) is strongly negative, the model predicts ASD No (label = 2) with high confidence. Features such as A8 (−2.21), A1 (−2.03), and A7 (−1.50) exert significant negative SHAP contributions, pushing the prediction away from ASD Yes and firmly toward ASD No. Although A5 (+0.71) provides a small positive SHAP contribution, it is insufficient to counterbalance the dominant negative influences, resulting in the final prediction of ASD No (2).
In contrast, Fig. 16 illustrates a case where the final SHAP model output is f(x) = 12.912, also starting from the base value of E[f(X)] = −5.567. Here, the strongly positive f(x) value leads the model to predict ASD Yes (label = 1) with high certainty. Features such as A7 (+4.43), A8 (+3.49), and A1 (+3.41) provide large positive SHAP contributions, driving the prediction toward ASD Yes. Although A3 (−1.01) presents a small negative SHAP value, it is outweighed by the overwhelming positive contributions from the other features, culminating in the prediction of ASD Yes (1).
Fig. 17 shows the SHAP decision plot, which illustrates how individual features collectively shape the model’s prediction outputs across the dataset. The most influential features, including A8, A1, A7, A10, and AQ10, dominate the model’s decision process, with their contributions highlighted by the direction and magnitude of their SHAP values.
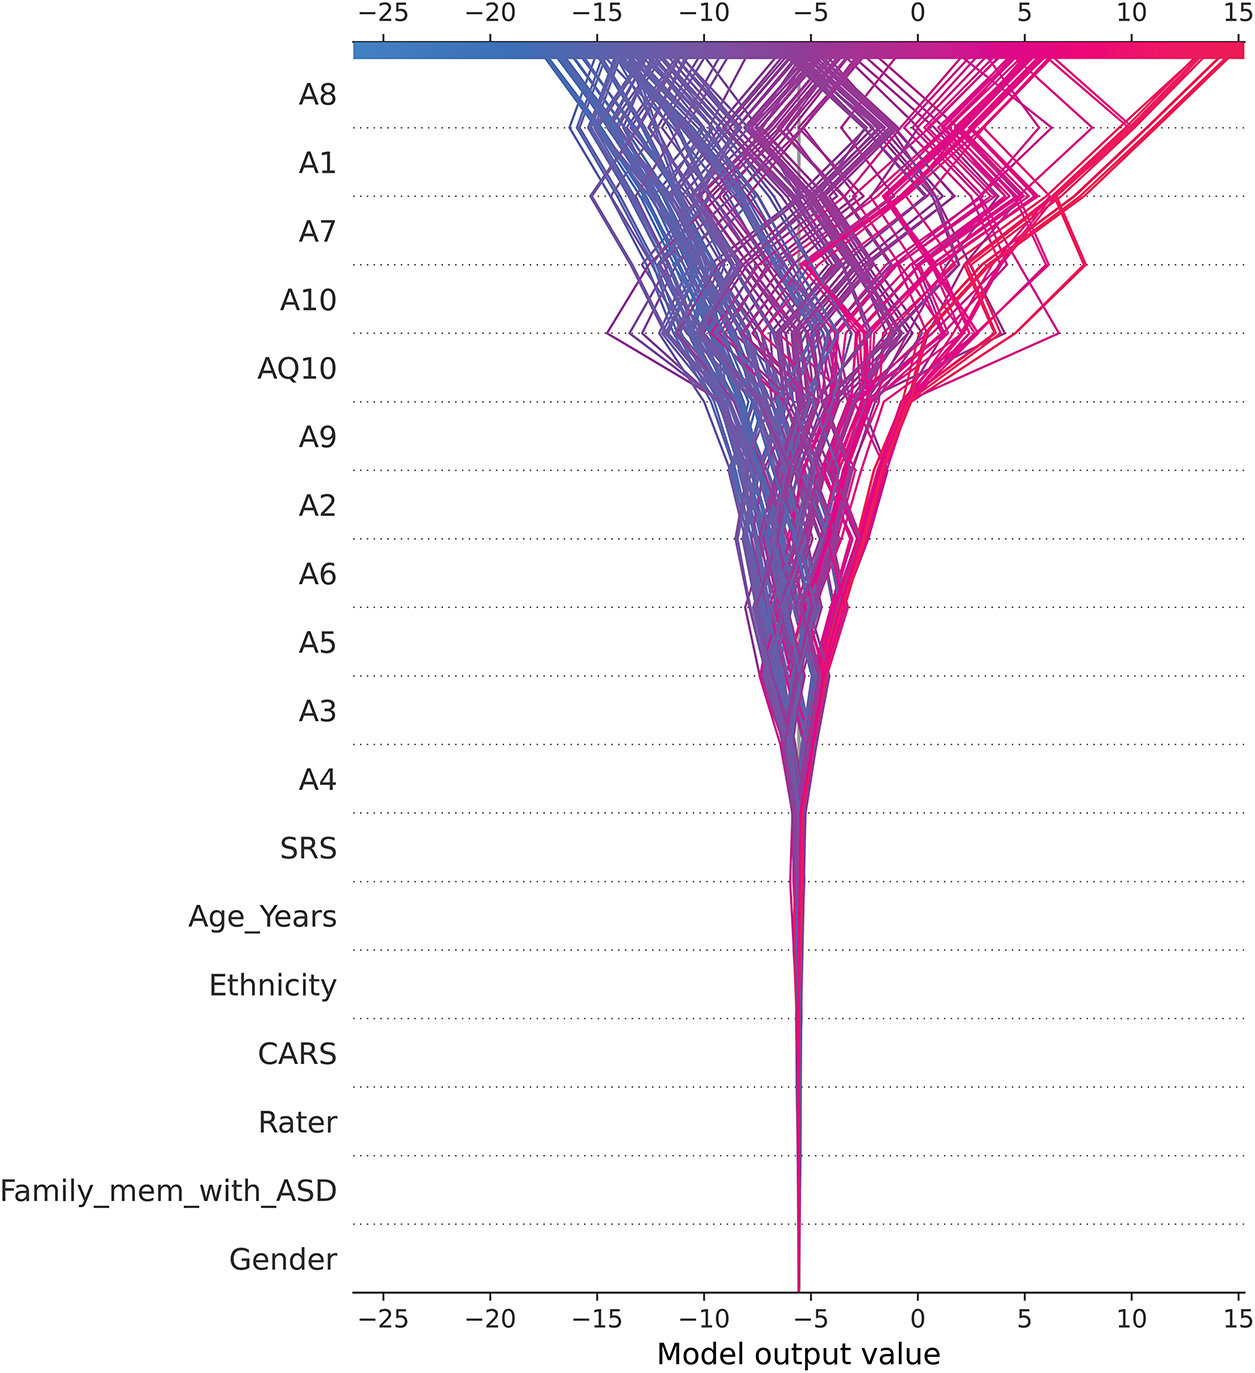
Figure 17: SHAP decision plot
• Positive SHAP values (shown in red) drive the model to predict ASD Yes (label = 1), while negative SHAP values (shown in blue) drive it to predict ASD No (label = 2).
• The trajectories of the overlapping lines represent individual instances, showing how features interact to cumulatively influence predictions.
Behavioral traits such as A8, A1, and A7 consistently show strong effects, underscoring their critical role in ASD detection. In contrast, demographic traits such as Gender and Family_mem_with_ASD contribute minimally, reflecting the model’s reliance on questionnaire-based behavioral indices. The wide range of SHAP values for traits such as A8 and AQ10 indicates their substantial impact on predictions, suggesting that they act as key drivers of model outputs.
However, the disproportionate influence of certain behavioral traits—such as elevated Qchat-10 scores or delayed speech—raises important concerns about potential over-reliance on a narrow set of questionnaire-derived features. Although these traits have consistently demonstrated strong predictive value in previous ASD studies, their prominence in the model’s SHAP values highlights a key limitation: they may reflect underlying biases in how ASD is operationalized, rather than capturing the full heterogeneity of the condition. This underscores the importance of critically evaluating screening models and triangulating results with complementary data sources. Future iterations of the CARE framework should aim to incorporate biologically grounded and observational modalities—such as neuroimaging biomarkers, genetic data, or clinician-assessed behavioral metrics—to reduce single-source bias and improve diagnostic robustness across diverse populations.
The skewed dataset, with 72.9% of cases being ASD-positive, and demographic imbalances (e.g., overrepresentation of certain ethnicities and males) may limit the generalizability of the model. To address the issue of class imbalance in the dataset, we used a variety of resampling techniques during model development. These included oversampling methods such as the synthetic minority oversampling technique (SMOTE) and adaptive synthetic sampling (ADASYN), which generate synthetic samples for the minority class, and undersampling methods such as the random undersampling algorithm and the NearMiss algorithm, which strategically reduce the majority class to achieve balance. Additionally, advanced hybrid techniques, including SMOTE combined with edited nearest neighbors (SMOTE-ENN) and SMOTE combined with Tomek Links (SMOTE-Tomek), were employed to balance the dataset while mitigating noise and preserving data integrity. Other undersampling algorithms, such as the Tomek Links method, specifically addressed borderline cases by removing samples from the majority class that overlapped with the minority class.
Table 11 shows a detailed comparison of the performance metrics for all these methods. The original dataset (without any resampling) achieved the highest performance for the most important metrics, including accuracy (0.995), F1-score (0.996), and ROC-AUC (1.000). Although oversampling methods such as SMOTE and SMOTE-Tomek slightly improved recall, overall performance metrics were comparable to the original dataset. Undersampling methods, such as NearMiss and Tomek Links, resulted in lower MCC and Cohen’s Kappa scores, suggesting a loss of critical information when reducing the majority class. Hybrid techniques, including SMOTE-ENN, improved noise reduction but did not outperform the original dataset in terms of overall accuracy and F1-score. These results demonstrate that the original dataset provides sufficient information to train the CatBoost model and achieve robust predictions without the need for additional resampling techniques. This result reflects the model’s ability to effectively deal with the inherent skewness and reinforces the validity of the dataset for ASD classification tasks.
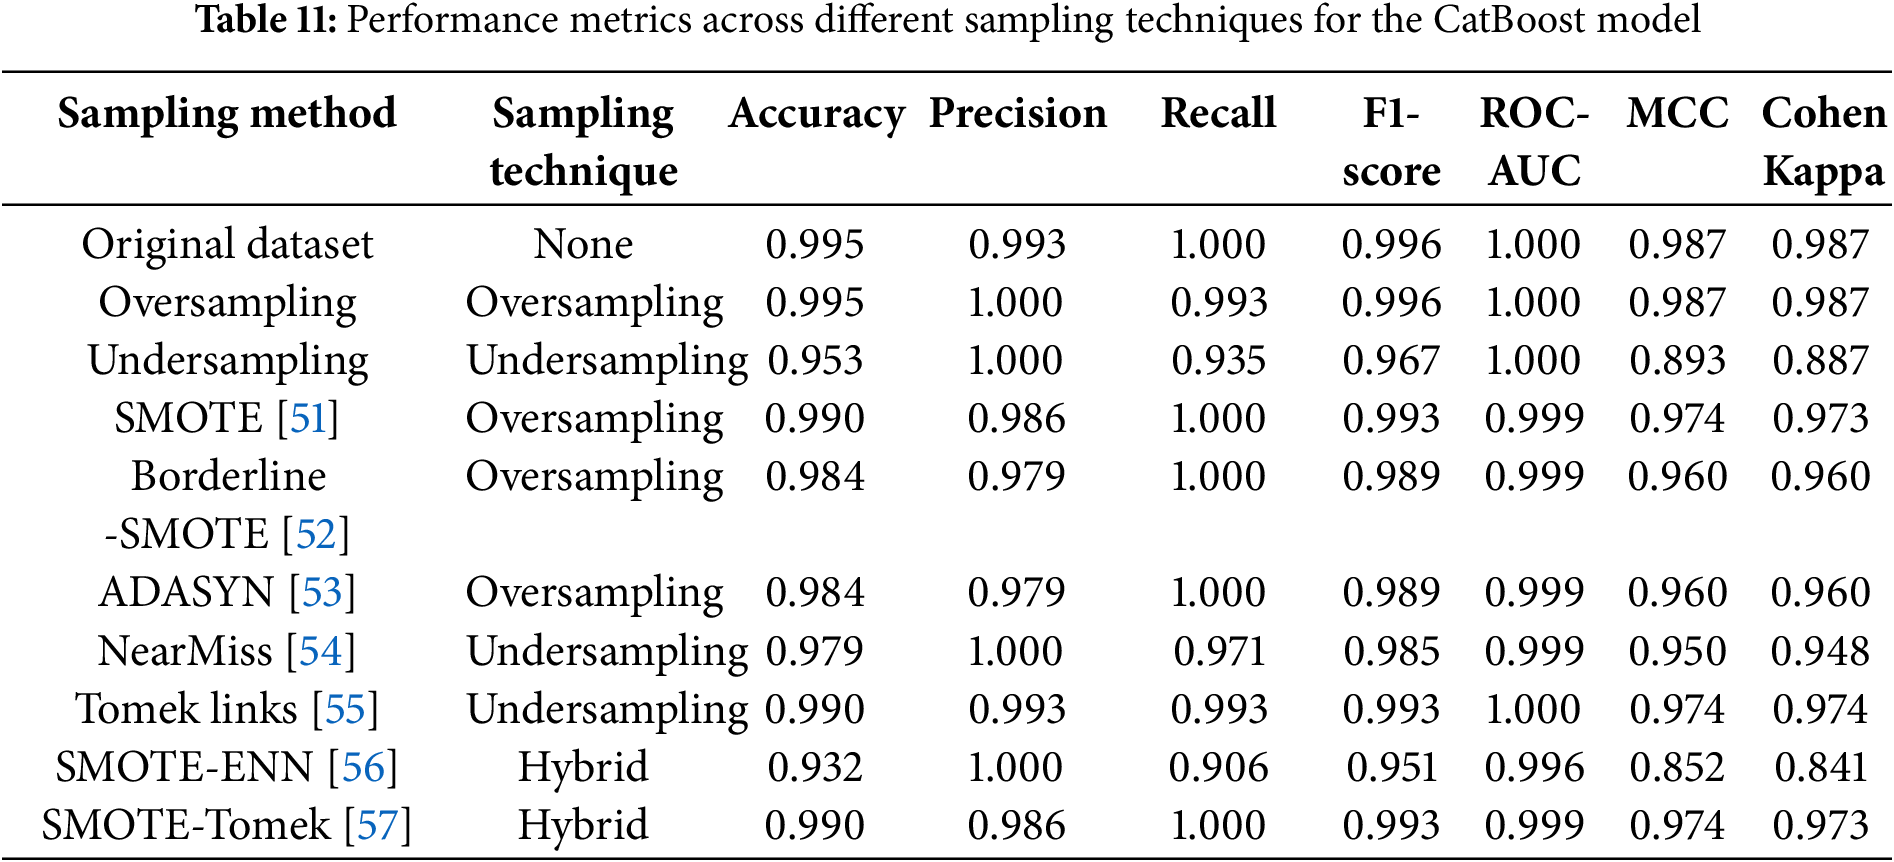
It is important to emphasize that this study is not intended to replace clinical expertise or provide a definitive diagnosis of ASD. Rather, the CARE framework is designed as an early screening tool to support initial assessments in non-clinical settings, such as schools, homes, or community centers. By identifying potential ASD characteristics through AI-powered analysis, this framework serves as a practical tool to guide families or caregivers to seek timely and appropriate clinical evaluations. To mitigate ethical concerns such as misclassification risk and over-reliance on automated tools, CARE is explicitly positioned as a clinician-supportive system rather than an autonomous diagnostic agent. For example, an AI-powered online questionnaire can help parents determine whether certain observed behaviors warrant further professional evaluation, but final interpretation is intentionally left to human experts.
Although the dataset used in this study was publicly available and fully anonymized prior to analysis, we recognize the continued importance of data privacy and ethical handling of sensitive information. The development of the CARE framework adhered to privacy-by-design principles, ensuring that personal data are neither collected nor processed at any stage of the system’s operation. Looking ahead, future deployments will incorporate additional safeguards to enhance data protection. For instance, federated learning could enable model training across decentralized data sources without transferring sensitive information, while on-device computation would allow all processing to occur locally on the user’s device. These strategies would further mitigate privacy risks and support compliance with data protection standards in both clinical and community-based settings.
The results of this study also highlight the importance of collaboration between AI tools and medical professionals. While AI can streamline the early detection process by identifying patterns in data and providing preliminary insights, interpretation and final decision-making must remain within the purview of trained clinicians who can integrate broader psychological, developmental, and contextual factors. AI tools such as the CARE framework are not intended to replace human expertise but rather to complement it by providing additional information that allows clinicians to focus on more complex and nuanced aspects of ASD diagnosis.
To strengthen the real-world applicability of the CARE framework, we obtained informal validation from two practicing clinicians—Seungsoo Kim, MD (Pediatrics), and Sehoon Shim, MD (Psychiatry)—who actively contributed to this project as co-investigators. Drawing on insights from their prior clinical research experience [31], their feedback directly informed the design of PyCaret outputs and SHAP visualizations to ensure interpretability for users without data science expertise. This collaborative process confirmed that the CARE framework’s outputs are readily comprehensible to clinical professionals and well-suited for integration into practical diagnostic workflows.
To address limitations, future research should focus on diversifying datasets to include more balanced demographics and richer data sources, such as neuroimaging or genetic markers, to better reflect the multifactorial nature of ASD [58–61]. In addition, to increase generalizability and allow for meaningful comparison with other studies, future research could test the CARE framework on established benchmark datasets where possible. Validation of the CARE framework in real-world clinical settings and exploration of its integration with advanced diagnostic tools will also be essential to ensure its utility as a scalable, supportive, and ethically grounded solution for the early detection of ASD.
Moreover, future studies should explore real-world applications, particularly in clinical settings, to evaluate the model utility for early ASD detection. Integrating real-time data collection methods, such as those in virtual reality (VR) environments, could provide a more dynamic approach to assessing user behavior and facial expressions, offering a unique perspective on ASD characteristics [62,63]. VR technology could allow researchers to collect behavioral and emotional data in more immersive contexts, further enhancing the model’s predictive capabilities. By leveraging these advances, future studies could contribute to developing more robust, scalable systems that bridge ML and VR technology for early ASD detection.
We introduced the CARE framework to potentially enhance early ASD diagnosis in children by integrating data preprocessing, EDA, advanced ML modeling, and XAI techniques. After refining the dataset to 634 samples and 19 variables, key behavioral traits (A7, A9, A8, and A1) were identified as significant ASD predictors. CatBoost demonstrated promising out-of-the-box performance, achieving an average accuracy of 99.37% while efficiently handling categorical data. Although AdaBoost slightly outperformed CatBoost with 99.84% accuracy, it required hyperparameter tuning using PyCaret’s AutoML tools, demonstrating the value of accessible platforms for non-experts.
Importantly, the CARE framework is not intended to replace clinical judgment but to serve as a complementary tool for early ASD screening. By providing explainable insights, it can help families, caregivers, and even educators identify potential ASD-related features, enabling them to contact healthcare professionals for timely evaluation. For clinicians, the framework provides interpretable, data-driven insights that can support more informed decision-making, especially when combined with traditional diagnostic methods. Consequently, future work should focus on the following:
Implementing techniques such as resampling or data augmentation to balance the dataset and improve model reliability.
• Exploring CatBoost parameter tuning to potentially improve performance without increasing user complexity.
• Including a broader range of demographics to improve generalizability across diverse populations.
• Adding data types such as neuroimaging or genetic markers for a more comprehensive assessment.
• Conducting real-world studies to assess the model’s value in clinical settings for early ASD detection.
Our results demonstrate that advanced ML models such as CatBoost, combined with user-friendly tools such as PyCaret and interpretability techniques such as SHAP, can potentially aid clinicians in the early diagnosis of ASD. While incorporating additional data sources such as various imaging techniques could further improve diagnostic accuracy, our approach provides a valuable framework for supporting informed decision making and potentially improving outcomes for children with ASD. Future research should prioritize broader demographic representation, real-world application, and integration with advanced data sources to ensure that these tools complement, rather than replace, the expertise of medical professionals.
Acknowledgement: The authors would like to thank Seungsoo Kim, MD and Sehoon Shim, MD of Soonchunhyang University Cheonan Hospital for their clinical feedback on the accessibility and interpretability of the CARE framework. Their contributions were based on collaborative work under the same project funding (see Funding Statement).
Funding Statement: This work was supported by the National Research Foundation of Korea (NRF) grant funded by the Korean government (MSIT) (No. RS-2023-00218176) and the Soonchunhyang University Research Fund.
Author Contributions: The authors confirm contribution to the paper as follows: Conceptualization, Jihoon Moon and Jiyoung Woo; methodology, Jihoon Moon; software, Jihoon Moon; validation, Jihoon Moon and Jiyoung Woo; formal analysis, Jihoon Moon; investigation, Jihoon Moon; resources, Jiyoung Woo; data curation, Jihoon Moon; writing—original draft preparation, Jihoon Moon; writing—review and editing, Jihoon Moon and Jiyoung Woo; visualization, Jihoon Moon; supervision, Jiyoung Woo; project administration, Jiyoung Woo; funding acquisition, Jiyoung Woo. All authors reviewed the results and approved the final version of the manuscript.
Availability of Data and Materials: The dataset utilized in this study, titled “ASD Children Traits”, is publicly accessible and can be obtained from Kaggle at the following URL: https://www.kaggle.com/datasets/uppulurimadhuri/dataset (accessed on 01 June 2024). Additional data supporting the results of this research, including the dataset and code for analysis, are available in the CARE-ASD-Modeling GitHub repository at https://github.com/johnnyone89/CARE-ASD-Modeling (accessed on 01 June 2024).
Ethics Approval: Ethical review and approval were waived for this study due to the use of publicly available data without any identifiable information.
Conflicts of Interest: The authors declare no conflicts of interest to report regarding the present study.
References
1. AlSalehi SM, Alhifthy EH. Autism spectrum disorder. In: Salih MA, editor. Clinical child neurology. Cham, Switzerland: Springer International Publishing; 2020. p. 275–92. doi:10.1007/978-3-319-43153-6_10. [Google Scholar] [CrossRef]
2. Petinou K, Christopoulou M, Antoniou K. Addressing multicultural and multilingual aspects in the assessment of individuals with autism spectrum disorder. In: Bortz M, editor. A guide to global language assessment. New York, NY, USA: Routledge; 2024. p. 289–304. doi:10.4324/9781003524472-19. [Google Scholar] [CrossRef]
3. Hadders-Algra M. Early diagnostics and early intervention in neurodevelopmental disorders—age-dependent challenges and opportunities. J Clin Med. 2021;10(4):861. doi:10.3390/jcm10040861. [Google Scholar] [PubMed] [CrossRef]
4. Francis K, Karantanos G, Al-Ozairi A, AlKhadhari S. Prevention in autism spectrum disorder: a lifelong focused approach. Brain Sci. 2021;11(2):151. doi:10.3390/brainsci11020151. [Google Scholar] [PubMed] [CrossRef]
5. Young S, Hollingdale J, Absoud M, Bolton P, Branney P, Colley W, et al. Guidance for identification and treatment of individuals with attention deficit/hyperactivity disorder and autism spectrum disorder based upon expert consensus. BMC Med. 2020;18(1):146. doi:10.1186/s12916-020-01585-y. [Google Scholar] [PubMed] [CrossRef]
6. Hus Y, Segal O. Challenges surrounding the diagnosis of autism in children. Neuropsychiatr Dis Treat. 2021;17:3509–29. doi:10.2147/NDT.S282569. [Google Scholar] [PubMed] [CrossRef]
7. Joudar SS, Albahri AS, Hamid RA, Zahid IA, Alqaysi ME, Albahri OS, et al. Artificial intelligence-based approaches for improving the diagnosis, triage, and prioritization of autism spectrum disorder: a systematic review of current trends and open issues. Artif Intell Rev. 2023;56:53–117. doi:10.1007/s10462-022-10200-6. [Google Scholar] [CrossRef]
8. Cinteza E, Vasile CM, Busnatu S, Armat I, Spinu AD, Vatasescu R, et al. Can artificial intelligence revolutionize the diagnosis and management of the atrial septal defect in children? Diagnostics. 2024;14(2):132. doi:10.3390/diagnostics14020132. [Google Scholar] [PubMed] [CrossRef]
9. Giansanti D. An umbrella review of the fusion of fMRI and AI in autism. Diagnostics. 2023;13(23):3552. doi:10.3390/diagnostics13233552. [Google Scholar] [PubMed] [CrossRef]
10. Koul AM, Ahmad F, Bhat A, Aein Q, Ahmad A, Reshi AA, et al. Unraveling down syndrome: from genetic anomaly to artificial intelligence-enhanced diagnosis. Biomedicines. 2023;11(12):3284. doi:10.3390/biomedicines11123284. [Google Scholar] [PubMed] [CrossRef]
11. Jyoti O, Islam N, Faruq MO, Siddique MAI, Rahaman MH. Autism spectrum disorder prognosis using machine learning algorithms: a comparative study. In: Nguyen NT, Tojo S, editors. Intelligent computing and optimization. Cham, Switzerland: Springer; 2024. p. 754–65 doi:10.1007/978-3-030-68154-8_65. [Google Scholar] [CrossRef]
12. Rudin C. Stop explaining black box machine learning models for high stakes decisions and use interpretable models instead. Nat Mach Intell. 2019;1(5):206–15. doi:10.1038/s42256-019-0048-x. [Google Scholar] [PubMed] [CrossRef]
13. Antoniadi AM, Du Y, Guendouz Y, Wei L, Mazo C, Becker BA, et al. Current challenges and future opportunities for XAI in machine learning-based clinical decision support systems: a systematic review. Appl Sci. 2021;11(11):5088. doi:10.3390/app11115088. [Google Scholar] [CrossRef]
14. Amann J, Blasimme A, Vayena E, Frey D, Madai VI, Precise4Q Consortium. Explainability for artificial intelligence in healthcare: a multidisciplinary perspective. BMC Med Inform Decis Mak. 2020;20(1):310. doi:10.1186/s12911-020-01332-6. [Google Scholar] [PubMed] [CrossRef]
15. Kamel Rahimi A, Pienaar O, Ghadimi M, Canfell OJ, Pole JD, Shrapnel S, et al. Implementing AI in hospitals to achieve a learning health system: systematic review of current enablers and barriers. J Med Internet Res. 2024;26:e49655. doi:10.2196/49655. [Google Scholar] [PubMed] [CrossRef]
16. Tyagi B, Mishra R, Bajpai N. Machine learning techniques to predict autism spectrum disorder. In: Proceedings of the 2018 IEEE Punecon; 2018 Nov 30–Dec 2; Pune, India. Piscataway, NJ, USA: IEEE; 2018. p. 1–5. doi:10.1109/PUNECON.2018.8745405. [Google Scholar] [CrossRef]
17. Altay O, Ulas M. Prediction of the autism spectrum disorder diagnosis with linear discriminant analysis classifier and K-nearest neighbor in children. In: Proceedings of the 6th International Symposium on Digital Forensic and Security (ISDFS); 2018 Mar 22–25; Antalya, Turkey. Piscataway, NJ, USA: IEEE; 2018. p. 1–4. doi:10.1109/ISDFS.2018.8355354. [Google Scholar] [CrossRef]
18. Omar KS, Alsharif MH, Alzubi JA, Alsharif RA, Alsharif MH. A machine learning approach to predict autism spectrum disorder. In: Proceedings of the 2019 International Conference on Electrical, Computer and Communication Engineering (ECCE); 2019 Feb 7–9; Cox’s Bazar, Bangladesh. Piscataway, NJ, USA: IEEE; 2019. p. 1–6. doi:10.1109/ECACE.2019.8679430. [Google Scholar] [CrossRef]
19. Varshini GD, Chinnaiyan R. Optimized machine learning classification approaches for prediction of autism spectrum disorder. Ann Autism Dev Disord. 2020;1(1):1001. [Google Scholar]
20. Alwidian J, Elhassan A, Ghnemat R. Predicting autism spectrum disorder using machine learning technique. Int J Recent Technol Eng. 2020;8(5):4139–43. doi:10.35940/ijrte.e6016.018520. [Google Scholar] [CrossRef]
21. Chowdhury K, Iraj MA. Predicting autism spectrum disorder using machine learning classifiers. In: Proceedings of the 2020 International Conference on Recent Trends on Electronics, Information, Communication & Technology (RTEICT); 2020 Nov 12–13; Bangalore, India. Piscataway, NJ, USA: IEEE; 2020. p. 324–7. doi:10.1109/RTEICT49044.2020.9315672. [Google Scholar] [CrossRef]
22. Musa RA, Manaa ME, Abdul-Majeed G. Predicting autism spectrum disorder (ASD) for toddlers and children using data mining techniques. J Phys Conf Ser. 2021;1804(1):012089. doi:10.1088/1742-6596/1804/1/012089. [Google Scholar] [CrossRef]
23. Garg A, Sharma A, Singh P, Kumar R, Kaur M. Autism spectrum disorder prediction by an explainable deep learning approach. Comput Mater Contin. 2022;71(1):1459–71. doi:10.32604/cmc.2022.019556. [Google Scholar] [CrossRef]
24. Albahri AS, Hamid RA, Zaidan AA, Albahri OS, Zaidan BB, Al-Qaysi N, et al. Early automated prediction model for the diagnosis and detection of children with autism spectrum disorders based on effective sociodemographic and family characteristic features. Neural Comput Appl. 2023;35(1):921–47. doi:10.1007/s00521-022-07822-0. [Google Scholar] [CrossRef]
25. Abdelwahab MM, Al-Karawi KA, Hasanin E, Semary H. Autism spectrum disorder prediction in children using machine learning. J Disabil Res. 2024;3(1):20230064. doi:10.57197/JDR-2023-0064. [Google Scholar] [CrossRef]
26. Ding Y, Zhang H, Qiu T. Deep learning approach to predict autism spectrum disorder: a systematic review and meta-analysis. BMC Psychiatry. 2024;24(1):739. doi:10.1186/s12888-024-06116-0. [Google Scholar] [PubMed] [CrossRef]
27. Kasri W, Himeur Y, Copiaco A, Mansoor W, Albanna A, Eapen V. Hybrid vision transformer-mamba framework for autism diagnosis via eye-tracking analysis. arXiv:2506.06886. 2025. [Google Scholar]
28. Liu X, Hasan MR, Gedeon T, Hossain MZ. MADE-for-ASD: a multi-atlas deep ensemble network for diagnosing autism spectrum disorder. arXiv:2407.07076. 2024. [Google Scholar]
29. Serna-Aguilera M, Nguyen XB, Singh A, Rockers L, Park SW, Neely L, et al. Video-based autism detection with deep learning. arXiv:2402.16774. 2024. [Google Scholar]
30. Uppuluri M. ASD children traits. Kaggle [Internet]; 2024 [cited 2025 Jul 10]. Available from: https://www.kaggle.com/datasets/uppulurimadhuri/dataset. [Google Scholar]
31. Jeon I, Kim M, So D, Kim EY, Nam Y, Kim S, et al. Reliable autism spectrum disorder diagnosis for pediatrics using machine learning and explainable AI. Diagnostics. 2024;14(22):2504. doi:10.3390/diagnostics14222504. [Google Scholar] [PubMed] [CrossRef]
32. Alam MS, Chakraborty T. Understanding the nexus between public risk perception of COVID-19 and evacuation behavior during cyclone Amphan in Bangladesh. Heliyon. 2021;7(7):e07655. doi:10.1016/j.heliyon.2021.e07655. [Google Scholar] [PubMed] [CrossRef]
33. Shinba T, Kuratsune D, Shinba S, Shinba Y, Sun G, Matsui T, et al. Major depressive disorder and chronic fatigue syndrome show characteristic heart rate variability profiles reflecting autonomic dysregulations: differentiation by linear discriminant analysis. Sensors. 2023;23(11):5330. doi:10.3390/s23115330. [Google Scholar] [PubMed] [CrossRef]
34. Prokhorenkova L, Gusev G, Vorobev A, Dorogush AV, Gulin A. CatBoost: unbiased boosting with categorical features. Adv Neural Inf Process Syst. 2018;31:6638–48. [Google Scholar]
35. Hancock JT, Khoshgoftaar TM. Survey on categorical data for neural networks. J Big Data. 2020;7(1):28. doi:10.1186/s40537-020-00305-w. [Google Scholar] [CrossRef]
36. Pemila M, Pongiannan RK, Narayanamoorthi R, AboRas MA, Youssef A. Application of an ensemble CatBoost model over complex dataset for vehicle classification. PLoS One. 2024;19(6):e0304619. doi:10.1371/journal.pone.0304619. [Google Scholar] [PubMed] [CrossRef]
37. Cai Y, Yuan Y, Zhou A. Predictive slope stability early warning model based on CatBoost. Sci Rep. 2024;14(1):25727. doi:10.1038/s41598-024-77058-6. [Google Scholar] [PubMed] [CrossRef]
38. Radzi SFM, Karim MKA, Saripan MI, Rahman MAA, Isa INC, Ibahim MJ. Hyperparameter tuning and pipeline optimization via grid search method and tree-based AutoML in breast cancer prediction. J Pers Med. 2021;11(10):978. doi:10.3390/jpm11100978. [Google Scholar] [PubMed] [CrossRef]
39. Gul S, Ayturan K, Hardalaç F. PyCaret for predicting type 2 diabetes: a phenotype- and gender-based approach with the nurses’ health study and the health professionals’ follow-up study datasets. J Pers Med. 2024;14(8):804. doi:10.3390/jpm14080804. [Google Scholar] [PubMed] [CrossRef]
40. Westergaard G, Erden U, Mateo OA, Lampo SM, Akinci TC, Topsakal O. Time series forecasting utilizing automated machine learning (automla comparative analysis study on diverse datasets. Information. 2024;15(1):39. doi:10.3390/info15010039. [Google Scholar] [CrossRef]
41. Lundberg SM, Lee SI. A unified approach to interpreting model predictions. Adv Neural Inf Process Syst. 2017;30:4765–74. [Google Scholar]
42. Cremades A, Hoyas S, Vinuesa R. Additive-feature-attribution methods: a review on explainable artificial intelligence for fluid dynamics and heat transfer. Int J Heat Fluid Flow. 2025;112(4):109662. doi:10.1016/j.ijheatfluidflow.2024.109662. [Google Scholar] [CrossRef]
43. Jang J, Jeong W, Kim S, Lee B, Lee M, Moon J. RAID: robust and interpretable daily peak load forecasting via multiple deep neural networks and Shapley values. Sustainability. 2023;15(8):6951. doi:10.3390/su15086951. [Google Scholar] [CrossRef]
44. CatBoost. Grid search [Internet]. [cited 2025 Jul 9]. Available from: https://catboost.ai/en/docs/concepts/python-reference_catboost_grid_search. [Google Scholar]
45. Pedregosa F, Varoquaux G, Gramfort A, Michel V, Thirion B, Grisel O, et al. Scikit-learn: machine learning in python. J Mach Learn Res. 2011;12(85):2825–30. [Google Scholar]
46. Zheng A, Zhu H, Hu X, Yang L. Using feature selection techniques to investigate the myth of autism spectrum disorder. Int J Future Comput Commun. 2023;12(4):93–9. doi:10.1109/ICDPA.2023.10123456. [Google Scholar] [CrossRef]
47. Leeon SI, Sunaira FH, Nehlin S, Abdal SAMZ, Momen S. A machine learning approach for early detection of learning disorders in pediatrics. In: Proceedings of the 2024 International Conference on Advances in Computing, Communication, Electrical, and Smart Systems (iCACCESS); 2024 Mar 8–9; Dhaka, Bangladesh; 2024. p. 1–6. doi:10.1109/iCACCESS61735.2024.10499515. [Google Scholar] [CrossRef]
48. Dikbaş S, Arslan S. Classification by feature selection of autism spectrum disorder with automatic programming methods. In: Proceedings of the 2023 Innovations in Intelligent Systems and Applications Conference (ASYU); 2023 Oct 11–13; Sivas, Türkiye; 2023. p. 1–5. doi:10.1109/ASYU.2023.10456789. [Google Scholar] [CrossRef]
49. Bonete S, Molinero C, Ruisanchez D. Emotional dysfunction and interoceptive challenges in adults with autism spectrum disorders. Behav Sci. 2023;13(4):312. doi:10.3390/bs13040312. [Google Scholar] [PubMed] [CrossRef]
50. Navarro-Pardo E, López-Ramón MF, Alonso-Esteban Y, Alcantud-Marín F. Diagnostic tools for autism spectrum disorders by gender: analysis of current status and future lines. Children. 2021;8(4):262. doi:10.3390/children8040262. [Google Scholar] [PubMed] [CrossRef]
51. Chawla NV, Bowyer KW, Hall LO, Kegelmeyer WP. SMOTE: synthetic minority over-sampling technique. J Artif Intell Res. 2002;16:321–57. doi:10.1613/jair.953. [Google Scholar] [CrossRef]
52. Han H, Wang WY, Mao BH. Borderline-SMOTE: a new over-sampling method in imbalanced data sets learning. In: Huang DS, Heutte L, Loog M, editors. Intelligent computing: lecture notes in computer science. Vol. 3644. Berlin/Heidelberg, Germany: Springer; 2005. p. 878–87. doi:10.1007/11538059_91. [Google Scholar] [CrossRef]
53. He H, Bai Y, Garcia EA, Li S. ADASYN: adaptive synthetic sampling approach for imbalanced learning. In: Proceedings of the 2008 IEEE International Joint Conference on Neural Networks (IEEE World Congress on Computational Intelligence); 2008 Jun 1–6; Hong Kong, China: IEEE; 2008. p. 1322–8. doi:10.1109/IJCNN.2008.4633969. [Google Scholar] [CrossRef]
54. Yen SJ, Lee YS. Under-sampling approaches for improving prediction of the minority class in an imbalanced dataset. In: Huang DS, Li K, Irwin GW, editors. Intelligent control and automation: lecture notes in control and information sciences. Vol. 344. Berlin/Heidelberg, Germany: Springer; 2006. p. 731–40. doi:10.1007/978-3-540-37256-1_89. [Google Scholar] [CrossRef]
55. Devi D, Purkayastha B. Redundancy-driven modified Tomek-link based undersampling: a solution to class imbalance. Pattern Recognit Lett. 2017;93:3–12. doi:10.1016/j.patrec.2017.01.007. [Google Scholar] [CrossRef]
56. Nishat MM, Faisal F, Ratul IJ, Al-Monsur A, Ar-Rafi AM, Nasrullah SM, et al. A comprehensive investigation of the performances of different machine learning classifiers with SMOTE-ENN oversampling technique and hyperparameter optimization for imbalanced heart failure dataset. Sci Program. 2022;2022(5):3649406. doi:10.1155/2022/3649406. [Google Scholar] [CrossRef]
57. Jonathan B, Putra PH, Ruldeviyani Y. Observation imbalanced data text to predict users selling products on female daily with SMOTE, Tomek, and SMOTE-Tomek. In: Proceedings of the 2020 IEEE International Conference on Industry 4.0, Artificial Intelligence, and Communications Technology (IAICT); 2020 Jul 27–29; Bali, Indonesia; 2020. p. 81–5. doi:10.1109/IAICT50021.2020.9172033. [Google Scholar] [CrossRef]
58. ASD-fMRI Dataset. Kaggle [Internet]. [cited 2025 Jul 9]. Available from: https://www.kaggle.com/datasets/mhkoosheshi/asdfmri. [Google Scholar]
59. Di Martino A, Mostofsky SH, Milham MP. Autism brain imaging data exchange (ABIDE) [Internet]. [cited 2025 Jul 9]. Available from: http://fcon_1000.projects.nitrc.org/indi/abide/. [Google Scholar]
60. ASD Children Blood Gene Expression Data. Kaggle [Internet]. [cited 2025 Jul 9]. Available from: https://www.kaggle.com/datasets/gokulbabyalex/asdchildrenbloodgeneexpressiondata. [Google Scholar]
61. Human Gut Microbiome with ASD Dataset. Kaggle [Internet]. [cited 2025 Jul 9]. Available from: https://www.kaggle.com/datasets/antaresnyc/human-gut-microbiome-with-asd. [Google Scholar]
62. Zhang M, Ding H, Naumceska M, Zhang Y. Virtual reality technology as an educational and intervention tool for children with autism spectrum disorder: current perspectives and future directions. Behav Sci. 2022;12(5):138. doi:10.3390/bs12050138. [Google Scholar] [PubMed] [CrossRef]
63. Alcañiz Raya M, Marín-Morales J, Minissi ME, Teruel Garcia G, Abad L, Chicchi Giglioli IA. Machine learning and virtual reality on body movements’ behaviors to classify children with autism spectrum disorder. J Clin Med. 2020;9(5):1260. doi:10.3390/jcm9051260. [Google Scholar] [PubMed] [CrossRef]
Cite This Article
 Copyright © 2025 The Author(s). Published by Tech Science Press.
This work is licensed under a Creative Commons Attribution 4.0 International License , which permits unrestricted use, distribution, and reproduction in any medium, provided the original work is properly cited.
 Downloads
 Citation Tools