
 Submit a Paper
 Propose a Special lssue
 Open Access
ARTICLE
Marine Ship Detection Based on Twin Feature Pyramid Network and Spatial Attention
College of Computer Science and Technology, Nanjing University of Aeronautics and Astronautics, Nanjing, 211106, China
* Corresponding Author: Yu Zhou. Email:
Computers, Materials & Continua 2025, 85(1), 751-768. https://doi.org/10.32604/cmc.2025.067867
Received 14 May 2025; Accepted 17 July 2025; Issue published 29 August 2025
 View Full Text
 Download PDF
Abstract
Recently, ship detection technology has been applied extensively in the marine security monitoring field. However, achieving accurate marine ship detection still poses significant challenges due to factors such as varying scales, slightly occluded objects, uneven illumination, and sea clutter. To address these issues, we propose a novel ship detection approach, i.e., the Twin Feature Pyramid Network and Data Augmentation (TFPN-DA), which mainly consists of three modules. First, to eliminate the negative effects of slightly occluded objects and uneven illumination, we propose the Spatial Attention within the Twin Feature Pyramid Network (SA-TFPN) method, which is based on spatial attention to reconstruct the feature pyramid. Second, the ROI Feature Module (ROIFM) is introduced into the SA-TFPN, which is used to enhance specific crucial details from multi-scale features for object regression and classification. Additionally, data augmentation strategies such as spatial affine transformation and noise processing, are developed to optimize the data sample distribution. A self-construct dataset is used to train the detection model, and the experiments conducted on the dataset demonstrate the effectiveness of our model.Keywords
Recently, marine ship detection based on high-resolution optical remote sensing imagery has been widely applied in various fields, such as security monitoring and fisheries management [1,2]. Enhancing the monitoring of marine ships has been proven to generate huge economic benefits.
Extensive efforts have been made in this field. In the early stages, researchers employed methods such as morphological segmentation [3], visual saliency [4], and template matching [5]. These methods manually extracted prior features, such as color, grayscale, edges, contours, and key points. Additionally, a series of convolutional neural network (CNN)-based methods, such as Region-based CNN (R-CNN), Faster-RCNN, and You Only Look Once (YOLO), were proposed for object detection.
Although various attempts have been made for ship detection, their performance has remained unsatisfactory, primarily because they failed to consider the complexity of maritime environments, including complex background and uneven ship distribution [6]. First, optical remote sensing images are susceptible to variations in lighting conditions, viewing angles, and terrain, resulting in uneven illumination and object occlusion. Optimal remote sensing images contend with inherent challenges, including the impact of natural elements such as clouds, atmosphere, dust, and lighting, which introduce noise and fuzziness into the collected data. Additionally, when detected objects bear resemblances in color and shape to the background, there arises a susceptibility to misidentification and misjudgment. Second, the uneven distribution of marine ships, especially small ships that occupy only a limited number of pixels, poses a challenge to accurate recognition and precise localization. Additionally, some ships are closely positioned and form a cluster, resulting in diverse shapes of ship objects in the image, posing a greater demand for precise localization.
To address these challenges, we developed the TFPN-DA method, which consists of three modules. Firstly, we replaced the conventional FPN detector with the SA-TFPN detector, enhancing the optimization of semantic and spatial information for objects of varying scales. This facilitated the reconstruction of object scale distributions and shape occlusions, thereby improving the recognition capabilities for slightly occluded ship objects. Secondly, we employed the ROIFM to fuse crucial ROI layer features across multiple scales, addressing the limitations of expressing multi-scale features in a single ROI layer. Finally, we integrated data augmentation methods to enhance training and expedite convergence for superior performance.
1. In this paper, the effectiveness and stability of the proposed method are validated through extensive experiments on our self-integrated dataset. To summarize, the main contributions of the paper are as follows:
2. To effectively address issues such as incomplete objects and low illumination, we propose the SA-TFPN method. This method leverages spatial attention mechanisms to prioritize incomplete objects and facilitates the extraction of global context information from local regions, thereby enhancing the overall efficiency of object detection.
3. Considering the diverse features of multi-scale objects, the ROIFM is proposed. This innovative technique leverages multiple ROI information for mutual sharing, thereby facilitating the effective fusion of object details.
The employed data augmentation method significantly extends the dataset and balances the categories.The R-CNN network was the first attempt to apply deep learning technology to object detection. Girshick et al. [7] introduced the R-CNN for object detection, which utilized convolution operations to extract regional object features and combined a support vector machine for object classification with anchor box regression. The approach was refined by employing Fast R-CNN [8], incorporating ROI pooling layers and multi-task loss functions. However, the generation of numerous candidate boxes impacted detection efficiency. To address the issue, Ren et al. [9] proposed Faster R-CNN, which significantly improved detection accuracy. The Faster R-CNN object detection framework comprises three main components: feature extraction, candidate region generation, and regression and classification. Typically, feature extraction modules employ ResNet or VGG, while candidate region generation employs RPN to generate anchor boxes for feature points which would be iteratively refined. The classification and regression modules perform iterative fine-tuning on candidate regions to output predictions. Other major types of networks, for instance, the Single-Shot multi-box Detector (SSD) [10] and YOLO [11], which learn locations and categories simultaneously. Nonetheless, challenges such as false positives still exist which need further research to enhance detection accuracy.
To deal with the limitation of Faster R-CNN, researchers have proposed further improvements. Lin et al. [12] proposed the Feature Pyramid Network (FPN), which is widely used in many advanced models as one of the multi-scale feature fusion methods to construct feature pyramids. Recent studies have shown that a top-down connection between shallow layer and deep layer feature maps could have a positive effect on object detection [3]. The shallow layer features typically lack abstract semantic information but contain rich geometric details. In contrast, while semantically rich, suffer from low resolution and the loss of fine details due to excessive down-sampling. Consequently, weak small objects tend to rely on shallow features and are predicted by detectors with smaller receptive fields. In contrast, large objects are better captured by detectors with larger receptive fields [13]. Although the FPN methods can improve the accuracy of object detection, some objects, especially small ones, may still be missed.
To improve the accuracy of small object detection and better capture semantic information, Chen et al. [14] proposed a dual-bottleneck sub-convolutional network to extract shallow features from a multi-scale image pyramid, aiming to decrease the loss of detail caused by the continuous down-sampling operations and spatial position quantization. Gong et al. [15] proposed a novel fusion factor that depends on the number of objects in each layer to control the information delivered from deep layers to shallow layers, thus adapting FPN for tiny object detection. Cao et al. [16] introduced a high-level semantic network to solve the semantic gap of different feature maps, which increases the possibility of re-organizing the deep-layer features. AugFPN [17] pointed out several design flaws in the feature pyramid of FPN and addressed them through consistency supervision, residual feature enhancement, and soft ROI selection methods. Nas-FPN [18] explored the use of AutoML to find the best combination method for each layer of feature fusion. Tan et al. [19] proposed the weighted feature fusion of BiFPN to enhance multilayered scaled features expression. AR-FPN was designed to capture position-sensitive map for each level, enhancing the pixel-wise interest degree and making the differences among levels more distinctive [20].
Except for the existing FPN-based feature extraction network structure, various attention mechanisms have been introduced to better capture weak small object by providing better pixel-level filtering of sample features. These attention mechanisms are considered effective in suppressing color deviation errors and noise generation [21], making them suitable for solving the problem of the low recognition rates caused by slight occlusion or incomplete features in object recognition of remote sensing images. Channel attention is employed in deep learning to analyze both deep and shallow layer features, allowing for the modeling of correlations between channels. This approach enhances feature performance by enabling the neural network to allocate attention to relevant channels while suppressing irrelevant ones. Spatial attention analyzes the differences within the same distribution of deep and shallow feature information, helping to filter out irrelevant deep features. Hu et al. [22] proposed a channel feature recalibration method SENet to improve network performance by compressing feature space and learning correlation weights for each feature channel. Convolutional Block Attention Module (CBAM) [15,23] focused on both spatial and channel features to improve the representation capabilities of the CNN network, which was applied in fields like Video Summarization [24], Faulty Prognostic Modelling [25], Person ReID [26], Digital Forensics [27], SAR signals [28]. Xue et al. [27] proposed Attention-based Two-Pathway Densely Connected Convolutional Networks (ATP-DenseNet) to identify the gender of handwriting, which utilizes feature pyramid in ATP-DenseNet to extract hierarchical page features and fuses CBAM with densely connected blocks to extract the word features. HDRANet with residual learning for SAR despeckling was proposed to remove speckle noise from original Synthetic Aperture Radar (SAR) images effectively and efficiently [28]. Cui et al. [2] proposed the Dense Attention Pyramid Network (DAPN) method and adopted a pyramid structure, which densely connects CBAM to each concatenated feature map from top to bottom of the pyramid network. Zhang et al. [29] proposed Split-Attention in the backbone network, which uses group convolution and split-weighted methods to optimize extracted features.
However, the performance of the attention-based detection model is heavily dependent on the relative weights of complete information in each channel, which is unsuitable for inferring the complete context from local features.
Inspired by the above research, we aim to improve the limited ability of recognizing slightly occluded ship objects by optimizing the Faster R-CNN. Specifically, we enhance the semantic information of different scale objects using spatial attention and re-construct the object scales, shape, occlusion information in the two feature pyramids. The proposed TFPN-DA method could make full use of guiding roles of lower layers’ spatial information in FPN-1 delivering to the whole layer in another FPN (FPN-2). Additionally, it enhances the training dataset distribution to address the challenges of identifying varying scaled and occluded marine ships in complex background.
To address the limitations of traditional Faster R-CNN in extracting features from occluded marine ships, we propose the Twin Feature Pyramid Network and Data Augmentation (TFPN-DA) method, as shown in Fig. 1. Recent research [21] has demonstrated the efficacy of integrating the group convolution mechanism and split attention. This integration effectively extracts object feature details by implementing channel-wise attention across distinct network branches. By leveraging this approach, the network significantly improves its ability to capture cross-feature interactions and learn diverse representations.
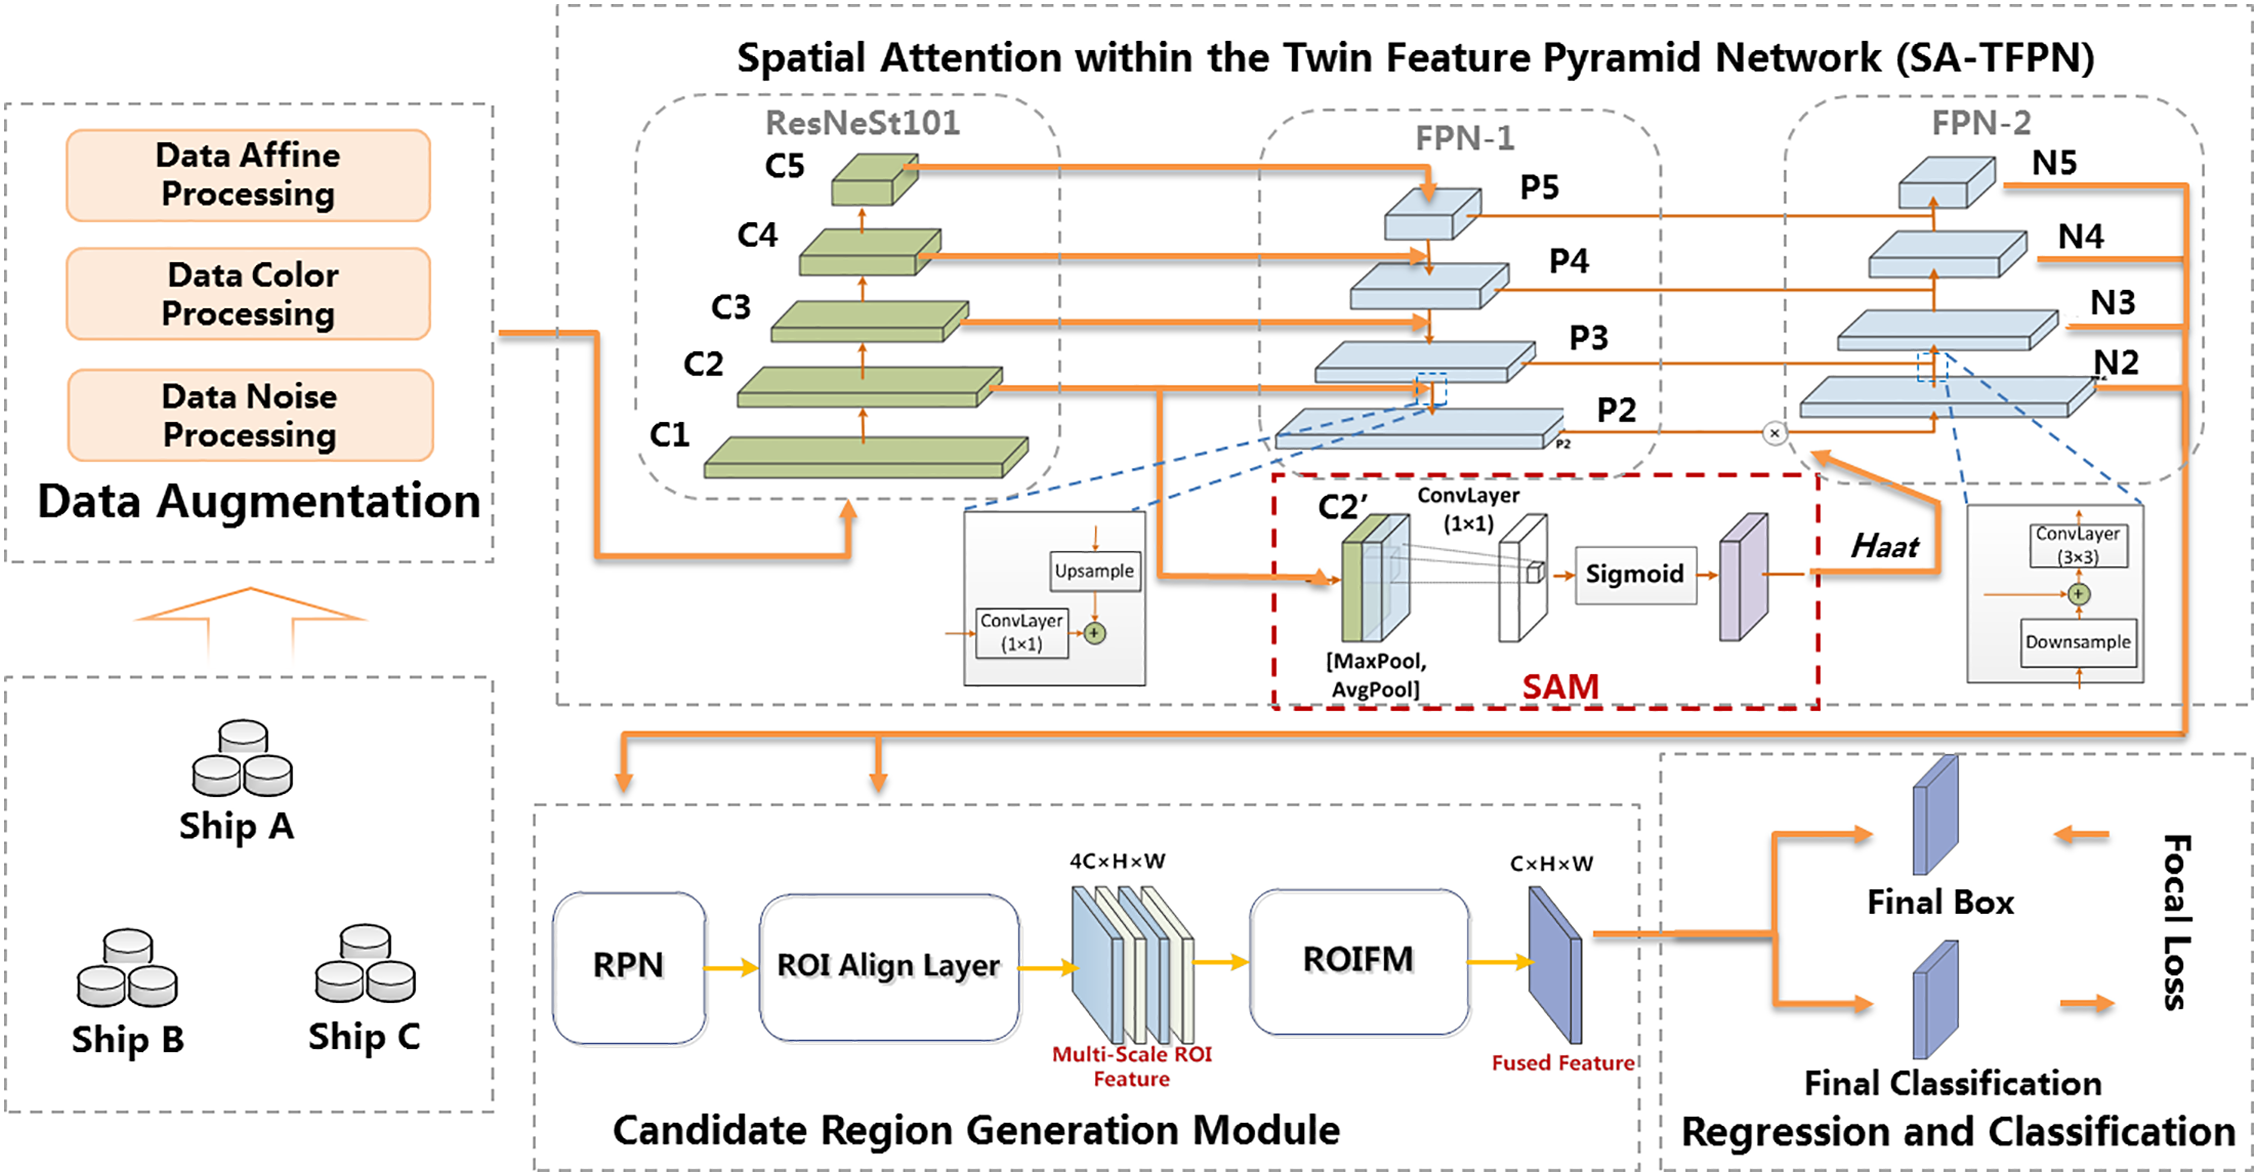
Figure 1: The pipeline of marine ship detection
In our work, we specifically choose ResNeSt101 as the backbone feature extraction network. To enhance the overall feature extraction process, we incorporate the use of a FPN (FPN-1) to streamline the fusion path between lower-level and top-level features. In the pursuit of improving the detection performance under challenging conditions, such as occlusion and varying illumination, the SA-TFPN method has been devised to amplify object features through the application of attention mechanisms on regions with deficient features. Notably, the feature maps within the C2 layer of the backbone network harbor intricate spatial attention details, particularly concerning incomplete objects. Spatial attention information enhances features related to occluded objects. Our approach leverages spatial attention to bolster the output of FPN-1 and the reconstruction of FPN-2. This enables a balanced distribution of semantic information across different scales and occluded objects, thereby improving detection capabilities under challenging environmental conditions.
We design a multi-scale ROI fusion module (ROIFM). The traditional method of selecting a scale feature layer for ROI pooling based on the size of candidate boxes may result in ROI lacking multi-scale information and potentially losing crucial details. By using a multi-scale ROI fusion module, we extract multi-scale feature information for objects of different sizes. These features are then fused into a layer feature map that encompasses objects of all sizes (fused feature), overcoming the limitations of weak representation in multi-scale ROI feature maps.
In addition, we optimize the data sample distribution to obtain the diversity requirements of the model for collected samples. To address issues such as the imbalance of data categories in the experimental dataset, we utilize data augmentation strategies, including affine transformation, color processing, and noise injection.
To enhance the diversity of the object features and focus on crucial local features for addressing the low recognition under occlusion and lighting conditions, we propose the spatial attention within the Twin Feature Pyramid Network (SA-TFPN) method as shown in the Fig. 1.
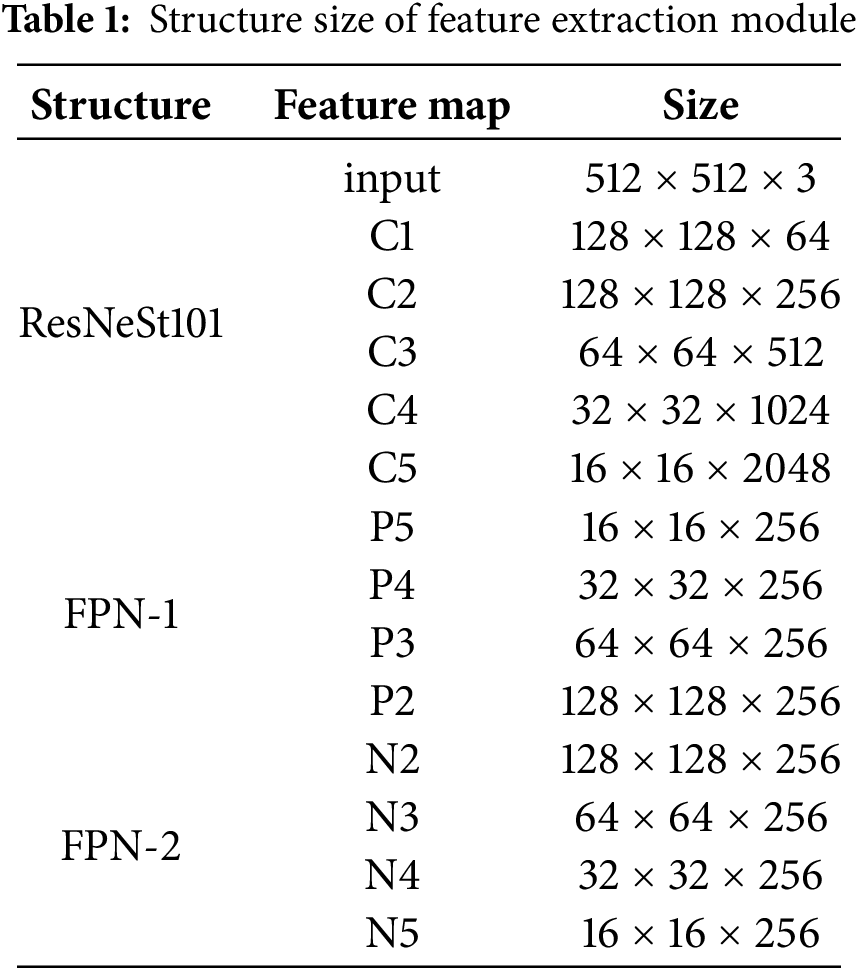
First, the challenges of the small object detection are often attributed to the limited distinctiveness of feature distributions within the backbone network. In response, we optimize the backbone network by implementing a group convolution mechanism. This technique involves multiple group convolutional layers and split attention blocks, enabling feature map attention across different groups. The ResNeSt101 and FPN-1 are employed as the backbone for feature extraction to improve the feature distribution distinctiveness mentioned in Contribution 1. Initially, feature maps C1, C2, C3, C4, and C5 are generated by ResNeSt101 from remote sensing images.
Second, we accentuate the feature layer from FPN-1 and reconstruct an additional FPN (FPN-2) from bottom to top. The FPN-1 fully exploits the high-resolution and rich-information shallow features, merging multiple scale feature layers from top to bottom. We propagate spatial attention characteristics to all scale features and fuse the output of FPN-1 with spatial attention characteristics using a bottom-up approach to reconstruct the FPN-2, iteratively forming multi-scale features. Similar to the attention enhancement mechanism in SENet, we introduce an enhancement mechanism to focus more on local visible regions while concerning occluded areas, which could mitigate the weak positive impact caused by the uneven distribution of object scales and incomplete shape. The implementation process of FPN-2 reconstruction is as follows.
(1) Feature maps C1, C2, C3, C4, and C5 are generated by ResNeSt101 from remote sensing images. Subsequently, FPN-1 performs a series of top-down convolution operations to obtain P2, P3, P4, and P5 feature maps.
(2) Given that the C2 layer effectively describes ship positional features with a wide receptive field and generates spatial attention information, we incorporate the attention distribution, which represents the positional weights of each feature point from the spatial attention module. Here, the Spatial Attention Module (SAM) is applied.
As illustrated in Fig. 2, global average pooling and maximum pooling are applied to the C2 feature map of ResNeSt101, followed by concatenation to form the feature map C2′. Subsequently, a 1 × 1 convolution operation is applied to C2 with a single-channel convolutional kernel. The resulting values are transformed into the range [0, 1] through a sigmoid function and used as final weights.
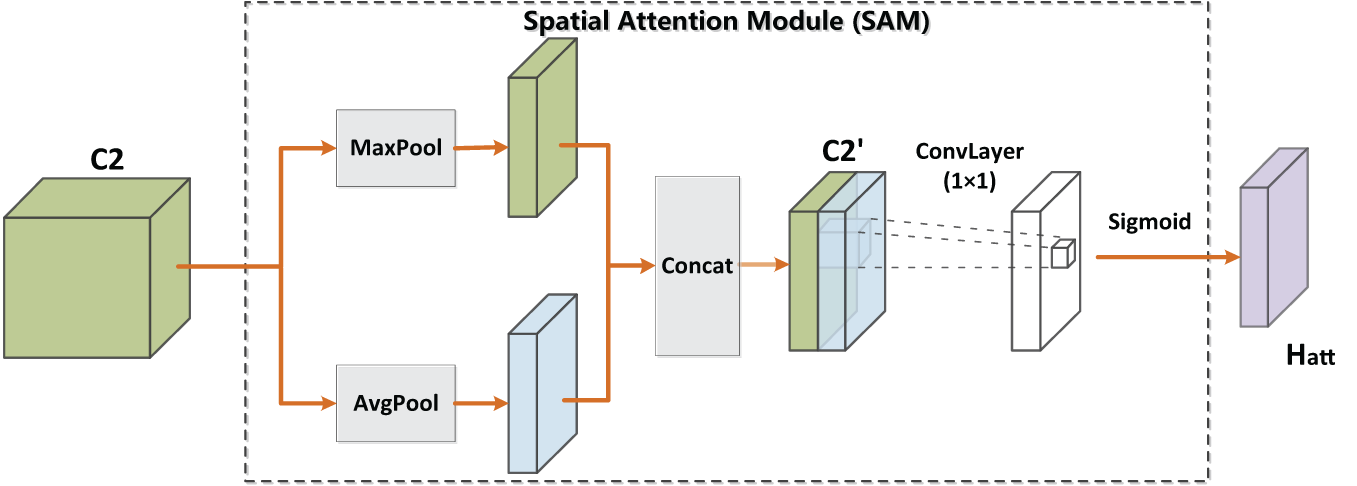
Figure 2: Spatial attention module (SAM)
In the Eq. (1), C2 is formed by convolving the features of the C1 layer, and
(3) After obtaining attention weights, to enhance higher-level features and avoid losing the lower-level ones, we have to reconstruct FPN-2 so that the output of each layer contains each layer of FPN-1 and the attention-enhanced feature layer. The specific implementation process is as follows:
The output of the P2 layer from FPN-1 and attention factors
In Eq. (2), the P2 layer’s features are formed by merging the features of the C2 and P3 layers, N2 represents the bottom layer features of the FPN-2.
As illustrated in Fig. 3, the generation of N3 involves down-sampling the N2 layer, conducting a 1 × 1 convolution operation on the P3 layer, and obtaining the N3 layer after a 1 × 1 convolution operation.
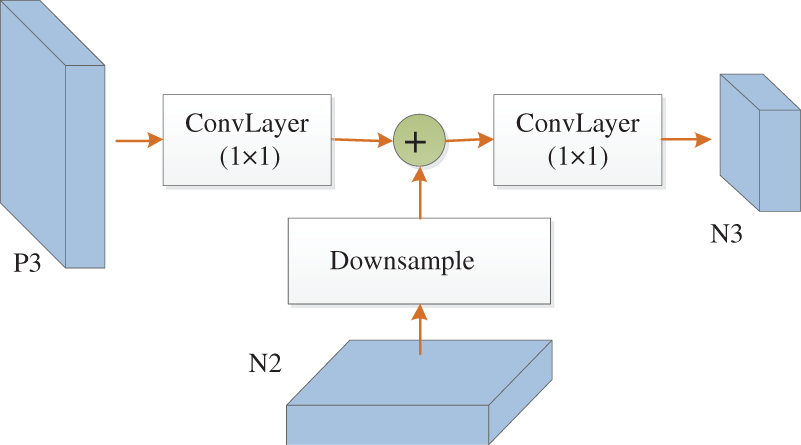
Figure 3: The generation of N3 layer
Finally, the FPN-2 performs bottom-up convolution to generate a pyramid of multi-scale feature maps {N2, N3, N4, N5}, which are fed into the candidate region generation network. The individual unit structures are shown in Table 1.
In order to preserve essential information from ROIs at different scales, a multi-scale ROI Fusion Module (ROIFM) is applied to fuse multi-scale ROI feature maps into a single-layer feature map, as shown in Fig. 4. It first merges multi-scale ROI features along the channel dimension, then employs Global Average Pooling (GAP) to compute channel-wise attention weights. This enables effective integration of features across different levels. The implementation process is as follows.
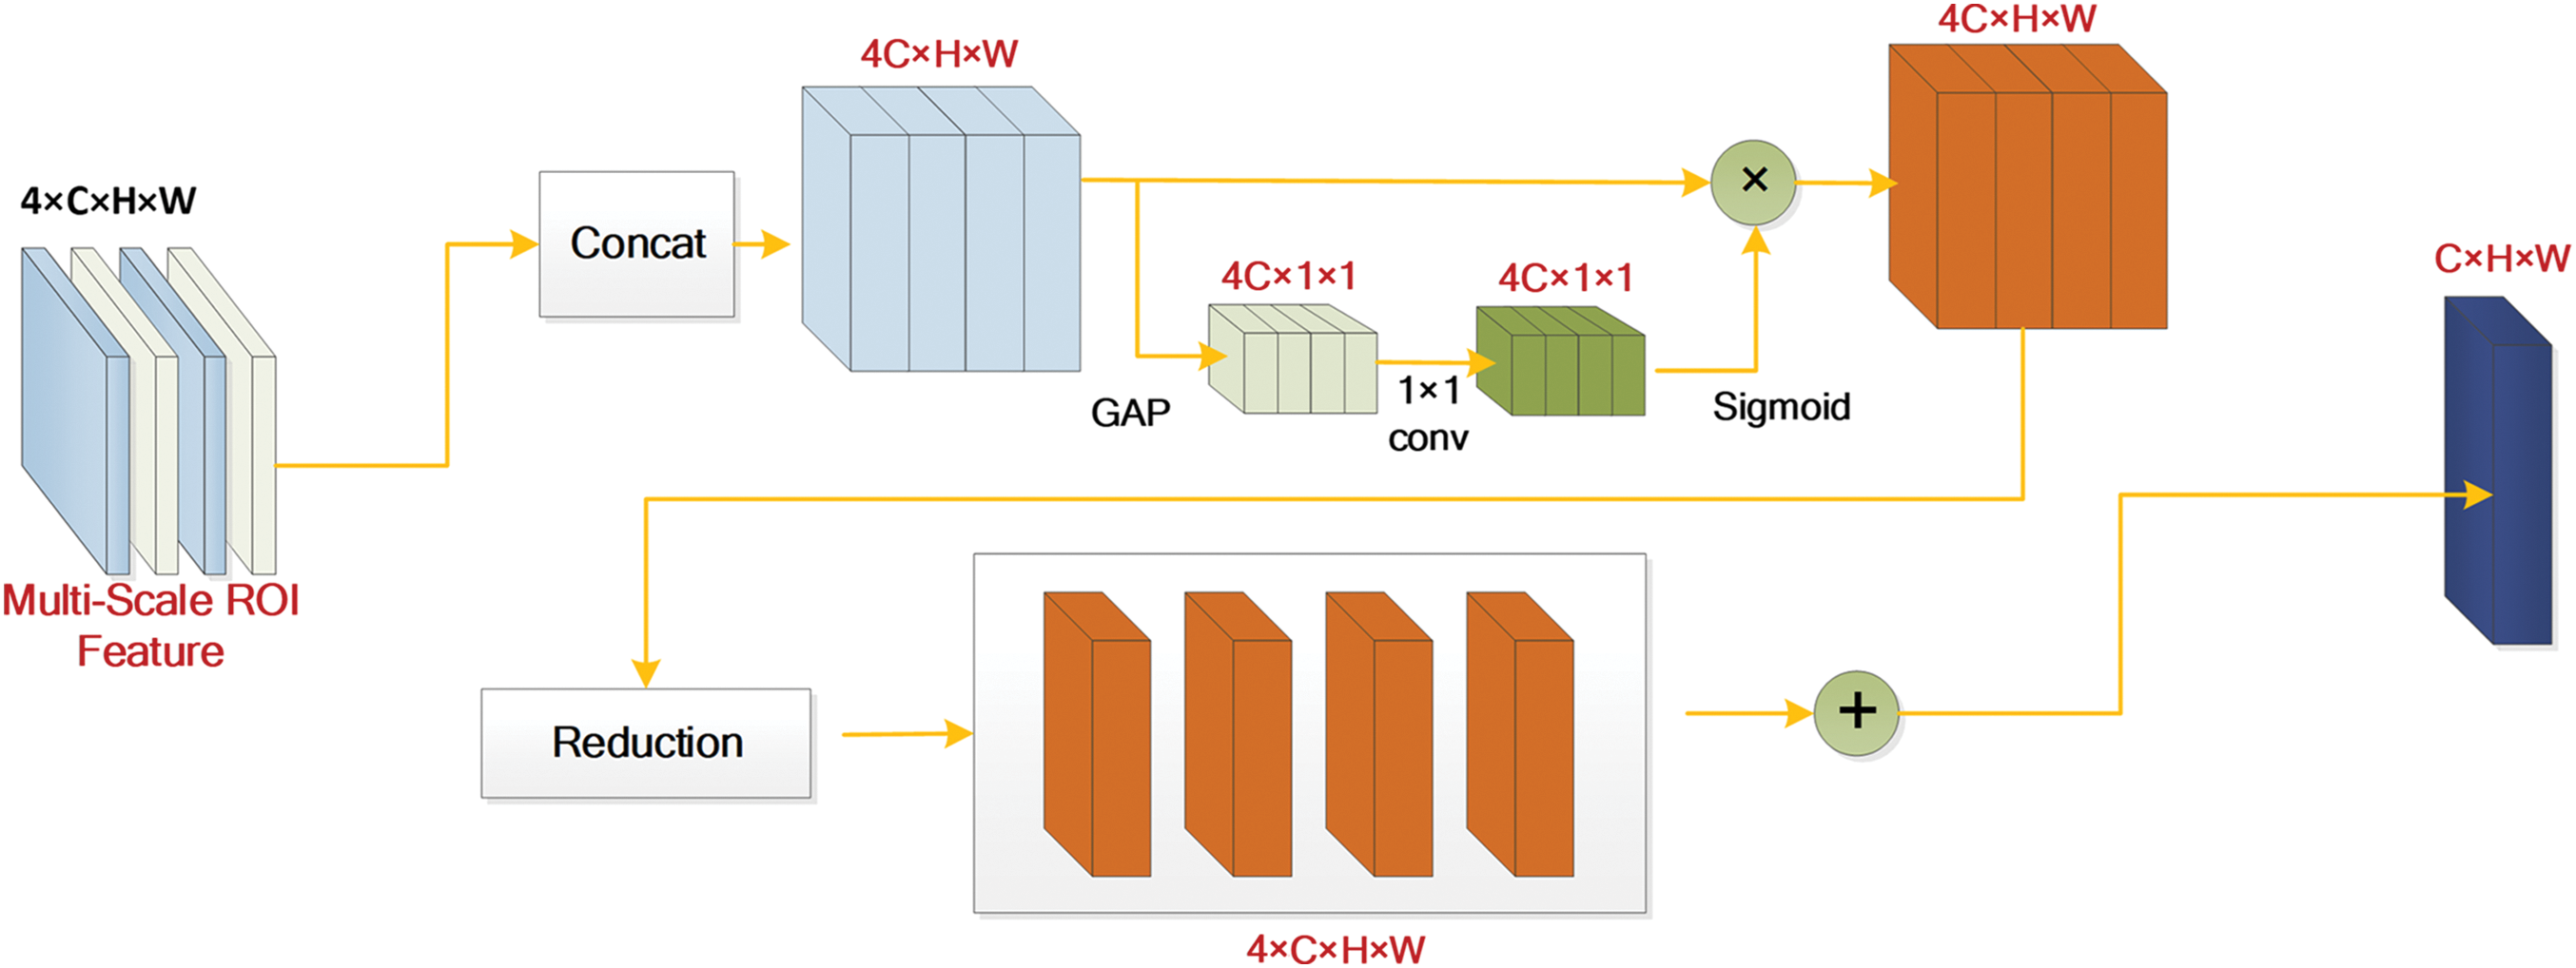
Figure 4: The network structure of the multi-scale ROI Fusion Module (ROIFM)
First, concatenate {
where H and W represent the height and width of the feature map block
where
Finally, layer-wise mean separation is performed on
Considering the densely distributed characteristics of ship layouts, the Focal Loss function [30] is chosen as the classification loss function. Focal Loss is based on the commonly used Cross-Entropy (CE) loss and is defined as follows.
where y = 1 represents a positive prediction, and y = 0 represents a negative prediction. Focal Loss is defined as:
where weighted parameters
Compared to the CE loss function, the Focal Loss function significantly improves the balance between foreground and background samples, especially when dealing with hard-to-classify samples.
Considering the category imbalance of data samples, data augmentation processing is carried out on the original data to enhance the data diversity. Common augmentation methods mainly include rotation, flipping, color conversion (e.g., brightness, contrast, saturation, etc.), translation, duplication, cropping, mixing, image blurring, and noise addition.
Data Affine Processing
Part of ship object images are randomly selected for augmentation using rotation, translation, flipping, and scale transforming algorithms to augment image data.
Taking rotation as an example, for image M, the coordinate of each pixel in the image coordinate system is represented by x, y in homogeneous coordinates as (x, y, 1). Assuming that a rotation point is located at a coordinate (
The coordinate (x, y) can be transformed as (x′, y′):
Data Color Processing
Optical remote sensing images are often represented in the RGB color space, which has significant color characteristics. The data can be enriched by adjusting the hue, brightness, saturation, and other parameters so that the object detection model can reduce color distortion during recognition [31]. Building upon the data augmentation, a portion of the sample data is randomly selected for color processing to optimize the distribution of color features.
The HSV color space is a representation method that maps RGB color space to a truncated cone, making it easier to understand color, lightness, and brightness aspects compared to the RGB space. In this paper, HSV transformation is applied to the samples through the following steps:
Step 1: perform HSV transformation on all RGB image samples in the dataset, mapping RGB images to the HSV color space. Let H channel, S channel, and V channel variables have ranges, including maximum and minimum values. For n images in the dataset, we denote them as
Step 2: select an RGB image P from the dataset, and correspondingly obtain H channel, S channel and V channel data values
Step 3: randomly sample S channel and V channel data values
Step 4: perform HSV inverse transformation on image P to restore it to RGB image data and add it to the dataset.
Step 5: randomly sample other images P′ and return to Step 2 for processing until all specified images have been processed.
Data Noise Processing
Adding noise to images artificially enhances the model’s ability to understand semantic invariance and improve resistance to interference. Building upon the data augmentation, the part of the images is randomly selected for blur processing. Noisy images are obtained from the original image by adding salt-and-pepper noise to each selected image strictly, following a Gaussian white noise distribution. The processing formula is as follows.
where
After data noise processing, part of the images are randomly selected for simulated occlusion processing. A black block is placed over a ship in the image, with the occluded area not exceeding 30%.
Based on these methods, four different augmentation results are obtained in this study as shown in Fig. 5.
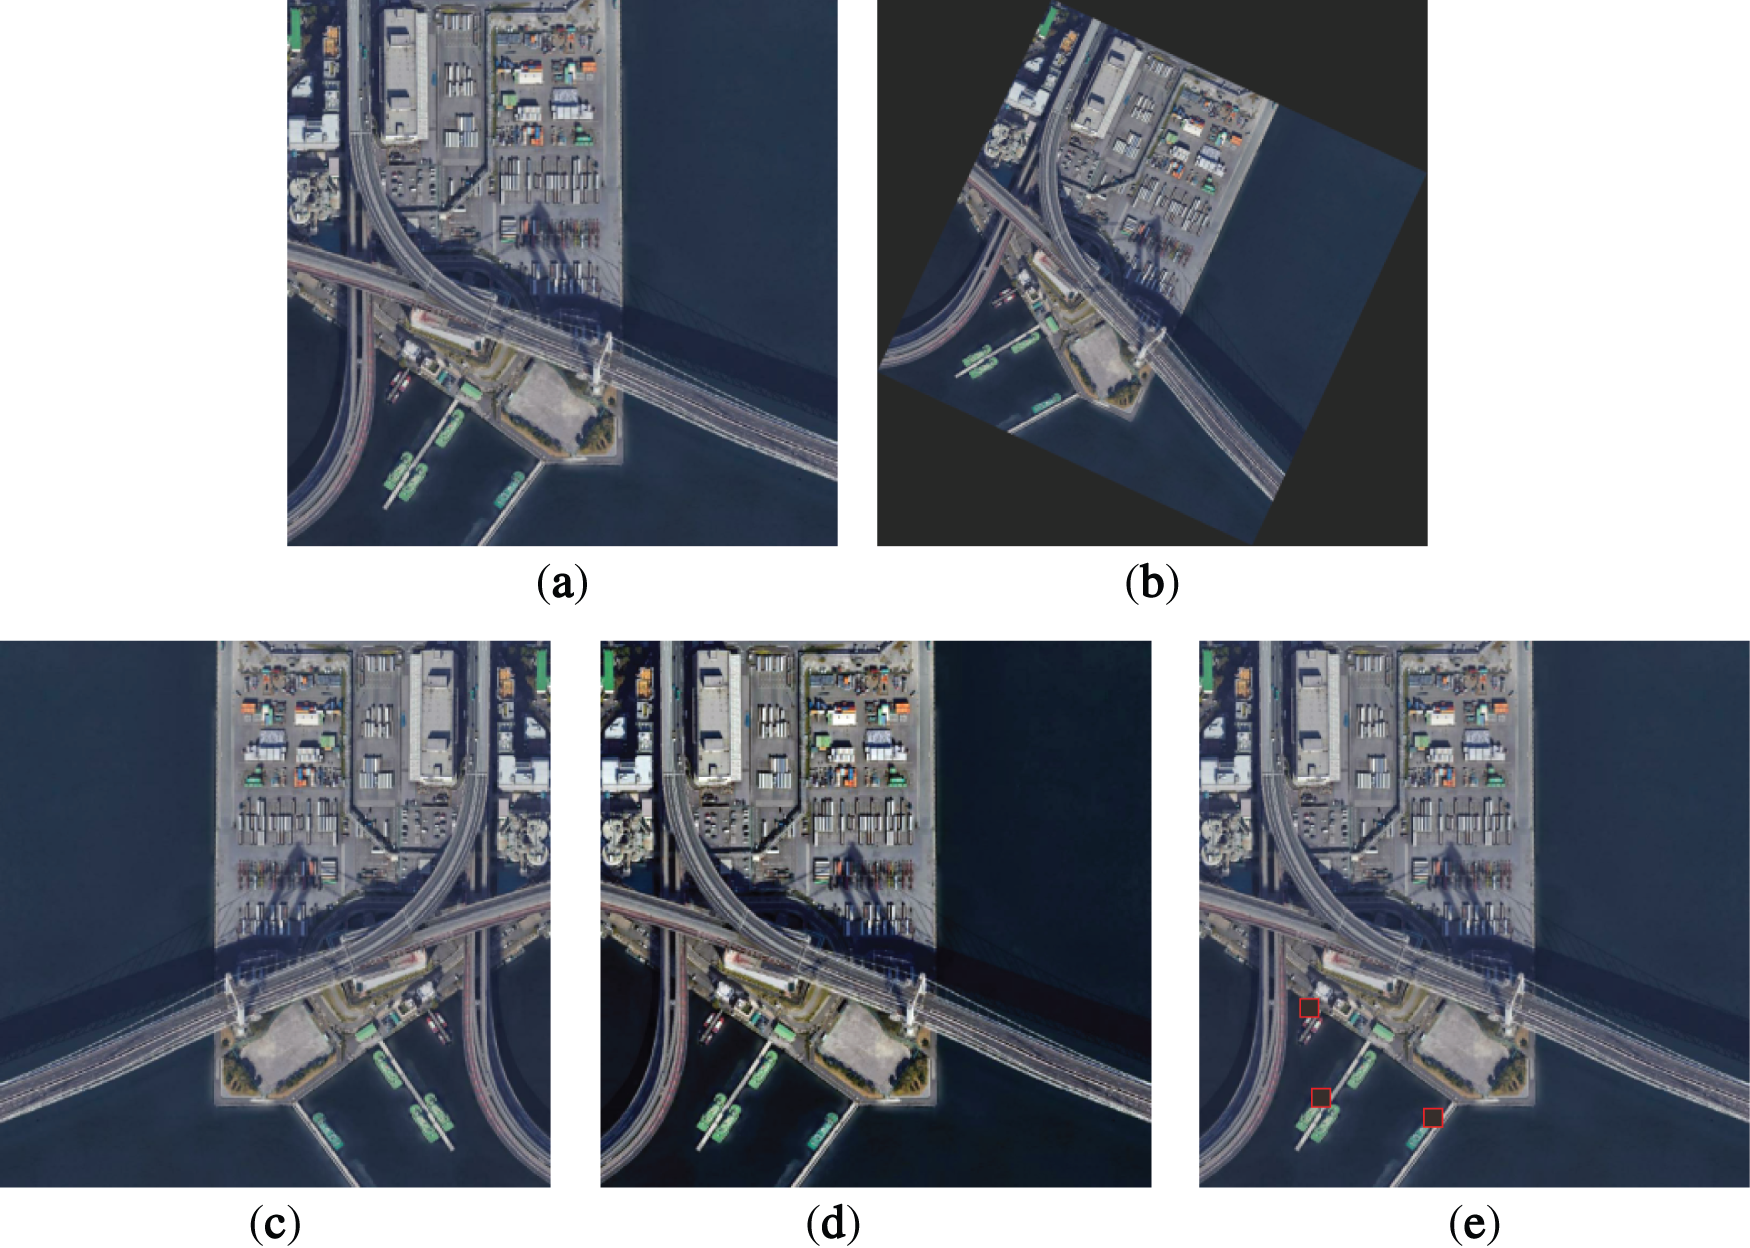
Figure 5: Here four different augmentation results are supplied in the caption: (a) the original image; (b) the random flipped image; (c) the horizontal flipped image; (d) the image after random conversion of color gamut; (e) the image after occlusion
Here, a marine-specific data augmentation example is presented to simulate the dynamic illumination conditions characteristic of marine environments: (A) Statistical analysis of luminance distributions across all datasets was conducted to model characterize the ambient irradiance range inherent to marine environments. (B) Based on the derived luminosity profiles, we sampled photometrically valid HSV values to simulate dynamic illumination conditions with varying luminosity. (C) Controlled levels of white noise were introduced to complete the batch synthesis of augmented marine imagery.
4.1 Dataset and Evaluation Metric
The experimental data used in this paper are all obtained from orbital satellites at different altitudes and angles forming the SDataSet, which contains 1032 image samples. After data augmentation, the resulting DDataSet contains 1578 image samples, covering a total of 13 categories of ships. The image size is standardized to 1024 × 1024 pixels.
As shown in Fig. 6, our dataset exhibits challenges such as multiple scenes, complex backgrounds, and category imbalance in the dataset, based on statistical analysis of the image data. Marine ships appear in 2 states: sailing on the sea surface and anchoring near the shore. Sea-surface sailing ships, except for a few sea surface glares or clutter, are relatively simple to detect. Ships anchoring near the shore are captured in harbors with a large number of cargo containers, which can be easily confused with ships sharing similar colors and shapes.
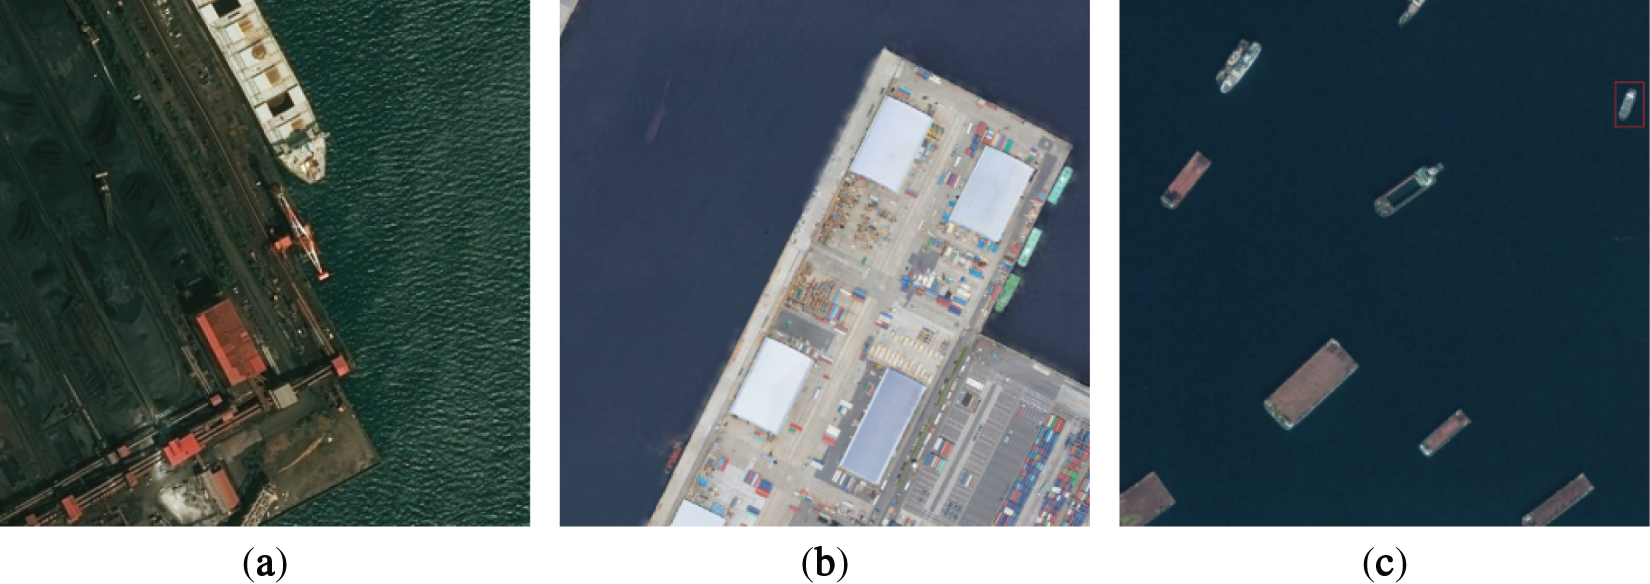
Figure 6: Here, some image samples from our datasets are illustrated: (a) Occluded ships; (b) Ships with complicated backgrounds; (c) Small maritime ships
The image samples exhibit an imbalance in ship category distribution. Statistical analysis indicates that each image contains 1 to 9 ship categories, with an average of approximately 3 to 4 ships per image. The distribution of ship categories is shown in Fig. 7.
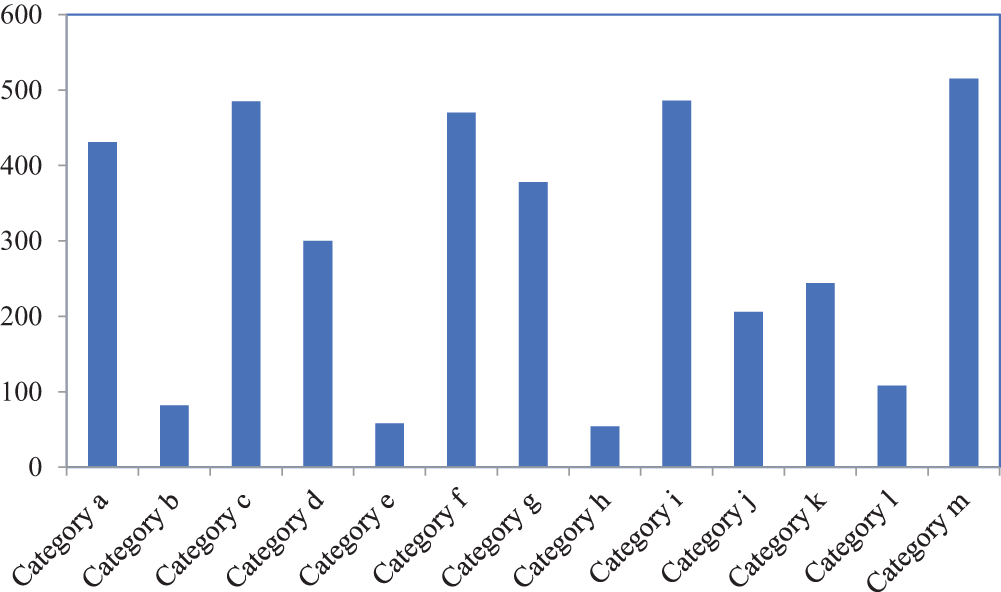
Figure 7: The distribution of ship categories
Intersection over Union (IoU) is utilized as the indicator of detection success. A detection is considered correct when the IoU exceeds 0.5, and incorrect when the IoU is below 0.5 The calculation formula for IoU is as follows.
where
To evaluate the performance of different methods, precision, recall and mean average precision (mAP) are employed [32]. Precision elucidates the ratio of true positive samples among those classified as positive, measuring the model’s ability to accurately identify the positive class. It is computed as the ratio of true positives (TP) to the sum of true positives and false positives (FP), as shown below:
True positives denote the number of correctly identified positive instances, whereas false positives represent instances incorrectly identified as positive. Recall, on the other hand, signifies the proportion of true positive samples labeled as positive, indicating sensitivity. It is calculated as the ratio of true positives to the sum of true positives and false negatives (FN):
mAP represents the mean Average Precision, calculated as the average of the area under the Precision-Recall Curve (PRC) for different categories.
where
The experiments were conducted using two NVIDIA GeForce 2080 Ti GPUs. Technical experiments and validations focused on dataset construction, algorithm structure design, and model training.
The original dataset SDataSet (1032 images) is divided into two parts, with 850 images used as the org-training-set and the remaining 182 images as the fixed test-set to evaluate different models performance using mAP. The org-training-set is expanded to 1396 images, forming the aug-training-dataset for training. The arrangement order of the dataset was randomized.
The training procedure is conducted for 10,000 epochs, with a batch size of 64, and a learning rate of 0.005, where the Stochastic Gradient Descent (SGD) algorithm is used to update gradients. In the loss function,
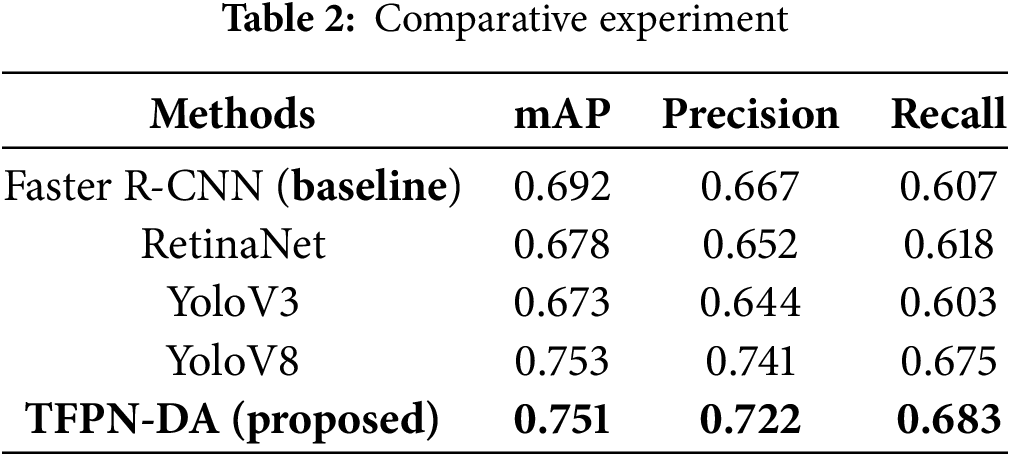
To evaluate the effectiveness and performance of the TFPN-DA model designed in this paper, three baseline models including Faster R-CNN [9], RetinaNet [30],YOLOv3 [11] and YOLOv8 [32] were trained and tested on the augmented DDataSet dataset. The corresponding mAP results were recorded.
The detection performance of the TFPN-DA model is compared to Faster R-CNN, RetinaNet, and YOLOv3 models, as shown in Table 2. In terms of mAP, the TFPN-DA model outperforms the traditional Faster R-CNN model by 8.53%, RetinaNet by 10.77%, and YOLOv3 by 11.58%. The results demonstrate that our method achieves comparable overall performance to YOLOv8, while exhibiting superior recall values. This comprehensive validation confirms the effectiveness of our proposed approach.
Additionally, to verify the impact of different
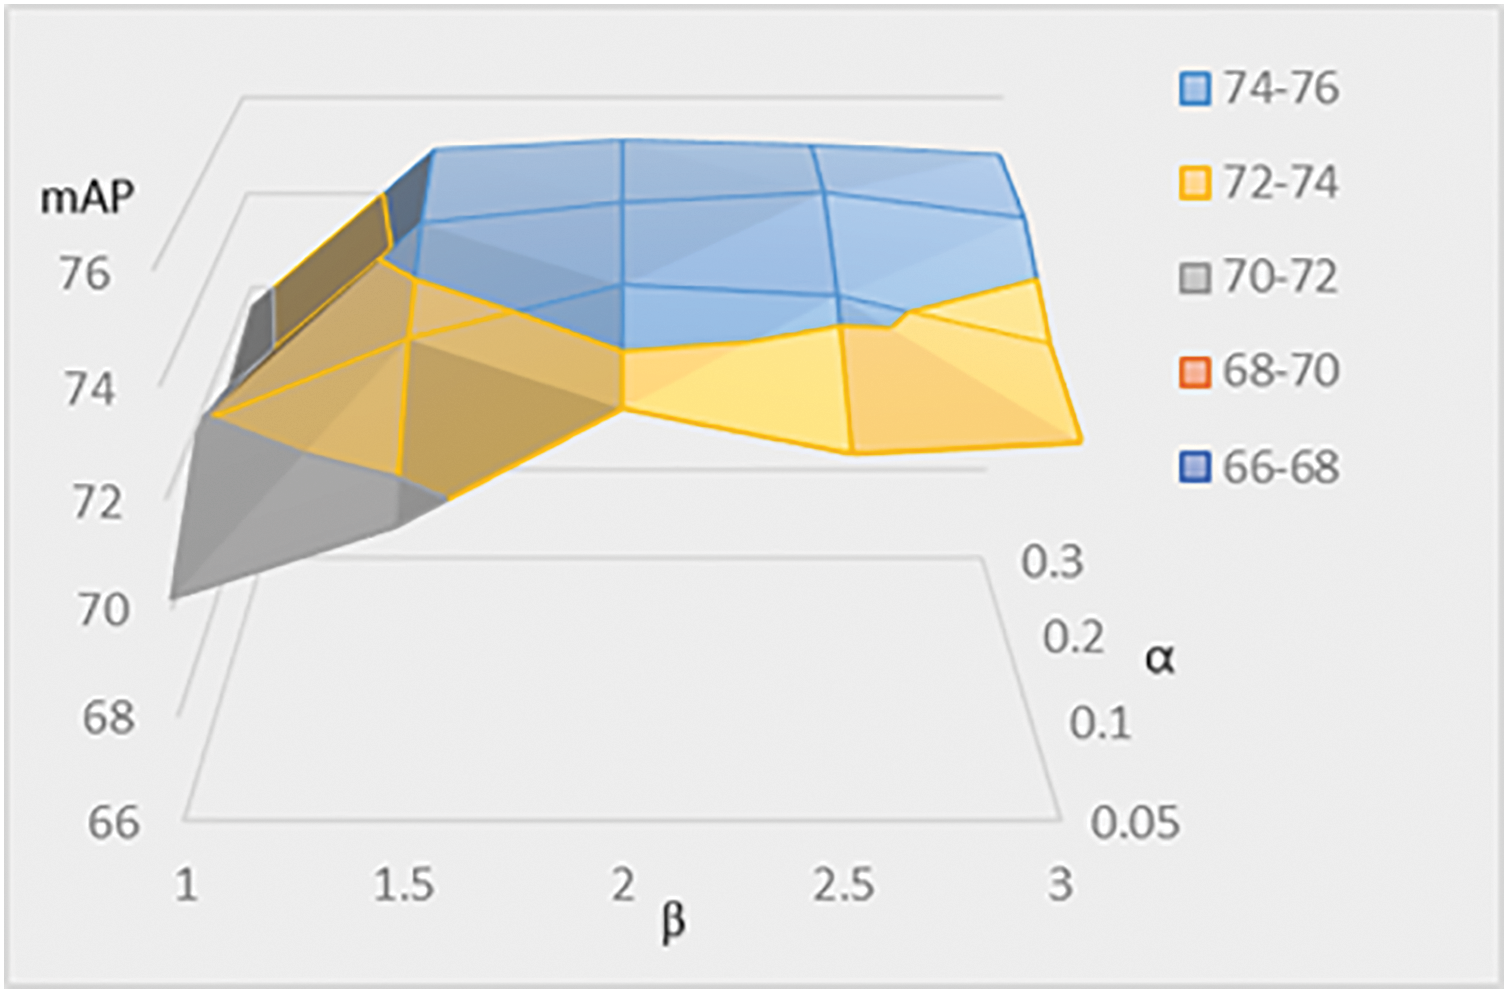
Figure 8: Parameter analysis metrics
Fig. 8 presents a three-dimensional graph illustrating changes in mAP as
To validate the algorithm’s robustness under challenging detection conditions of occlusion and weak illumination, experimental evaluations were conducted on Test Subset using mAP as the primary metric. Comparative results against baseline methods are presented in Table 3, which reveals that the TFPN-DA model outperforms the traditional Faster R-CNN model by 11.62%.
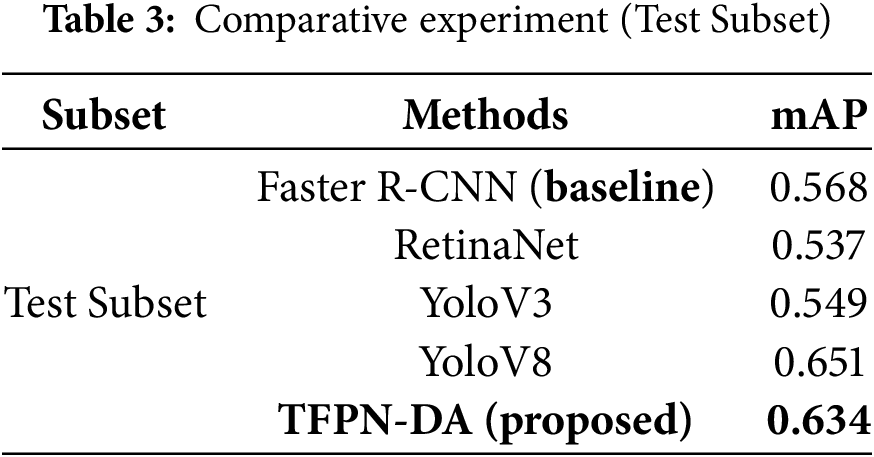
While our method demonstrates significant improvement in occluded object detection, robust performance under weak illumination, we acknowledge constrained effectiveness on small ships, which will be addressed in future work.
To validate the effectiveness of the improvement strategy, our proposed method incorporates three key components, including SA-TFPN, ROIFM, and Data augmentation. We have designed five ablation experiments based on the five strategies outlined in Table 4.
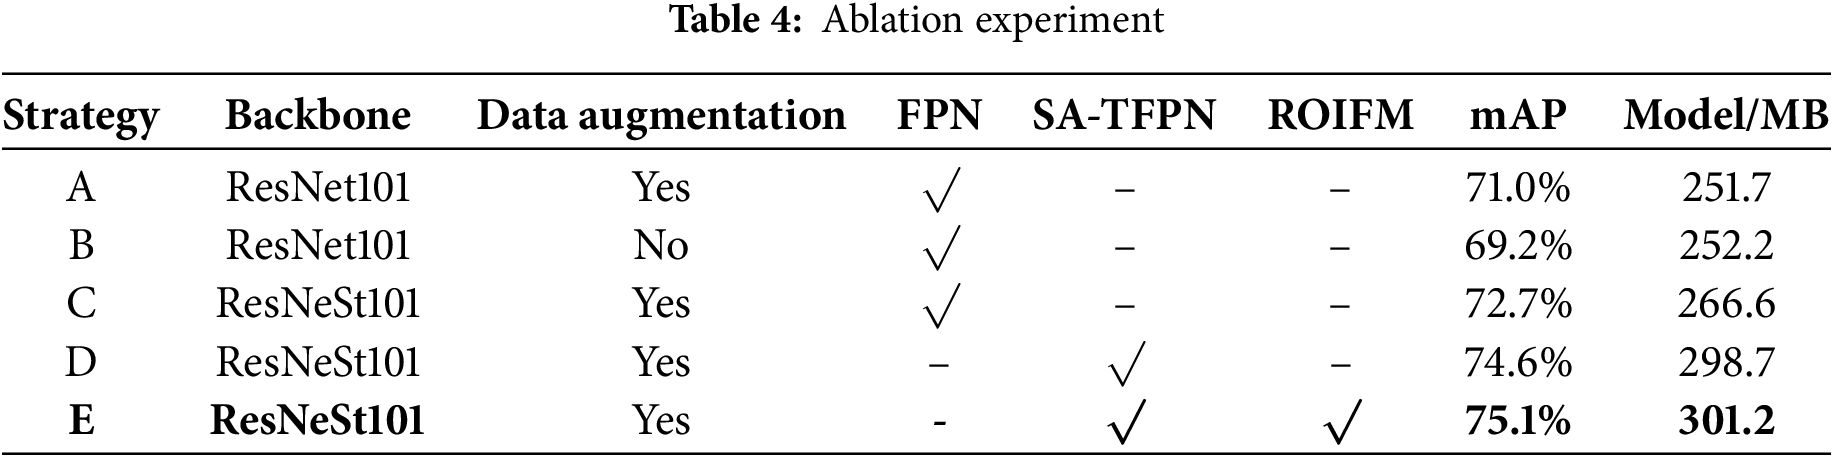
Data augmentation processing. Strategies A and B demonstrate that the use of data augmentation methods significantly improves detection accuracy.
SA-TFPN. We design strategies C and D to highlight the significance of the SA-TFPN component. As indicated in Table 4, the inclusion of SA-TFPN method leads to a 2.61% improvement in detection accuracy compared to the previously utilized FPN.
ROIFM. Based on the results of strategies D and E, the utilization of ROIFM leads to 0.67% improvement in detection accuracy.
While the three components notably enhance result accuracy, they also contribute to extended higher memory usage.
To validate the effectiveness of each proposed component, we conduct extensive ablation studies, with results summarized in Table 4. We start with a baseline model (Strategy B) that utilizing only the ResNet101 backbone network. Experimental results demonstrate that replacing the original backbone with ResNeSt101 (Strategy C) yields a 1.7% improvement in mAP, indicating its superior feature extraction capability for maritime ship detection. Removing the Data Augmentation (Strategy A) leads to a 1.8% decrease in mAP, validating its im-portance to enhance the data diversity. Subsequently, when we further incorporate the SA-TFPN module (Strategy D), the mAP is boosted by an additional 5.4%, highlighting its contribution to leveraging features from different levels and its critical role in the feature reconduction. Finally, by including the ROIFM (Strategy E), the model achieves a total gain of 5.9% over the baseline, which demonstrates its effectiveness in fusing multi-scale region of interest (ROI) features.
To verify the detection performance of the method, we select a portion of images from the validation dataset. Some ships are sailing on the sea surface, while others are docked at various harbors, with different lighting and occlusion conditions. Three types of experiments are designed as follows.
Type 1, General ship detection. As shown in Fig. 9, ships can be almost accurately identified.
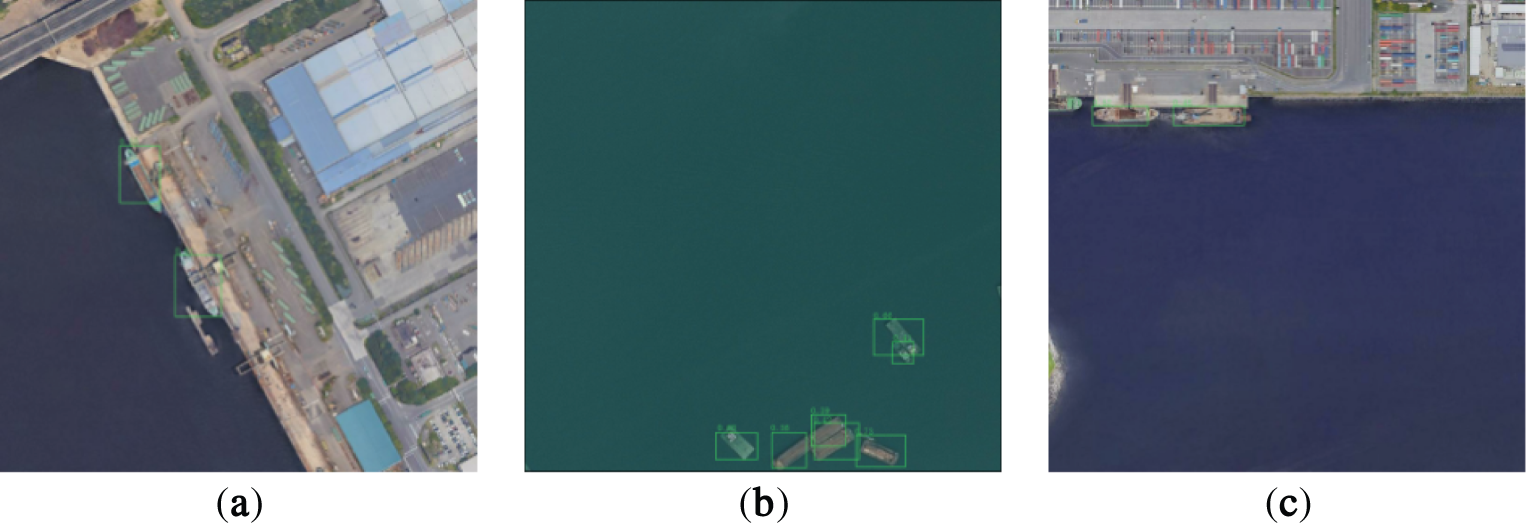
Figure 9: Satisfying detection results on the ship objects. Ships are almost correctly detected. (a) Both ships docked in the port were accurately detected; (b) Seven ships on the sea under normal conditions were accurately detected; (c) Two ships docked in the port were detected (the heavily occluded ship was not detected)
Type 2, Varying scaled ship detection in complex background. In Fig. 10, the presence of numerous containers in the harbor leads to a complex background. Under these conditions, the detection of varying scaled ships can still be achieved with relatively good accuracy.
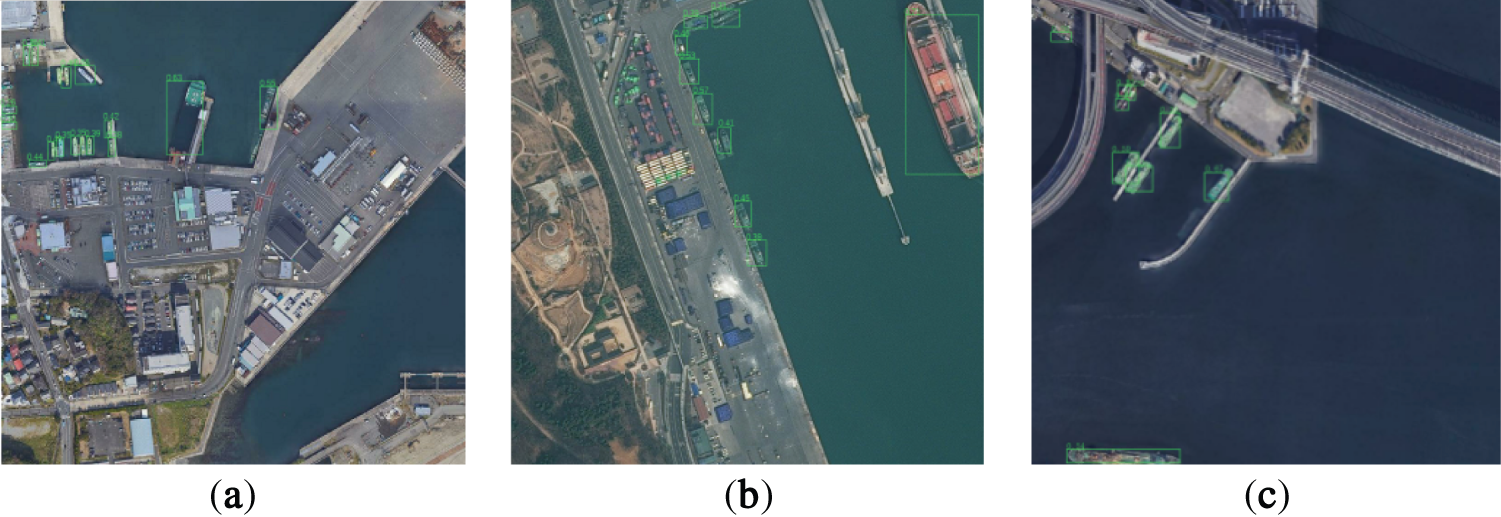
Figure 10: The test results in the case of complex background. Generally satisfying detection results on the varying scaled ship objects, small ship objects are detected as possible. (a) In complex port backgrounds, over 70% of ships were detected, but with instances of false detections; (b) Multiple closely clustered ships still tended to be detected as a single ship; (c) Nearly all ships could be successfully detected
Type 3, Ship detection with weak illumination and occlusion. In Fig. 11, the method can recognize ship objects in conditions with weak illumination and slight occlusion. However, it still faces challenges in identifying ship objects heavily occluded.
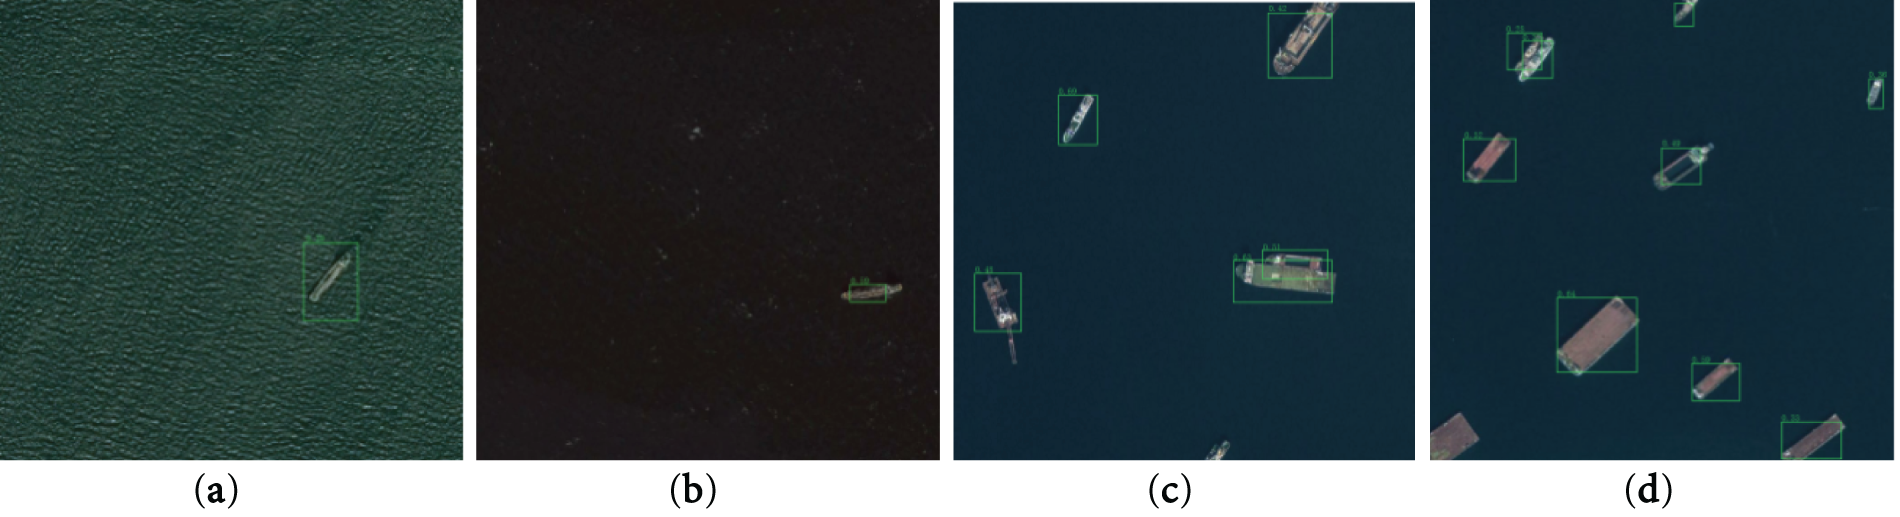
Figure 11: Here we supply four detection results: (a) Ships can be successfully detected despite complex noise interference in the marine environment; (b) Ships detection remains effective under low-visibility sea surface conditions; (c) Partially occluded ships are detected; (d) Even with increasing vessel density, partially occluded ships remain reliably detectable. From (a,b), satisfying detection results in the environment with weak illumination and sea clutter; From (c,d), capable of recognizing slightly occluded ships. Our method exhibits limitations in detecting heavily occluded vessels, leading to missed detections
In this work, we achieve some improvements in marine ship detection in optical remote sensing images by the Spatial Attention within the Twin Feature Pyramid network (SA-TFPN), a multi-scale ROI Fusion Module (ROIFM), and a data augmentation algorithm. These approaches effectively enhance object features and improve the ability to recognize marine ships under conditions of occlusion, variable lighting, and small ships occupying a limited number of pixels. Experimental results demonstrate significant improvements in detection accuracy compared to existing Faster R-CNN object detection methods, which could recognize marine ships with weak illumination and slight occlusion.
The detection performance remains to be improved in highly challenging conditions such as dense small objects, complex lighting, and extensive object occlusion in the future. Future research would focus on exploring methods to enhance detection speed. Furthermore, the proposed method could be extended to detect various other types of objects in remote sensing images.
Acknowledgement: Not applicable.
Funding Statement: The authors received no specific funding for this study.
Author Contributions: study conception and design: Huagang Jin; data collection and preprocessing: Huagang Jin; software and experimental validation: Huagang Jin; analysis and interpretation of results: Huagang Jin, Yu Zhou; draft manuscript preparation: Huagang Jin; supervision: Yu Zhou; writing—review and editing: Yu Zhou. All authors reviewed the results and approved the final version of the manuscript.
Availability of Data and Materials: To facilitate reproducibility, both the implementation code and experimental datasets will be made publicly accessible upon manuscript acceptance.
Ethics Approval: Not applicable.
Conflicts of Interest: The authors declare no conflicts of interest to report regarding the present study.
References
1. Yao Y, Jiang Z, Zhang H, Zhao D, Cai B. Ship detection in optical remote sensing images based on deep convolutional neural networks. J Appl Remote Sens. 2017;11(4):042611. doi:10.1117/1.JRS.11.042611. [Google Scholar] [CrossRef]
2. Cui Z, Li Q, Cao Z, Liu N. Dense attention pyramid networks for multi-scale ship detection in SAR images. IEEE Trans Geosci Remote Sens. 2019;57(11):8983–97. doi:10.1109/TGRS.2019.2923988. [Google Scholar] [CrossRef]
3. Serra J. Introduction to mathematical morphology. Comput Vis Graph Image Process. 1986;35(3):283–305. doi:10.1016/0734-189X(86)90002-2. [Google Scholar] [CrossRef]
4. Borji A, Itti L. State-of-the-art in visual attention modeling. IEEE Trans Pattern Anal Mach Intell. 2012;35(1):185–207. doi:10.1109/TPAMI.2012.89. [Google Scholar] [PubMed] [CrossRef]
5. Bay H, Ess A, Tuytelaars T, Van Gool L. Speeded-up robust features (SURF). Comput Vis Image Underst. 2008;110(3):346–59. doi:10.1016/j.cviu.2007.09.014. [Google Scholar] [CrossRef]
6. Vachon PW, Thomas SJ, Cranton J, Edel HR, Henschel MD. Validation of ship detection by the RADARSAT synthetic aperture radar and the ocean monitoring workstation. Can J Remote Sens. 2000;26(3):200–12. doi:10.1080/07038992.2000.10874770. [Google Scholar] [CrossRef]
7. Girshick R, Donahue J, Darrell T, Malik J. Rich feature hierarchies for accurate object detection and semantic segmentation. In: Proceedings of the IEEE Conference on Computer Vision and Pattern Recognition; 2014 Jun 23–28; Columbus, OH, USA. doi:10.1109/CVPR.2014.81. [Google Scholar] [CrossRef]
8. Girshick R. Fast R-CNN. In: Proceedings of the IEEE International Conference on Computer Vision; 2015 Dec 7–13; Washington, DC, USA. doi:10.1109/ICCV.2015.169. [Google Scholar] [CrossRef]
9. Ren S, He K, Girshick R, Sun J. Faster R-CNN: towards real-time object detection with region proposal networks. IEEE Trans Pattern Anal Mach Intell. 2016;39(6):1137–49. doi:10.1109/TPAMI.2016. [Google Scholar] [CrossRef]
10. Liu W, Anguelov D, Erhan D, Szegedy C, Reed S, Fu CY, et al. SSD: single shot multibox detector. In: Proceedings of the Computer Vision—ECCV 2016: 14th European Conference; 2016 Oct 11–14; Amsterdam, The Netherlands. [Google Scholar]
11. Redmon J, Divvala S, Girshick R, Farhadi A. You only look once: unified, real-time object detection. In: Proceedings of the IEEE Conference on Computer Vision and Pattern Recognition; 2016 Jun 27–30; Las Vegas, NV, USA. doi:10.1109/CVPR.2016.91. [Google Scholar] [CrossRef]
12. Lin TY, Dollár P, Girshick R, He K, Hariharan B, Belongie S. Feature pyramid networks for object detection. In: Proceedings of the IEEE Conference on Computer Vision and Pattern Recognition; 2017 Jul 21–26; Honolulu, HI, USA. doi:10.1109/CVPR.2017.106. [Google Scholar] [CrossRef]
13. Li Y, Zhou S, Chen H. Attention-based fusion factor in FPN for object detection. Appl Intell. 2022;52(13):15547–56. doi:10.1007/s10489-022-03220-0. [Google Scholar] [CrossRef]
14. Chen S, Ma W, Zhang L. Dual-bottleneck feature pyramid network for multiscale object detection. J Electron Imaging. 2022;31(1):013009. doi:10.1117/1.JEI.31.1.013009. [Google Scholar] [CrossRef]
15. Gong Y, Yu X, Ding Y, Peng X, Zhao J, Han Z. Effective fusion factor in FPN for tiny object detection. In: Proceedings of the IEEE/CVF Winter Conference on Applications of Computer Vision; 2021 Jan 3–8; Waikoloa, HI, USA. doi:10.1109/WACV48630.2021.00120. [Google Scholar] [CrossRef]
16. Cao J, Pang Y, Zhao S, Li X. High-level semantic networks for multi-scale object detection. IEEE Trans Circuits Syst Video Technol. 2019;30(10):3372–86. doi:10.1109/TCSVT.2019.2950526. [Google Scholar] [CrossRef]
17. Guo C, Fan B, Zhang Q, Xiang S, Pan C. AugFPN: improving multi-scale feature learning for object detection. In: Proceedings of the IEEE/CVF Conference on Computer Vision and Pattern Recognition; 2020 Jun 13–19; Seattle, WA, USA. doi:10.1109/CVPR42600.2020.01261. [Google Scholar] [CrossRef]
18. Ghiasi G, Lin TY, Le QV. NAS-FPN: learning scalable feature pyramid architecture for object detection. In: Proceedings of the IEEE/CVF Conference on Computer Vision and Pattern Recognition; 2019 Jun 15–20; Long Beach, CA, USA. doi:10.1109/CVPR.2019.00720. [Google Scholar] [CrossRef]
19. Tan M, Pang R, Le QV. EfficientDet: scalable and efficient object detection. In: Proceedings of the IEEE/CVF Conference on Computer Vision and Pattern Recognition; 2020 Jun 13–19; Seattle, WA, USA. doi:10.1109/CVPR42600.2020.01079. [Google Scholar] [CrossRef]
20. Fan Z, Liu Q. Adaptive region-aware feature enhancement for object detection. Pattern Recognit. 2022;124:108437. doi:10.1016/j.patcog.2021.108437. [Google Scholar] [CrossRef]
21. Zhang C, Yan Q, Zhu Y, Li X, Sun J, Zhang Y. Attention-based network for low-light image enhancement. In: Proceedings of the 2020 IEEE International Conference on Multimedia and Expo (ICME); 2020 Jul 6–10; London, UK. doi:10.1109/ICME46284.2020.9102774. [Google Scholar] [CrossRef]
22. Hu J, Shen L, Sun G. Squeeze-and-excitation networks. In: Proceedings of the IEEE Conference on Computer Vision and Pattern Recognition; 2018 Jun 18–23; Salt Lake City, UT, USA. doi:10.1109/CVPR.2018.00745. [Google Scholar] [CrossRef]
23. Woo S, Park J, Lee JY, Kweon IS. CBAM: convolutional block attention module. In: Proceedings of the European Conference on Computer Vision (ECCV); 2018 Sep 8–14; Munich, Germany. doi:10.1007/978-3-030-01234-2_1. [Google Scholar] [CrossRef]
24. Puthige I, Hussain T, Gupta S, Agarwal M. Attention over attention: an enhanced supervised video summarization approach. Procedia Comput Sci. 2023;218:2359–68. doi:10.1016/j.procs.2023.01.211. [Google Scholar] [CrossRef]
25. Zhou Y, Wang J, Wang Z. Bearing faulty prognostic approach based on multiscale feature extraction and attention learning mechanism. J Sens. 2021;2021(1):6221545. doi:10.1155/2021/6221545. [Google Scholar] [CrossRef]
26. Bukhari M, Yasmin S, Naz S, Maqsood M, Rew J, Rho S. Language and vision based person re-identification for surveillance systems using deep learning with LIP layers. Image Vis Comput. 2023;132:104658. doi:10.1016/j.imavis.2023.104658. [Google Scholar] [CrossRef]
27. Xue G, Liu S, Gong D, Ma Y. ATP-DenseNet: a hybrid deep learning-based gender identification of handwriting. Neural Comput Appl. 2021;33(10):4611–22. doi:10.1007/s00521-020-05237-3. [Google Scholar] [CrossRef]
28. Li J, Li Y, Xiao Y, Bai Y. HDRANet: hybrid dilated residual attention network for SAR image despeckling. Remote Sens. 2019;11(24):2921. doi:10.3390/rs11242921. [Google Scholar] [CrossRef]
29. Zhang H, Wu C, Zhang Z, Zhu Y, Lin H, Zhang Z, et al. ResNeSt: split-attention networks. In: Proceedings of the IEEE/CVF Conference on Computer Vision and Pattern Recognition; 2022 Jun 19–20; New Orleans, LA, USA. doi:10.1109/CVPRW56347.2022.00309. [Google Scholar] [CrossRef]
30. Lin TY, Goyal P, Girshick R, He K, Dollár P. Focal loss for dense object detection. In: Proceedings of the IEEE International Conference on Computer Vision; 2017 Oct 22–29; Venice, Italy. doi:10.1109/ICCV.2017.324. [Google Scholar] [CrossRef]
31. Hu J, Jiang Q, Cong R, Gao W, Shao F. Two-branch deep neural network for underwater image enhancement in HSV color space. IEEE Signal Process Lett. 2021;28:2152–6. doi:10.1109/LSP.2021.3099746. [Google Scholar] [CrossRef]
32. Bakirci M. Advanced ship detection and ocean monitoring with satellite imagery and deep learning for marine science applications. Reg Stud Mar Sci. 2025;81(2):103975. doi:10.1016/j.rsma.2024.103975. [Google Scholar] [CrossRef]
Cite This Article
 Copyright © 2025 The Author(s). Published by Tech Science Press.
This work is licensed under a Creative Commons Attribution 4.0 International License , which permits unrestricted use, distribution, and reproduction in any medium, provided the original work is properly cited.
 Downloads
 Citation Tools