
 Submit a Paper
 Propose a Special lssue
 Open Access
ARTICLE
Integrated Discrete Cell Complexes and Finite Element Analysis for Microstructure Topology Evolution during Severe Plastic Deformation
1 Institute for Frontier Science & Key Lab for Intelligent Nano Materials and Devices of the Ministry of Education, Nanjing University of Aeronautics and Astronautics (NUAA), Nanjing, 210016, China
2 State Key Lab of Mechanics and Control for Aerospace Structures & College of Aerospace Engineering, Nanjing University of Aeronautics and Astronautics (NUAA), Nanjing, 210016, China
* Corresponding Authors: Min Yi. Email: ; Zhuhua Zhang. Email:
# Equal Contribution
(This article belongs to the Special Issue: Computational Analysis of Micro-Nano Material Mechanics and Manufacturing)
Computers, Materials & Continua 2025, 85(1), 657-679. https://doi.org/10.32604/cmc.2025.068242
Received 23 May 2025; Accepted 03 July 2025; Issue published 29 August 2025
 View Full Text
 Download PDF
Abstract
Microstructure topology evolution during severe plastic deformation (SPD) is crucial for understanding and optimising the mechanical properties of metallic materials, though its prediction remains challenging. Herein, we combine discrete cell complexes (DCC), a fully discrete algebraic topology model—with finite element analysis (FEA) to simulate and analyse the microstructure topology of pure copper under SPD. Using DCC, we model the evolution of microstructure topology characterised by Betti numbers (, , ) and Euler characteristic (). This captures key changes in GBNs and topological features within representative volume elements (RVEs) containing several hundred grains during SPD-induced recrystallisation. As SPD cycles increase, high-angle grain boundaries (HAGBs) progressively form. Topological analysis reveals an overall decrease in values, indicating fewer isolated HAGB substructures, while values show a steady upward trend, highlighting new grain formation. Leveraging DCC-derived RVE topology and FEA-generated plastic strain data, we directly simulate the evolution and spatial distribution of microstructure topology and HAGB fraction in a copper tube undergoing cyclic parallel tube channel angular pressing (PTCAP), a representative SPD technique. Within the tube, the HAGB fraction continuously increases with PTCAP cycles, reflecting the microstructure’s gradual transition from subgrains to fully-formed grains. Analysis of Betti number distribution and evolution reveals the microstructural reconstruction mechanism underpinning this subgrain to grain transition during PTCAP. We further demonstrate the significant influence of spatially non-uniform plastic strain distribution on microstructure reconstruction kinetics. This study demonstrates a feasible approach for simulating microstructure topology evolution of metals processed by cyclic SPD via the integration of DCC and FEA.Keywords
The production of ultrafine-grained (UFG) metallic materials, which exhibit enhanced mechanical strength, ductility, and functional properties, remains a central pursuit in materials science [1,2]. Among the most effective methods for achieving these fine microstructures are severe plastic deformation (SPD) techniques, including high-pressure torsion (HPT), equal channel angular pressing (ECAP), accumulative roll bonding (ARB), and parallel tube channel angular pressing (PTCAP). These techniques impose large plastic strains without significantly changing the overall geometry of the sample, facilitating the synthesis of advanced materials with superior performance [3,4]. Microstructure design is critical for achieving exceptional properties, gradient structures enable strength-ductility synergy [5], UFG architectures facilitate room-temperature superplasticity [6], and nanograined oxides exhibit “superfunctional” photocatalytic behaviour for energy applications [7]. A key mechanism contributing to microstructure refinement during SPD is continuous dynamic recrystallisation (CDRX) [8,9]. Unlike discontinuous dynamic recrystallization (DDRX), another important mechanism in SPD, CDRX proceeds through gradual subgrain rotation and boundary migration, transforming low-angle grain boundaries (LAGBs) into high-angle grain boundaries (HAGBs). In face-centred cubic (FCC) metals such as copper, this mechanism leads to the formation of ultrafine grains without requiring distinct nucleation events. In addition to improving mechanical properties, the recrystallised microstructure enhances electrical and thermal conductivities by reducing dislocation densities and internal stresses, making SPD-treated copper alloys attractive for applications demanding both strength and conductivity [10,11]. However, DDRX operates through distinct nucleation and growth stages: new strain-free grains nucleate preferentially at prior grain boundaries or deformation heterogeneities, followed by boundary migration that consumes the work-hardened matrix. This process dominates in low-to-medium stacking fault energy materials where rapid boundary mobility enables abrupt microstructural reconstitution. However, SPD regimes rarely exhibit pure DDRX, instead, it persistently couples with CDRX [12,13].
Microstructure typically plays a pivotal role in determining the properties of polycrystalline materials [14–17], governed largely by the grain boundary network (GBN) which influences key characteristics such as strength, ductility, and conductivity [18–20]. A critical microstructural factor is the HAGB fraction, significantly affecting grain boundary sliding [21,22], dislocation movement [23,24], and strain accommodation [25]. Materials with higher HAGB fractions generally exhibit enhanced mechanical properties, as these boundaries effectively impede dislocation motion. Furthermore, grain and grain boundary (GB) connectivity critically influences material behaviour by determining stress transfer and diffusion pathways. Topological aspects including triple junctions (TJs), quadruple nodes (QNs), and their connectivity can provide deeper insight into microstructure property relationships [19,26–29]. Quantifying these factors enables a comprehensive understanding of how microstructural features collectively govern material performance and functionality. Advanced research methodologies integrate multiscale characterisation and computational modelling to decode GBN evolution, a cornerstone of SPD microstructural engineering [18,30,31]. In-situ techniques like Shear Diamond Anvil Cells (SDAC) coupled with synchrotron X-ray diffraction enable real-time tracking of GB-mediated phase transformations under extreme pressures [32]. Advanced microscopy, particularly transmission Kikuchi diffraction (TKD) and atom probe tomography (APT) quantifies three-dimensional GB segregation patterns and defect densities across GBNs, revealing how solute decoration governs boundary mobility and stability [33]. Computationally, phase-field models simulate disconnection dynamics in boundary migration [34], Monte Carlo methods can stochastically simulate GB migration during DDRX [35], while molecular dynamics predicts vacancy cluster formation at TJs [36]. Despite these advances, critical defects persist: sample size constraints limit statistical analysis of GBN heterogeneity, thermal instability triggers abnormal grain growth via boundary migration above 0.3
Our previous work [28,39] developed a discrete method based on algebraic topology to simulate the two-dimensional (2D) and three-dimensional (3D) microstructure and GBN evolution during SPD, which is described in detail in the PhD thesis [40]. This method effectively captured the GB dynamics and topology changes within the material at the mesoscale, providing insights into the underlying mechanisms of microstructural refinement. In this work, we extend this approach by integrating the algebraic topology-based mesoscale model with finite element methods (FEM). In detail, the output from discrete cell complexes (DCC) analysis of mesoscale representative volume element (RVE), i.e., the microstructure topology parameters as a function of plastic strain, is utilized by the macroscopic FEM analysis to obtain the spatial distribution of microstructure topology and HAGB fraction in a copper tube under cyclic parallel tube channel angular pressing (PTCAP), which is a typical SPD technique, and it is proposed to be suitable for deforming cylindrical tubes to extremely large strains [41,42]. By integrating the mesoscale simulation results with macroscopic FEM analysis, this work aims to establish a multiscale framework that bridges microstructure topology evolution with the macroscopic analysis. This study adopts the Maximum Entropy Production Principle (MEPP) as a guiding framework for modelling the conversion from LAGBs to HAGBs, assuming that the microstructure evolves along the path of maximal entropy production, consistent with principles of nonequilibrium thermodynamics.
2 Discrete Cell Complexes Model
2.1 Microstructure Representation
Voronoi tessellations provide geometric realisations of combinatorial structures known as discrete cell complexes—collections of cells of various topological dimensions connected according to specific rules [43]. It is widely used in GB simulations due to their ability to model the microstructural geometry of polycrystalline materials. This approach provides a detailed representation of the grain structure, allowing for accurate analysis of phenomena such as GB migration, curvature-driven growth, and the role of TJs in microstructural evolution.
Specifically, the assemblies studied in this work are 3-complexes, which are cell complexes with a topological dimension of 3. These are composed of 3-cells (polygons representing material cells or “grains” constructed), 2-cells (faces representing GBs), 1-cells (edges representing TJs or triple lines), and 0-cells (vertices representing QNs), as it shown in Fig. 1. The topology of a cell complex is uniquely characterized by a set of matrices that encode the connectivity between cells of different dimensions, forming its algebraic representation. Algebraic representations facilitate the topological analysis of cell complexes [43] and have been increasingly applied to mathematical models of physical phenomena on discrete spaces [44,45]. They significantly streamline the calculations in this study. The Voronoi tessellation used in this work was generated using the open-source software Neper [46], a versatile tool specifically designed to model and generate representative microstructures in computational materials science.

Figure 1: (a) 5000 cell Voronoi tessellation produced by Neper; (b) 200 cell Voronoi tessellation; (c) 3-complexes structure: 0-cells, 1-cells, 2-cells, 3-cells, from left to right
A collection of polyhedra, denoted by
In an oriented discrete cell complex, the relationship between a
Notably,
i.e., the number of zero eigenvalues of
The positive value of
The set of all
• For
• For
These Laplacians are used to compute the Betti numbers of the skeletons via Eq. (2). The Betti numbers considered here are:
•
•
•
A substructure of a polycrystalline assembly consisting of elements of dimension
In this study, GBs are divided into a binary fashion—LAGBs and HAGBs, while TJs are classified into four types:

Figure 2: Schematic diagram of continuous dynamic recrystallisation and TJ type
2.3 Entropy and Grain Boundary Networks
Two types of entropy to characterize the properties of system from different perspectives are introduced. The first is the configurational entropy [39], derived from the spatial configuration of the system, and provides insight into the connectivity of the GBNs. Quantifies the degree of order or disorder in the arrangement of the network, effectively encoding the structural information of how GBs are connected. In a highly ordered structure, the configurational entropy is lower because there are fewer possible configurations, whereas in a disordered system, it is higher due to the greater number of possible arrangements, this measure captures the essence of the complexity and organization of the network. The entropy based on the TJ network referred to as the configurational or structural entropy, has been recently developed [19,39,55]. Let
where
Another one is the Euler entropy:
Together, these two types of entropy provide a comprehensive framework for understanding both the structural and topological aspects of GBNs, bridging local connectivity with global topological behaviour. The maximum entropy production principle (MEPP) is applied as the evolution principle in this simulation according to TJ configurational entropy. MEPP was independently proposed in various fields of physics in the mid-20th century [56] and has proven highly effective in analyzing a wide range of non-equilibrium phenomena [57,58]. This approach builds on prior work [57,59], in particular, the method proposed in [59] provides the theoretical foundation for our formulation. Algorithmically, it is implemented by assigning entropy production weights to discrete cell transitions within the network. The initial GBN begins in a state where only
Fig. 3 illustrates the evolution of the GBN with increasing fraction of HAGBs according to MEPP based on TJ configurational entropy and topological metrics. Fig. 3a shows the configurational entropy

Figure 3: (a) Evolution of configurational entropy
2.4 Evolution of Betti Numbers and Euler Characteristics
The evolution of topological characteristics in the GBN is analyzed through Betti numbers

Figure 4: (a) Evolution of Betti numbers
Fig. 4a shows the behaviour of the Betti numbers.
The interplay between Betti numbers and the Euler characteristic across varying HAGB fractions demonstrates the intricate relationship between local features (e.g., loops and grains) and global topological phases, providing valuable insight into the structural evolution of the GBN.
2.5 Evolution with Accumulated Plastic Strain
The relationships between network invariants and the HAGB fraction discussed earlier provide one aspect of the structural evolution during SPD, and the connection between the HAGB fraction and the accumulated plastic strain,
Experimental evidence highlights a consistent trend that the HAGB fraction starts at a low value in the undeformed material and progressively rises with increasing plastic strain until saturation is reached at high strains. This evolution provides valuable insights into the GBN’s ability to accommodate deformation. In [55], a mathematical relationship to describe the dependence of the HAGB fraction
here,
The curve fitting for various copper alloys, aligning the experimental data with the proposed equation for the evolution of the HAGB fraction is illustrated in Fig. 5a. The curves demonstrate how the material parameters

Figure 5: (a) Fraction of HAGBs
3 Finite-Element Analysis for Topology Evolution during Cyclic SPD
PTCAP is a typical SPD technique. Compared to the widely employed Equal Channel Angular Pressing (ECAP) process, PTCAP offers the advantage of facilitating multiple deformation cycles with greater ease, thereby enabling higher levels of accumulated plastic strain (PEEQ). The primary components of the PTCAP setup comprise the punch, die, mandrel, and tube, with the structural schematic depicted in Fig. 6a. In practical applications, following each PTCAP operation, the specimen is typically rotated and inverted before the subsequent compression step. This complete sequence constitutes a single PTCAP cycle, as illustrated in Fig. 6b. According to our previous study [39], a sufficiently wide range of PEEQ is essential to capture the microstructural evolution of copper fully. Consequently, to explore the topological development of copper microstructure during the PTCAP process, numerical simulations were performed using the commercial finite element software Abaqus. To ensure adequate strain accumulation, four successive PTCAP cycles were simulated. The DCC method was subsequently employed to systematically examine the evolution of copper microstructural topology as a function of PEEQ.

Figure 6: (a) Schematic diagram of PTCAP structure; (b) Schematic diagram of multiple PTCAP processes
3.1 Finite-Element Simulation Details
Owing to the symmetry in the geometry, material properties, and boundary conditions of the simulated object, an axisymmetric model was adopted during the modelling process. This approach significantly simplified both the model’s construction and the subsequent analysis. As illustrated in Fig. 7, the components shown in the assembly diagram comprise the punch (a), mandrel (b), tube (c), and die (d). Of these, the punch, die, and mandrel were defined as discrete rigid bodies, whereas the tube was modelled as a deformable body.

Figure 7: Loading and boundary condition for an axisymmetric finite-element model of PTCAP processing of copper tube
As this study does not focus on the geometric optimisation of the PTCAP tooling, the die channel angle and radius were set according to the values reported in [61]. The research in this paper suggests that larger channel angles permit greater strain accumulation over the same number of cycles. However, in numerical simulations, larger angles may result in excessive mesh distortion, which in turn compromises convergence and the accuracy of the results. To balance the need for effective strain accumulation with numerical stability, a channel angle of

In the above equation, A, B, C,

Given the substantial deformation occurring during the PTCAP process, this study employed a dynamic explicit analysis step to simulate four successive PTCAP cycles. To mitigate mesh distortion resulting from severe deformation—which could compromise the accuracy of the results—the Arbitrary Lagrangian-Eulerian (ALE) adaptive meshing technique was activated. Furthermore, to accelerate the computational process, mass scaling was applied with a scaling factor of 1,000,000. In terms of contact definitions, face-to-face contact was established between the copper tube and the die, the mandrel, and the punch, respectively. Self-contact was also defined for the copper tube to account for potential internal interactions during deformation. To avoid geometric interference, the normal contact behaviour was defined as hard contact, while the tangential behaviour was governed by a penalty contact formulation. A friction coefficient of 0.05 was employed in (Table 1), in line with values reported in [61]. This value also ensures consistency with other selected process parameters—such as the channel angle, deformation (determined by the radius difference between inlet and outlet channels), and loading speed, thereby effectively controlling experimental variables. Reference points RP1, RP2, and RP3 corresponded to the die, mandrel, and punch, respectively. About boundary conditions, all translational and rotational degrees of freedom were constrained for RP2 and RP3, while RP1 was constrained in all directions except for translation along the Y-axis. Also according to [61], an increased loading rate significantly enhances the accumulation of equivalent plastic strain (PEEQ) during a single PTCAP cycle. However, elevated loading rates may also lead to substantial heat generation due to frictional effects, thereby introducing thermal influences. As thermal-mechanical coupling was not considered in the present numerical simulations, a conservative loading rate of 1 mm/s was selected to minimise errors arising from temperature rise and reduce the influence of thermal effects on simulation accuracy (Table 1). The copper tube was meshed using CAX4R elements. In contrast, rigid components were meshed using RAX2 elements.
The flowchart and coupling schemes of the integrated framework are summarised in Fig. 8, illustrating how the real GBN, DCC model and FEA simulation work together. In the present framework, the DCC serves as a topologically faithful representation of the polycrystalline microstructure, and this abstraction enables a discrete but physically interpretable mapping of the GBN evolution during SPD. The evolution of microstructure under SPD, including subgrain rotation to boundary misorientation accumulation and grain fragmentation, is reflected as topological transformations within the DCC. The conversion of LAGBs into HAGBs corresponds to increased connectivity and loop formation in the DCC, which are quantitatively characterised by changes in Betti numbers and the Euler characteristics.

Figure 8: Flowchart and coupling schemes
3.2 Finite-Element Simulations Results
Through finite-element simulations, the PEEQ (equivalent plastic strain) data

Figure 9: Contour maps for the HAGB fraction distribution after each PTCAP cycle

Figure 10: Contour maps for the distribution of microstructure topology parameters after each PTCAP cycle: (a) Betti0 (
The current framework employs a one-way coupling scheme from FEA to microstructural evolution. In this approach, the macroscopic strain and stress fields obtained from FEA are used as inputs to drive the topological evolution of the GBN, without accounting for feedback effects from the evolving microstructure on the mechanical response. This assumption is justified within the scope of the present study, which aims to establish a tractable method for investigating topological descriptors such as Betti numbers, Euler characteristics, and HAGB fractions under SPD. The one-way strategy offers computational efficiency and preserves a clear separation of scales, while still capturing the essential features of microstructural evolution. It captures key aspects of GBN evolution, including the progressive transformation of LAGBs into HAGBs and the restructuring of TJs. However, it does not currently model the explicit coalescence or splitting of GBs. While interactions among multiple grains are embedded within the topological structure of the DCC, dynamic reconnections or local topological changes, such as grain fragmentation or merging, remain beyond the scope of this work.
In Fig. 9, it is found that with increasing PTCAP cycles, the HAGB fraction in the copper tube gradually increases, primarily due to the CDRX mechanisms that promote the transformation of LAGBs into HAGBs, indicating that subgrains are progressively transformed into grains and new grains form. In tube-shaped PTCAP samples, the distribution of HAGBs is often heterogeneous, influenced by the imposed shear strain gradient across the cross-section, with a higher concentration typically observed near the outer wall where strain is most intense. While traditional metrics such as grain size distribution and average HAGB fraction offer limited insight into the topological structure of evolving GBNs, higher-order metrics such as the distribution of triple junction types, can capture essential features of topological change. These features, accessible via EBSD and previously validated in our earlier work [28,39], offer a meaningful way to compare simulated and experimental microstructures in the context of SPD-induced grain refinement. Fig. 10 illustrates the spatial evolution of microstructural topology in the PTCAP-processed tube samples through contour maps of Betti numbers
As it shown in Fig. 11, to elucidate the heterogeneous microstructural evolution induced by PTCAP, the development of HAGB networks was analyzed at two representative FE points: one situated in the central region of the tube—Element 1, and the other at the center of the edge region—Element 2. These points experience markedly different strain paths and magnitudes due to the inherent strain gradient imposed by the PTCAP die geometry and sample curvature. The FE Element 2 is subjected to higher PEEQ, promoting more pronounced grain fragmentation and a faster transformation from LAGBs to HAGBs via CDRX. In contrast, the central region Element 1, characterized by lower strain accumulation and a more uniform stress state, exhibits a slower HAGB formation rate and retains a higher fraction of LAGBs throughout processing.
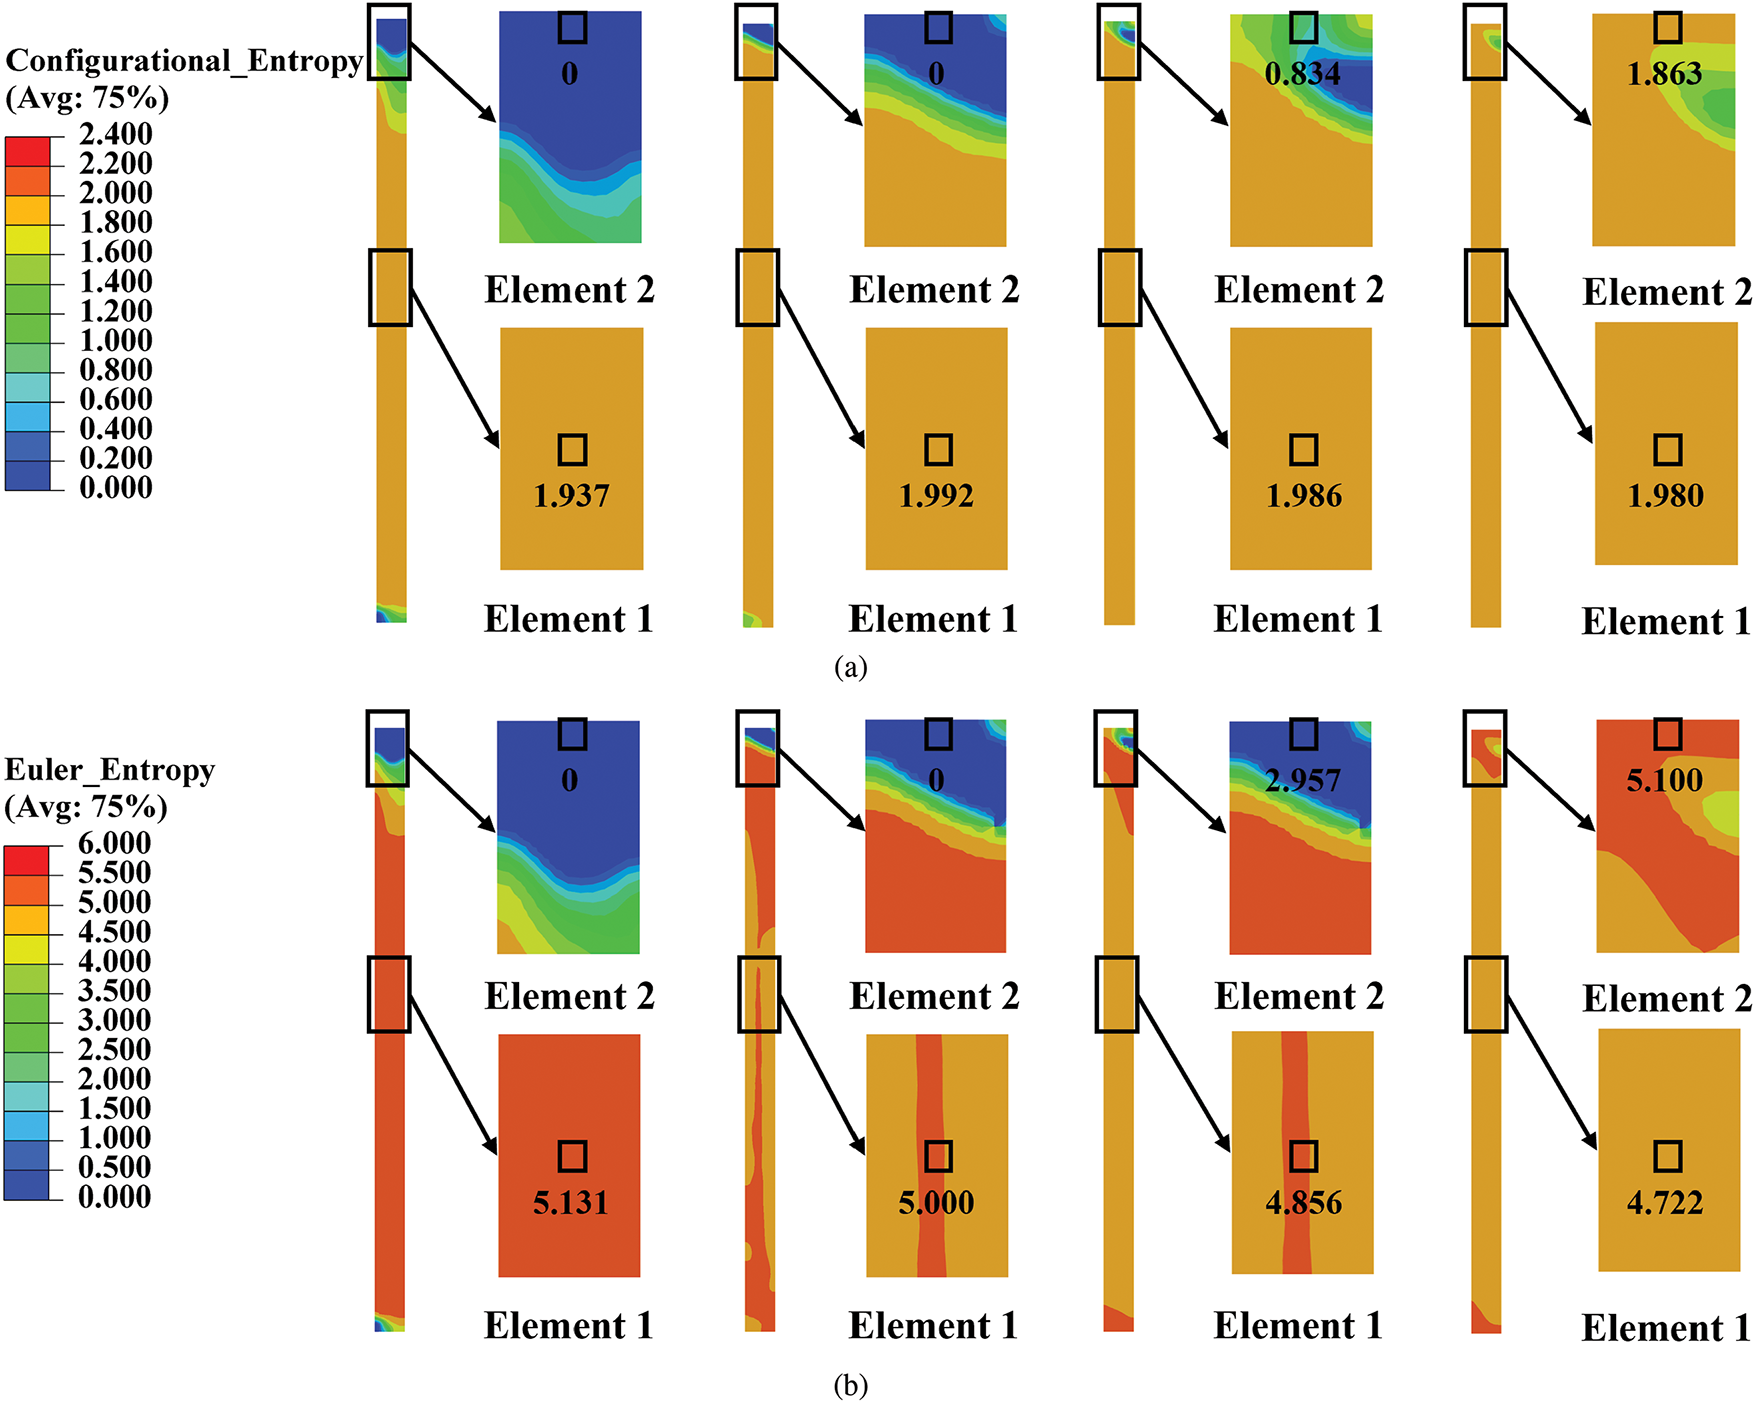
Figure 11: Contour maps for the distribution of two types of entropy after each PTCAP cycle and the difference between Elements 1 and 2: (a) Configurational entropy; (b) Euler entropy
To capture the local topological evolution of the microstructure under SPD, a representative, referred to as FE element 1, was selected for detailed analysis. The evolution of configurational and Euler entropy at FE Element 1 can provide complementary insights into the structural reorganization of the HAGB network during PTCAP processing, as it shown in Fig. 12a. Both entropy measures reveal significant changes in GBN structure as the PEEQ increases. Notably, the configurational entropy rises with increasing strain but tends to plateau once

Figure 12: (a) Configurational entropy and Euler entropy as functions of the PEEQ of Element 1; (b) Betti numbers and Euler characteristic as functions of the PEEQ of Element 1
Changes in Betti numbers further elucidate the dynamic microstructure topology evolution in Fig. 12b with the evolution of HAGB network.
In conclusion, we have integrated macroscopic FEA and mesoscopic DCC analysis to demonstrate the attempt for the computational evaluation of the microstructure topology evolution during PTCAP cycles that belong to a typical SPD process. Microstructure topology evolution (HAGB fraction, Betti numbers, Configurational/Euler entropy, and Euler characteristic) in the RVE including microstructure details is predicted by DCC simulations. The macroscopic deformation behaviour under PTCAP cycles is simulated by FEM with a Johnson-Cook constitutive relationship to obtain PEEQ distribution. These simulations are one-way coupled through the information transfer among them. Microstructure topology parameters as functions of accumulated strain PEEQ are used as input for the FEA. In detail, once PEEQ is calculated at the FE node, microstructure topology parameters at this corresponding node are determined by the DCC simulation results and thus their spatial distribution is readily presented in the macroscopic scale.
Using the mesoscopic DCC analysis of copper RVE, the microstructure topology evolution as a function of accumulated strain is explored during the SPD process. The progressive increase in the HAGB faction indicates CDRX, where subgrains transition into fully developed grains. Although no direct experimental validation is provided in this study, the predicted increase in HAGB fraction with strain and the spatial redistribution of topological features qualitatively agree with prior observations in SPD-processed copper. Future efforts will focus on integrating EBSD or TEM-based measurements to directly validate the model’s predictions and assess its generalizability to other materials and SPD configurations The topological analysis, characterized by Betti numbers (
This one-way coupling framework approach enabled the prediction of local equivalent strain distributions and provided initial insights into their influence on microstructural development. However, we acknowledge that even when different regions experience similar levels of equivalent strain, their resulting microstructures can differ significantly due to variations in strain path, rate, and local constraints. This highlights the need for developing a more advanced two-way coupling framework, where the evolving microstructure can in turn influence the local mechanical response. To address this, future work will explore two-way coupling strategies, through iterative updates of the FEA simulation informed by topology-aware constitutive models, and via concurrent multiscale approaches to more accurately capture the interplay between mechanics and microstructure.
Acknowledgement: The authors acknowledge the support from High Performance Computing Platform of Nanjing University of Aeronautics and Astronautics.
Funding Statement: The authors acknowledge the support from Outstanding Youth Fund of Jiangsu Province (BK20240077), Key Project (Provincial-Municipal Joint) of Jiangsu Province (BK20243044), Fundamental Research Funds for the Central Universities (NE2024001), National Youth Talents Program of China, and a project funded by the Priority Academic Program Development of Jiangsu Higher Education Institutions.
Author Contributions: Siying Zhu: Conceptualization; Methodology; Software; Validation; Formal Analysis; Investigation; Original Draft & Review & Editing; Project Administration; Supervision. Weijian Gao: Conceptualization; Methodology; Software; Validation; Formal Analysis; Investigation; Original Draft & Review & Editing. Min Yi: Conceptualization; Methodology; Formal Analysis; Writing—Original Draft & Review & Editing; Supervision; Project Administration; Funding Acquisition. Zhuhua Zhang: Conceptualization; Writing—Review & Editing; Supervision; Project Administration; Funding Acquisition. All authors reviewed the results and approved the final version of the manuscript.
Availability of Data and Materials: The datasets and code used or analyzed during the current study are available from the corresponding authors on reasonable request.
Ethics Approval: This article does not contain any studies with human participants or animals performed by any of the authors.
Conflicts of Interest: The authors declare no conflicts of interest to report regarding the present study.
List of Symbols and Abbreviations
| Boundary operators map | |
| Betti numbers | |
| Euler characteristic | |
| Collection of | |
| Entropy constant | |
| Combinatorial Laplacian map | |
| Collection of polyhedra | |
| Fraction of high angle grain boundaries | |
| Configurational entropy (Structural entropy) | |
| T | Temperature |
| Stress | |
| Accumulated plastic strain | |
| Continuous dynamic recrystallisation | |
| Discrete cell complexes | |
| Finite element method | |
| Grain boundary | |
| Grain boundary engineering | |
| Grain boundary network | |
| High angle grain boundary | |
| Low angle grain boundary | |
| Maximum entropy production principle | |
| Parallel tube channel angular pressiong | |
| Quadruple node | |
| Representative volume element | |
| Severe plastic deformation | |
| Triple junction | |
| Ultra-fine grained |
References
1. Valiev RZ, Islamgaliev RK, Alexandrov IV. Bulk nanostructured materials from severe plastic deformation. Prog Mater Sci. 2000;45(2):103–89. doi:10.1016/S0079-6425(99)00007-9. [Google Scholar] [CrossRef]
2. Estrin Y, Vinogradov A. Extreme grain refinement by severe plastic deformation: a wealth of challenging science. Acta Mater. 2013;61(3):782–817. doi:10.1016/j.actamat.2012.10.038. [Google Scholar] [CrossRef]
3. Harsha R, Kulkarni VM, Babu BS. Severe plastic deformation—a review. Mater Today Proc. 2018;5(10, Part 3):22340–9. doi:10.1016/j.matpr.2018.06.600. [Google Scholar] [CrossRef]
4. Fattahi M, Hsu CY, Ali AO, Mahmoud ZH, Dang N, Kianfar E. Severe plastic deformation: nanostructured materials, metal-based and polymer-based nanocomposites: a review. Heliyon. 2023;9(12):e22559. doi:10.1016/j.heliyon.2023.e22559. [Google Scholar] [PubMed] [CrossRef]
5. Zhang X, Gui Y, Lai M, Lu X, Gu J, Wang F, et al. Enhanced strength-ductility synergy of medium-entropy alloys via multiple level gradient structures. Int J Plast. 2023;164:103592. doi:10.1016/j.ijplas.2023.103592. [Google Scholar] [CrossRef]
6. Demirtas M, Purcek G. Room temperature superplaticity in fine/ultrafine grained materials subjected to severe plastic deformation. Mater Trans. 2019;60(7):1159–67. doi:10.2320/matertrans.M2019015. [Google Scholar] [CrossRef]
7. Edalati K, Hidalgo-Jiménez J, Nguyen TT, Sena H, Enikeev N, Rogl G, et al. Severe plastic deformation of ceramics by high-pressure torsion: review of principles and applications. Annu Rev Mater Res. 2025;55(1):89–124. doi:10.1146/annurev-matsci-080423-122701. [Google Scholar] [CrossRef]
8. Sakai T, Belyakov A, Kaibyshev R, Miura H, Jonas JJ. Dynamic and post-dynamic recrystallization under hot, cold and severe plastic deformation conditions. Prog Mater Sci. 2014;60(1):130–207. doi:10.1016/j.pmatsci.2013.09.002. [Google Scholar] [CrossRef]
9. Huang K, Logé RE. A review of dynamic recrystallization phenomena in metallic materials. Mater Des. 2016;111(8):548–74. doi:10.1016/j.matdes.2016.09.012. [Google Scholar] [CrossRef]
10. Afifeh M, Hosseinipour SJ, Jamaati R. Nanostructured copper matrix composite with extraordinary strength and high electrical conductivity produced by asymmetric cryorolling. Mater Sci Eng A. 2019;763:138146. doi:10.1016/j.msea.2019.138146. [Google Scholar] [CrossRef]
11. Gao Y, Guo T, Feng R, Qian D, Huang D, Zhang G, et al. High strength high conductivity copper prepared by C-ECAP and cryo-rolling. Mater Charact. 2024;208(9):113665. doi:10.1016/j.matchar.2024.113665. [Google Scholar] [CrossRef]
12. Abbasi S, Momeni A, Lin Y, Jafarian H. Dynamic softening mechanism in Ti-13V-11Cr-3Al beta Ti alloy during hot compressive deformation. Mater Sci Eng A. 2016;665:154–60. doi:10.1016/j.msea.2016.04.056. [Google Scholar] [CrossRef]
13. Sun Y, Zhang C, Feng H, Zhang S, Han J, Zhang W, et al. Dynamic recrystallization mechanism and improved mechanical properties of a near α high temperature titanium alloy processed by severe plastic deformation. Mater Charact. 2020;163:110281. doi:10.1016/j.matchar.2020.110281. [Google Scholar] [CrossRef]
14. Randle V, Ralph B. Grain boundary structure and mechanical properties. Rev Phys Appl. 1988;23(4):501–12. doi:10.1051/rphysap:01988002304050100. [Google Scholar] [CrossRef]
15. Engler O, Randle V. Introduction to texture analysis: macrotexture, microtexture, and orientation mapping. 2nd ed. Boca Raton, FL, USA: CRC Press; 2009. doi:10.1201/9781420063660. [Google Scholar] [CrossRef]
16. Johnson OK, Schuh CA. The uncorrelated triple junction distribution function: towards grain boundary network design. Acta Mater. 2013;61(8):2863–73. doi:10.1016/j.actamat.2013.01.025. [Google Scholar] [CrossRef]
17. Nguyen HD, Pramanik A, Basak A, Dong Y, Prakash C, Debnath S, et al. A critical review on additive manufacturing of Ti-6Al-4V alloy: microstructure and mechanical properties. Microstr Mech Prop, J Mater Res Technol. 2022;18(5):4641–61. doi:10.1016/j.jmrt.2022.04.055. [Google Scholar] [CrossRef]
18. Schuh CA, Kumar M, King WE. Analysis of grain boundary networks and their evolution during grain boundary engineering. Acta Mater. 2003;51(3):687–700. doi:10.1016/S1359-6454(02)00447-0. [Google Scholar] [CrossRef]
19. Frary M, Schuh CA. Grain boundary networks: scaling laws, preferred cluster structure, and their implications for grain boundary engineering. Acta Mater. 2005;53(16):4323–35. doi:10.1016/j.actamat.2005.05.030. [Google Scholar] [CrossRef]
20. Liu T, Xia S, Li H, Zhou B, Bai Q. The highly twinned grain boundary network formation during grain boundary engineering. Mater Lett. 2014;133(10):97–100. doi:10.1016/j.matlet.2014.06.166. [Google Scholar] [CrossRef]
21. Carter JL, Sosa JM, Shade PA, Fraser HL, Uchic MD, Mills MJ. The potential link between high angle grain boundary morphology and grain boundary deformation in a nickel-based superalloy. Mater Sci Eng A. 2015;640(4):280–86. doi:10.1016/j.msea.2015.05.031. [Google Scholar] [CrossRef]
22. Huang Q, Zhu Q, Chen Y, Gong M, Li J, Zhang Z, et al. Twinning-assisted dynamic adjustment of grain boundary mobility. Nat Commun. 2021;12(1):6695. doi:10.1038/s41467-021-27002-3. [Google Scholar] [PubMed] [CrossRef]
23. Liu Q, Fang L, Xiong Z, Yang J, Tan Y, Liu Y, et al. The response of dislocations, low angle grain boundaries and high angle grain boundaries at high strain rates. Mater Sci Eng A. 2021;822:141704. doi:10.1016/j.msea.2021.141704. [Google Scholar] [CrossRef]
24. Liang C, Wang N, Chen Y, Jiang C, Wu G, Zhao Q, et al. Transition of low and high-angle grain boundaries during strain rate-induced dislocation storage and annihilation. Mater Charact. 2023;205(7):113284. doi:10.1016/j.matchar.2023.113284. [Google Scholar] [CrossRef]
25. Chen MJ, Xie D, Fensin S, Hunter A, Li N, Zikry MA. Intergranular fracture, grain-boundary structure, and dislocation-density interactions in FCC bicrystals. Sci Rep. 2024;14(1):7454. doi:10.1038/s41598-024-72033-7. [Google Scholar] [PubMed] [CrossRef]
26. Rohrer GS, Miller HM. Topological characteristics of plane sections of polycrystals. Acta Mater. 2010;58(10):3805–14. doi:10.1016/j.actamat.2010.03.028. [Google Scholar] [CrossRef]
27. Wanner T, Fuller ER, Saylor DM. Homology metrics for microstructure response fields in polycrystals. Acta Mater. 2010;58(1):102–10. doi:10.1016/j.actamat.2009.08.061. [Google Scholar] [CrossRef]
28. Zhu S, Borodin E, Jivkov AP. Topological characteristics of grain boundary networks during severe plastic deformations of copper alloys. Acta Mater. 2023;259(16):119290. doi:10.1016/j.actamat.2023.119290. [Google Scholar] [CrossRef]
29. Bushuev O, Borodin E, Bodyakova A, Zhu S, Jivkov AP. Disorientation-based classification of mesostructures in severely deformed copper alloys. Acta Mater. 2025;286(4):120714. doi:10.1016/j.actamat.2025.120714. [Google Scholar] [CrossRef]
30. Lowe TC, Valiev RZ. The use of severe plastic deformation techniques in grain refinement. JOM. 2004;56(10):64–8. doi:10.1007/s11837-004-0295-z. [Google Scholar] [CrossRef]
31. Li M, Xu T. Topological and atomic scale characterization of grain boundary networks in polycrystalline and nanocrystalline materials. Prog Mater Sci. 2011;56(6):864–99. doi:10.1016/j.pmatsci.2011.01.002. [Google Scholar] [CrossRef]
32. Pandey K, Poswal H. A new compact symmetric shear diamond anvil cell for in situ high-pressure-torsion studies. Rev Sci Instrum. 2023;95(5):053904. doi:10.1063/5.0172916. [Google Scholar] [CrossRef]
33. Herbig M. Spatially correlated electron microscopy and atom probe tomography: current possibilities and future perspectives. Scr Mater. 2018;148:98–105. doi:10.1016/j.scriptamat.2017.11.031. [Google Scholar] [CrossRef]
34. Gokuli M, Runnels B. Multiphase field modeling of grain boundary migration mediated by emergent disconnections. Acta Mater. 2021;217(4):117149. doi:10.1016/j.actamat.2021.117149. [Google Scholar] [CrossRef]
35. Mishin Y. Stochastic model and kinetic monte carlo simulation of solute interactions with stationary and moving grain boundaries. II. Application to two-dimensional systems. Phys Rev Mater. 2023;7(6):063404. doi:10.1103/PhysRevMaterials.7.063404. [Google Scholar] [CrossRef]
36. Zhao S, Zhang Y, Weber WJ. Stability of vacancy-type defect clusters in Ni based on first-principles and molecular dynamics simulations. Scr Mater. 2018;145:71–5. doi:10.1016/j.scriptamat.2017.10.003. [Google Scholar] [CrossRef]
37. Pippan R, Wetscher F, Hafok M, Vorhauer A, Sabirov I. The limits of refinement by severe plastic deformation. Adv Eng Mater. 2006;8(11):1046–56. doi:10.1002/adem.200600133. [Google Scholar] [CrossRef]
38. Pippan R, Scheriau S, Hohenwarter A, Hafok M. Advantages and limitations of hpt: a review. In: Materials science forum. Vol. 584, 2008. p. 16–21. doi:10.4028/www.scientific.net/MSF.584-586.16. [Google Scholar] [CrossRef]
39. Zhu S, Borodin E, Jivkov AP. Triple junctions network as the key pattern for characterisation of grain structure evolution in metals. Mater Des. 2021;198(24):109352. doi:10.1016/j.matdes.2020.109352. [Google Scholar] [CrossRef]
40. Zhu S. In silico grain boundary engineering by analysis on discrete complexes [Ph.D. thesis]. Manchester, UK: The University of Manchester; 2023. [Google Scholar]
41. Faraji G, Mashhadi MM, Kim HS. Tubular channel angular pressing (TCAP) as a novel severe plastic deformation method for cylindrical tubes. Mater Lett. 2011;65(19):3009–12. doi:10.1016/j.matlet.2011.06.039. [Google Scholar] [CrossRef]
42. Faraji G, Babaei A, Mashhadi MM, Abrinia K. Parallel tubular channel angular pressing (PTCAP) as a new severe plastic deformation method for cylindrical tubes. Mater Lett. 2012;77:82–5. doi:10.1016/j.matlet.2012.03.007. [Google Scholar] [CrossRef]
43. Kozlov D. Combinatorial algebraic topology. Vol. 21. Cham, Switzerland: Springer Science & Business Media; 2008. doi:10.1007/978-3-540-71962-5. [Google Scholar] [CrossRef]
44. Boom PD, Kosmas O, Margetts L, Jivkov AP. A geometric formulation of linear elasticity based on discrete exterior calculus. Int J Solids Struct. 2022;236–237(1):111345. doi:10.1016/j.ijsolstr.2021.111345. [Google Scholar] [CrossRef]
45. Berbatov K, Boom PD, Hazel AL, Jivkov AP. Diffusion in multi-dimensional solids using Forman’s combinatorial differential forms. Appl Math Model. 2022;110(2):172–92. doi:10.1016/j.apm.2022.05.043. [Google Scholar] [CrossRef]
46. Quey R. Neper: polycrystal generation and meshing; 2024. [cited 2025 Jul 1]. Available from: https://neper.info. [Google Scholar]
47. May JP. A concise course in algebraic topology. Vol. 38. Chicago, IL, USA: University of Chicago Press; 1999. p. 91199–9. doi: 10.1016/s0898-1221(99). [Google Scholar] [CrossRef]
48. Cooke GE, Finney RL. Homology of cell complexes. Princeton, NJ, USA: Princeton University Press; 1967. doi:10.1515/9781400877751. [Google Scholar] [CrossRef]
49. Mieghem PV. Graph spectra for complex networks. Cambridge, UK: Cambridge University Press; 2010. doi:10.1017/CBO9780511921681. [Google Scholar] [CrossRef]
50. Weber M, Saucan E, Jost J. Characterizing complex networks with Forman-Ricci curvature and associated geometric flows. J Complex Netw. 2017;5(4):527–50. doi:10.1093/comnet/cnw030. [Google Scholar] [CrossRef]
51. Friedman J. Computing betti numbers via combinatorial laplacians. Algorithmica. 1998;21(4):331–46. doi:10.1007/PL00009218. [Google Scholar] [CrossRef]
52. Aktas ME, Akbas E, Fatmaoui AE. Persistence homology of networks: methods and applications. Appl Netw Sci. 2019;4(1):1–28. doi:10.1007/s41109-019-0179-3. [Google Scholar] [CrossRef]
53. Agami S, Adler RJ. Modeling of persistent homology. Commun Stat-Theory Methods. 2020;49(20):4871–88. doi:10.1080/03610926.2019.1615091. [Google Scholar] [CrossRef]
54. Spanier EH. Algebraic topology. Cham, Switzerland: Springer Science & Business Media; 1989. doi:10.1007/978-1-4684-9322-1. [Google Scholar] [CrossRef]
55. Borodin EN, Morozova A, Bratov V, Belyakov A, Jivkov AP. Experimental and numerical analyses of microstructure evolution of Cu-Cr-Zr alloys during severe plastic deformation. Mater Charact. 2019;156(8):109849. doi:10.1016/j.matchar.2019.109849. [Google Scholar] [CrossRef]
56. Ziegler H. An introduction to thermomechanics. Amsterdam, Netherlands: Elsevier; 2012. [Google Scholar]
57. Martyushev LM, Seleznev VD. Maximum entropy production principle in physics, chemistry and biology. Phys Rep. 2006;426(1):1–45. doi:10.1016/j.physrep.2005.12.001. [Google Scholar] [CrossRef]
58. Martyushev LM. Entropy and entropy production: old misconceptions and new breakthroughs. Entropy. 2013;15(4):1152–70. doi:10.3390/e15041152. [Google Scholar] [CrossRef]
59. Morozova A, Borodin E, Bratov V, Zherebtsov S, Belyakov A, Kaibyshev R. Grain refinement kinetics in a low alloyed Cu-Cr-Zr alloy subjected to large strain deformation. Materials. 2017;10(12):1394. doi:10.3390/ma10121394. [Google Scholar] [PubMed] [CrossRef]
60. Lifshitz E, Pitaevskij L. Course of theoretical physics. Vol. 10. Oxford, UK: Physical kinetics; 1981. [Google Scholar]
61. Abd El Aal MI, Gadallah EA. Gadallah, parallel tubular channel angular pressing (PTCAP) processing of the Cu-20.7Zn-2Al tube. Materials. 2022;15(4):1469. doi:10.3390/ma15041469. [Google Scholar] [CrossRef]
62. Wu S, Ju K, Duan C, Kong J. Dynamic mechanical properties and constitutive model of fine-grained T2 copper. Tool Eng. 2019;53(11):16–20. doi:10.3969/j.issn.1000-7008.2019.11.004. [Google Scholar] [CrossRef]
Cite This Article
 Copyright © 2025 The Author(s). Published by Tech Science Press.
This work is licensed under a Creative Commons Attribution 4.0 International License , which permits unrestricted use, distribution, and reproduction in any medium, provided the original work is properly cited.
 Downloads
 Citation Tools