
 Submit a Paper
 Propose a Special lssue
 Open Access
ARTICLE
Optimized Cardiovascular Disease Prediction Using Clustered Butterfly Algorithm
1 Amrita School of Computing, Amrita Vishwa Vidyapeetham, Amaravati, 522503, Andhra Pradesh, India
2 Department of Data Science and Artificial Intelligence, International Institute of Information Technology, Naya Raipur, 493661, Chhattisgarh, India
3 College of Technological Innovation, Zayed University, Dubai, 19282, United Arab Emirates
4 Department of Applied AI, School of Convergence, College of Computing and Informatics, Sungkyunkwan University, Seoul, 03063, Republic of Korea
* Corresponding Author: Farman Ali. Email:
(This article belongs to the Special Issue: Recent Advancements in Machine Learning and Data Analysis for Disease Detection)
Computers, Materials & Continua 2025, 85(1), 1603-1630. https://doi.org/10.32604/cmc.2025.068707
Received 04 June 2025; Accepted 10 July 2025; Issue published 29 August 2025
 View Full Text
 Download PDF
Abstract
Cardiovascular disease prediction is a significant area of research in healthcare management systems (HMS). We will only be able to reduce the number of deaths if we anticipate cardiac problems in advance. The existing heart disease detection systems using machine learning have not yet produced sufficient results due to the reliance on available data. We present Clustered Butterfly Optimization Techniques (RoughK-means+BOA) as a new hybrid method for predicting heart disease. This method comprises two phases: clustering data using Roughk-means (RKM) and data analysis using the butterfly optimization algorithm (BOA). The benchmark dataset from the UCI repository is used for our experiments. The experiments are divided into three sets: the first set involves the RKM clustering technique, the next set evaluates the classification outcomes, and the last set validates the performance of the proposed hybrid model. The proposed RoughK-means+BOA has achieved a reasonable accuracy of 97.03 and a minimal error rate of 2.97. This result is comparatively better than other combinations of optimization techniques. In addition, this approach effectively enhances data segmentation, optimization, and classification performance.Keywords
The heart plays a significant role in the body, serving as the central pump that circulates oxygen-rich blood through a network of arteries and veins to nourish and sustain various organs and tissues. It is widely regarded as the most essential organ for maintaining overall health and function [1]. This disease poses a significant threat as it disrupts normal heart function, potentially leading to conditions such as coronary artery infection as well as impaired blood vessel function, along with various other complications [2]. According to the World Health Organization (WHO), cardiovascular disease (CVD) accounts for 17.9 million deaths annually, making it the leading cause of mortality on a global scale [3]. Engaging in unhealthy behaviors such as obesity, high cholesterol, hypertension, and hyperglycemia significantly elevates the likelihood of developing heart disease. In addition to these risk factors, the American Heart Association identifies symptoms such as leg swelling, sleep disturbances, persistent cough, weight gain, and a rapid heart rate as potential indicators of heart issues. The prevalence of heart disease places a considerable strain on the healthcare system, leading to an increase in hospital visits, including medical resource utilization. Despite the severity of the condition, only approximately 35% of heart disease specialists, according to a WHO survey, demonstrate proficiency in predicting heart attacks. Only 67% of heart problems can be accurately predicted by doctors. Thus, there is a significant need for advancements in human prediction of heart disease [4].
Cardiovascular illness not only affects individual health but also significantly impacts national economies and healthcare costs. Significant risk factors for cardiovascular disease include high cholesterol levels, smoking, obesity, family history, and diabetes [5]. Healthcare providers frequently monitor the cardiovascular health of newborns due to the potential for heart disease at birth. Fatigue and chest discomfort are among the most common indicators of developing heart illness in infants [6]. Heart failure (HF) and coronary artery disease (CAD) are among the ubiquitous types of heart conditions. CAD, characterized by the narrowing or blockage of coronary arteries, is a primary cause of HF, as it impairs blood flow to the heart muscle [7]. Numerous studies focus on prognostic factors for cardiac diseases. Recently, advancements in artificial intelligence, as well as machine learning (ML) approaches, have been increasingly applied in the healthcare sector to enhance clinical decision-making processes [8]. ML approaches, encompassing unsupervised, supervised, and reinforcement learning, were utilized to detect early signs of heart attacks. Comprehensive studies have been conducted on various types of heart diseases, analyzing 56 datasets comprising both structured and unstructured data. Researchers have also examined various ML models for identifying heart disease and suggest that these models play a significant role in predicting heart disease [9].
Handling sparse data, time-series data, disease-related features, patient distribution across different classes, training data preparation, and selecting the appropriate modeling algorithm are critical aspects of developing a detection model for heart illness. These tasks involve data preprocessing, feature engineering, balancing class distributions, and model selection to ensure accurate and robust predictions. Each step in the process requires careful consideration and expertise to build an effective detection model for heart illness [10]. Prior research on heart disease prediction has encountered limitations that have hindered its effectiveness. Issues such as misclassification and detection accuracy have been notable challenges. Consequently, there is a need to develop a model for heart illness that addresses these shortcomings. This new model aims to ensure the accuracy and precision of findings, thereby enhancing the effectiveness of efforts to predict heart illness. The objectives of the current work are listed below.
• A comprehensive data preprocessing pipeline is performed to effectively handle duplicate and missing values, followed by Min-Max normalization to ensure all feature values are scaled uniformly for optimal model performance.
• A novel approach is proposed that combines clustering techniques with the Butterfly Optimization Algorithm (BOA) to overcome the limitations of existing predictive models. The combination of clustering secured the optimization process for local patterns in patient data, enabling classification based on distinctive fitness values assessed through the BOA framework.
• The results are compared efficiently with various existing models using the benchmark dataset from the UCI repository to assess the efficiency and reliability of the proposed system.
The paper’s subsequent sections follow this structure: Section 2 presents a survey of previous work in the field of heart disease prediction. Section 3 outlines the proposed method for predicting heart disease. Section 4 details the experimental results and performance evaluation of the proposed method. Section 5 is a conclusion.
The prediction of heart disease has transitioned from manual calculations to modern automated approaches using machine intelligence models. These advanced models can generate rules or equations from training data to facilitate early prediction of heart diseases in patients. This section will explore the use of ML approaches in heart illness prediction systems, which are less expensive than manual operations. Automated ML systems utilize a variety of categorization algorithms, including decision trees (DT), K-Nearest Neighbors (KNN), Support Vector Machines (SVM), Logistic Regression (LR), Naive Bayes (NB), and Artificial Neural Networks (ANN). Each strategy is based on various capabilities and concepts, resulting in different prediction outcomes. The model’s input data influences the results [11]. They learned about different classification strategies for ML systems, as well as the performance of models—XGBoost, Logistic Regression, Naïve Bayes, Adaptive Boosting, and Bagging—using a combined dataset of 918 instances sourced from publicly available UCI and Kaggle heart disease datasets. Among these models, XGBoost achieved the highest predictive accuracy of 94.34%, demonstrating superior performance in heart disease detection compared to the other algorithms evaluated [12].
Diagnosis and assessment of patient severity are the most prominent steps during ICU admission. The proposed Integrated Disorder Detection and Severity Assessment Model (IDDSAM) is designed to identify and evaluate cardiac conditions [13]. This model uses a multisource, multitask approach by utilizing accessible and shareable data from diagnostic tests and bedside monitoring. This existing model helps to evaluate and treat hospital-acquired illnesses. A Hybrid Random Forest with a linear model (HRFLM) demonstrated significant effectiveness in predicting heart disease. By integrating the strengths of both Random Forest and Linear Model approaches and applying them to the Cleveland heart disease dataset, their HRFLM model achieved a predictive accuracy of 88.7%. This performance surpassed that of previously established methods cited in their work, suggesting that such hybrid strategies hold considerable promise for improving the accuracy of cardiovascular disease prediction through enhanced feature utilization [14]. To enhance the accuracy of medical diagnoses, numerous methods have been introduced for approximating heart disease. A novel technique known as MLP-EDMDA is implemented to analyze the electronic health records of heart patients [15].
ML-based approaches are presented for the identification and prognosis of chronic cardiovascular diseases, including DT, SVM, and RF [16]. The medical records are used for the practical implementation of the proposed system. These records are about diabetes mellitus, liver disease, and cardiovascular diseases. Various optimization methods, such as ant colony optimization (ACO), genetic algorithms (GA), and particle swarm optimization (PSO), are employed to address heart disease prediction. Artificial neural networks (ANN) were used in 2019 for cardiac disease prediction. After being tuned with PSO and ACO, it was compared to other classification approaches, such as KNN, NB, SVM, and multilayer perceptron, based on recall, accuracy, F1 score, and precision [17].
The accuracy of heart disease prediction using ensemble classification methods was examined by Latha and Jeeva [18]. They employed the Cleveland Heart dataset from the UCI ML repository for training and evaluation; the study applied bagging, boosting, stacking, and majority voting algorithms. The experiments demonstrated maximum accuracy enhancements of 6.92% via bagging, 5.94% via boosting, 6.93% via stacking, and 7.26% via majority voting with weak classifiers. Analysis of the results indicated that the majority voting approach achieved the most significant improvement in predictive accuracy compared to the other ensemble techniques. The authors presented a Fitness-Oriented Dragonfly Algorithm (FODA)-based deep learning (DL) framework for disease prediction in [19]. The FODA approach was applied to the Statlog and Cleveland datasets using Principal Component Analysis (PCA) for feature extraction. For the Cleveland dataset, the framework achieved accuracy, sensitivity, specificity, precision, net present value (NPV), and F1 score of 84.44%, 51.16%, 87.96%, 30.98%, 87.96%, and 38.59%, respectively. For the Statlog dataset, the results were a specificity of 86.05%, an accuracy of 86.5%, a sensitivity of 91.2%, a precision of 38.14%, a net present value of 86.05%, and an F1 score of 54.07%. The existing GCSA-DCNN hybrid model is a combination of a genetic algorithm, the Crow Search Method, and a Deep Convolutional Neural Network (CNN) [20].
Researchers employed ten distinct datasets to evaluate this model. However, this investigation focused particularly on datasets of cardiovascular disease, specifically Statlog and Heart-C. To improve the model’s classification accuracy, they employed a feature selection strategy and tested it with 10-fold cross-validation (CV). The model’s performance on the Statlog dataset was 89.10%, while on the Heart-C dataset, it was 88.30%. By utilizing DL approaches along with feature augmentation techniques, the risk of patients developing CVD was evaluated in the existing work [21]. The existing system trained a CNN for feature augmentation using sparse autoencoders (SAE) to reshape data into a 2D array. This approach integrates two processes within a complex network, SAE and a classifier (MLP or CNN). The CNN outperforms the MLP by 0.6% accuracy when jointly training the SAE. This suggests that the CNN enhances the SAE’s feature extraction process by compelling it to identify more relevant features with spatial location information. The MLP also influences the SAE’s feature extraction, but its impact is notably less significant than the convolutional network. These proposed methods outperformed other models by 90% in terms of precision, representing an improvement, especially for a condition that affects a large portion of the population.
The GAPSO-RF is a genetic algorithm combining PSO and a random forest method to help predict heart disease [22]. In this existing system, authors developed this model using 10-fold CV on the Statlog and Cleveland datasets. After dividing the datasets into a 70:30 train-test ratio, a Min-Max normalization method is used to prepare the data. They optimized the GAPSO-RF model’s parameters using the grid search approach. They declared a training time of 2559.10 s, an accuracy of 91.4%, a sensitivity of 95.56%, a precision of 89.58%, and an area under the curve (AUC) of 92.60% for the Statlog dataset. The results for the Cleveland dataset were as follows: 94% AUC, 95.6% accuracy, 92.68% sensitivity, and 97.44% precision. A novel method has been developed for identifying cardiac illness employing generative adversarial networks and long short-term memories (GAN-LSTM) [23]. This strategy consistently delivered equivalent performance outcomes across a range of datasets and ensemble models. However, we only tested the method using electrocardiogram (ECG) signals and avoided any additional data about other diseases. A combination of CNN and LSTM techniques is used to classify heart disease as either normal or abnormal [24]. CNN+LSTM achieved 89% accuracy and was validated using the k-fold cross-validation method. A hybrid approach achieves the highest accuracy when compared to traditional ML models in cardiovascular disease classification using a hybrid DL methodology. Various cross-validations, such as 5-fold, 10-fold, and 15-fold, were used to categorize fake information using RNN and LSTM combination methods. RNN applies three distinct activation functions throughout the categorization procedure. A preprocessing approach is used to sort and classify the balanced data and features that were extracted. The combination of hybrid DL methods achieves a classification accuracy of 95.10% [25]. As shown in Table 1, a wide range of prediction models, including base classifiers, hybrid models, and optimization-based methods, have been explored in prior research.
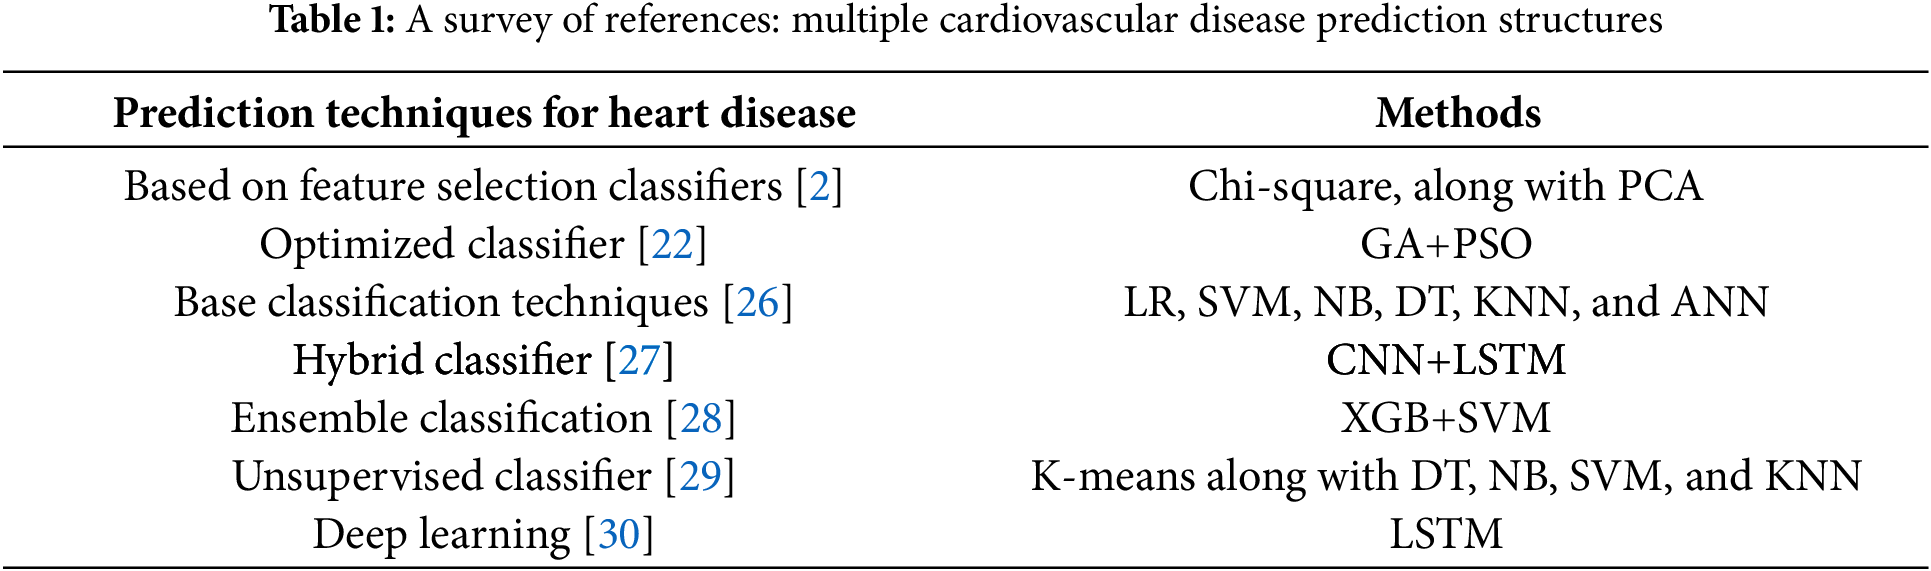
Fig. 1 illustrates the work contributions to heart illness prediction systems covered in this section. The graphic indicates that most studies utilized base classifiers, followed by ensemble classifiers, and then DL techniques [30]. Additionally, there has been less focus on developing a single efficient model, such as optimization techniques for heart disease prediction. In this study, a novel optimization method is proposed for predicting heart disease.
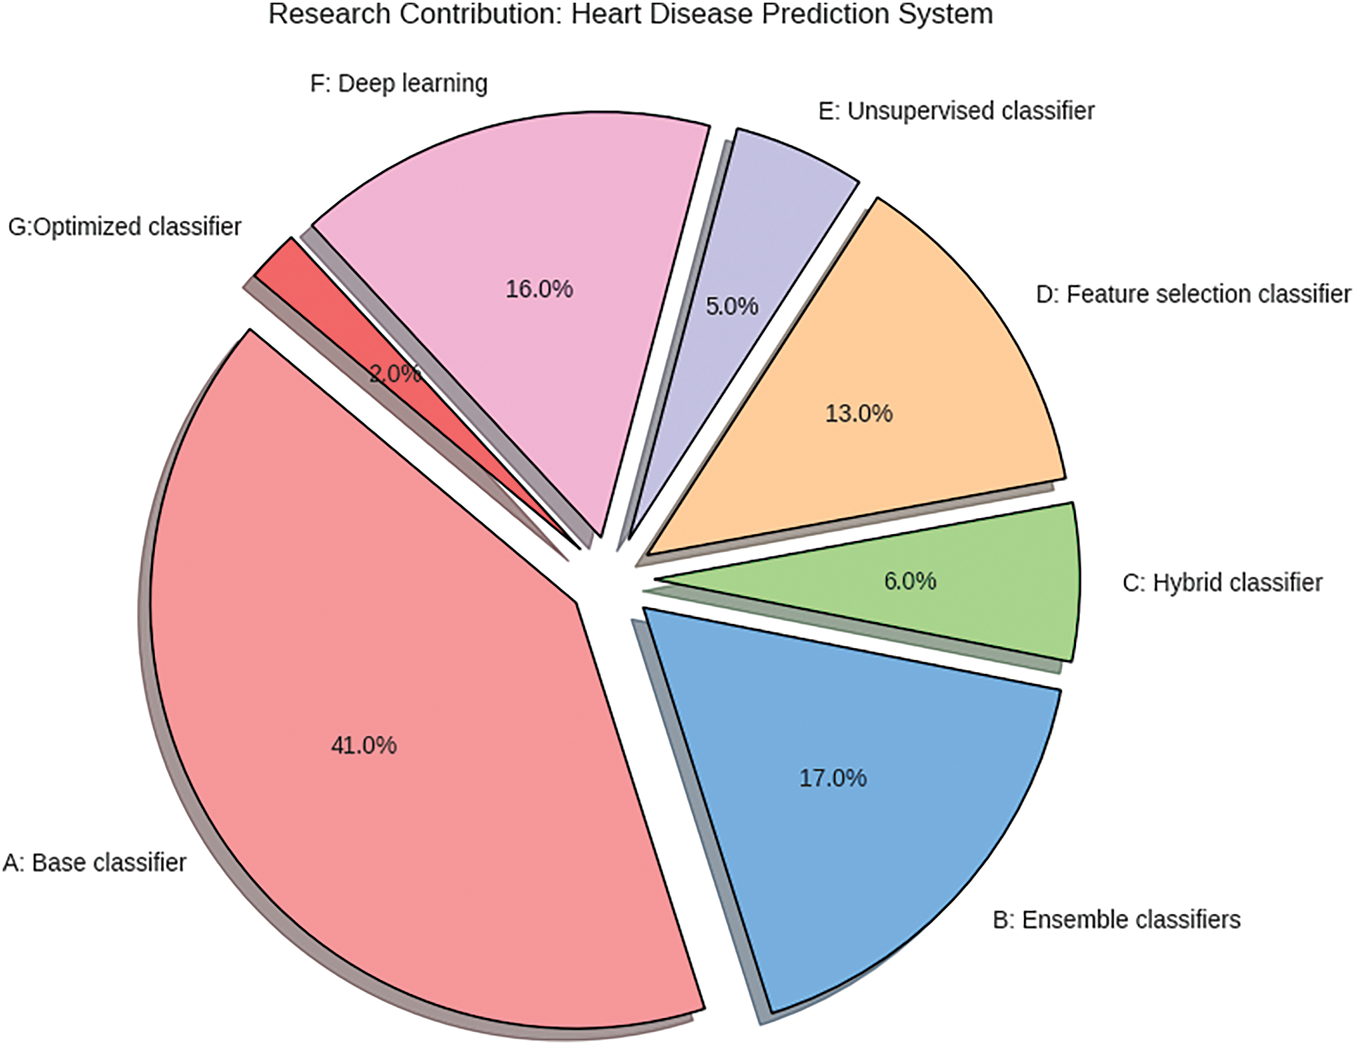
Figure 1: Research contributions to ML-based cardiovascular disease prediction system
The current section of the manuscript outlines the framework of the BOA model for classification and the RoughK-means algorithm for feature engineering. This section presents the dataset details and the data preprocessing steps. The corresponding block diagram of the proposed model is shown in Fig. 2.
Figure 2: Block diagram of the BOA approach for clustering
The initial step of the data analytics task is data collection. Therefore, we obtain public data from available sources, including the UCI repository. The next phase involves the data for our Clustered Butterfly optimization method to enhance the system’s reliability and accuracy. Data preparation involves various procedures, such as eliminating missing values and converting strings to nominal values. Further, the pre-processed data will be applied to clustering techniques to categorize the most valuable neighboring patients for model development. We then employed our innovative Butterfly algorithm to construct the heart disease prediction system. The BOA is utilized to refine the classification process rather than performing feature selection. BOA optimally adjusts the decision boundaries within each cluster generated by RKM, enhancing classification accuracy by improving the separation between data points. Through iterative adjustments, BOA fine-tunes classification parameters, optimizing the trade-off between exploration and exploitation to minimize misclassification errors. By integrating clustering with BOA-driven classification, the model ensures that each segmented group is processed with higher precision, leading to improved overall predictive performance and robustness in cardiovascular disease detection. Lastly, we did numerous experiments to validate the performance of the proposed system using the silhouette coefficient, error rate, recall, precision, average accuracy, and F1 score.
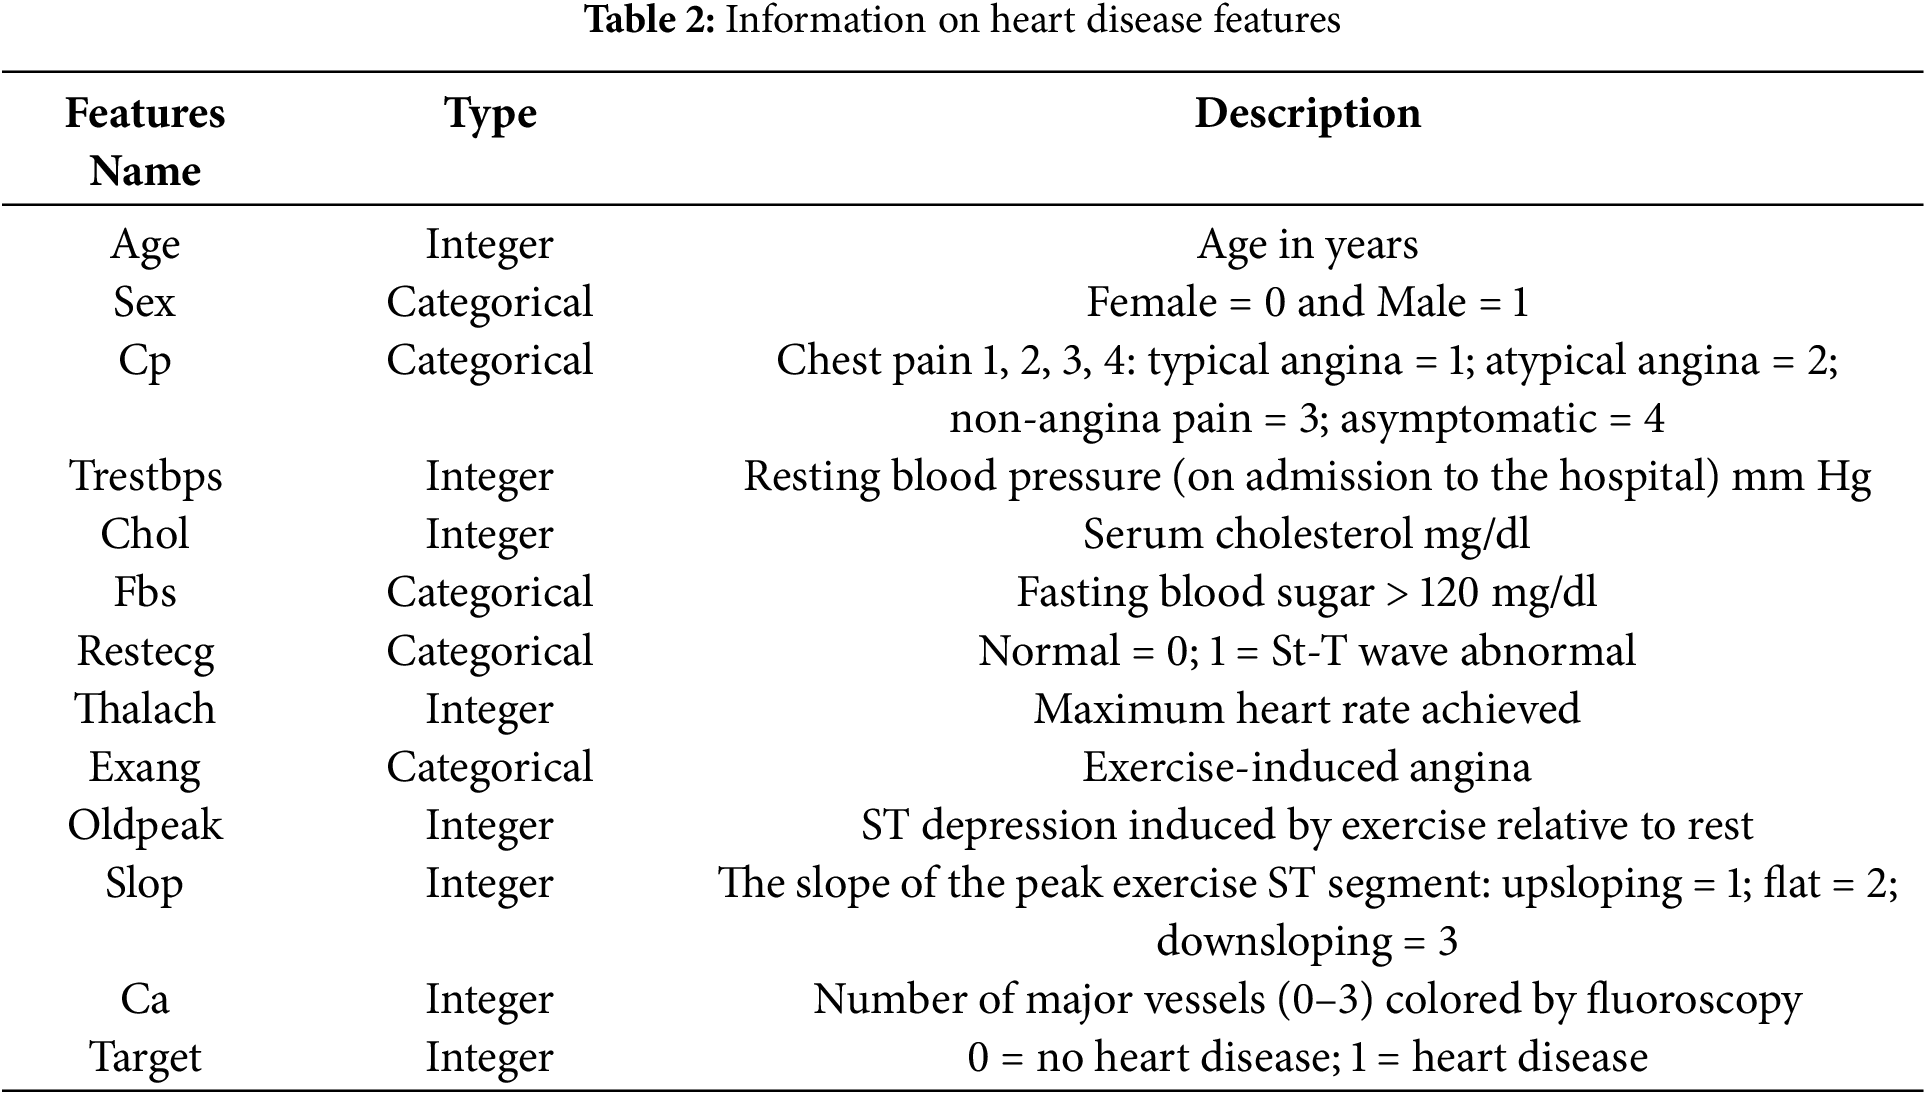
The Data was analysed from 303 individuals using 13 features sourced from the UCI repository’s heart disease dataset [31]. The dataset includes a class label with five categories, ranging from 0 to 4, where 0 indicates healthy individuals and 1 to 4 represent increasing heart disease severity. Out of the 303 patients, 139 are in various stages of heart disease (1 through 4), whereas 164 are healthy. During preprocessing, we removed irrelevant attributes and addressed missing values by imputing them with numerical values. Table 2 provides the key features of the heart disease dataset used in this study.
Features such as age, cholesterol (chol), resting blood pressure (trestbps), and maximum heart rate achieved (thalach) exhibit a normal or skewed distribution. In contrast, categorical variables such as sex, fasting blood sugar (fbs), and exercise-induced angina (exang) display distinct bar separations, indicating binary classifications. The presence of peaks in certain histograms suggests the occurrence of shared values, while scattered distributions highlight variability within the dataset. This visualization facilitates the identification of trends, potential outliers, and data imbalances, thereby contributing to more effective preprocessing and feature selection for subsequent analysis.
Fig. 3 uses the Pearson correlation coefficient, which can take values between −1 and +1, to depict the linear correlations between components. Values closer to ±1 indicate a stronger positive or negative association, whereas values closer to 0 indicate a weaker or no correlation.
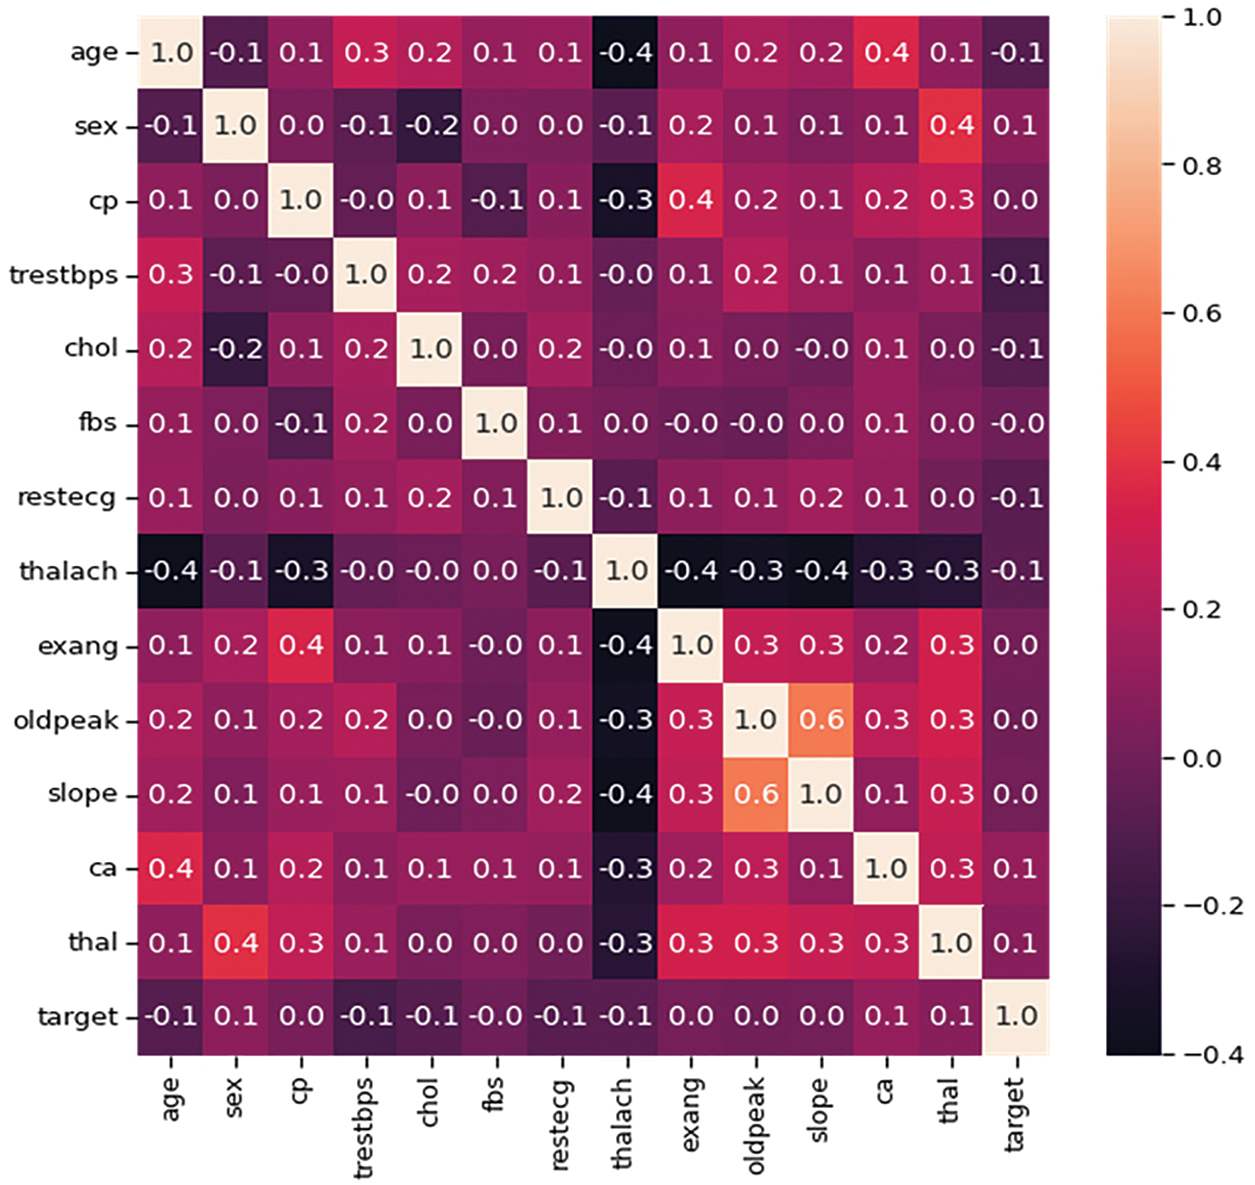
Figure 3: Heatmap of all attributes for heart disease prediction
It plays a crucial role in this phase by removing duplicates and inconsistencies, filling in missing values, and reducing the dataset to 75 attributes. Missing values are then imputed using the mean value of the respective features. This dataset was sourced from the UCI Repository. Attribute selection was performed to identify the 13 most relevant attributes from the UCI heart disease dataset. Initially, the dataset was utilized to partition into clusters based on similarities in clinical characteristics, identifying the most influential features that contributed to cluster separability. Further, redundant or highly correlated attributes were eliminated using correlation analysis to improve classification performance. Additionally, feature scaling was applied to normalize continuous variables, such as cholesterol and blood pressure, while categorical variables, including sex and chest pain type, were encoded for model compatibility.
To ensure that all features contributed equally to the clustering process, Min-Max normalization was applied to continuous variables like age, cholesterol, and resting blood pressure. These scaled feature values, which range between 0 and 1, prevent features with larger magnitudes from dominating the clustering process, which is crucial for avoiding dominance by attributes with larger numeric ranges. The decision to use Min-Max normalization stems from its ability to retain the relative distribution and spacing of data points while ensuring that all features contribute proportionately during clustering and classification. In the context of RKM and the Butterfly Optimization Algorithm, this scaling helps stabilize distance calculations and optimization processes, enhancing both convergence and model accuracy. The corresponding formula for data normalization is shown in Eq. (1).
From the above equation,
Data division involves separating a database into two subgroups: ‘training’ and ‘testing’. The data intended for the model input is stored in the training dataset, while the testing dataset contains data employed to assess the effectiveness of the trained and verified strategy [32]. This helps to determine the accuracy of the overall method and the frequency of incorrect predictions.
The K-fold approach is a prominent strategy for cross-validation. The data is uniformly and randomly distributed into k folds. The testing data is chosen, while the other sets are utilized as training data. This process is repeated until every data set has been used as test data, signifying that the test has been conducted in k instances. The efficacy of the proposed procedure was assessed using the k-fold cross-validation methodology in the trials, with k being set to 5.
The RKM clustering algorithm is employed to segment the dataset into distinct clusters prior to classification. Each data point was assigned to either the lower boundary, considered definitive membership, or the upper boundary, considered uncertain membership of a cluster. The clustered data was then passed to the BOA, which optimized classification within each cluster, thereby improving accuracy and computational efficiency. This allowed for the determination of the overall method’s accuracy and the frequency of incorrect predictions.
3.2 Clustering Using RKM: Feature Selection
Lingras and West incorporated the ideas of lower and upper approximations into k-means clustering. Using every cluster as a separate rough set with clearly defined lower boundary areas, they created a conventional RKM clustering method. Let
• An object
• If
• If
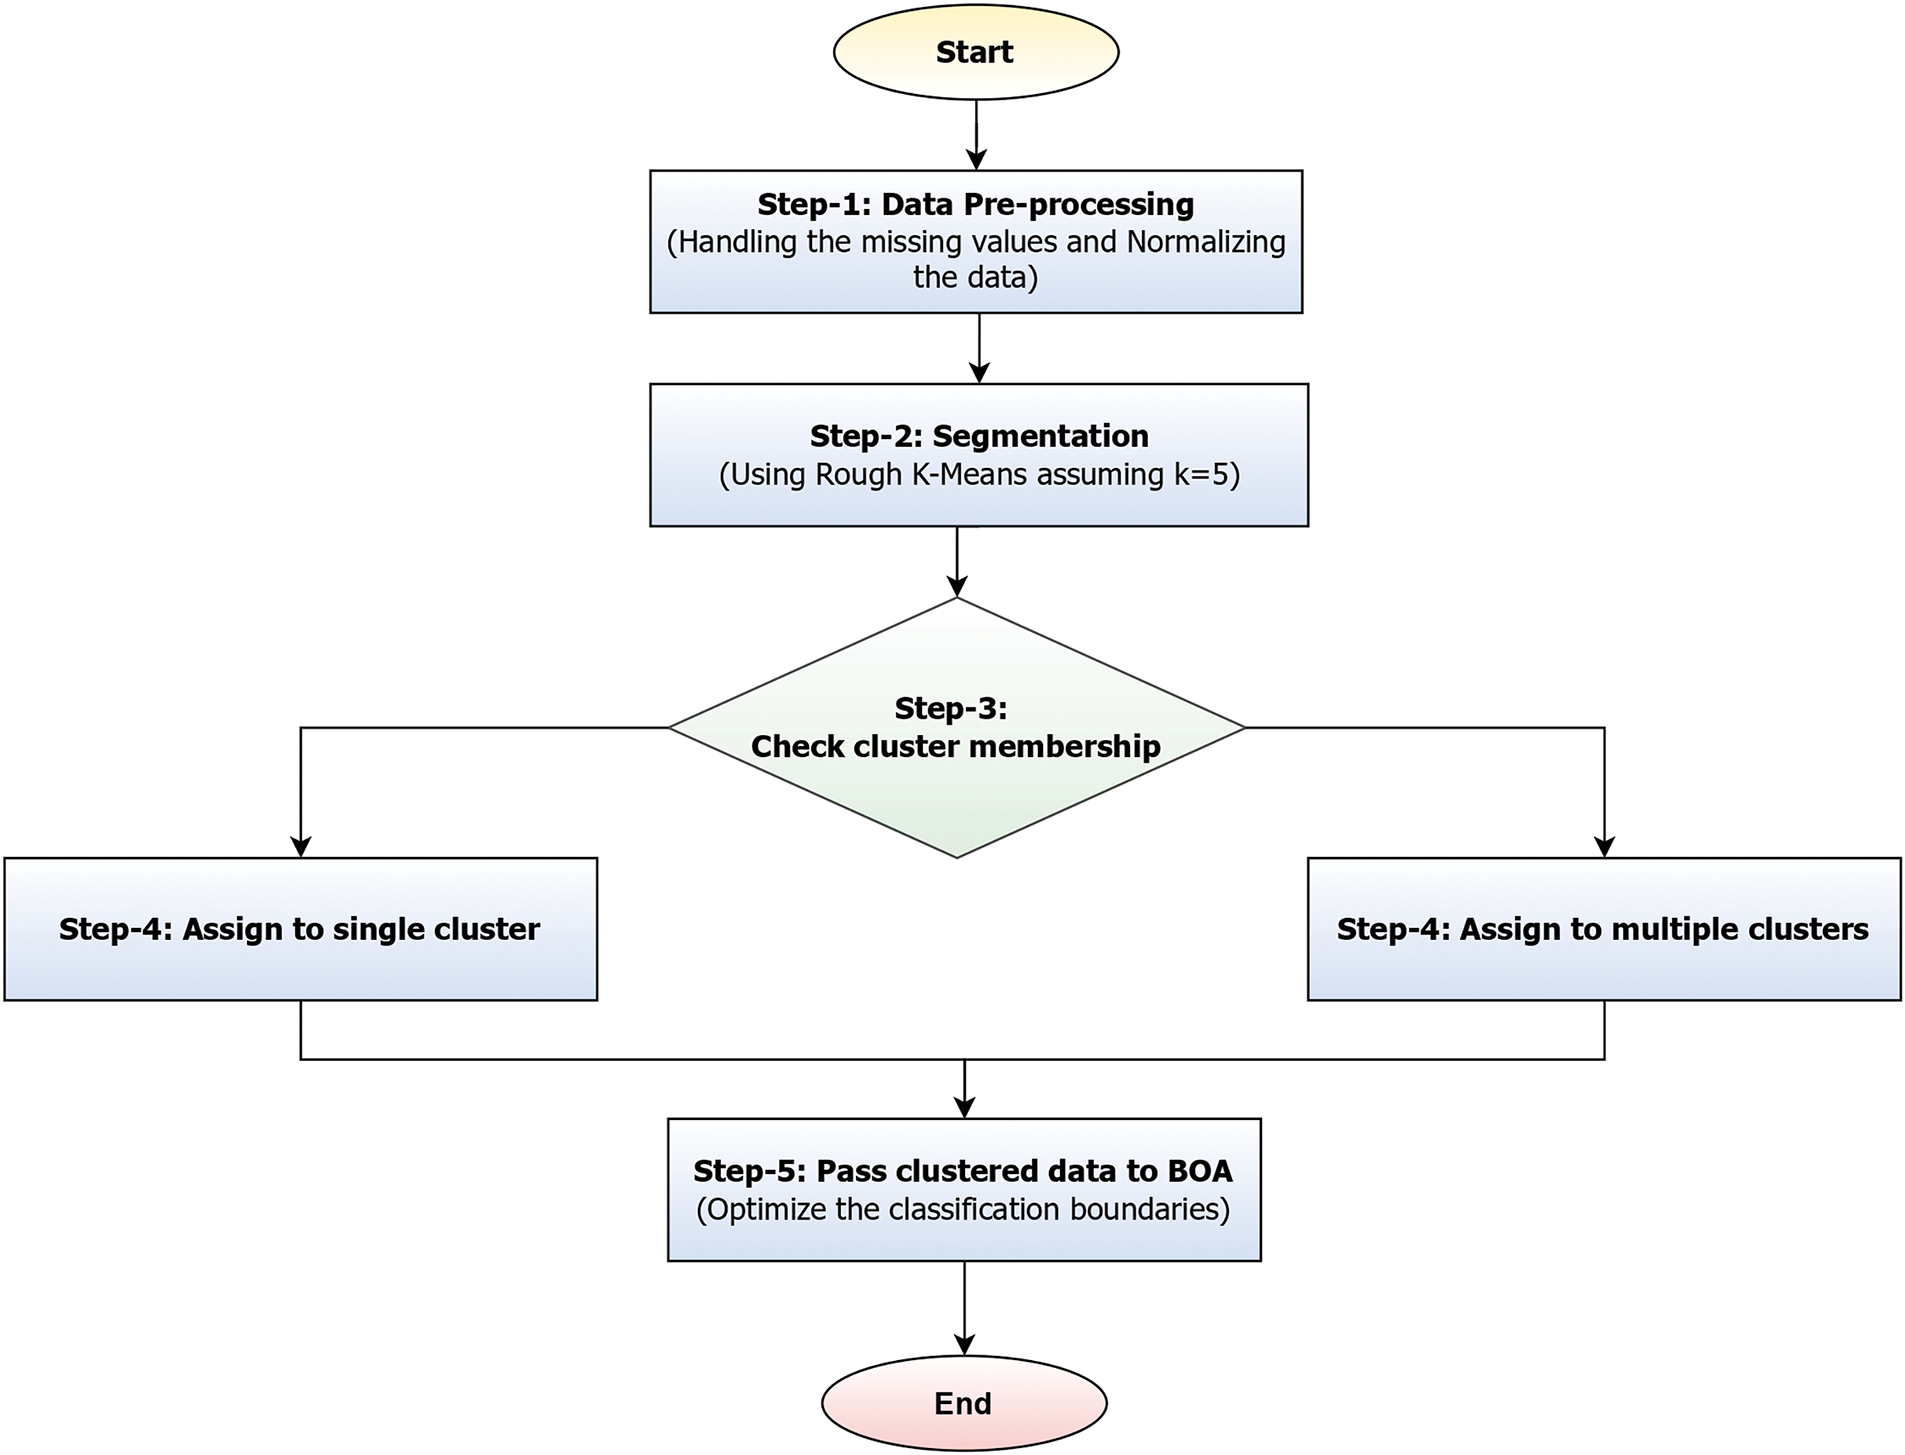
Figure 4: Illustrating the segmentation and classification process of the proposed models
Fig. 4 illustrates a workflow that represents a hybrid approach combining RKM clustering with Butterfly Optimization to enhance classification accuracy. The process initiates with data preprocessing, which involves handling missing values and applying normalization to ensure consistency across the dataset. Once the data is cleaned, it undergoes segmentation using RKM with a predefined number of clusters (e.g., K = 5). After clustering, the membership of each data point is evaluated. If a data point belongs to a single cluster, it is placed in the lower boundary and assigned to that cluster. Conversely, if its membership is ambiguous, it is placed in the upper boundary and associated with multiple clusters. This dual-boundary strategy enables the handling of uncertainty in data classification. Finally, the clustered data, which accounts for both definite and overlapping memberships, is fed into the BOA, which fine-tunes the classification boundaries to improve model performance.
Due to these properties, RKM clustering is highly suitable for information granulation. It helps to clarify the semantics of the generated granule further. On the other hand, it offers a convenient way to determine if an object supports or shows any inhibitory effect on the produced granule. Lingras’ initial RKM approach, the center
where the parameters
In RKM, each data point is assigned to either the lower boundary, which is a definitive cluster membership, or the upper boundary, which is considered to be an uncertain membership. The cluster center calculation depends on these boundaries concerning
A cluster
If a cluster has only an upper boundary (uncertain members), the centroid is the average of all objects in the upper boundary. Since the lower boundary is empty, we rely only on upper boundary points to determine the centroid. The weighted centroid calculation is performed when both boundaries exist, using Eq. (6).
Assign every object to the lower boundary
The difference between d (V,
V ∈
3.3 Butterfly Optimization Algorithm for Classification
The BOA is a meta-heuristic method inspired by the behavior of butterflies. As a butterfly navigates the search space, it emits a fragrance that changes depending on its position. Butterflies can detect the scent and are drawn to the one emitting the most pungent fragrance. This emitted scent is perceived by other butterflies, creating a network of collective fragrances. When butterflies are within the fragrance network, they will fly towards the one emitting the highest concentration of fragrance. This stage is known as the global search phase. When butterflies cannot detect the fragrance network, they fly randomly. This stage is referred to as local search. In other words, all butterflies within the search space move to new positions, and their fitness values are evaluated using functions during every iteration. Therefore, the BOA primarily consists of two phases: both the global and local search phases. Butterflies search for food with mating partners during both phases [37].
The fragrance or fitness function is described as a function of the stimulus intensity and can be calculated using Eq. (9).
From the above equation, the notation
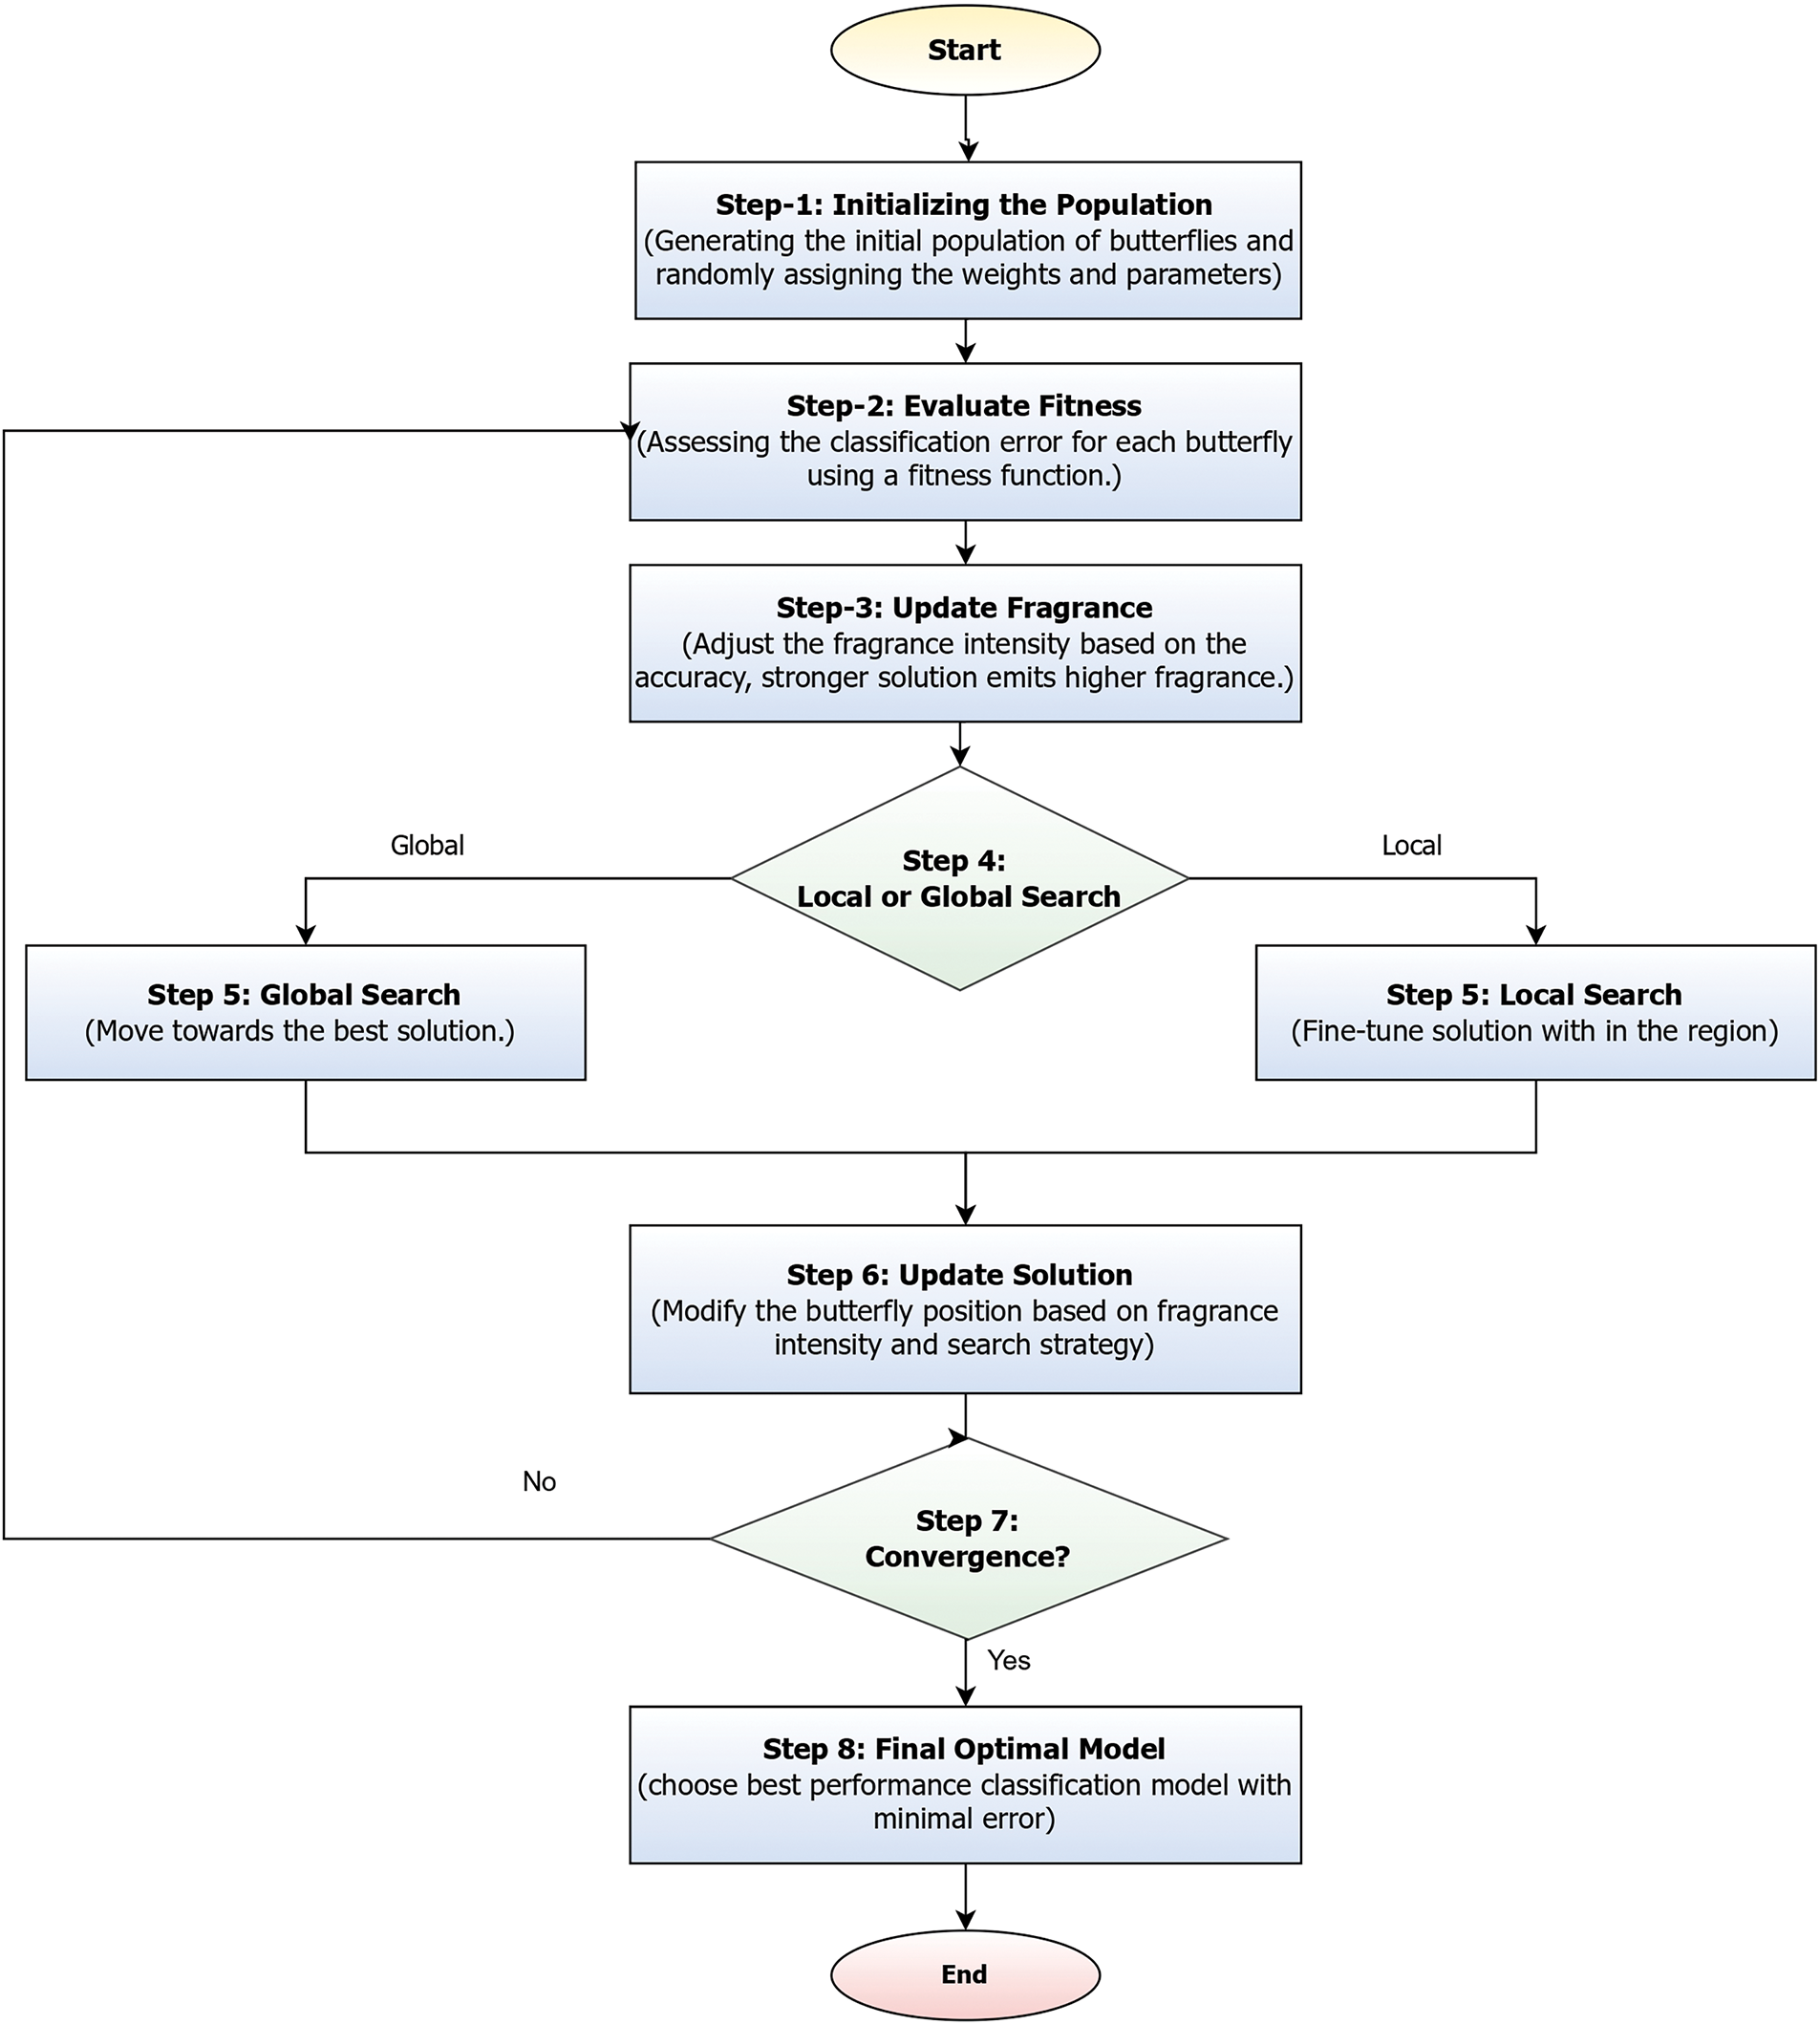
Figure 5: Illustrates the BOA for classification optimization
Fig. 5 illustrates the BOA for classification, which begins by generating an initial population of butterflies, where each butterfly represents a candidate solution with randomly assigned feature weights and parameters. The fitness of each butterfly is then evaluated using a classification error-based fitness function. Based on this fitness, the fragrance intensity of each butterfly is updated; stronger solutions emit higher fragrance levels. Guided by a probability threshold, each butterfly then performs either a global search, moving toward the best-known solution, or a local search to fine-tune within its current region. The positions of butterflies are updated accordingly, influenced by the intensity of their fragrance and the selected search strategy. This process repeats iteratively until convergence is achieved, after which the butterfly representing the most accurate classification result is chosen as the final optimized model [39].
The BOA enhances classification accuracy by optimizing feature weights and classifier parameters through an adaptive search process. Each candidate solution, represented as a butterfly, is evaluated using a fitness function that minimizes classification error. The algorithm iteratively refines solutions based on fragrance intensity, where stronger solutions attract others, guiding the search toward optimal classification performance. BOA dynamically balances global exploration and local exploitation using a switching probability, ensuring convergence to the best model configuration. This process improves decision boundaries, reduces misclassification, and enhances overall predictive accuracy. The initial equation facilitates global search and is denoted by Eq. (10), and the local search is determined using the formula shown in Eq. (11).
where
The BOA algorithm comprises two search phases: local and global search. The switch probability P regulates the transition between these phases. If the randomly generated value r is less than P, the BOA performs a global search (exploration); otherwise, it conducts a local search (exploitation).
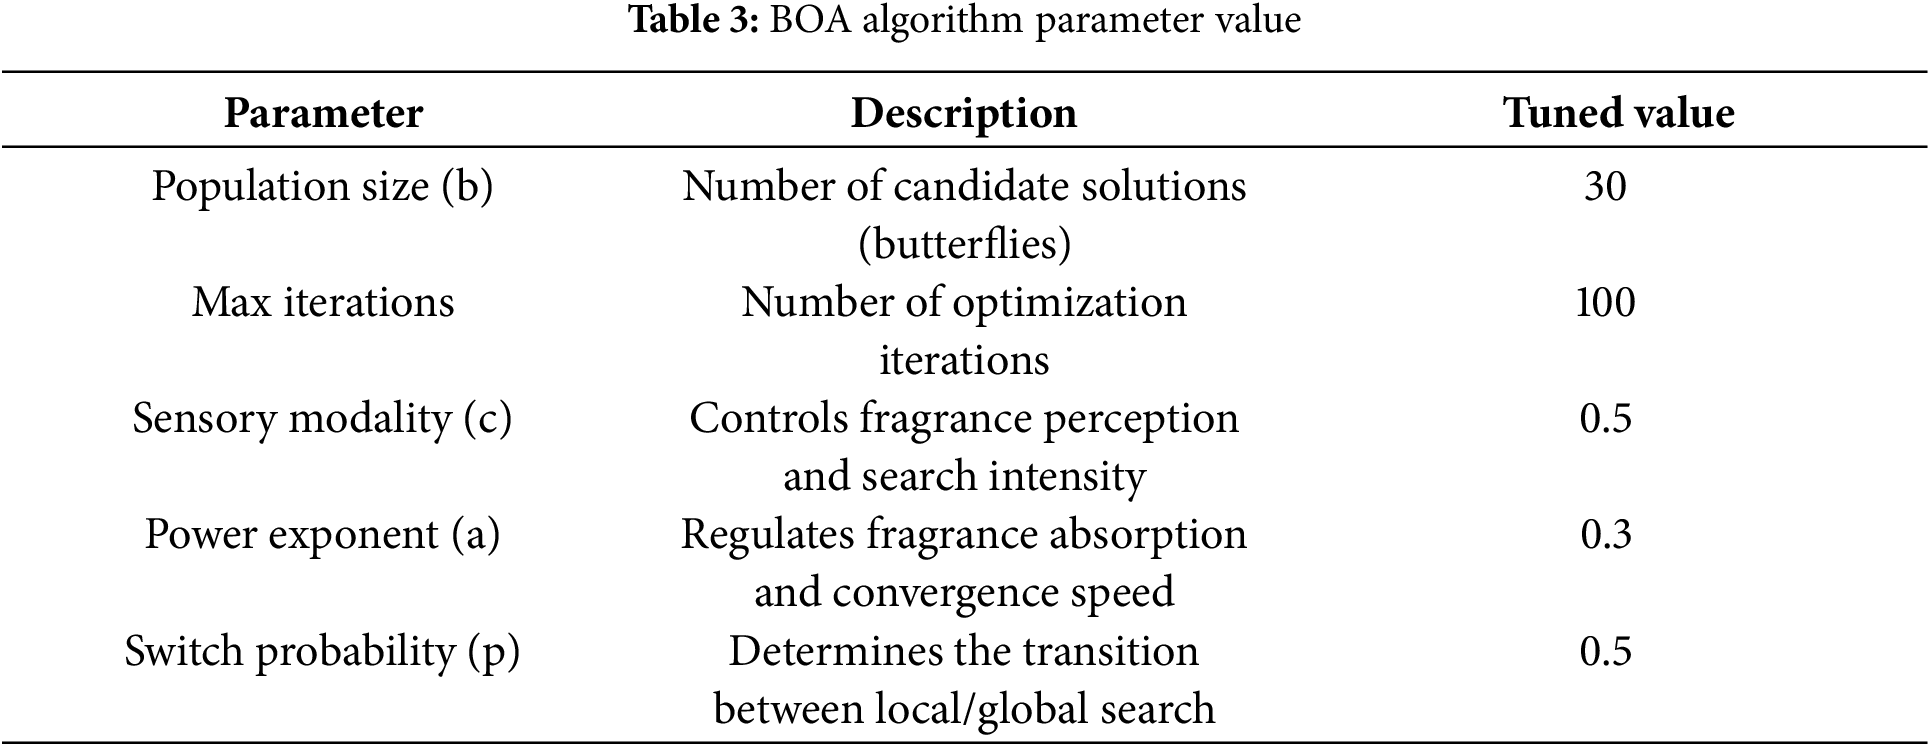
The table provides that BOA hyperparameter tuning relies on multiple parameters, including sensory Modality (c), power exponent (a), and switch probability (p), which influence search behavior:
• Sensory Modality (c): Controls the fragrance perception and search intensity. We tested values in the range [0.1, 1], and c = 0.5 provided a balance between exploration and exploitation.
• Power Exponent (a): Regulates fragrance absorption. Values in [0.1, 1] were tested, with a = 0.3 yielding the best convergence behavior.
• Switch Probability (p): Determines the transition between local and global search. We experimented with values between 0.2 and 0.8, selecting p = 0.5 as the most effective trade-off.
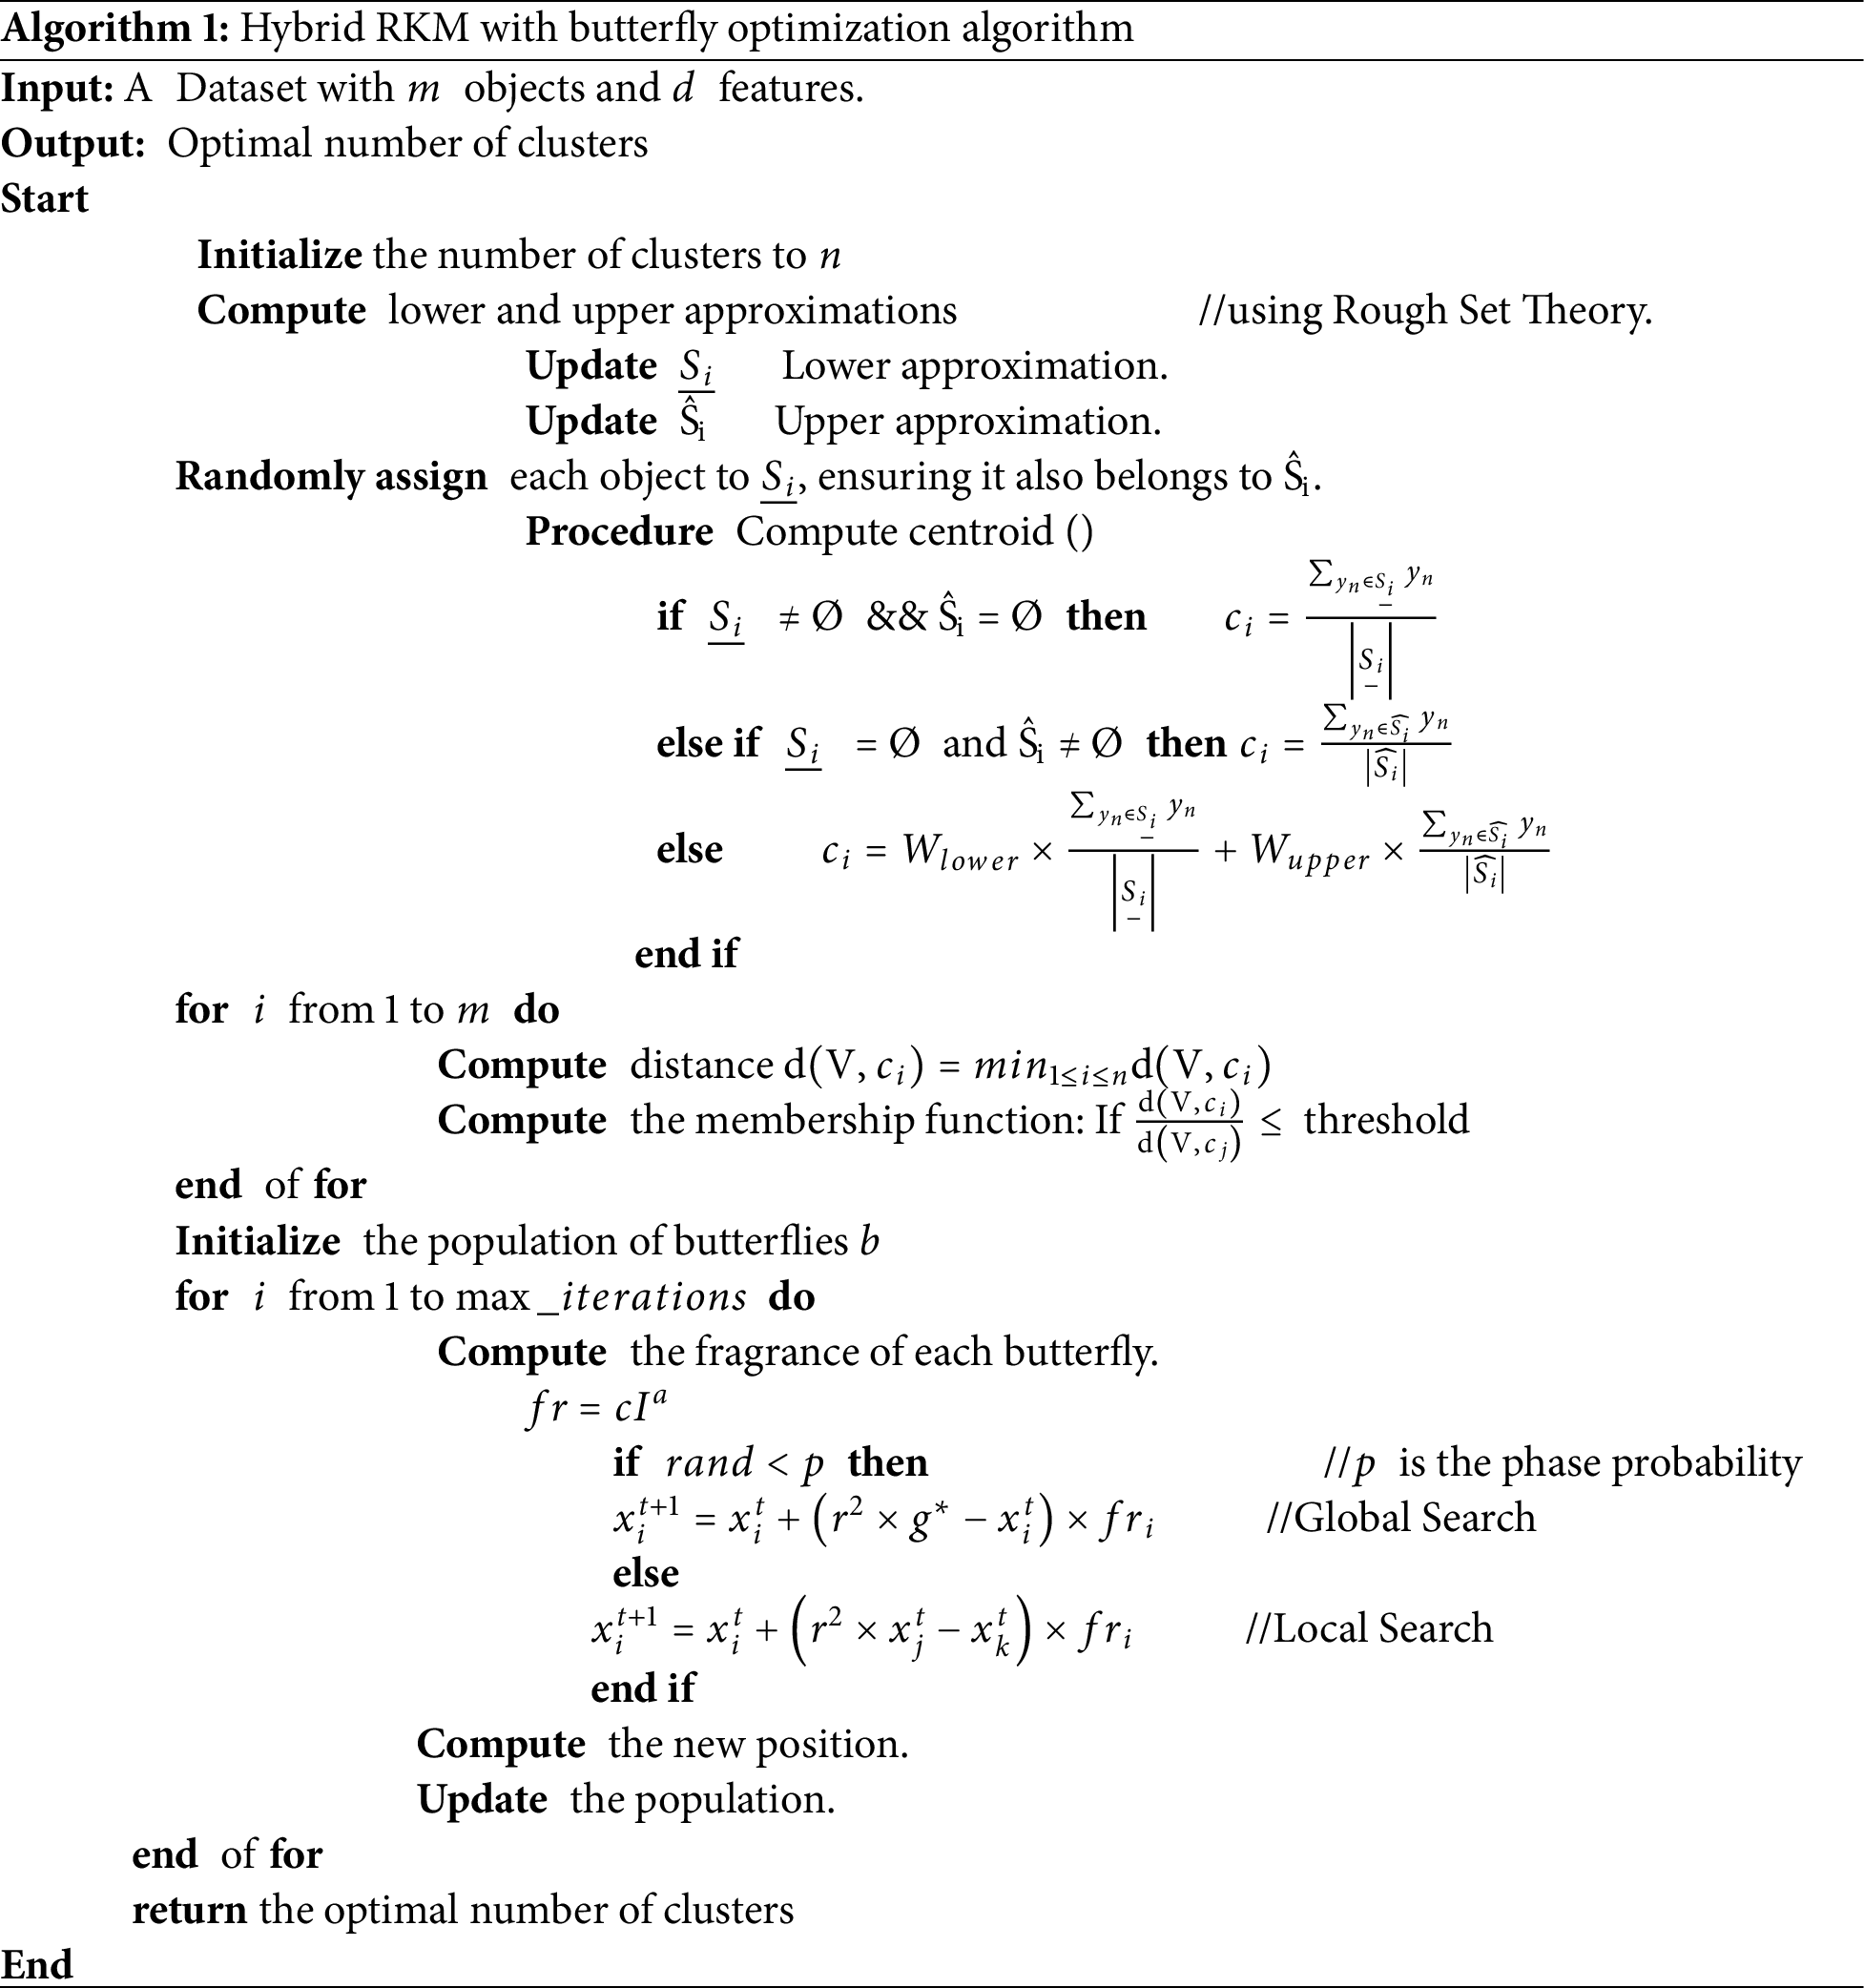
The paper introduces BOA, but it lacks clarity on key aspects such as its fitness function for classification accuracy, how the global and local search mechanisms influence boundary refinement, or how parameter tuning is performed to suit the dataset characteristics. The parameters of Eqs. (9)–(11) are highlighted in Table 3. The corresponding algorithm of the proposed Hybrid RKM with butterfly optimization is presented in Algorithm 1.
3.4 Details of Implementation Environment
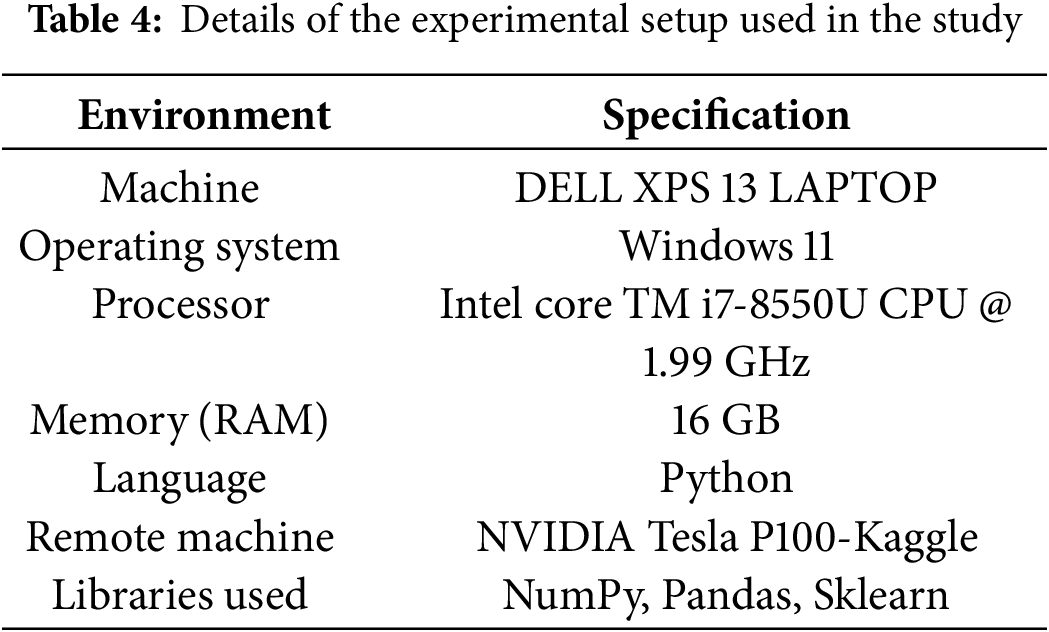
The proposed model is evaluated in the remote environment accessed from the local machine. The entire experimental procedure utilized the same setup for implementing and evaluating all the models considered in the current study. The details of the implementation environment are presented in Table 4.
The proposed model consists of two parts: a clustering phase and an optimal classification stage. We framed five sets of experiments for evaluation. In the first phase, we will evaluate the clustering results using the clustering algorithm. In the Second phase, we compare the outcomes of the proposed hybrid model (RoughKMeans+BOA) with those of base classification algorithms. In the third phase, the outcomes of the proposed hybrid model (RoughKMeans+BOA) will be compared to those of other optimization algorithms. In the fourth phase, we compare the outcomes of the proposed hybrid model (RoughKMeans+BOA) with those of the other four variants of the proposed hybrid models. Finally, we assess the efficiency of the proposed model in comparison to existing approaches.
A True Positive (TP) occurs when the model correctly predicts that a patient has the disease. A True Negative (TN) means the model correctly identifies a patient as disease-free. A False Positive (FP) happens when the model incorrectly predicts the presence of the disease in a healthy patient. Conversely, a False Negative (FN) occurs when the model fails to detect the disease in an affected patient. In medical diagnostics, especially for conditions like heart disease, False Negatives are particularly dangerous because they may result in a patient not receiving necessary treatment despite having the disease. The silhouette coefficient (SC), among other things, is a matrix utilized to evaluate how effectively our clustering method clusters data. When it has a high SC score, it means that the clusters are well-grouped. Use the following metrics to assess the effectiveness of the classification process: recall, accuracy, precision, error rate, and F1 score, both micro-averaging and macro-averaging. Eq. (12) shows the accuracy calculation for the multi-class heart illness classification method.
The performance of the RKM clustering was assessed using the Silhouette Coefficient (SC), a widely used metric for evaluating clustering quality. The SC measures how similar an object is to its assigned cluster compared to other clusters, with values ranging from −1 to 1:
• SC ≈ 1 → Well-defined clusters (good separation).
• SC ≈ 0 → Overlapping clusters (ambiguous separation).
• SC < 0 → Incorrect clustering (misclassified points).
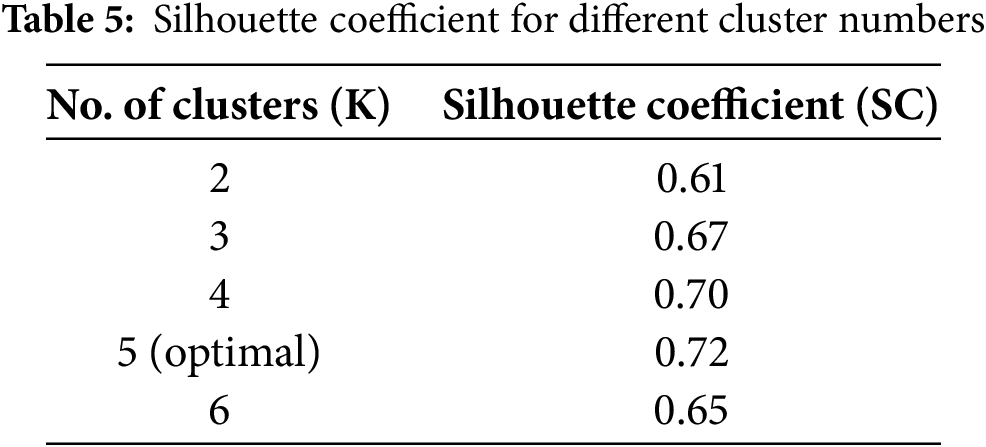
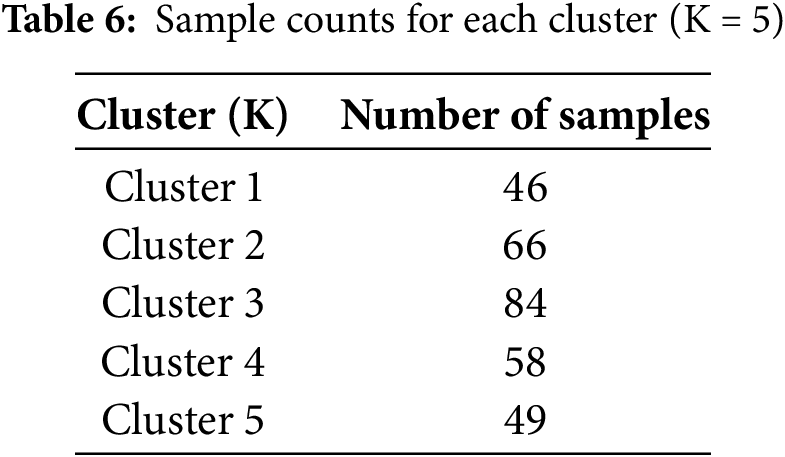
To determine the optimal number of clusters (K), we tested values from K = 2 to K = 6. The best SC score was obtained at K = 5, with SC = 0.72, indicating well-separated clusters. The obtained silhouette coefficient across different clusters is shown in Table 5.
The mathematical formulations for the various metrics used in the current study are listed below.
Precision: Measures the proportion of correctly predicted positive cases out of all predicted positives. The corresponding formula for precision is shown in Eq. (13).
Recall (Sensitivity): Measures the proportion of correctly predicted positive cases out of actual positives. The corresponding formula for recall is shown in Eq. (14).
F1 Score: Harmonic mean of precision and recall, balancing false positives and false negatives. The corresponding formula for the F1 score is shown in Eq. (15).
Setup 1: RKM clustering yields
The RKM clustering approach partitions the complete dataset into C distinct clusters. Initially, we utilized C values of 2, gradually increasing them to compute the SC value. The SC value increases as the number of clusters increases because the two elements are directly related. On the other hand, for specific K values, performance will improve or stay the same compared to others. The ‘Elbow’ method is a strategy that utilizes this K number—the optimal K value—to improve performance. According to the experiment’s results, the optimal K value for this experiment is 5. The clustering quality was assessed using the Silhouette Coefficient (SC), which measures the cohesion within clusters and separation between clusters. SC values were computed for different numbers of clusters K, and the results were plotted in Fig. 6. The peak SC value of 0.72 at K = 5 confirmed the optimal cluster configuration, ensuring well-separated and meaningful groupings for subsequent classification. Table 6 below shows the sample counts for each cluster. Fig. 6 displays the SC value on the Y-axis and the No. of clusters, ranging from 2 to 6, on the X-axis. The graphic demonstrates that the optimal cluster size, K = 5, yields the maximum SC value.
Figure 6: The outcome of the clustering process according to SC
The clustering efficiency of the RKM algorithm is displayed by selecting attributes from the dataset. These attributes represent crucial features that contribute to cluster formation, including patient-specific health metrics such as age, sex, cholesterol levels, high blood pressure, chest pain, and maximum heart rate. Fig. 7 provides insight into the separation between clusters and the presence of boundary regions, demonstrating the algorithm’s ability to manage uncertainty in data assignment. The distribution of data points across clusters further supports the model’s effectiveness in segmenting information, ultimately enhancing classification accuracy.
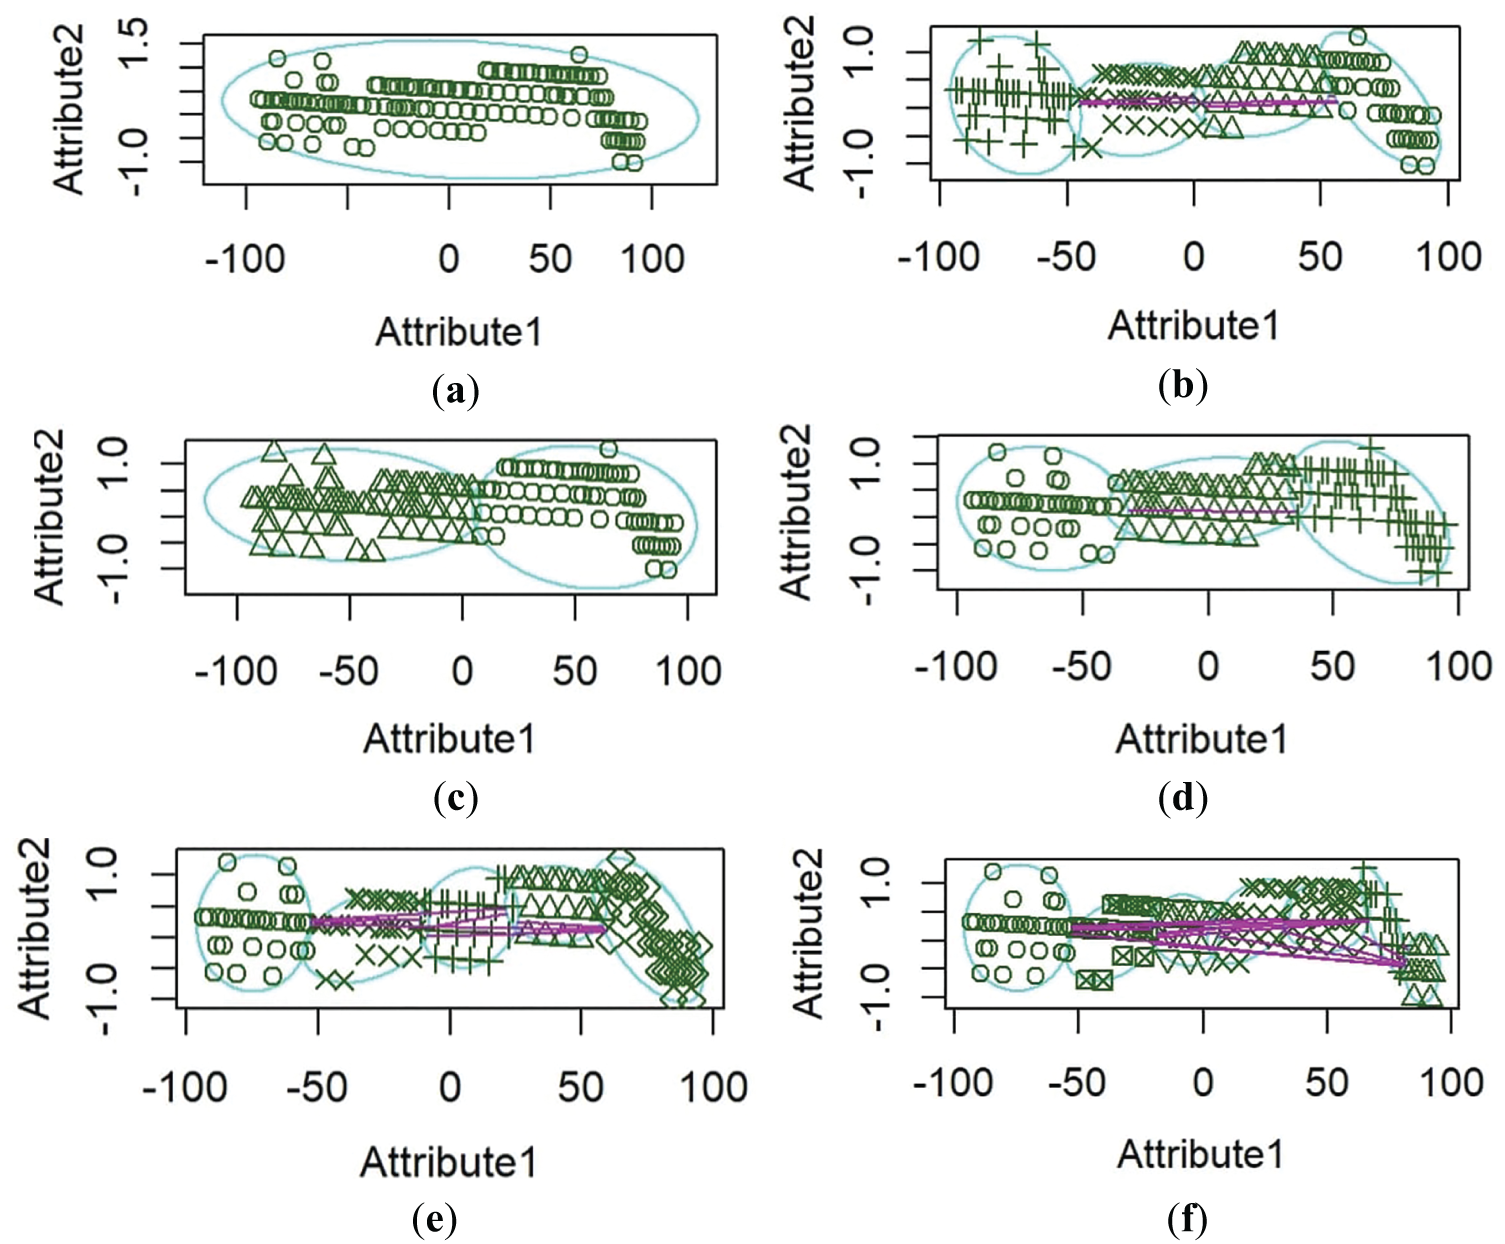
Figure 7: RKM Clustering performance. (a) attribute one age, attribute two sex, (b) attribute one age, attribute two cholesterol levels, (c) attribute one age, attribute two high blood pressure, (d) attribute one age, attribute two chest pain, (e) attribute one age, attribute two maximum heart rate, (f) attribute one age, attribute two old peaks
Fig. 7 represents RKM clustering performance. Attribute 1 is plotted on the x-axis, with a range from around −100 to 100, and Attribute 2 is plotted on the y-axis, with values between −1.0 and 1.5. The horizontal spread of data points might indicate that Attribute 1 has a broader range and varies independently, while Attribute 2 is relatively stable. This plot reveals two distinct groups with different distributions along Attribute 1 but minimal change along Attribute 2. The ellipses emphasize the separation between the groups on the x-axis, while Attribute 2 remains stable. The plot illustrates that Attribute 1 varies independently across groups, whereas Attribute 2 shows limited variation. The ellipses reinforce the visual separation between the groups, suggesting that they have unique characteristics along the x-axis but overlap along the y-axis.
Setup 2: Comparison of the proposed model, RoughK-BOA, with existing base classification algorithms
The clustering process sends the output to the Butterfly Algorithm (BA) classification algorithm. Each cluster is seen as an optimal classification problem. A cluster includes two categories of data: disease samples and non-disease samples. The k-fold method and BA preferences separate these into training and test data. The BA procedure begins with an objective function, such as collecting and comparing training samples with test data. The objective function, in this case, is the Euclidean distance between each training data point within the cluster and the test data. Since this is a minimization problem, our goal is to reduce the gap between the training and testing data. The claim is that after a set number of iterations, the output of the test data is similar to the best training data globally. We compared our model outcomes with those of standard classifiers, including DT, RF, NB, SVM, and KNN, as presented in Table 7 below, to evaluate the error rate, average accuracy, recall, F score, and precision. The pre-processed data is split into training and testing sets using the holdout method. The performance is evaluated based on precision, average accuracy, recall, error rate, and micro and macro-f-scores. In this method, clustering stages are omitted. Experimental results indicate that the proposed clustered BA exceeds the performance of baseline classification methods. Fig. 8 illustrates the confusion matrices comparing the proposed RoughK-BOA model with traditional classifiers.
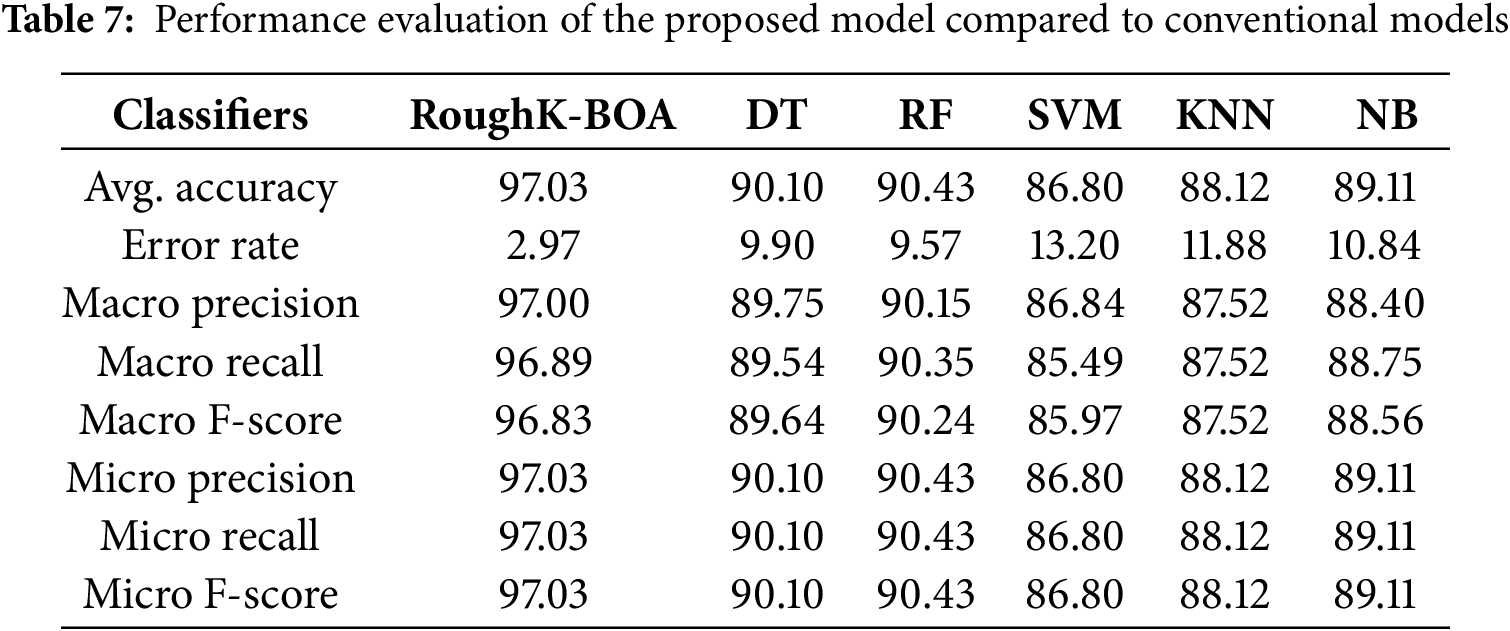
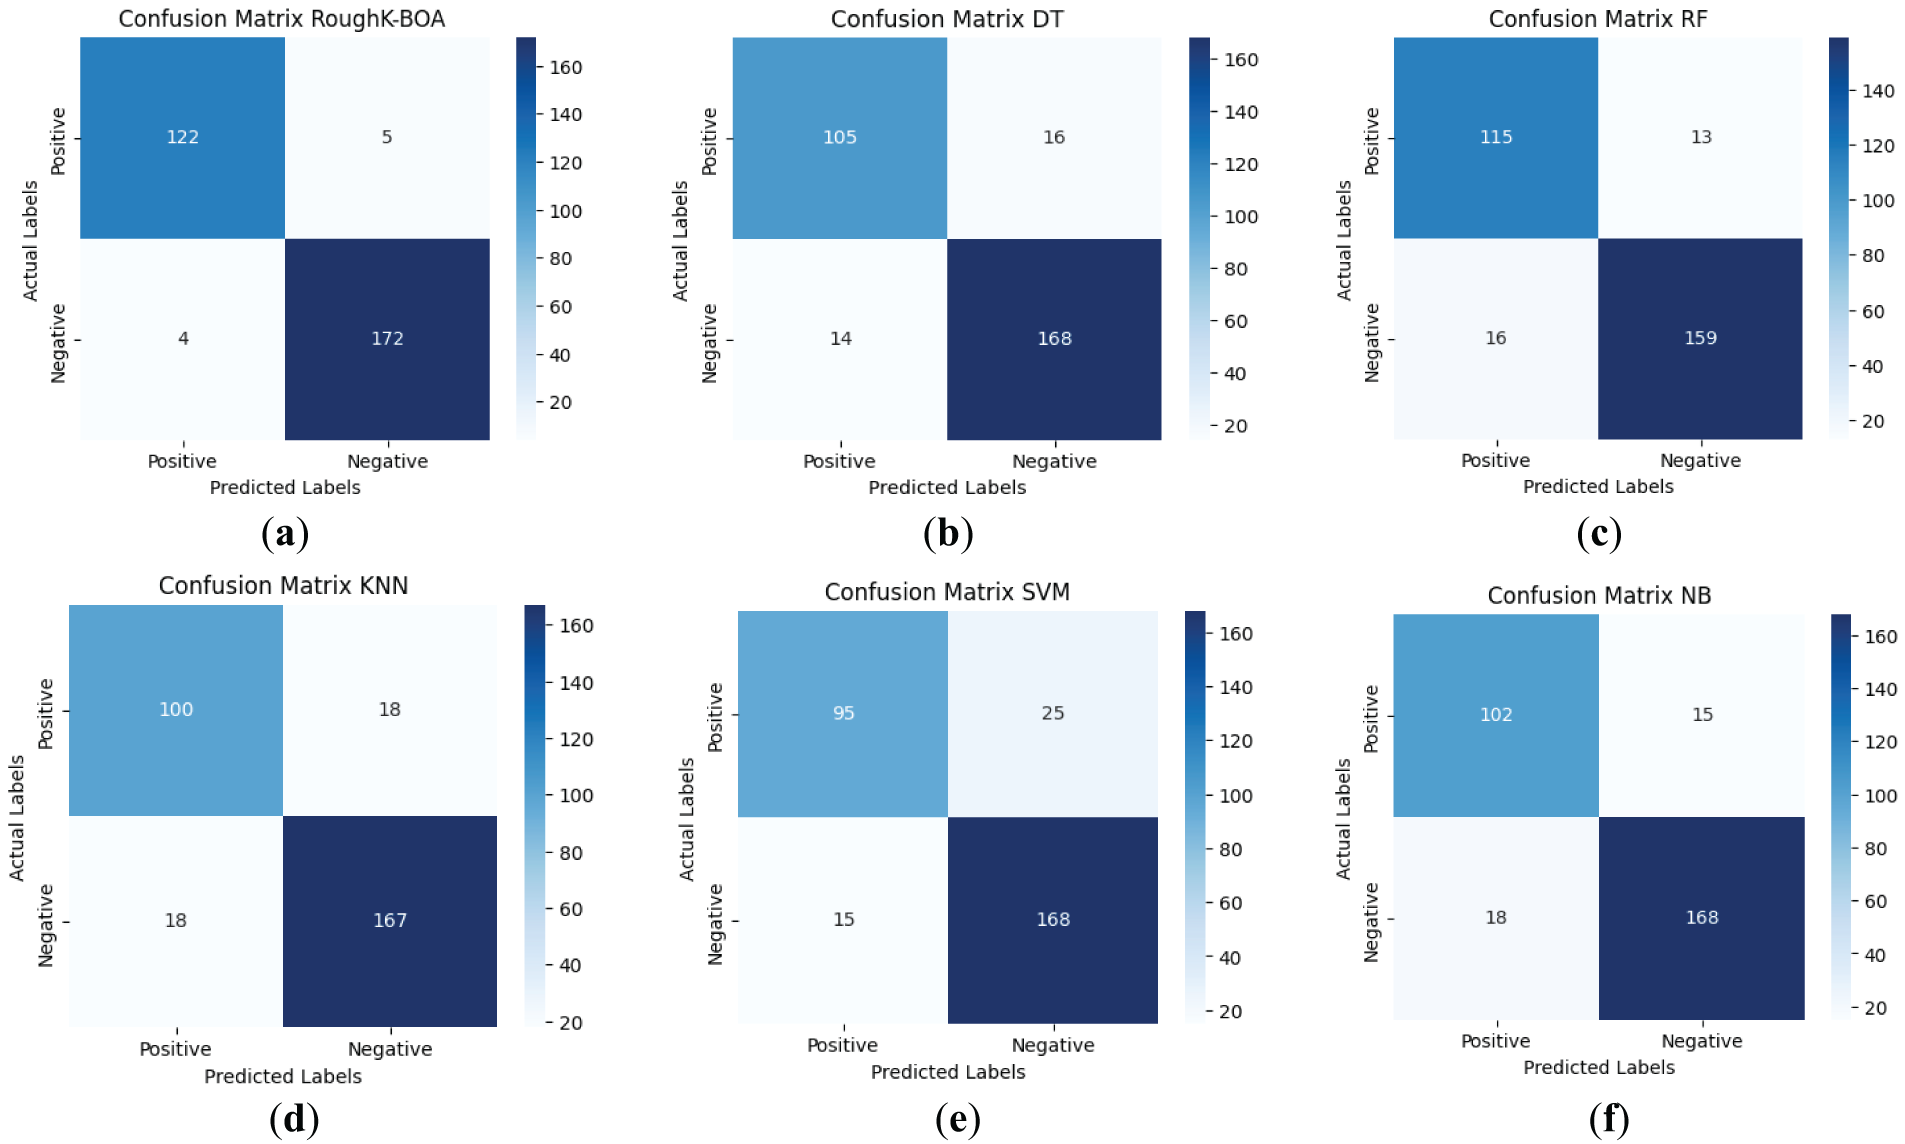
Figure 8: Confusion Matrix for cluster butterfly classification with based classifiers (a) Roughk-BOA, (b) DT, (c) RF, (d) KNN, (e) SVM, and (f) NB
The performance of various classifiers, including RoughK-BOA, DT, RF, SVM, KNN, and NB, can be analyzed using their respective confusion matrices. These matrices illustrate the effectiveness of each model in classifying instances into positive and negative categories. SVM and KNN have exhibited slightly higher misclassification rates, particularly in false positives. RF and DT have performed moderately well, maintaining a good balance between sensitivity and specificity. Naive Bayes has exhibited reasonable performance but with a slightly higher number of misclassifications compared to RoughK-BOA. Finally, RoughK-BOA outperformed all classifiers, while RF and DT performed well, making them more reliable. SVM, KNN, and NB had higher false predictions, indicating lower classification efficiency.
Setup 3: Comparison of the proposed model, RoughK-BOA, with the existing optimization algorithm
This section employs various optimization techniques, including HHO, MA, and GWO, among others, to assess the performance of the cluster-based BOA [34–36]. The k-fold technique divides the pre-processed data into training and testing. Evaluate performance using average accuracy, precision, F-score, error rate, and recall, incorporating both micro- and macro-averaging. This approach notably omits the clustering stages. Results in Table 8 demonstrate that the clustered BOA significantly outperforms other optimization techniques. Fig. 9 presents the confusion matrices comparing the RoughK-BOA model against various optimization-based classifiers, including Harris Hawks Optimization (HHO), Grey Wolf Optimizer (GWO), Mayfly Algorithm (MA), Whale Optimization Algorithm (WOA), and Teaching-Learning-Based Optimization (TLBO), demonstrating the classification effectiveness of the proposed approach.
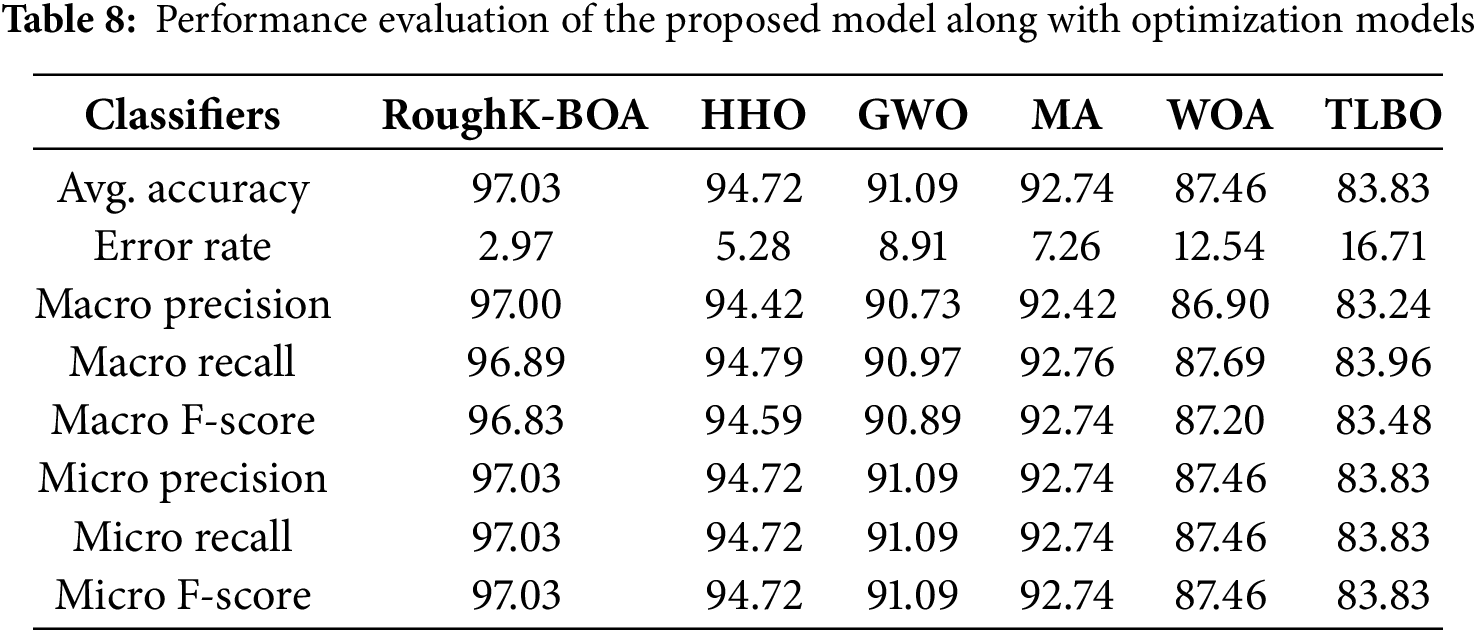
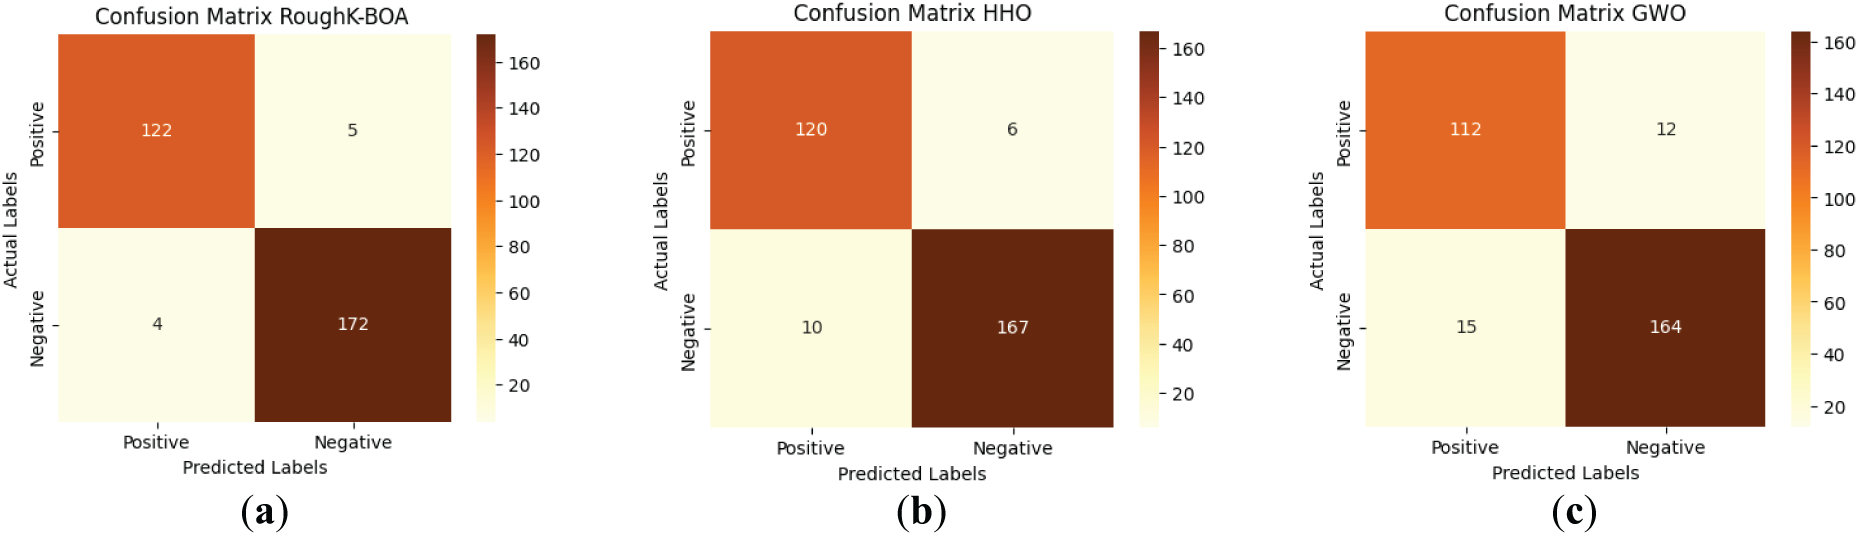
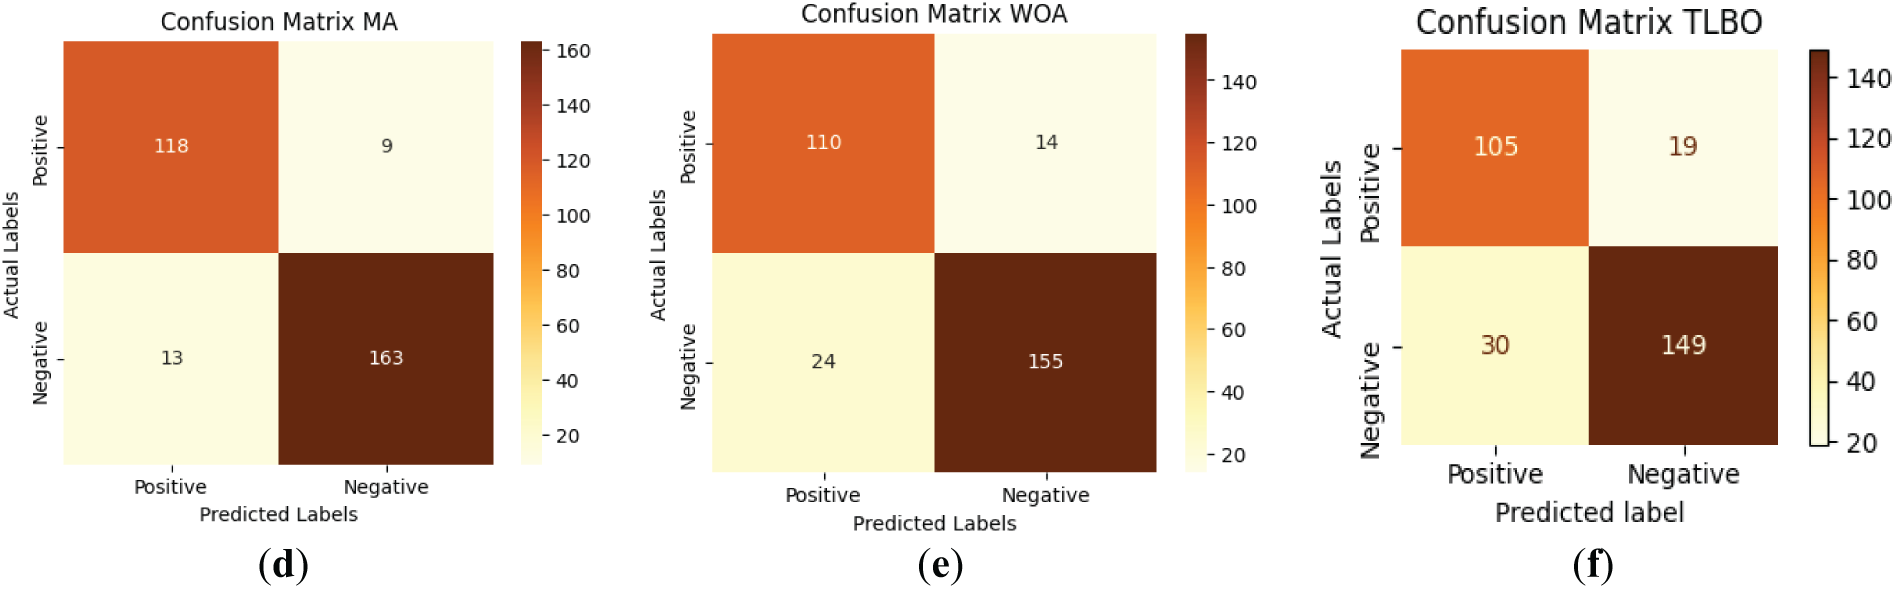
Figure 9: Confusion matrix for RoughK-BOA classification with optimization classifier, where (a) RoughK-BOA, (b) HHO, (c) GWO, (d) MA, (e) WOA, and (f) TLBO
The performance evaluation of optimization-based classifiers, including RoughK-BOA, HHO, MA, GWO, and WOA, highlights their classification efficiency based on confusion matrices. RoughK-BOA achieved the highest accuracy of 97.03%, followed by HHO of 94.72%, and MA of 92.74%, all of which exhibited low misclassification rates. GWO (91.09%) also performed well, while WOA of 87.46% had a slightly higher false positive rate and TLBO of 83.83%. The confusion matrices indicate that RoughK-BOA and HHO provided the most reliable predictions with minimal errors, making them the most effective classifiers among the optimization-based models.
Setup 4: Comparison of the proposed model with hybrid approaches, with similar hybrid models
In this section, the exploratory results are explained using the hybrid model. Fig. 10 illustrates the classifier performance method for the expected hybrid method and other hybrid classifiers. The results show that the proposed hybrid model achieves the best performance compared to the other five proposed hybrid methods: RoughK-BOA, RoughK-HHO, RoughK-MA, RoughK-GWO, and RoughK-WOA. The best performance gives the Roughk-means-BA. The performance evaluation of different classifiers was conducted using key metrics, including accuracy, error rate, precision, recall, and F1 score. Among the models, RoughK-BOA achieved the highest accuracy of 97.03%, and the lowest error rate of 2.97%, indicating its effectiveness in classification. Additionally, it demonstrated superior precision of 97%, making it a strong candidate for optimal performance. Meanwhile, RoughK-WOA and RoughK-MA exhibited the highest macro recall rates, 89.14% and 94.06%, respectively, indicating their strong ability to identify positive instances.
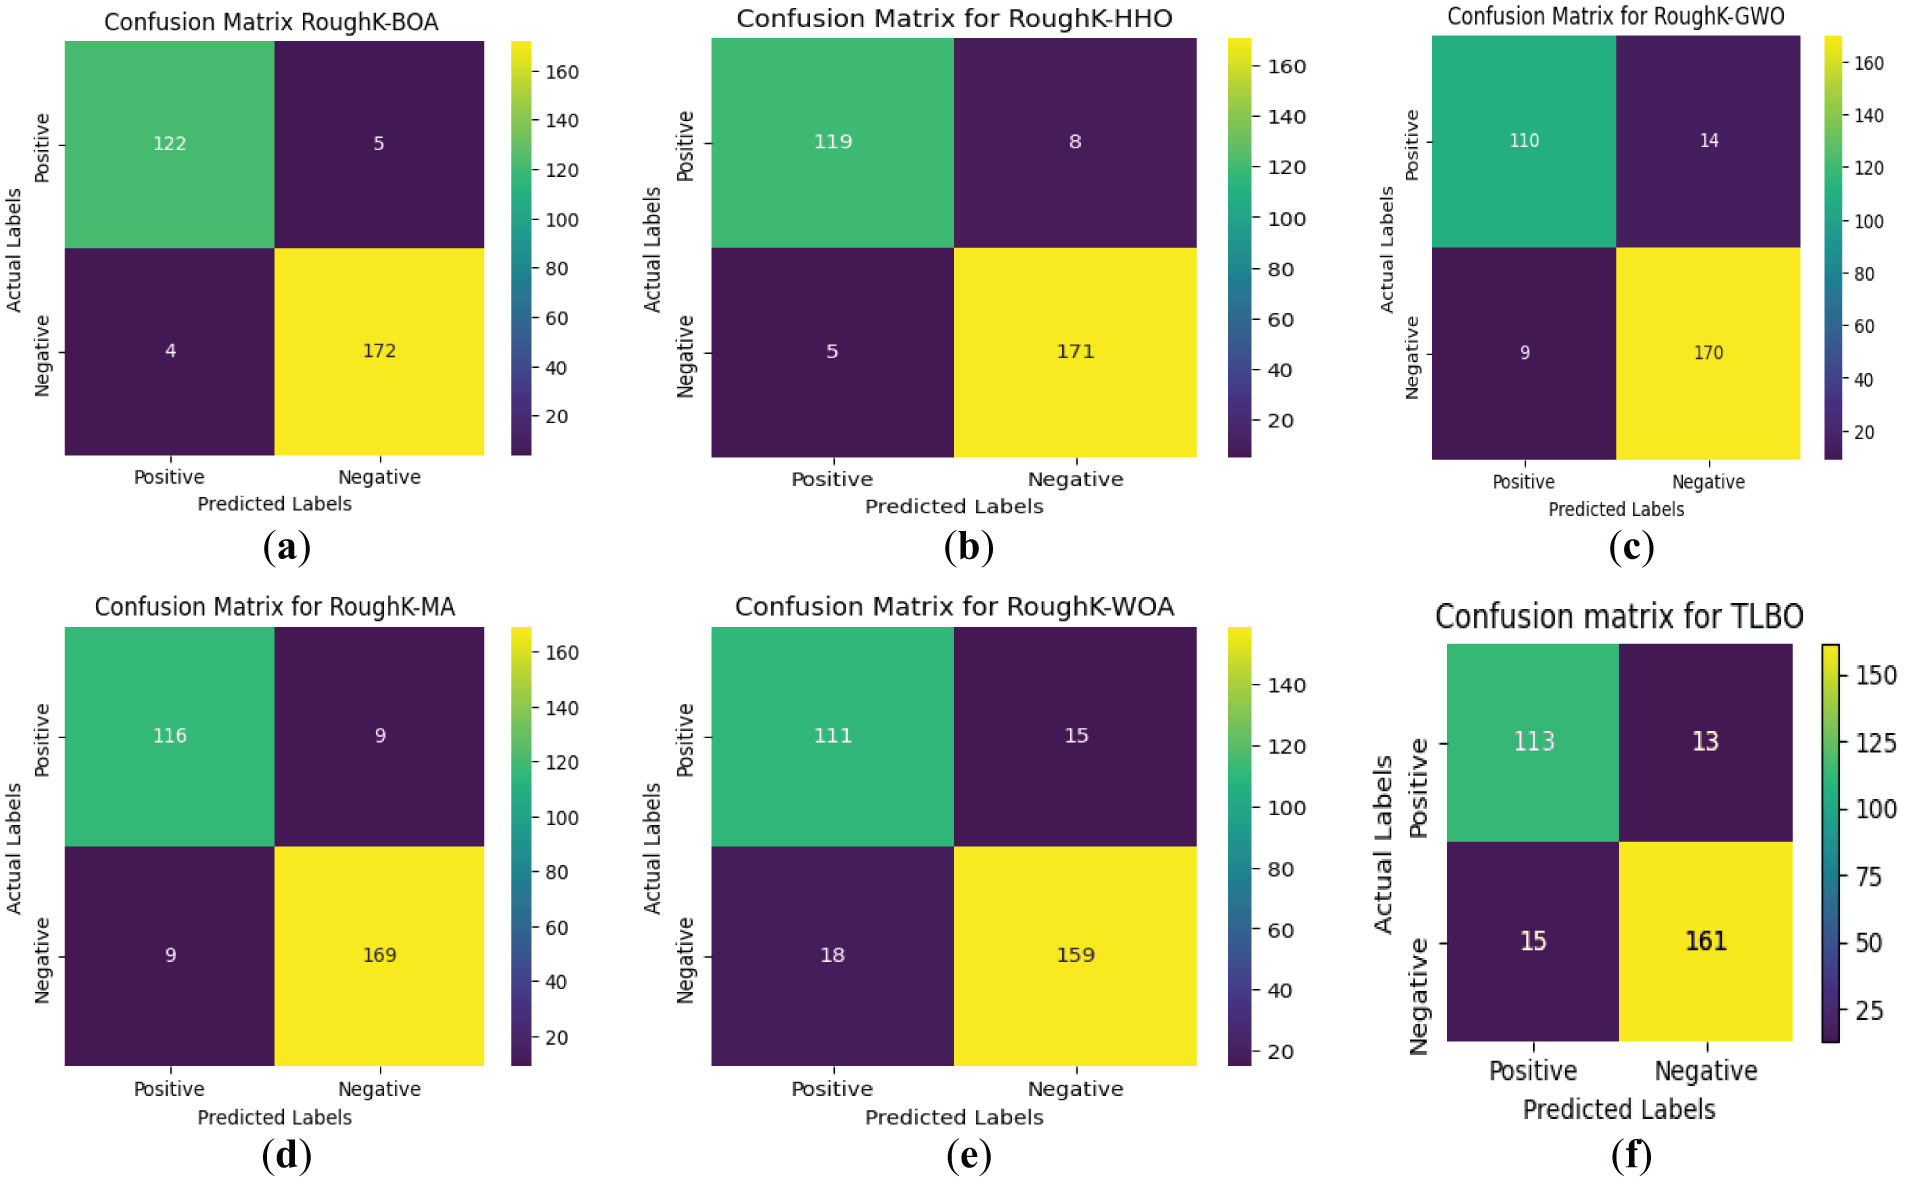
Figure 10: Confusion matrix for RoughK-BOA classification with Hybrid classifiers, where (a) RoughK-BOA, (b) RoughK-HHO, (c) RoughK-GWO, (d) RoughK-MA, and (e) RoughK-WOA, (f) RoughK-TLBO
The evaluation of RoughK-BOA, RoughK-HHO, RoughK-GWO, RoughK-MA, RoughK-TLBO, and RoughK-WOA classifiers highlights their classification efficiency based on confusion matrices and key performance metrics. The corresponding observed values are tabulated in Table 9. RoughK-BOA demonstrated the highest accuracy of 97.03%, effectively minimizing false predictions. The assessment of precision, recall, and F1 score confirms that RoughK-BOA and RoughK-HHO deliver superior classification accuracy, making them more effective for high precision.
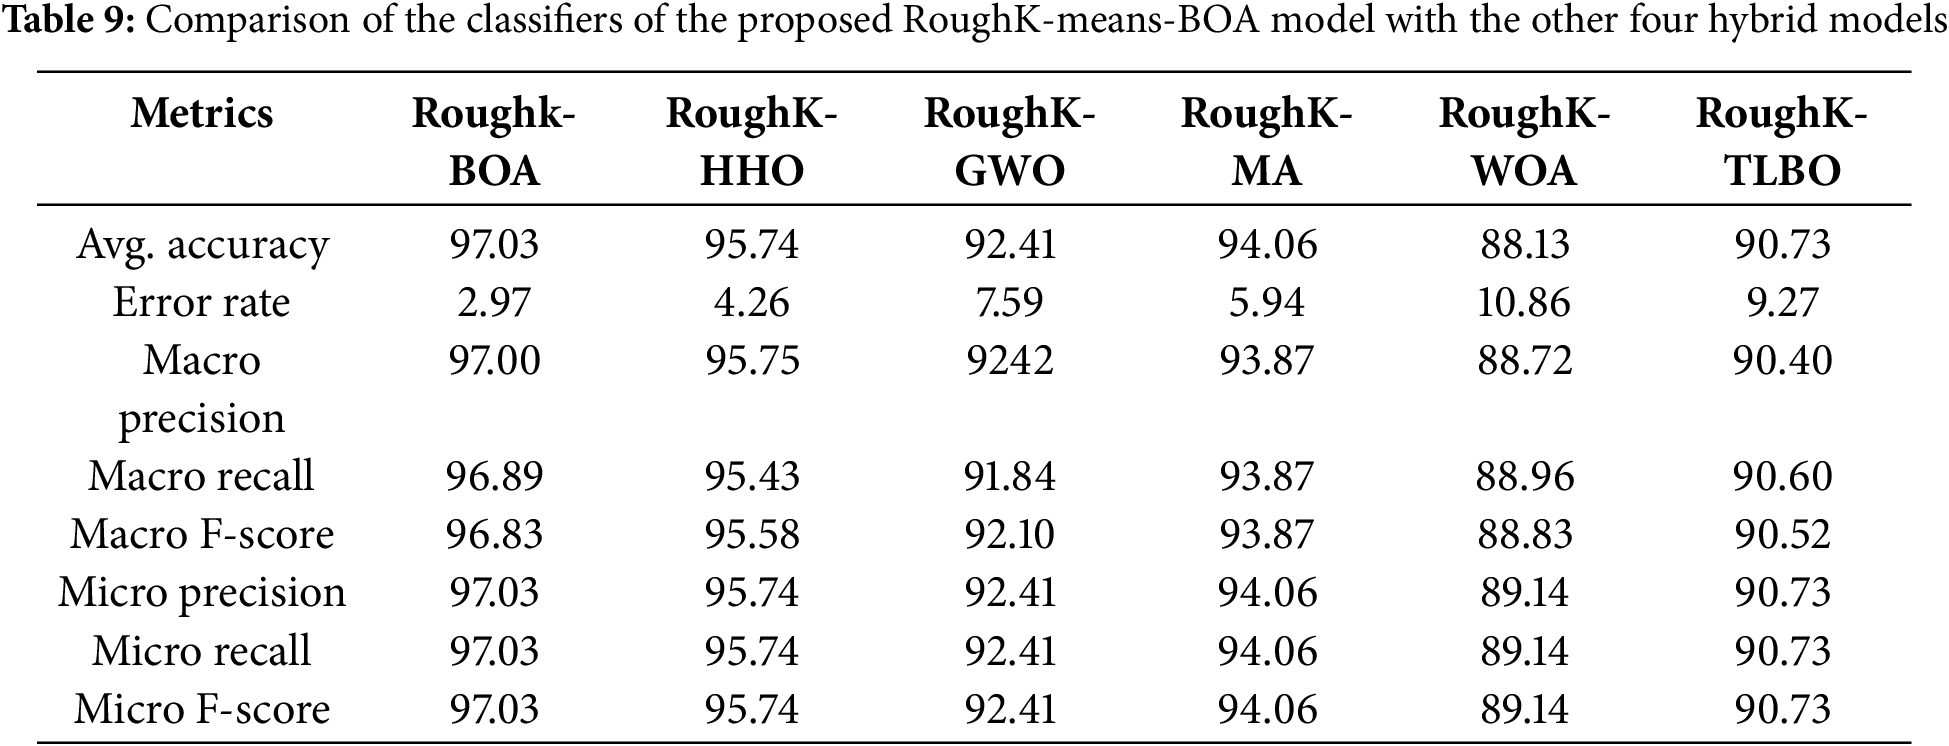
It can be observed from the above table that the RoughK-BOA is performing comparatively better than the other combinations of the RKM approaches. RoughK-BOA holds the highest average accuracy of 97.03 and the lowest error rate of 2.97, which is the least among the different combinations. Furthermore, the performance of the proposed model is evaluated using Receiver Operating Characteristic (ROC) curves, which illustrate the relationship between the true positive rate and the false positive rate. The AUC was calculated for each model to quantify its classification capability. A higher AUC value indicates better performance in distinguishing between classes. The corresponding ROC curves are shown in Fig. 11.
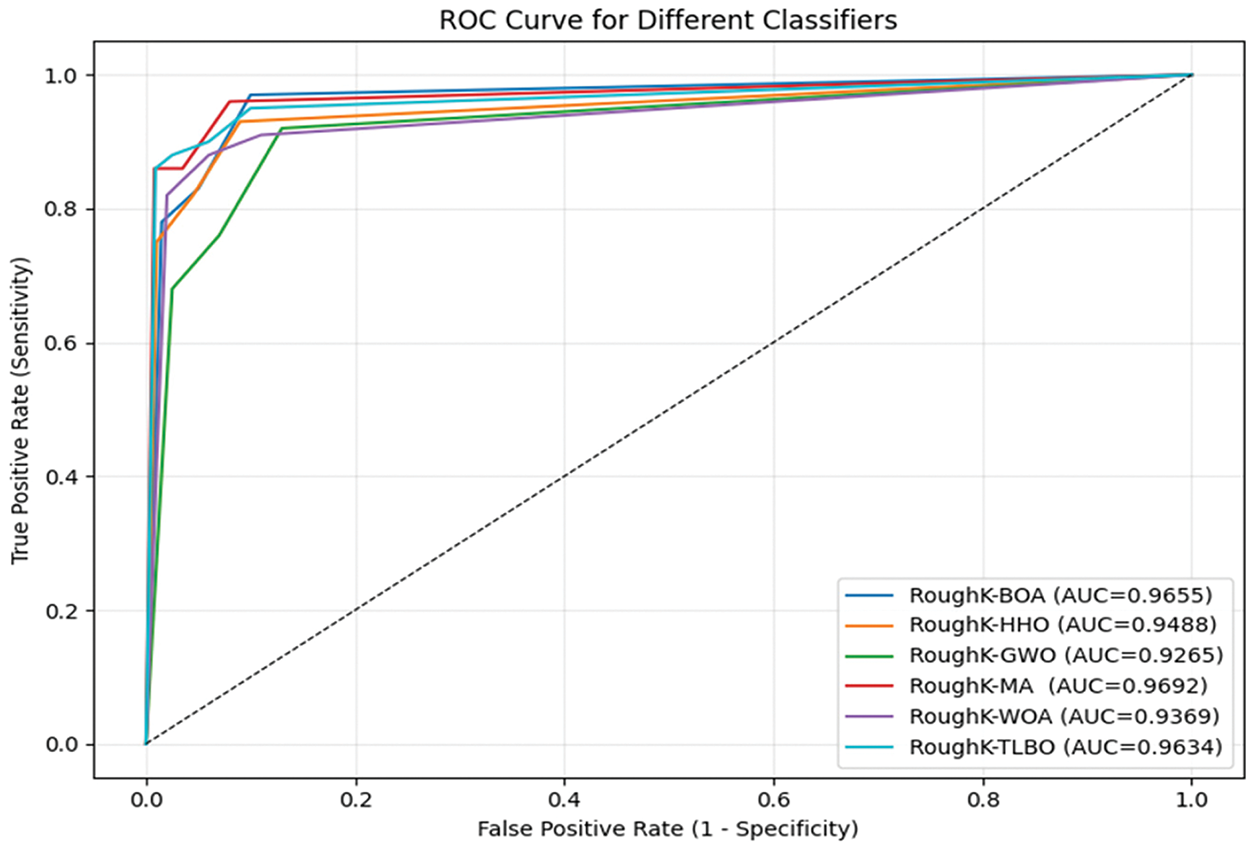
Figure 11: ROC curve for various Hybrid Models of RoughK-means
The ROC curve provides a visual comparison of the models, demonstrating their effectiveness in classification. Based on the overall analysis, RoughK-BOA proves to be the most efficient model, offering a balanced trade-off between precision and recall while maintaining the highest accuracy.
Setup 5: Comparison of results with existing hybrid approaches
The proposed cluster BOA technique involves utilizing RKM with BOA segmentation techniques to group the data, followed by a BOA approach to each clustered dataset. This approach demonstrates improved performance compared to various hybrid knowledge systems developed in previous research studies, as shown in Table 10. Prasanna et al. [35] employ k-means clustering alongside multiple classification algorithms, including DT, NB, SVM, and KNN. Vijaya et al. [40] have used the Clustered Genetic Algorithm(C-GA) achieved the highest prediction accuracy of 94.56%, outperforming traditional models like RF of 89.48%, DT of 88.49%, SVM of 85.44%, and optimization methods such as ACO of 93.35% and Firefly approach with 92.94%, demonstrating its effectiveness for heart disease prediction [40]. Vijaya et al. [41] segmented the data using clustering techniques and then applied PSO to each clustered dataset. The experimental results reveal that the Decision Tree classifier outperforms the other algorithms in terms of predictive accuracy.
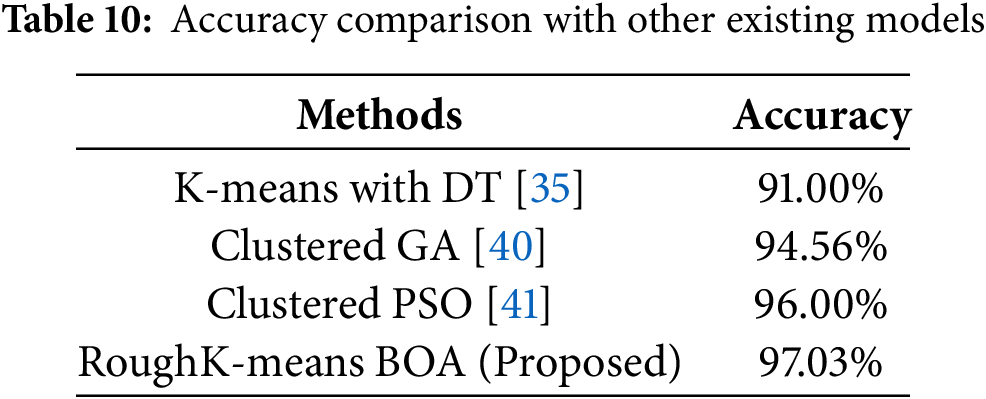
As shown in table above, the performance analysis of the proposed model across various configurations reveals that the RoughK-BOA model outperforms. However, the current study is confined to the ML model, where the performance of DL models is evaluated. This is considered a potential limitation of the current study. The dataset considered in the current study is limited in size. Performing data augmentation to enhance the dataset’s size would have a significant impact on the model’s performance, which is not analyzed in this study. Fine-tuning of the model parameters would affect performance, which is not performed in the current research and is considered a potential limitation of the study.
The ablation study is performed in the current research concerning the featured engineer; the performance of the proposed model is evaluated by removing the RoughK algorithm. The observed results for the proposed RoughK-BOA and BOA alone are presented through the confusion matrix, as shown in Fig. 12, and the corresponding metric values are also updated in Table 11.
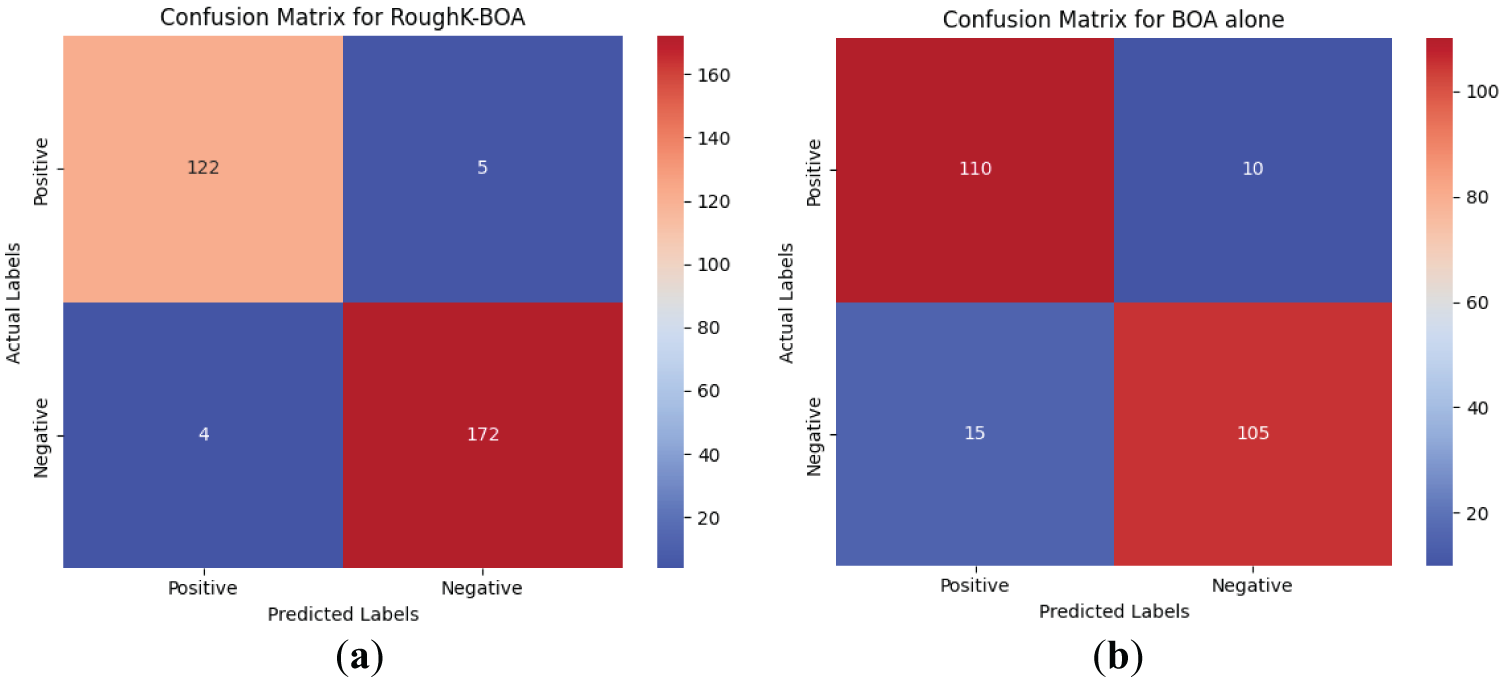
Figure 12: The confusion matrix obtained during the ablation study
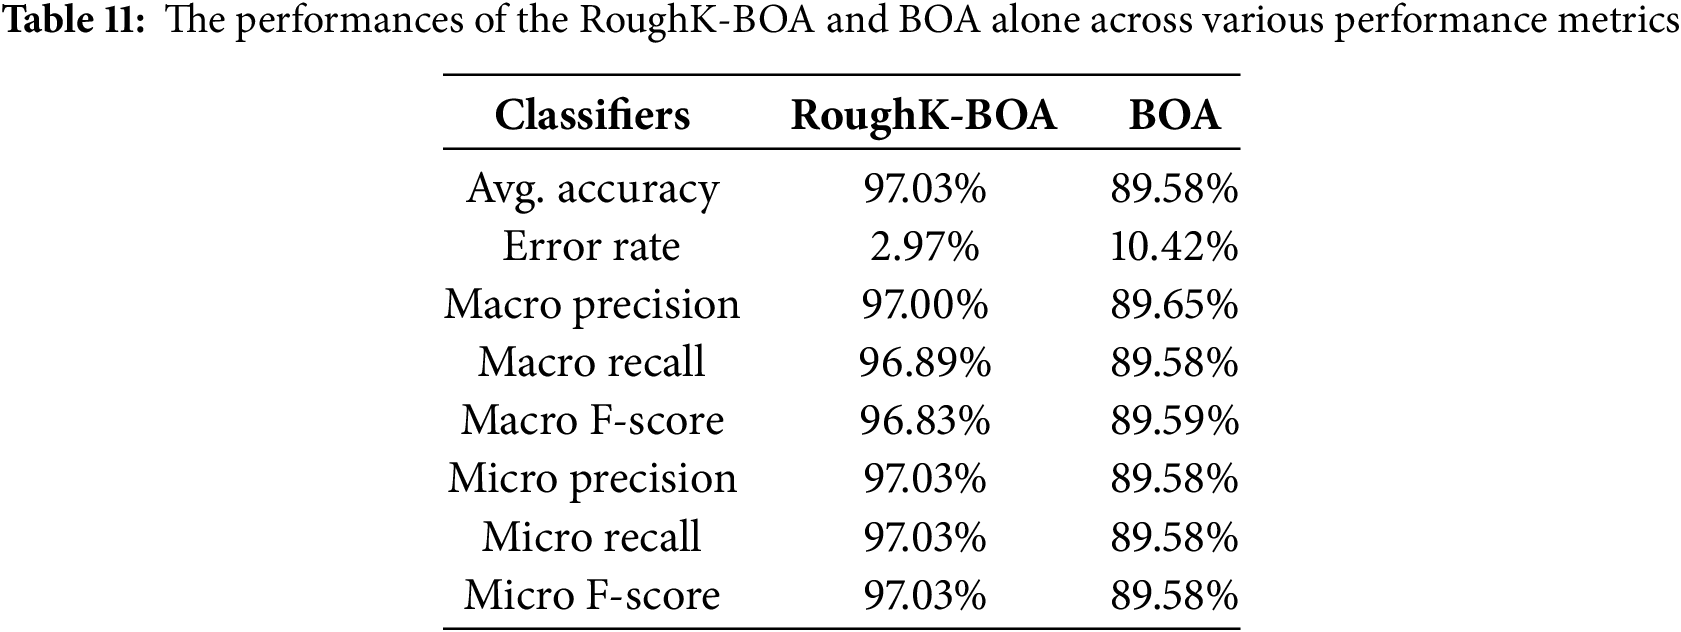
It can be observed from the experimental outcome that the RoughK-means for feature selection does have a significant impact on the performance of the classification outcome of the model. The RoughK-BOA exhibited an accuracy difference of 7.45% over the BOA approach alone.
The limitations of this study, which demonstrate high classification accuracy using RoughK-means and BOA, also present several limitations. The use of a relatively small dataset (303 samples from the UCI repository) may limit the generalizability of the findings. No data augmentation techniques were applied, which could have helped reduce the risks of overfitting and enhanced the model’s robustness. The evaluation was performed on a single dataset without external validation, and DL models were not included for comparison, which might have provided a stronger benchmark.
Data augmentation techniques are a valid strategy for addressing limitations related to small dataset sizes, which can lead to overfitting or underfitting in machine learning models. In this study, the dataset used comprises only 303 samples, which may restrict the model’s capacity to generalize well to unseen data. By artificially expanding the training data through augmentation methods—such as synthetic instance generation, bootstrapping, or SMOTE—diversity within the dataset can be increased without the need to collect new samples. This helps reduce the risk of overfitting by exposing the model to a broader range of patterns during training and minimizes underfitting by providing more representative examples for each class. Therefore, integrating data augmentation into future iterations of the proposed RoughK-BOA model could further enhance its robustness and predictive performance.
Deployment: The proposed RoughK-means+BOA model has significant practical applications in real-world healthcare systems. It can be integrated into Clinical Decision Support Systems (CDSS), wearable health monitoring devices, and hospital EHR systems to provide automated and real-time risk assessment. The RoughK-BOA model is adaptable to various deployment settings. It can be embedded into CDSS platforms to assist clinicians during consultations, integrated with IoMT-based wearable devices for real-time monitoring, or deployed as a secure cloud API for mobile health applications. These options ensure scalable, efficient, and accessible cardiovascular risk prediction across both centralized and remote care environments.
5 Conclusion and Future Enhancements
Prediction of coronary artery illness is crucial, as the WHO recognizes it as the leading cause of mortality worldwide. Therefore, our goal is to improve the accuracy of these forecasts. This work presents a new approach, the clustered BOA method, for predicting coronary artery disease. The proposed hybrid model has two modules: clustering and classification. The clustering module utilizes the RoughK-means algorithm to group data, while the classification module uses BOA. Experiments evaluated the classification results and compared them with those of other popular classification methods. The final set of studies compared the proposed hybrid approach to several newly proposed hybrid organizational approaches. All results indicate that the hybrid model-based learning scheme is highly promising and outperforms previous models. The proposed methodology enhances the prediction process, achieving higher accuracy than current classification algorithms and other swarm intelligence algorithms.
The proposed RoughK-BOA model has significant practical applications in real-world healthcare systems. It can be integrated into Clinical Decision Support Systems, wearable health monitoring devices, and hospital EHR systems to provide automated and real-time risk assessment. The model’s clustering mechanism enhances early disease detection and identifies patient risk levels, providing targeted preventive care. Additionally, its high accuracy of 97.03% reduces the likelihood of misdiagnosis, thereby improving clinical decision-making.
For future research, integrating the model with IoT-based healthcare systems will enable real-time monitoring of cardiovascular conditions, with a focus on utilizing edge computing to enhance efficiency and effectiveness. Expanding the study to larger and more diverse datasets, incorporating real-world hospital records and multi-modal inputs such as ECG signals and wearable sensor data, will improve the model’s adaptability. The execution time is a crucial metric that has not been considered in the current evaluation and can be included in future studies for a comprehensive analysis of performance. Data augmentation has a significant impact on working with smaller datasets, which can be considered in future work. Further advancements may involve combining BOA with DL methods, such as CNNs, RNNs, or Transformer models, to refine feature extraction and classification processes.
Acknowledgement: The authors would like to thank the anonymous reviewers for their insightful comments on the study, which have assisted in improving the paper.
Funding Statement: This research work was supported by the Research Incentive Grant 23200 of Zayed University, United Arab Emirates.
Author Contributions: Kamepalli S. L. Prasanna has written the initial draft and is involved in designing the software for part of the project. Vijaya J has been involved in proposing the methodology and software part of the project. Parvathaneni Naga Srinivasu performed the analysis, interpreted the results, and revised the article. Babar Shah has performed the formal analysis, resources, and validation of the project’s results. Farman Ali is involved in conceptualization, data curation, and project administration. All authors reviewed the results and approved the final version of the manuscript.
Availability of Data and Materials: The open-access data that is used in the current study is available at https://archive.ics.uci.edu/dataset/45/heart+disease (accessed on 01 January 2025).
Ethics Approval: Not applicable.
Conflicts of Interest: The authors declare no conflicts of interest to report regarding the present study.
References
1. Ali F, El-Sappagh S, Riazul Islam SM, Kwak D, Ali A, Imran M, et al. A smart healthcare monitoring system for heart disease prediction based on ensemble deep learning and feature fusion. Inf Fusion. 2020;63:208–22. doi:10.1016/j.inffus.2020.06.008. [Google Scholar] [CrossRef]
2. Gárate-Escamila AK, Hajjam El Hassani A, Andrès E. Classification models for heart disease prediction using feature selection and PCA. Inform Med Unlocked. 2020;19(3):100330. doi:10.1016/j.imu.2020.100330. [Google Scholar] [CrossRef]
3. Luo Y, Liu J, Zeng J, Pan H. Global burden of cardiovascular diseases attributed to low physical activity: an analysis of 204 countries and territories between 1990 and 2019. Am J Prev Cardiol. 2024;17(1):100633. doi:10.1016/j.ajpc.2024.100633. [Google Scholar] [PubMed] [CrossRef]
4. Dutta A, Batabyal T, Basu M, Acton ST. An efficient convolutional neural network for coronary heart disease prediction. Expert Syst Appl. 2020;159(2):113408. doi:10.1016/j.eswa.2020.113408. [Google Scholar] [CrossRef]
5. Mienye ID, Sun Y, Wang Z. Improved sparse autoencoder based artificial neural network approach for prediction of heart disease. Inform Med Unlocked. 2020;18(6):100307. doi:10.1016/j.imu.2020.100307. [Google Scholar] [CrossRef]
6. Gupta A, Kumar R, Singh Arora H, Raman B. MIFH: a machine intelligence framework for heart disease diagnosis. IEEE Access. 2019;8:14659–74. doi:10.1109/access.2019.2962755. [Google Scholar] [CrossRef]
7. Khan MA, Algarni F. A healthcare monitoring system for the diagnosis of heart disease in the IoMT cloud environment using MSSO-ANFIS. IEEE Access. 2020;8:122259–69. doi:10.1109/access.2020.3006424. [Google Scholar] [CrossRef]
8. Ahmed H, Younis EMG, Hendawi A, Ali AA. Heart disease identification from patients’ social posts, machine learning solution on spark. Future Gener Comput Syst. 2020;111(12):714–22. doi:10.1016/j.future.2019.09.056. [Google Scholar] [CrossRef]
9. Baashar Y, Alkawsi G, Alhussian H, Capretz LF, Alwadain A, Alkahtani AA, et al. Effectiveness of artificial intelligence models for cardiovascular disease prediction: network meta-analysis. Comput Intell Neurosci. 2022;2022:5849995. doi:10.1155/2022/5849995. [Google Scholar] [PubMed] [CrossRef]
10. Gupta A, Kumar R, Arora HS, Raman B. C-CADZ: computational intelligence system for coronary artery disease detection using Z-Alizadeh Sani dataset. Appl Intell. 2022;52(3):2436–64. doi:10.1007/s10489-021-02467-3. [Google Scholar] [CrossRef]
11. Ansarullah SI, Saif SM, Kumar P, Kirmani MM. Significance of visible non-invasive risk attributes for the initial prediction of heart disease using different machine learning techniques. Comput Intell Neurosci. 2022;2022(7):9580896. doi:10.1155/2022/9580896. [Google Scholar] [PubMed] [CrossRef]
12. Tabassum S, Muhammad F, Khan MA, Khan MU, Awan D, Gohar N, et al. A machine learning-based framework for heart disease diagnosis using a comprehensive patient cohort. Comput Mater Contin. 2025;84(1):1253–78. doi:10.32604/cmc.2025.065423. [Google Scholar] [CrossRef]
13. Niu S, Zhou Y, Li Z, Huang S, Zhou Y. An improved grey wolf optimization algorithm for heart disease prediction. In: Advanced intelligent technologies and sustainable society. Singapore: Springer; 2024. p. 527–42. doi: 10.1007/978-981-97-3210-4_43. [Google Scholar] [CrossRef]
14. Mohan S, Thirumalai C, Srivastava G. Effective heart disease prediction using hybrid machine learning techniques. IEEE Access. 2019;7:81542–54. doi:10.1109/access.2019.2923707. [Google Scholar] [CrossRef]
15. Deepika D, Balaji N. Effective heart disease prediction using novel MLP-EBMDA approach. Biomed Signal Process Control. 2022;72(S6):103318. doi:10.1016/j.bspc.2021.103318. [Google Scholar] [CrossRef]
16. Swathy M, Saruladha K. A comparative study of classification and prediction of Cardio-Vascular Diseases (CVD) using machine learning and deep learning techniques. ICT Express. 2022;8(1):109–16. doi:10.1016/j.icte.2021.08.021. [Google Scholar] [CrossRef]
17. Khourdifi Y, Bahaj M. Heart disease prediction and classification using machine learning algorithms optimized by particle swarm optimization and ant colony optimization. Int J Intell Eng Syst. 2019;12(1):242–52. doi:10.22266/ijies2019.0228.24. [Google Scholar] [CrossRef]
18. Latha CBC, Jeeva SC. Improving the accuracy of prediction of heart disease risk based on ensemble classification techniques. Inform Med Unlocked. 2019;16:100203. doi:10.1016/j.imu.2019.100203. [Google Scholar] [CrossRef]
19. Koppu S, Maddikunta PKR, Srivastava G. Deep learning disease prediction model for use with intelligent robots. Comput Electr Eng. 2020;87(2):106765. doi:10.1016/j.compeleceng.2020.106765. [Google Scholar] [PubMed] [CrossRef]
20. Nagarajan SM, Muthukumaran V, Murugesan R, Joseph RB, Meram M, Prathik A. Innovative feature selection and classification model for heart disease prediction. J Reliab Intell Environ. 2022;8(4):333–43. doi:10.1007/s40860-021-00152-3. [Google Scholar] [CrossRef]
21. García-Ordás MT, Bayón-Gutiérrez M, Benavides C, Aveleira-Mata J, Benítez-Andrades JA. Heart disease risk prediction using deep learning techniques with feature augmentation. Multimed Tools Appl. 2023;82(20):31759–73. doi:10.1007/s11042-023-14817-z. [Google Scholar] [CrossRef]
22. Yi J, Yu P, Huang T, Xu Z. Optimization of transformer heart disease prediction model based on particle swarm optimization algorithm. arXiv:2412.02801. 2024. [Google Scholar]
23. Rath A, Mishra D, Panda G, Satapathy SC. Heart disease detection using deep learning methods from imbalanced ECG samples. Biomed Signal Process Control. 2021;68:102820. doi:10.1016/j.bspc.2021.102820. [Google Scholar] [CrossRef]
24. Sudha VK, Kumar D. Hybrid CNN and LSTM network for heart disease prediction. SN Comput Sci. 2023;4(2):172. doi:10.1007/s42979-022-01598-9. [Google Scholar] [CrossRef]
25. Bhavekar GS, Das Goswami A. A hybrid model for heart disease prediction using recurrent neural network and long short term memory. Int J Inf Technol. 2022;14(4):1781–9. doi:10.1007/s41870-022-00896-y. [Google Scholar] [CrossRef]
26. Dwivedi AK. Performance evaluation of different machine learning techniques for prediction of heart disease. Neural Comput Appl. 2018;29(10):685–93. doi:10.1007/s00521-016-2604-1. [Google Scholar] [CrossRef]
27. Al Reshan MS, Amin S, Ali Zeb M, Sulaiman A, Alshahrani H, Shaikh A. A robust heart disease prediction system using hybrid deep neural networks. IEEE Access. 2023;11:121574–91. doi:10.1109/access.2023.3328909. [Google Scholar] [CrossRef]
28. Chang W, Liu Y, Wu X, Xiao Y, Zhou S, Cao W. A new hybrid XGBSVM model: application for hypertensive heart disease. IEEE Access. 2019;7:175248–58. doi:10.1109/access.2019.2957367. [Google Scholar] [CrossRef]
29. Lingras P, West C. Interval set clustering of web users with rough K-means. J Intell Inf Syst. 2004;23(1):5–16. doi:10.1023/B:JIIS.0000029668.88665.1a. [Google Scholar] [CrossRef]
30. Peters G. Some refinements of rough k-means clustering. Pattern Recognit. 2006;39(8):1481–91. doi:10.1016/j.patcog.2006.02.002. [Google Scholar] [CrossRef]
31. Heart disease. [cited 2025 Jul 1]. Available from: https://archive.ics.uci.edu/dataset/45/heart+disease. [Google Scholar]
32. Arora S, Singh S. Butterfly optimization algorithm: a novel approach for global optimization. Soft Comput. 2019;23(3):715–34. doi:10.1007/s00500-018-3102-4. [Google Scholar] [CrossRef]
33. Srinivasu PN, Sirisha U, Sandeep K, Praveen SP, Maguluri LP, Bikku T. An interpretable approach with explainable AI for heart stroke prediction. Diagnostics. 2024;14(2):128. doi:10.3390/diagnostics14020128. [Google Scholar] [PubMed] [CrossRef]
34. Veerabaku MG, Nithiyanantham J, Urooj S, Md AQ, Sivaraman AK, Tee KF. Intelligent Bi-LSTM with architecture optimization for heart disease prediction in WBAN through optimal channel selection and feature selection. Biomedicines. 2023;11(4):1167. doi:10.3390/biomedicines11041167. [Google Scholar] [PubMed] [CrossRef]
35. Prasanna KSL, Vijaya J. Building an efficient heart disease prediction system by using clustering techniques. In: High performance computing and networking. Singapore: Springer; 2022. p. 69–81. doi:10.1007/978-981-16-9885-9_6. [Google Scholar] [CrossRef]
36. Zervoudakis K, Tsafarakis S. A mayfly optimization algorithm. Comput Ind Eng. 2020;145(5):106559. doi:10.1016/j.cie.2020.106559. [Google Scholar] [CrossRef]
37. Heidari AA, Mirjalili S, Faris H, Aljarah I, Mafarja M, Chen H. Harris Hawks optimization: algorithm and applications. Future Gener Comput Syst. 2019;97:849–72. doi:10.1016/j.future.2019.02.028. [Google Scholar] [CrossRef]
38. Mirjalili S, Lewis A. The whale optimization algorithm. Adv Eng Softw. 2016;95(12):51–67. doi:10.1016/j.advengsoft.2016.01.008. [Google Scholar] [CrossRef]
39. Peters G. Outliers in rough k-means clustering. In: PReMI’05: Proceedings of the First International Conference on Pattern Recognition and Machine Intelligence; 2005 Dec 20–22; Kolkata, India. p. 702–7. [Google Scholar]
40. Vijaya J. Heart disease prediction using clustered genetic optimization algorithm. In: 2023 International Conference on Intelligent and Innovative Technologies in Computing, Electrical and Electronics (IITCEE); 2023 Jan 27–28; Bengaluru, India. p. 1072–7. doi:10.1109/IITCEE57236.2023.10091050. [Google Scholar] [CrossRef]
41. Vijaya J, Rao M. Heart disease prediction using clustered particle swarm optimization techniques. In: 2022 IEEE 6th Conference on Information and Communication Technology (CICT); 2022 Nov 18–20; Gwalior, India. doi:10.1109/CICT56698.2022.9997925. [Google Scholar] [CrossRef]
Cite This Article
 Copyright © 2025 The Author(s). Published by Tech Science Press.
This work is licensed under a Creative Commons Attribution 4.0 International License , which permits unrestricted use, distribution, and reproduction in any medium, provided the original work is properly cited.
 Downloads
 Citation Tools