
 Submit a Paper
 Propose a Special lssue
 Open Access
ARTICLE
Optimizing Network Intrusion Detection Performance with GNN-Based Feature Selection
1 Division of Computer Science and Engineering, Sunmoon University, 70, Sunmoon-ro 221 beon-gil, Tangjeong-myeo, Asan, 31460, Republic of Korea
2 Cryptography and Cognitive Informatics Laboratory, AGH University of Krakow, 30 Mickiewicza Ave., Krakow, 30059, Poland
3 Faculty of Social and Economic Studies, Jan Evangelista Purkyne University, Pasteurova 1, Usti nad Labem, 40096, Czech Republic
4 Department of History and Historical Content, Sangmyung University, 20, Hongjimun-2gil, Seoul, 03016, Republic of Korea
* Corresponding Author: Sangheon Kim. Email:
Computers, Materials & Continua 2025, 85(2), 2985-2997. https://doi.org/10.32604/cmc.2025.065885
Received 24 March 2025; Accepted 21 August 2025; Issue published 23 September 2025
 View Full Text
 Download PDF
Abstract
The rapid evolution of AI-driven cybersecurity solutions has led to increasingly complex network infrastructures, which in turn increases their exposure to sophisticated threats. This study proposes a Graph Neural Network (GNN)-based feature selection strategy specifically tailored for Network Intrusion Detection Systems (NIDS). By modeling feature correlations and leveraging their topological relationships, this method addresses challenges such as feature redundancy and class imbalance. Experimental analysis using the KDDTest+ dataset demonstrates that the proposed model achieves 98.5% detection accuracy, showing notable gains in both computational efficiency and minority class detection. Compared to conventional machine learning methods, the GNN-based approach exhibits a superior capability to adapt to the dynamics of evolving cyber threats. The findings support the feasibility of deploying GNNs for scalable, real-time anomaly detection in modern networks. Furthermore, key predictive features, notably f35 and f23, are identified and validated through correlation analysis, thereby enhancing the model’s interpretability and effectiveness.Keywords
The rapid evolution of AI-driven cybersecurity solutions has led to increasingly complex and interconnected network infrastructures, thereby increasing their susceptibility to sophisticated and adaptive cyber threats. This evolution has led to the rise of sophisticated cyber threats and network intrusions [1,2]. Consequently, the development of robust and efficient network intrusion detection systems (NIDSs) has emerged as a critical priority for ensuring the security and integrity of modern networks [3]. Traditional NIDS approaches rely primarily on static rule-based systems or classical machine learning algorithms. These methods often fail to learn new attack patterns in real time or adequately reflect the complex interactions within large-scale network traffic [4,5]. Although these approaches exhibit moderate success, they face significant limitations in adapting to evolving attack patterns and processing the diverse characteristics of large-scale network traffic [6,7].
In particular, feature selection—the process of identifying the most relevant features for intrusion detection—plays a pivotal role in enhancing the performance and efficiency of such systems. Graph neural networks (GNNs) have emerged as a powerful paradigm for processing and analyzing graph-structured data. They model the interactions between features within network traffic as a graph, enabling the detection of specific anomalous traffic patterns or the effective identification of attack propagation paths [8]. GNNs provide a novel approach to feature selection and intrusion detection by leveraging the intrinsic relationships and interconnectivity among features. In contrast to conventional techniques, they capture complex dependencies and nonlinear interactions, enabling a deeper understanding of network behaviors and attack patterns. This study explores the enhancement of NIDS performance through GNN-based feature selection optimization [9]. By modeling network traffic and its associated characteristics as a graph, this study aims to identify the most critical features that contribute to accurate intrusion detection. This approach improves the detection accuracy and reduces the computational overhead by focusing on the most relevant features. Additionally, the performance of GNN-based feature selection is compared with that of traditional methods to highlight the advantages of GNNs in addressing modern network security challenges [10,11]. This study addresses the limitations of traditional network intrusion detection systems (NIDSs), which suffer from feature redundancy, high computational costs, and limited adaptability to evolving cyber threats. To overcome these challenges, we propose a GNN-based feature selection framework to optimise both the detection accuracy and computational efficiency. This study aims to identify key features critical to intrusion detection through correlation analysis, develop and evaluate a GNN-based feature selection framework, and compare its performance with that of traditional feature selection methods in terms of detection accuracy and computational efficiency. We hypothesize that the GNN-based method significantly enhances both the detection accuracy and computational efficiency compared with traditional methods. Therefore, this study aims to develop a GNN-based feature selection strategy that effectively addresses the issues of redundancy and class imbalance in intrusion detection. We hypothesise that this approach can enhance both detection accuracy and computational efficiency in NIDS. Despite the growing body of research in AI-driven intrusion detection, few studies have thoroughly explored graph-based feature relationships. This study addresses this gap by proposing a GNN-based feature selection method that emphasizes both detection accuracy and interpretability, particularly in handling class imbalance in NIDS environments.
The remainder of this paper is organized as follows. Section 2 provides an overview of related work on NIDS and feature selection techniques. Section 3 describes the proposed GNN-based feature-selection framework. Section 4 presents experimental results and performance evaluations. Finally, Section 5 concludes the paper with a discussion of future research directions.
The approach proposed in this study achieved an anomaly detection accuracy of 98.5%, whereas reference [12] achieved an accuracy of 99.36%. Another study [13] utilized the pigeon-inspired optimizer (PIO) algorithm to enhance feature selection in the NIDS. The UNSW-NB15 dataset was utilized, and 18 important features were selected. Although important features were excluded, the accuracy reached 91.3%. PIO, a biologically inspired algorithm, contributes to enhancing detection accuracy and speed by selecting only optimal features. In contrast to our study and [12], which achieved accuracies of 98.5% and 99.36%, respectively, reference [13] focused on optimizing feature selection rather than achieving the highest detection accuracy. The reported accuracy of 91.3% represents an improvement relative to prior methods used in [13] but is not directly comparable to our results. The PIO contributes to enhancing detection accuracy and speed by selecting optimal features. Reference [14] used the random forest (RF) algorithm to evaluate the importance of each feature and selected 11 key features from the UNSW-NB15 dataset. Through feature importance analysis, the RF model achieved an accuracy of 75.56% and an F-measure of 73.00%, which reflected improved system efficiency by removing unnecessary features. Reference [15] employed an ensemble feature selection technique to enhance intrusion detection performance by combining multiple classifiers. In particular, a correlation-based feature selection method was used to reduce model complexity while improving accuracy. By removing redundant features and selecting only highly important features, this study reduces computational costs while maintaining high performance. Additionally, reference [16] combined principal component analysis and linear discriminant analysis to reduce dimensionality and improve the performance of the NIDS. This method achieved higher accuracy, particularly in detecting low-frequency attacks, effectively identifying rare malicious activities by combining dimensionality reduction techniques. Although these studies achieve significant performance improvements, challenges such as high computational costs, complexity, and difficulties in real-time response remain unresolved. Many studies have proposed various optimization and feature selection methods to improve NIDS performance; however, these algorithms often incur high computational overhead. For example, correlation-based feature selection and ensemble learning techniques increase system complexity, making them difficult to apply in real-time detection systems. Moreover, in environments requiring real-time responses, complex optimization techniques can inadvertently degrade system performance. Recent advances in IoT-based deep learning for cybersecurity have demonstrated the importance of explainable and resilient models. For example, CPS-IoT-PPDNN proposed a privacy-preserving DNN framework for anomaly detection in CPSs [17]. Similarly, XAIEnsembleTL-IoV introduced an explainable ensemble transfer learning approach to detect zero-day botnet attacks in Internet of Vehicles environments [18]. Additionally, the combination of DCNN and LSTM models has been explored for intrusion detection in industrial control systems, achieving improved performance on critical infrastructure datasets. These studies highlight the growing trend of applying advanced AI techniques to network security, reinforcing the relevance of feature optimization in intrusion detection systems.
This study aims to improve the performance of NIDS via a GNN-based model. The proposed model leverages the structural advantages of graph-based learning to effectively capture complex relationships between network features and applies these relationships to increase the accuracy of anomaly detection. The feature definition utilized in this study was originally defined in [19]. In that work, the features consist of service(f3), flag(f4), Decision class(f42) and appear from calculation (f23,f25,f27,f28,f29,f32,f33,f34,f35,f38,f39,f40,f41). The classes in service(f3) contains (aol, auth, bgp, courier, csnet_ns, ctf, daytime; discard, domain, domain_u, echo, eco_i, ecr_i, efs, exec, finger, ftp, gopher, http, imap4, IRC, iso_tsap, klogin, kshell, ldap, link, login, mtp, name, netbios_dgm, netbios_ns, netbios_ssn, netstat, nnsp, nntp, ntp_u, other, pm_dump, pop_2, pop_3, printer, private, red_i, remote_job, rje, shell, smtp, sql_net, ssh, sunrpc, telnet, tftp_u, tim_i, time, urh_i, urp_i, uucp, uucp_path, vmnet, whois, X11, Z39_50). The classes in flag(f4) contain (OTH, REJ, RSTO, RSTOS0, RSTR, S0, S1, S2, S3, SF, SH), and Decision class(f42) consists of normal and anomaly.
This study utilizes the KDDTest+16 dataset to evaluate the performance of the NIDS. The dataset includes various network traffic features and types of intrusions and is designed to detect attacks that may occur in real-world network environments effectively. It contains 14,875 instances, and its composition is explained in Table 1.
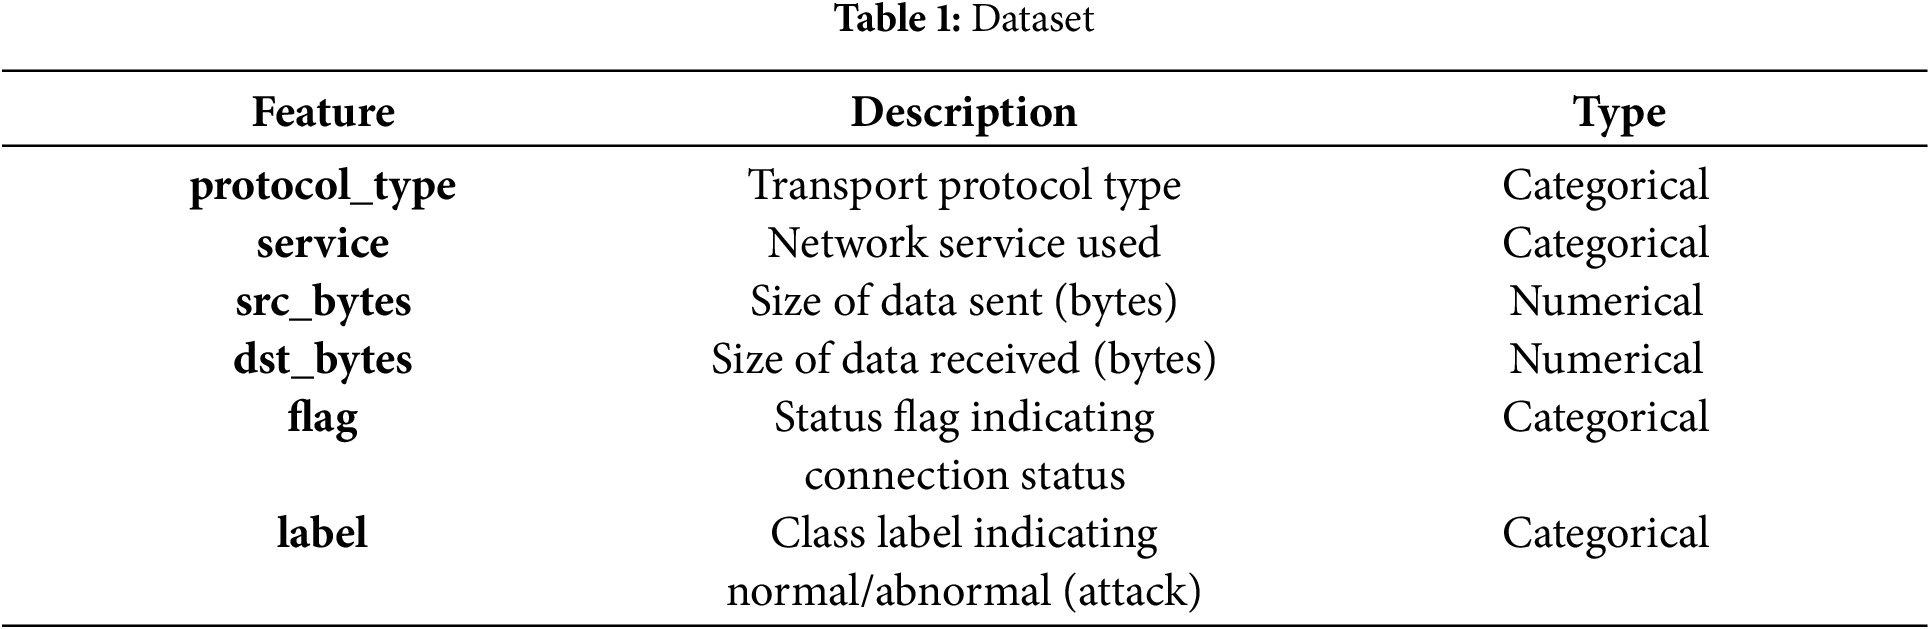
Fig. 1 illustrates the structure of the proposed GNN-based NIDS model. The model comprises an input layer, two graph convolutional network (GCN) layers, and a final SoftMax output layer. The first graph convolutional layer captures local feature dependencies and introduces nonlinearity through the rectified linear unit (ReLU) activation function. The second GCN layer aggregates the learned information, which is then passed to the SoftMax layer for multiclass classification. To ensure the statistical validity of our experimental results, we employed 5-fold cross-validation to mitigate bias and variance across training and testing splits. This approach allows for a more robust estimate of model performance, particularly in datasets like KDDTest+ where class imbalance can distort outcomes from a single train-test split. Additionally, we used the paired t-test to determine whether the observed performance improvements of our GNN-based feature selection method were statistically significant when compared to baseline models. The test was applied to detection accuracy, precision, recall, and F1-score across the five folds. Results showed
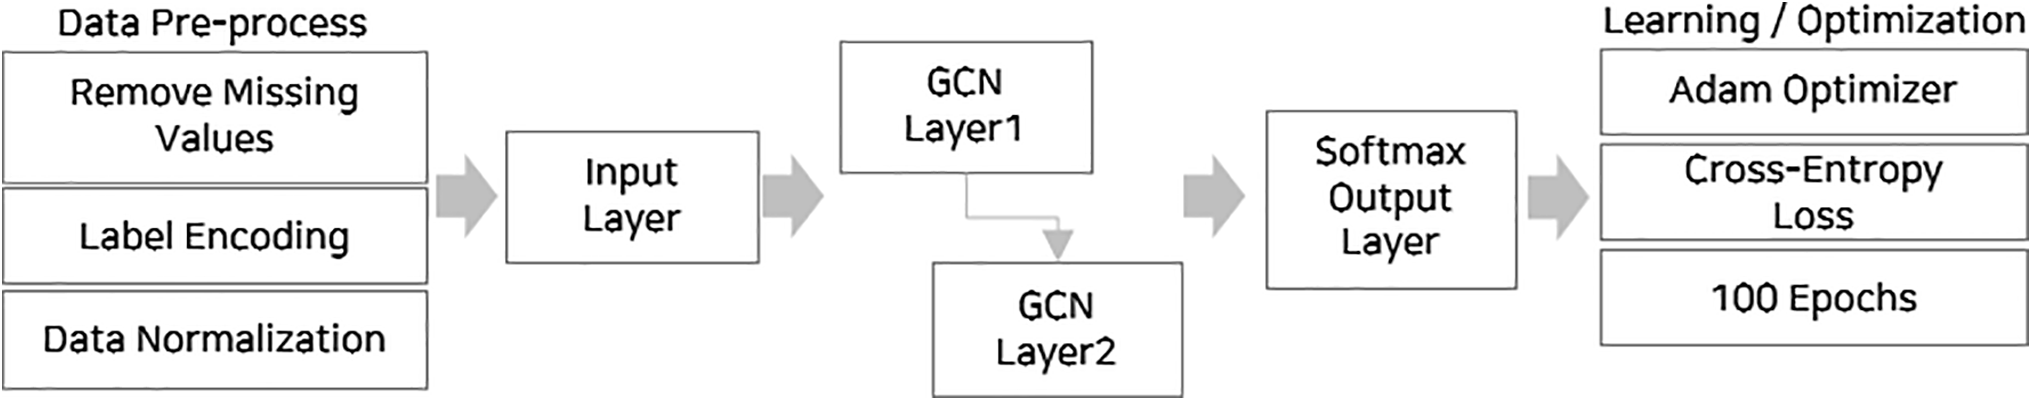
Figure 1: Graphic neural network (GNN)-based network intrusion detection system (NIDS) model architecture
The first GCN layer captures local feature dependencies and introduces nonlinearity through the ReLU activation function; the second layer aggregates the learned information and ultimately performs the classification task. The mathematical operations of each layer are as follows.
The equation is formulated based on the following content.
•
•
•
•
•
The Softmax function calculates the probability distribution for each class to perform the final classification and computes the final output using the Softmax function.
•
•
• b defines the bias.
3.5 Learning and Optimization Process
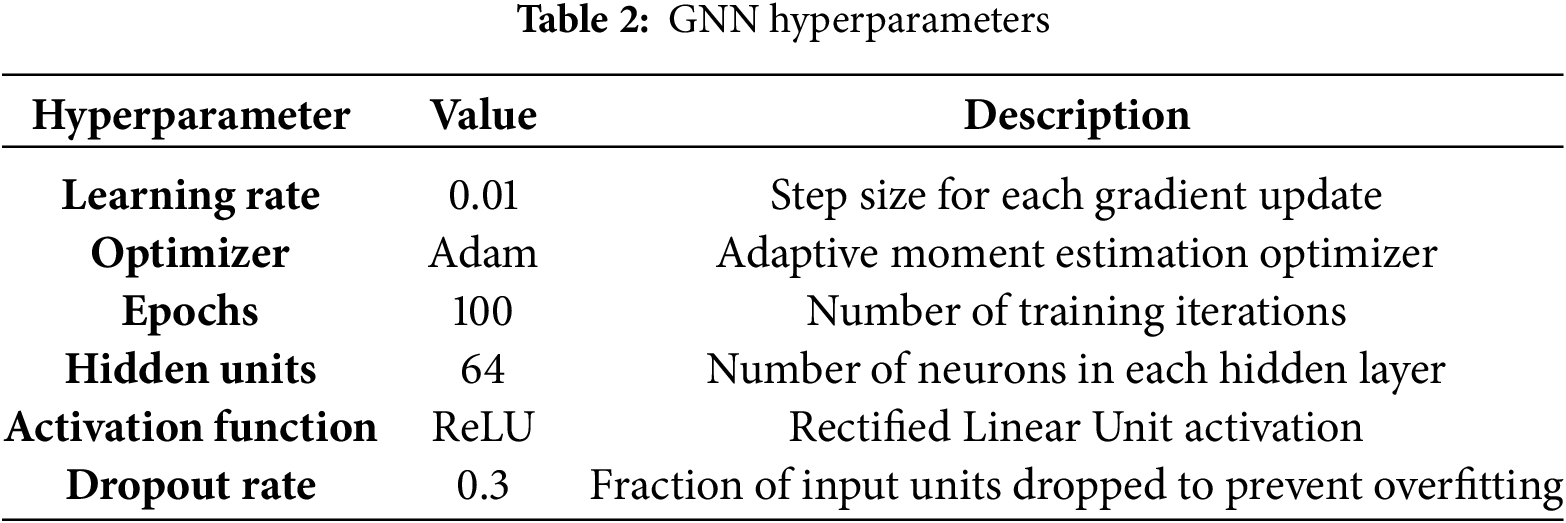
The model was trained via the Adam optimizer with a learning rate of 0.01. It employs cross-entropy loss as the loss function to handle the multiclass classification problem. The dataset was split into training and testing sets at an 80:20 ratio, and the model was trained for 100 epochs. Model performance was evaluated based on classification accuracy. To mitigate overfitting, dropout regularization (rate = 0.3) was applied, and early stopping was employed on the basis of validation loss monitoring.
The proposed model effectively identifies important features and optimizes computational efficiency by focusing on the most relevant information. The GNN model outperforms traditional machine learning methods at detecting complex and evolving attack patterns. These results prove that GNNs can efficiently model and analyze network traffic, providing a scalable and accurate solution for modern NIDSs.
4.1 Data Preprocessing Results
This study performed the following preprocessing steps to improve the model’s learning efficiency and performance.
• Missing Value Removal: All rows containing missing values were removed to ensure data consistency, minimizing potential errors during the training process.
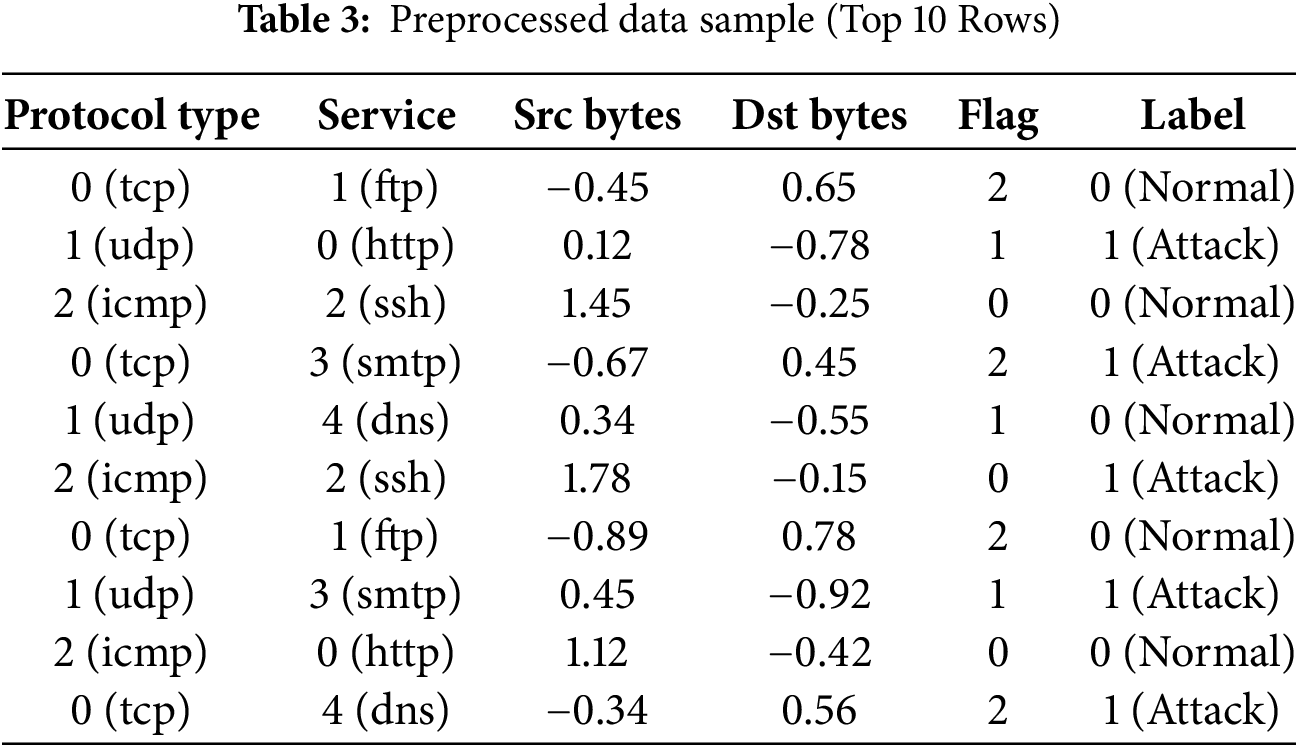
• Label Encoding: Categorical data were converted into numerical data to be processed by machine learning models. For example, the protocol_type feature was transformed by mapping tcp, udp, and icmp to 0, 1, and 2, respectively. Similarly, the service feature was encoded with http, FTP, and ssh mapped to 0, 1, and 2, respectively.
• Data Normalization: Numerical data were standardized via StandardScaler to have a mean of zero and a standard deviation of one. This process reduced the scale differences between features, improving both the training speed and model accuracy.
A portion of the KDDTest+16 dataset processed through the aforementioned steps is presented in Table 3.
The dataset contained various features and an outcome table (state: normal/anomaly signal), representing different classes such as Neptune, Normal, Saint, and MScan. These columns are attributes related to network activity or behavior in the given context. The following methods were employed to analyze the relationships between these elements.
• Correlation Analysis: Calculate the correlations between numerical features to identify the most closely related features
• Feature Importance: Determine the features most important for predicting the outcome class (f42: normal/anomaly signal)
• Class Distribution: Understand the distribution of the target variable, i.e., the different classes such as Neptune/Normal
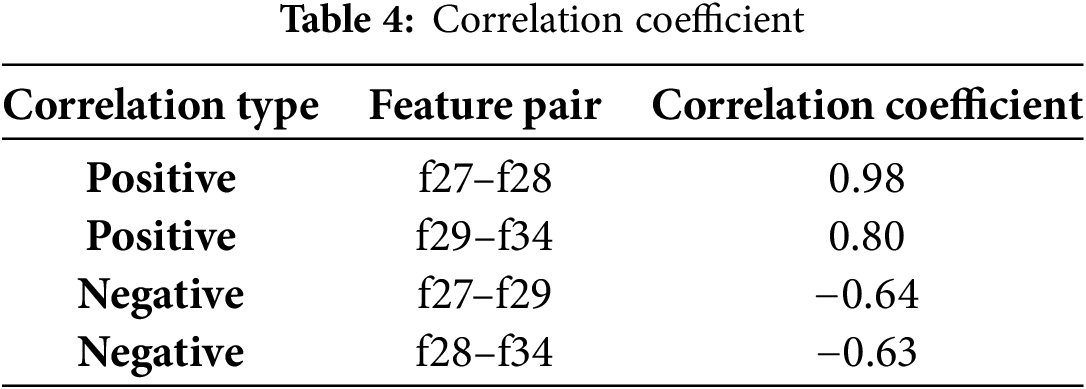
In addition to the feature-to-target correlations in Table 4, we also analyzed the interfeature correlations to better understand the redundancy and dependencies among the input variables. Strong positive correlations were observed between f27 and f28 (r = 0.98) and between f29 and f34 (r = 0.80), indicating high similarity in their behavioral patterns. On the other hand, f27 and f29 (r = −0.64) and f28 and f34 (r = −0.63) demonstrated strong negative correlations, suggesting that as one increases, the other tends to decrease. The correlations for the main key are as follows:
• High Correlation: Features f25 and f26 have correlation values close to 1, indicating that these two features represent very similar information
• Moderate Correlation: Features f27 and f28 exhibited a high level of correlation, indicating a strong relationship between changes in one feature and changes in the other
As part of the experimental analysis, we examined the correlation between the input features and the target variable (state) to identify important predictors and redundant attributes. Features f35 and f23 showed strong positive correlations with the target label, making them key indicators of normal vs. anomalous states. By contrast, features f28, f27, and f41 had negative correlations with the target, suggesting their inverse relationship with normal states. Additionally, interfeature correlations revealed that f27 and f28 were highly correlated (r = 0.98), and f29 and f34 also exhibited a strong positive relationship (r = 0.80). On the other hand, f27 and f29 (r = −0.64) and f28 and f34 (r = −0.63) exhibited strong negative relationships. This structured correlation insight was used to inform the GNN feature-selection model, enabling improved interpretability and reducing redundancy. This correlation matrix enabled the identification of features that are closely related to each other. This information can be utilized to improve the performance of the model.
The correlation analysis revealed three categories of relationships in Table 5.
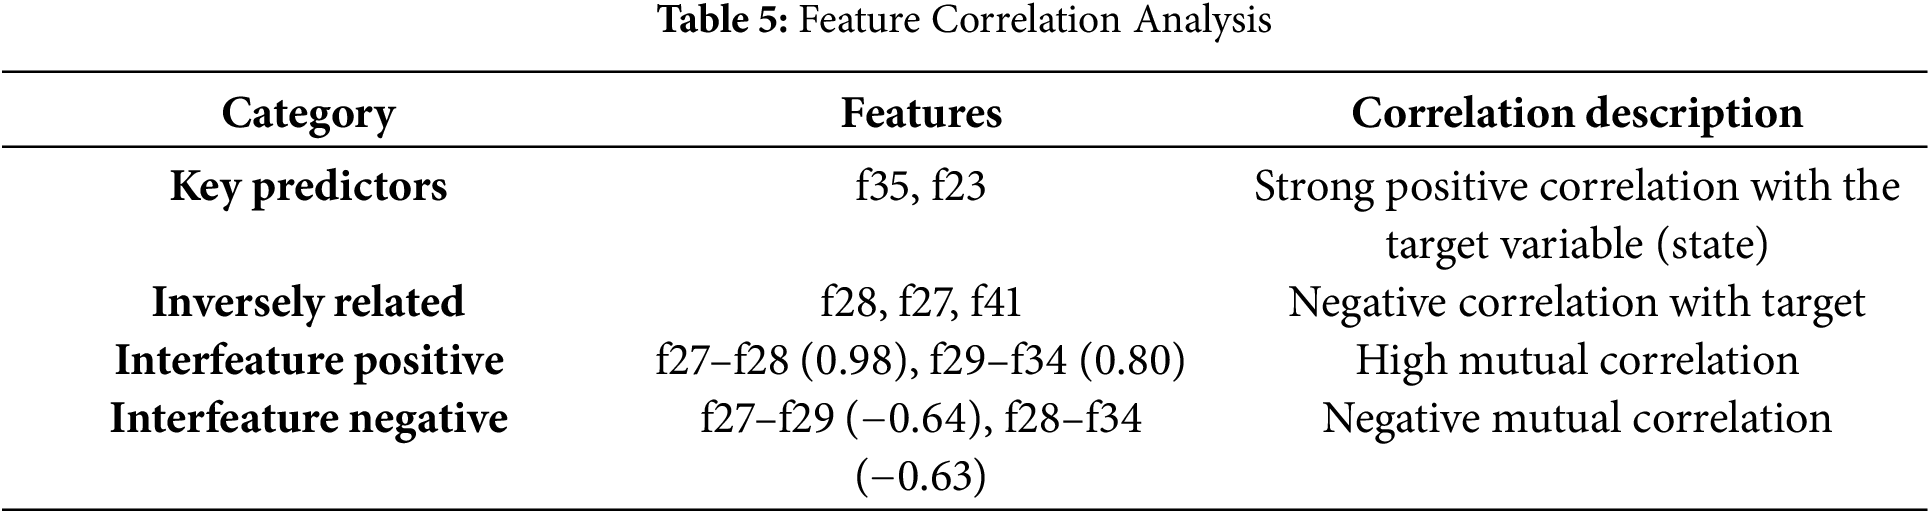
• Key Predictors: Features f35 and f23 demonstrated strong positive correlations with the target variable (state) and were found to be the most influential in predicting anomalies.
• Inversely Related Features: Features f28, f27, and f41 had negative correlations with the target, indicating an opposite behavioral trend.
• Interfeature Correlations: High interfeature correlations were observed between f27 and f28 (0.98) and between f29 and f34 (0.80), whereas negative correlations included f27 and f29 (−0.64) and f28 and f34 (−0.63).
This categorization provides a more interpretable basis for understanding the importance of feature relationships in the context of intrusion detection.
Among the analyzed features, f28, f27, and f41 were negatively correlated with the target variable (state), with correlation coefficients ranging from approximately −0.62 to −0.68. These inversely related features tend to exhibit higher values in anomalous network states and lower values in normal conditions, thus serving as potential negative indicators in anomaly detection. Categorizing them separately from positively correlated predictors (e.g., f35 and f23) supports more nuanced feature selection for the GNN-based model.
Fig. 2 represents the correlation matrix derived from the proposed method, highlighting key correlations with the state (f42) as positive, weak, and negative correlations.
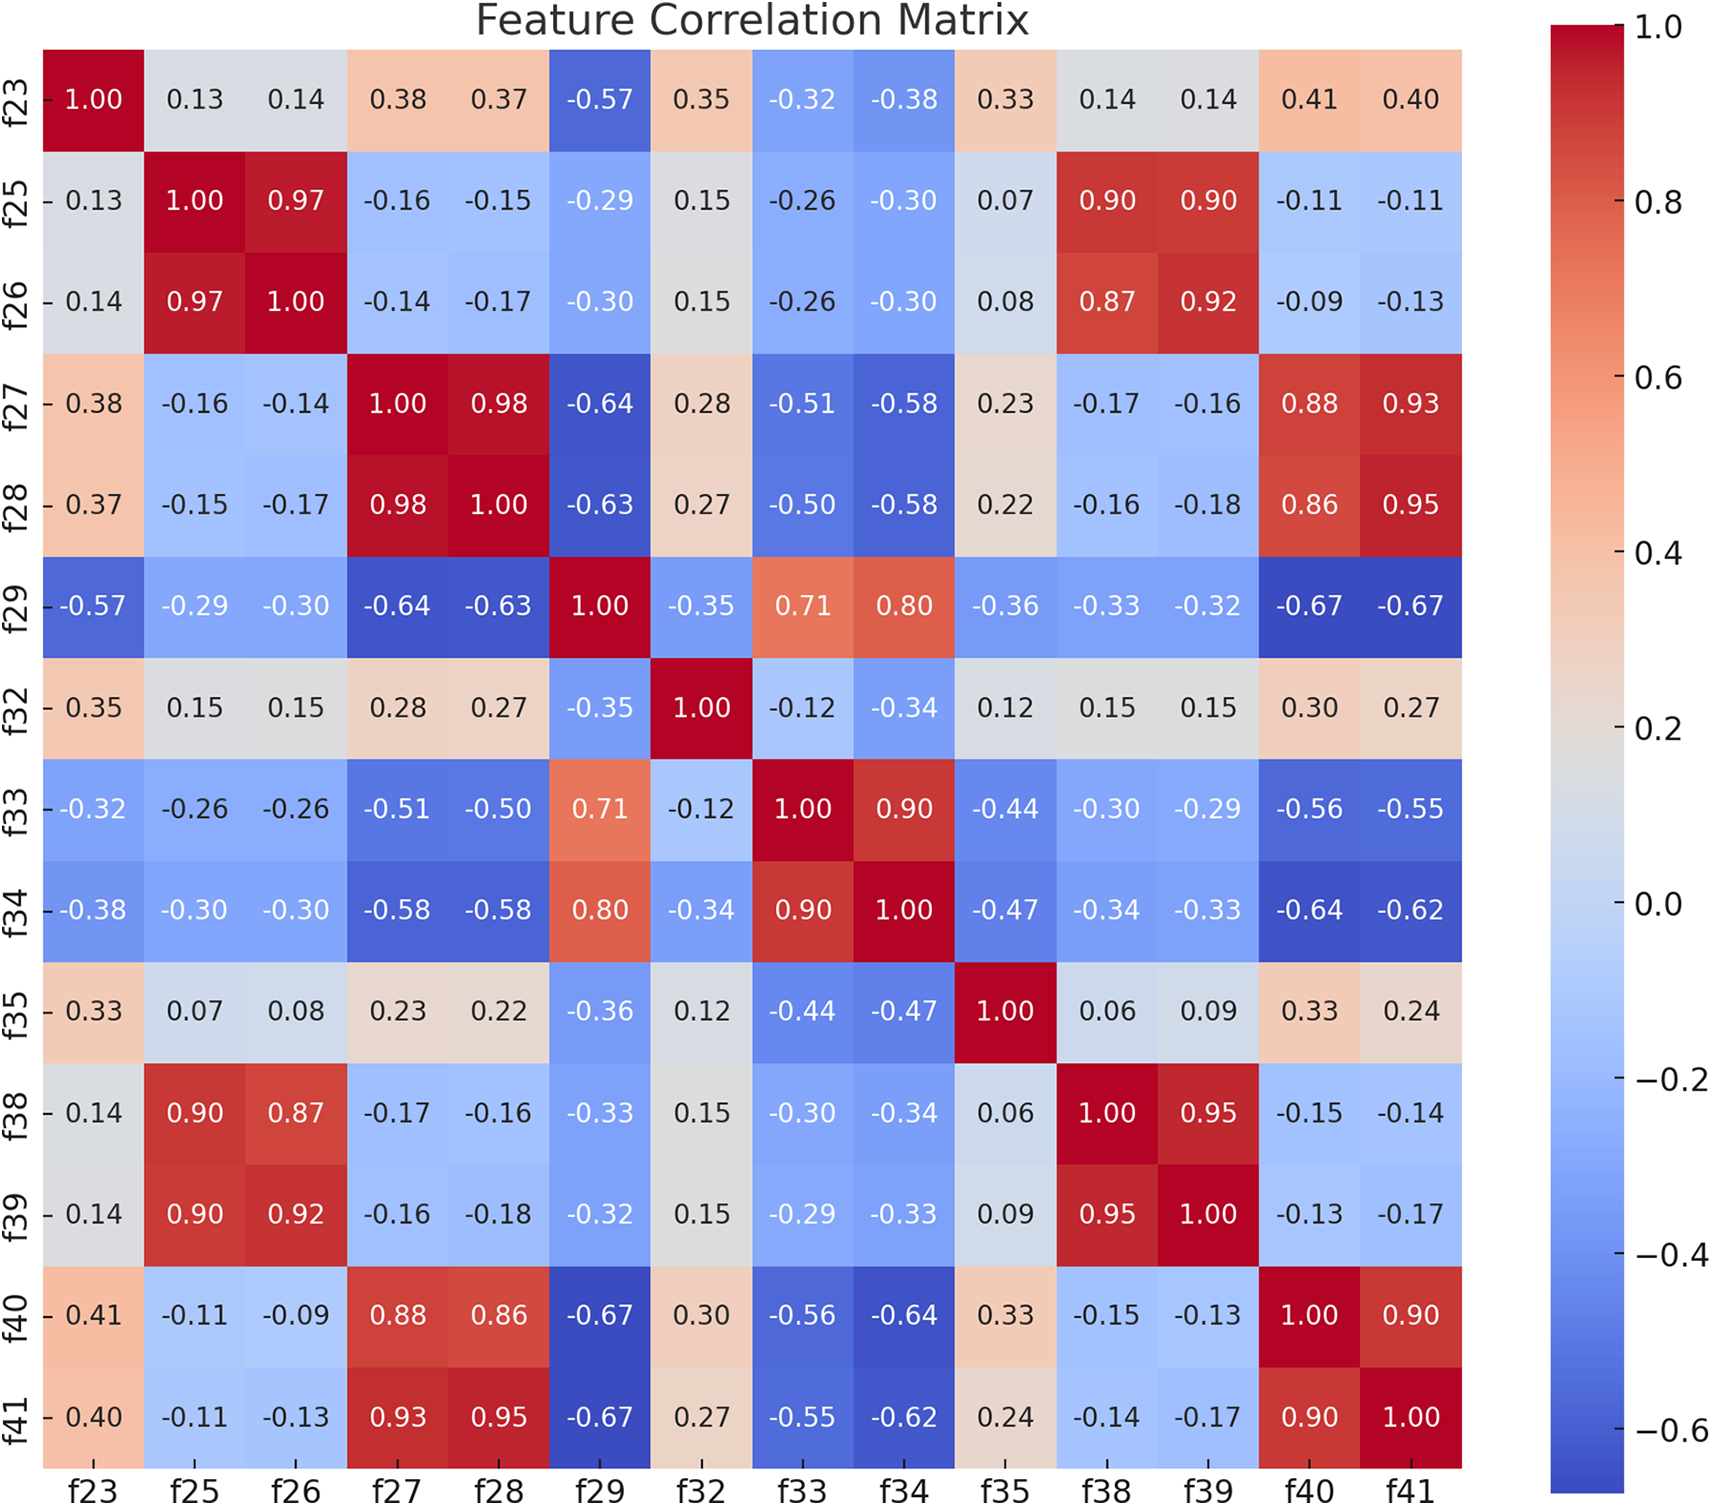
Figure 2: Feature correlation matrix
• Positive Correlation: Features f35 and f23 were positively associated with the state, with f35 exhibiting the highest correlation. This indicates that f35 is the feature most closely related to the state and plays a significant role in distinguishing between normal and anomalous features.
• Weak Correlation: Feature f29 has a value close to zero with respect to the state, indicating a very low level of association with the state.
• Negative Correlation: Features f28, f27, and f41 demonstrate negative correlations with the state, suggesting that these features may act in the opposite direction relative to the class label (state). These results imply that although f35 and f23 are likely crucial features for predicting the class label, f28 and f27 may exert opposing effects.
Additionally, this study analyzed the relationships among various numerical features through a correlation coefficient matrix, revealing several key insights. Features f27 and f28 showed a very high positive correlation of approximately 0.98, indicating that they likely represented similar information. Similarly, features f29 and f34 exhibited a strong positive correlation of approximately 0.80, indicating a close relationship. Features f25 and f26 also displayed a very high positive correlation (0.97), implying that they may contain virtually identical information. Similarly, features f40 and f41 demonstrated a strong positive correlation of approximately 0.90, confirming their strong association. Conversely, features f27 and f28 exhibited significant negative correlations with f29, f33, and f34, with values of −0.64, −0.64, and −0.63, respectively, indicating that these features may operate in opposite directions.
4.4 Gradient Boosting Analysis
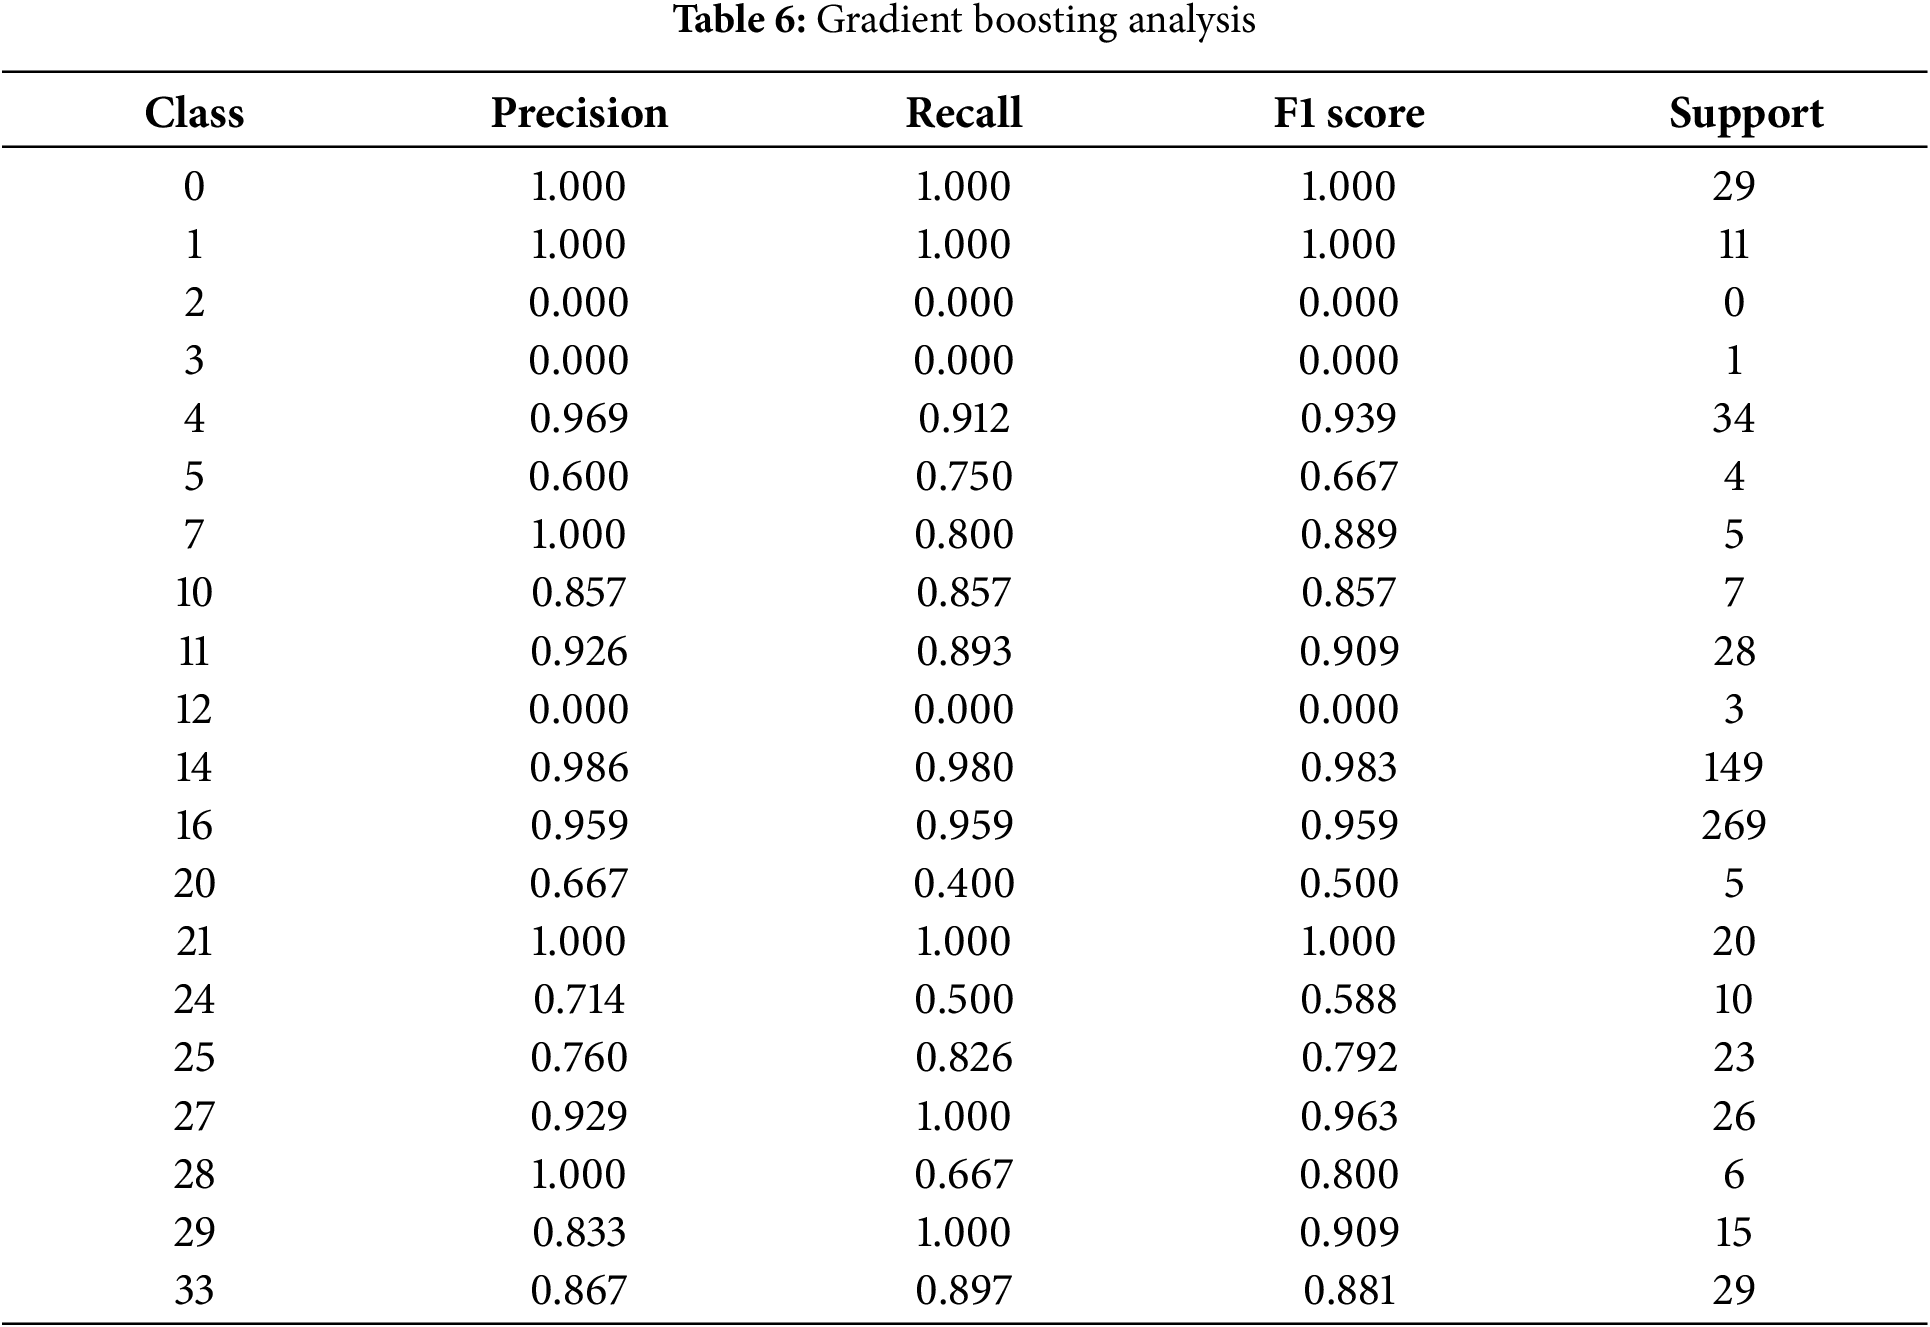
This study employed gradient boosting analysis for the overall analysis. Gradient boosting is a nonlinear model capable of effectively learning complex interactions within the data, offering high predictive performance. It is robust against missing values and noise, provides interpretability through feature importance, and can prevent overfitting through hyperparameter tuning. Additionally, it is suitable for large-scale data processing owing to its support for parallel processing and GPU acceleration. The analysis results show that the gradient boosting model achieved an overall accuracy of 93.35%. The details of the analysis are as follows.
4.4.1 Detailed Classification Indicators
Table 6 shows the F1 score, precision, recall, and support for each class.
4.4.2 Performance of Majority Classes
• Classes classified as majority classes, such as Classes 14 and 16, showed very high performance, with F1 scores of 0.983 and 0.959, respectively. This indicates that the model effectively learned these classes owing to sufficient training data provided by their dominance in the data distribution. The balance between high precision and recall in these classes indicates that the model not only accurately classified samples from the majority classes but also minimized missed detections.
• Performance of Minority Classes: Minority classes, such as Classes 2, 3, and 12, had an F1 score of 0, demonstrating that these classes either had very few samples or none at all, resulting in the model’s inability to learn or predict them. This shows that without addressing the class imbalance issue, the performance of minority classes can degrade significantly.
• Class Differences: Some classes, such as Classes 4, 11, and 27, were not majority classes but still demonstrated relatively high precision and recall. This suggests that these classes exhibit consistent patterns within the data, which the model successfully learned. Conversely, mid-sized classes, such as Classes 20 and 24, had F1 scores between 0.5 and 0.8, indicating suboptimal performance to some extent.
4.4.3 Performance of Majority Classes
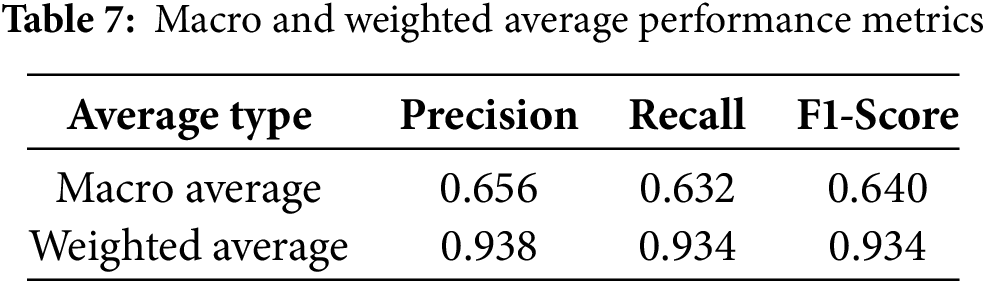
Table 7 presents the macro- and weighted average performance metric results. The macro average was calculated by equally weighting all classes, resulting in an F1 score of 0.640. This finding indicates that the poor performance on minority classes had a significant effect on the overall average. For example, classes with fewer samples, such as Classes 2, 3, and 12, contributed significantly to the reduction in the macro average owing to their very poor performance. By contrast, the weighted average was calculated by considering the sample size (support) of each class, and an F1 score of 0.934 was obtained. This reflected the very high performance of the majority classes (e.g., Classes 14 and 16), demonstrating that the model successfully learned the characteristics of the majority classes. In summary, the macro-average highlights the limitations of the model in handling minority classes, and the weighted average reflects its strengths in majority classes. This indicates the need for additional strategies to improve performance on minority classes. The macro-average equally reflects the performance of all classes, assessing the overall balance of the model. In this experiment, the macro average F1 score was 0.640, indicating that the poor performance of minority classes negatively impacted the model’s overall balance. This indicates that further improvements are needed to detect minority classes effectively (e.g., rare attack types) in a NIDS. Moreover, the weighted average considers the sample size of each class to evaluate the actual performance of the model. The weighted average F1 score in this study was very high, at 0.934, demonstrating that the model effectively learned and predicted majority classes (e.g., normal network traffic or frequent attack types). This highlights the model’s ability to detect and handle the patterns of the majority of traffic. Hence, leveraging GNN-based feature selection optimization has the potential to improve the detection performance for minority classes and enhance the macro average performance. This, in turn, proves the feasibility of addressing the class imbalance issue and strengthening the reliability and efficiency of the NIDS.
The acceleration of AI-driven digital transformation has made network infrastructures increasingly complex and critical, leading to more sophisticated cyber threats and network intrusions [20]. This study proposed a method to enhance the performance of NIDS through GNN-based feature-selection optimization. By modeling network traffic characteristics as a graph, this study successfully identified critical features that contribute to accurate intrusion detection, improving detection accuracy while reducing computational overhead. The analysis revealed that features f35 and f23 had strong positive correlations with the target variable, rendering them important predictors, whereas features f28, f27, and f41 presented negative correlations, indicating their opposing influence on the target variable. Additionally, positive correlations between f27 and f28, as well as f29 and f34, and negative correlations between f27 and f29, as well as f28 and f34, provided valuable insights into feature interactions and redundancies. The GNN-based approach demonstrated improvements in detecting minority classes and increasing the macro-average metrics, effectively addressing class imbalance issues and enhancing the overall balance and efficiency of the model. It achieved high performance in detecting majority classes and revealed the potential for further improvement in minority class detection, confirming the suitability of GNN-based optimization as a robust solution for NIDS. In conclusion, this study highlights that GNN-based methods can simultaneously achieve accuracy and efficiency in network intrusion detection. Such approaches are expected to contribute significantly to building reliable and resilient network infrastructures capable of adapting to the rapidly evolving landscape of cyber threats. Future research will focus on applying this method to real-time data environments and exploring its scalability to address more complex threat scenarios, ultimately enhancing its practical applicability in the field of network security. Although the proposed GNN-based approach improved minority class detection and macro-averaged F1-scores compared with traditional methods, further optimizations are still needed to maximize its effectiveness in highly imbalanced environments. Finally, compared with the correlation-based feature-selection method in [12], which achieves 99.36% accuracy, our GNN-based model provides slightly lower accuracy but offers significant improvements in computational efficiency and feature redundancy minimization. Moreover, compared with the PIO-based feature-selection approach [13], which achieved 91.3% accuracy, our model demonstrates superior overall detection performance while ensuring scalability for real-time applications.
Acknowledgement: Not applicable.
Funding Statement: The authors received no specific funding for this study.
Author Contributions: Hoon Ko: Writing & editing, Validation, Resources, Investigation; Marek R. Ogiela: Formal analysis, Data curation; Libor Mesicek: Methodology, Conceptualization. Sangheon Kim: Investigation, Validation. All authors reviewed the results and approved the final version of the manuscript.
Availability of Data and Materials: Not applicable.
Ethics Approval: Not applicable.
Conflicts of Interest: The authors declare no conflicts of interest to report regarding the present study.
References
1. Pazho AD, Noghre GA, Purkayastha AA, Vempati J, Martin O, Tabkhi H. A survey of graph-based deep learning for anomaly detection in distributed systems. IEEE Trans Knowl Data Eng. 2023;36(1):1–20. doi:10.1109/tkde.2023.3282898. [Google Scholar] [CrossRef]
2. Bronstein MM, Bruna J, LeCun Y, Szlam A, Vandergheynst P. Geometric deep learning: going beyond Euclidean data. IEEE Signal Process Mag. 2017;34(4):18–42. doi:10.1109/msp.2017.2693418. [Google Scholar] [CrossRef]
3. Le HD, Park M. Enhancing multi-class attack detection in graph neural network through feature rearrangement. Electronics. 2024;13(12):2404. doi:10.3390/electronics13122404. [Google Scholar] [CrossRef]
4. Wang S, Wang Z, Zhou T, Sun H, Yin X, Han D, et al. Threatrace: detecting and tracing host-based threats in node level through provenance graph learning. IEEE Trans Inform Forensic Secur. 2022;17:3972–87. doi:10.1109/tifs.2022.3208815. [Google Scholar] [CrossRef]
5. Linda O, Vollmer T, Manic M. Neural network based intrusion detection system for critical infrastructures. In: 2009 International Joint Conference on Neural Networks; 2009 Jun 14–19; Atlanta, GA, USA: IEEE; 2009. p. 1827–34. [Google Scholar]
6. Lansky J, Ali S, Mohammadi M, Majeed MK, Karim SHT, Rashidi S, et al. Deep learning-based intrusion detection systems: a systematic review. IEEE Access. 2021;9:101574–99. doi:10.1109/access.2021.3097247. [Google Scholar] [CrossRef]
7. Wu Y, Nie L, Xiong X, Sadoun B, Yang L, Ning Z. Incremental update intrusion detection for industry 5.0 security: a graph attention network-enabled approach. IEEE Trans Consum Electron. 2024;70(1):2004–17. doi:10.1109/tce.2023.3331907. [Google Scholar] [CrossRef]
8. Bilot T, El Madhoun N, Al Agha K, Zouaoui A. Graph neural networks for intrusion detection: a survey. IEEE Access. 2023;11:49114–39. doi:10.1109/access.2023.3275789. [Google Scholar] [CrossRef]
9. Wu Z, Pan S, Chen F, Long G, Zhang C, Yu PS. A comprehensive survey on graph neural networks. IEEE Trans Neural Netw Learn Syst. 2021;32(1):4–24. doi:10.1109/tnnls.2020.2978386. [Google Scholar] [PubMed] [CrossRef]
10. Ma X, Wu J, Xue S, Yang J, Zhou C, Sheng QZ, et al. A comprehensive survey on graph anomaly detection with deep learning. IEEE Trans Knowl Data Eng. 2023;35(12):12012–38. doi:10.1109/tkde.2021.3118815. [Google Scholar] [CrossRef]
11. Caville E, Lo WW, Layeghy S, Portmann M. Anomal-E: a self-supervised network intrusion detection system based on graph neural networks. Knowl-Based Syst. 2022;258:110030. doi:10.1016/j.knosys.2022.110030. [Google Scholar] [CrossRef]
12. Kim J, Moon Y, Ko H. Correlation-based advanced feature analysis for wireless sensor networks. J Supercomput. 2024;80(7):9812–28. doi:10.1007/s11227-023-05739-6. [Google Scholar] [CrossRef]
13. Kasongo SM, Sun Y. Performance analysis of intrusion detection systems using a feature-selection method on the UNSW-NB15 dataset. J Big Data. 2020;7(1):105. doi:10.1186/s40537-020-00379-6. [Google Scholar] [CrossRef]
14. Kunhare N, Tiwari R, Dhar J. Particle swarm optimization and feature selection for intrusion detection system. Sādhanā. 2020;45(1):109. doi:10.1007/s12046-020-1308-5. [Google Scholar] [CrossRef]
15. Li J, Othman MS, Chen H, Yusuf LM. Optimizing IoT intrusion detection system: feature selection versus feature extraction in machine learning. J Big Data. 2024;11(1):36. doi:10.1186/s40537-024-00892-y. [Google Scholar] [CrossRef]
16. Avila R, Khoury R, Pere C, Khanmohammadi K. Employing feature selection to improve the performance of intrusion detection systems. In: Foundations and practice of security. Cham: Springer International Publishing; 2022. p. 93–112. doi:10.1007/978-3-031-08147-7_7. [Google Scholar] [CrossRef]
17. Saheed YK, Misra S. CPS-IoT-PPDNN: a new explainable privacy preserving DNN for resilient anomaly detection in Cyber-Physical Systems-enabled IoT networks. Chaos Solit Fract. 2025;191:115939. doi:10.1016/j.chaos.2024.115939. [Google Scholar] [CrossRef]
18. Saheed YK, Chukwuere JE. Xaiensembletl-iov: a new explainable artificial intelligence ensemble transfer learning for zero-day botnet attack detection in the internet of vehicles. Res Eng. 2024;24(5):103171. doi:10.1016/j.rineng.2024.103171. [Google Scholar] [CrossRef]
19. Ko H, Praca I, Choi SG. Anomaly detection analysis based on correlation of features in graph neural network. Multimed Tools Appl. 2024;83(9):25487–501. doi:10.1007/s11042-023-15635-z. [Google Scholar] [CrossRef]
20. Ogiela MR, Ogiela L, Ogiela U. Biometric methods for advanced strategic data sharing protocols. In: 2015 9th International Conference on Innovative Mobile and Internet Services in Ubiquitous Computing; 2015 Jul 8–10; Santa Catarina, Brazil: IEEE; 2015. p. 179–83. [Google Scholar]
Cite This Article
 Copyright © 2025 The Author(s). Published by Tech Science Press.
This work is licensed under a Creative Commons Attribution 4.0 International License , which permits unrestricted use, distribution, and reproduction in any medium, provided the original work is properly cited.
 Downloads
 Citation Tools