
 Submit a Paper
 Propose a Special lssue
 Open Access
ARTICLE
DH-LDA: A Deeply Hidden Load Data Attack on Electricity Market of Smart Grid
1 Electric Power Dispatching and Control Center, Guizhou Power Grid Co., Ltd., Guiyang, 550002, China
2 State Key Laboratory of Public Big Data, College of Computer Science and Technology, Guizhou University, Guiyang, 550025, China
* Corresponding Author: Zhenyong Zhang. Email:
Computers, Materials & Continua 2025, 85(2), 3861-3877. https://doi.org/10.32604/cmc.2025.066097
Received 29 March 2025; Accepted 23 July 2025; Issue published 23 September 2025
 View Full Text
 Download PDF
Abstract
The load profile is a key characteristic of the power grid and lies at the basis for the power flow control and generation scheduling. However, due to the wide adoption of internet-of-things (IoT)-based metering infrastructure, the cyber vulnerability of load meters has attracted the adversary’s great attention. In this paper, we investigate the vulnerability of manipulating the nodal prices by injecting false load data into the meter measurements. By taking advantage of the changing properties of real-world load profile, we propose a deeply hidden load data attack (i.e., DH-LDA) that can evade bad data detection, clustering-based detection, and price anomaly detection. The main contributions of this work are as follows: (i) We design a stealthy attack framework that exploits historical load patterns to generate load data with minimal statistical deviation from normal measurements, thereby maximizing concealment; (ii) We identify the optimal time window for data injection to ensure that the altered nodal prices follow natural fluctuations, enhancing the undetectability of the attack in real-time market operations; (iii) We develop a resilience evaluation metric and formulate an optimization-based approach to quantify the electricity market’s robustness against DH-LDAs. Our experiments show that the adversary can gain profits from the electricity market while remaining undetected.Keywords
The smart grid serves as a pivotal driver of economic advancement, facilitating cost reductions through the harmonized scheduling of diverse energy sources, including wind, solar, and coal-fired power generation [1]. The electricity market is structured to optimize economic efficiency by enabling transactions among generators, consumers, and other market participants [2]. Precise price signals guide consumers in modifying their consumption habits, thereby contributing to the reduction of energy supply costs. The Local Marginal Price (LMP) is an important metric in the electricity market [3], defined as the incremental cost of producing an additional unit of power. In major electricity markets worldwide, such as the New York Independent System Operator (NYISO), the PJM Interconnection (PJM), and the Unified Electricity Market of China, pricing mechanisms commonly incorporate generation costs, transmission congestion costs, and line-loss costs, which are determined through advanced metering infrastructure that collects data on power injection, power flow, and load. By leveraging historical load data and sophisticated forecasting methodologies [4], the market anticipates electricity demand for the following day and provides a forward market quote. This process ensures that a substantial portion of the anticipated demand is met under an economic generation portfolio for the next day. However, the ease with which load measurements can be tampered with presents an opportunity for malicious actors to manipulate LMPs, enabling them to profit from the market [5]. Data integrity attacks have emerged as a prominent research focus due to their capacity to disrupt grid operations and engender perilous outcomes. Flaws within hardware, software, and communication protocols render load data susceptible to malicious compromise [6].
As early as 2009, research [7] first brought cybersecurity concerns in electricity markets to the forefront, aiming to systematically model the potential impact of network assaults on the functionality of electricity markets. With the introduction of the stealthy network attack known as false data injection attacks (FDIAs) in 2010, authors in [8] and [9] illustrated how attack vectors could be introduced into the power system to capitalize on the electricity market. This line of inquiry has since evolved into a burgeoning field of study. The efficacy of the attack was substantiated by the quantification of illicit profits accrued in the electricity market, as reported in [10]. An optimization problem for constructing attack vectors was formulated to maximize economic returns while circumventing the power system’s bad data detector (BDD), as detailed in [11]. Authors in [12] targeted the security-constrained economic dispatch (SCED) in the power system by manipulating the actual load to escalate the costs for generation enterprises. If an attacker successfully compromised the memory of a measurement device, they could manipulate power demand, leading to an imbalance between supply and demand. An innovative approach was devised to perpetrate FDIAs in the electricity market, capitalizing on advance scheduling in the real-time market to secure financial gains, as described in [13]. The above research indicates that an increasing number of researchers focus on the cybersecurity of the electricity market.
However, attackers need to have a large amount of power grid information to successfully implement FDIA, and obtaining power system information is difficult and cumbersome. Therefore, based on the idea of FDIA, Yuan et al. [12] were the first to put forward a stealthy attack targeting BDD, specifically the load redistribution attack (LRA). This attack is carried out by coordinating the modification of load measurements, it is easier to implement. Xiang et al. [14] proposed a coordinated attack that combines LRA and switching attacks, thus, misleading the power dispatching and putting the power system in a vulnerable operating state. Zhang et al. [15] proposed LRA against the direct current (DC) grid, which can cause the operator to schedule incorrect instructions, thus damaging the operation of the smart grid. By injecting false data into meter readings, attackers can orchestrate local load redistribution [16]. In [17], the authors conducted load redistribution attacks (LRAs) using phase-shifting devices and assessed the impact of this attack on the optimal power flow. Due to its consistency with the physical laws of the power system, LRAs possess a high level of stealthiness, allowing them to evade detection by BDD successfully.
Unfortunately, with the development of machine learning techniques, machine learning-based detectors have exhibited notable efficacy in identifying FDIAs. Although coordinated FDIA and LRAs can bypass traditional BDDs, they are susceptible to detection by clustering-based methods like distance-based principal component analysis [18]. Esmalifalak et al. [19] pioneered the use of principal component analysis to segregate false data from normal measurement data. Their subsequent work [20] delved into various machine learning methods, including K-Nearest Neighbor, Support Vector Machines, and Neural Networks, achieving satisfied accuracy in detecting LRAs. Pinceti et al. [21] leveraged the Support Vector Machine and extracted the attack deviation based on historical measurements. Besides, Khaleghi et al. [22] emphasized the importance of accurate load pattern prediction using Support Vector Regression, followed by Support Vector Machine-based attack detection. To counter this, the Dummy Data Attack (DDA) was designed to circumvent these clustering-based detectors [23] by stealthy compromised data within normal measurements. In 2019, Liu et al. [24] proposed the dummy data attack by minimizing the distance between malicious data and normal historical measurements, allowing the malicious data to masquerade as normal data and thus enhancing the stealthiness of the attack.
Although DDA can evade detection by BDD and clustering-based methods, it can still be easily detected in the electricity market scenario due to the abnormal nodal prices changes caused by it. This is because the load profile displays periodic patterns. If load measurements are altered to be inconspicuous during the afternoon, the attack can be readily detected [25]. Moreover, the periodic nature of the load profile engenders strong regularity in nodal prices. If an attack is conducted at an inopportune time, the resulting abnormal price fluctuations may reveal the presence of malicious activities.
To our knowledge, the stealthy attack has not yet been deeply investigated in the scenario of the electricity market. In this paper, we propose a deeply hidden load data injection attack (DH-LDA) to reveal the vulnerability of the electricity market with manipulated load measurements. As shown in Fig. 1, attackers can construct covert attacks against load measurement, tamper with nodal prices, and profit from the electricity market. This attack can simultaneously avoid BDD, clustering-based methods, and price anomaly detection. The main contributions of this paper are summarized in four folds:

Figure 1: Attacker attack and profit flowchart
• We analyze the vulnerability of the electricity market against the load data injection attack. We propose a DH-LDA that can bypass BDD, clustering-based detection, and price-abnormality detection.
• We analyze the optimal time window for injecting the load data to avoid the detection caused by the sudden change. This design can guarantee that the modified nodal price aligns with the natural fluctuation of the normal nodal price.
• To assess the power system’s vulnerability, we propose an optimization problem to evaluate the resilience of the electricity market against DH-LDAs.
• We conduct extensive simulations to evaluate the performance of the DH-LDA and its countermeasure.
The rest of this paper is organized as follows. In Section 2, we analyzed the relationship between nodal prices and power flow distribution. Section 3 presents the mathematical model for the deeply hidden load attack scheme. Section 4 introduces the electricity market resilience against DH-LDAs. Section 5 validates the effectiveness of this attack through experiments. Section 6 concludes this paper.
2 Electricity Market Price Model
The nodal price, also known as the Locational Marginal Price [26–28], is a key pricing indicator in the operation and planning of electricity markets, used to determine the prices at different buses in the power system and to manage congestion in the transmission network. The nodal electricity price mechanism is widely used worldwide by independent system operators such as PJM, New York, and New England. In China, the Guangdong electricity trading market also adopts this mechanism.
The LMP is composed of three parts: energy costs, congestion costs, and loss costs [29], as shown in Eq. (1). Energy costs represent the generation costs for power producers, including the cost of fuel, as well as the operation and maintenance costs of power plants. This ensures that the generation unit with the lowest cost is given priority in supply, thereby optimizing the overall energy cost. Congestion costs come into play when there is congestion in the transmission network and can effectively reflect price differences between different buses. Higher congestion prices incentivize market participants to find alternative transmission paths or adjust their power transactions, thus alleviating line congestion. Loss costs encourage grid operators to take measures to reduce network losses, such as optimizing the operation and dispatch of transmission lines, to improve transmission efficiency. The LMP can be defined as
The calculation of LMP is achieved through optimal power flow solutions. Due to the high demand for real-time performance in real-time markets, incremental linear programming models based on direct current optimal power flow (DCOPF) are often used. Currently, DCOPF is widely adopted by many industrial LMP simulators, such as ABB’s GridView, GE’s MAPS, Siemens’ Promod IV, and PowerWorld, for price forecasting and system planning. The next will introduce the mathematical model of nodal prices.
A deregulated electricity market consists of the day-ahead market and the real-time market. They use the same generator bidding, with the main difference being that one is clearing based on forecast or planned load while the other is clearing based on actual load. The real-time market is a spot market with a shorter time horizon, such as every 5 or 15 min. As a critical indicator in the electricity market, LMP calculation can be formulated with the SCED. Assume that each bus has one generator and one load for easy description. Then, we have
where
where
The branch-bus shift factor matrix is given by
Considering the DC power flow, we can obtain the power flow
Eq. (6) represents the relationship between bus-injected active power and the power flow on transmission lines.
The nodal price (i.e., LMP) is a fundamental concept in the electricity market and plays a crucial role in optimizing the allocation of generations and managing congestion. To solve the SCED problem (2), a dual problem is designed as
where
In general, the power generations do not exceed the upper and lower bounds, which means
Substituting Eq. (13) into Eq. (7), we have
According to Eq. (1), we can see that the LMP consists of generation costs, transmission-congestion costs, and loss costs. Due to the exclusion of loss costs from our research scope, under the assumption of ignoring loss costs, the LMPs are as shown in Eq. (14). The multiplier
where
From the forgoing analysis, the attack aims to eliminate the transmission-line congestion to tamper with nodal prices. Therefore, the transmission-line congestion sets are defined. The set PC is the positive congestion set, which is designed as
and the set NC is the negative congestion set
To eliminate the transmission-line congestion, if line
3 Deeply Hidden Load Data Attack
Here we introduce the deeply hidden load data injection attack. Based on the discussion in Section 2, the Eq. (14) indicates that, in the absence of transmission-line losses, the nodal price is derived from the generation and congestion costs. The generation cost depends on the total load of the system, which is difficult to predict but is equal at all buses in the system. The marginal generation cost equals the Lagrange multiplier
A hidden LDA has the capability of bypassing the BDD. In our context, the injected load error should maintain the power balance. Meanwhile, the distribution of power flow should be consistent with Kirchhoff’s law. Therefore, we have
where
When the malicious data meets the aforementioned conditions, the tampered measurements will be able to pass the BDD smoothly. However, when the detection mechanism considers comparing historical measurements with the compromised data, the compromised data will exhibit features that deviate from normal measurements. To enhance the hiddenness, we consider the variation characteristic of load profiles. We analyze the variation in load from the real-world load data of New York State1. We can see that the electricity consumption is lowest in the early morning and reaches the peak in the evening.
To ensure that the manipulated measurements are close to the normal, the Euclidean distance is usually used to measure the distance, which is denoted by
where
The attack scheme requires that the malicious measurements satisfy the following optimization objective
where
Besides, the temporal characteristic of the load profile should be considered. To be stealthy, the injected error of the load meter is generated by limiting its distance from historical measurements on different time slots. Then, the weight
where
where
Considering that the objective function (26) is a nonlinear optimization problem, and the distance metric for the attack data does not require high precision, the
Furthermore, let
By making the above transformation, we have transformed the nonlinear optimization problem into a linear optimization problem, which can be solved using a solver such as Gurobi. Finally, we can obtain the smart meters that can be tampered with and the corresponding load error.
Considering the periodic variation of the load profile, the LMPs also show a certain regularity within a day. The nodal price in a day is shown in Fig. 2. We can see that the nodal prices do not change suddenly under normal conditions. Therefore, the attacker also needs to observe the best time to launch the attack to avoid being detected due to the abnormality. According to our observation, the load profile returns to the bottom at midnight which eliminates the congestion. During this period, the prices of all buses remain the same. The best attack time window is before this period. We can force all nodal prices to be consistent after the attack time. That is, the best time to launch the DH-LDA is to make all nodal prices identical before the load reaches the bottom level.
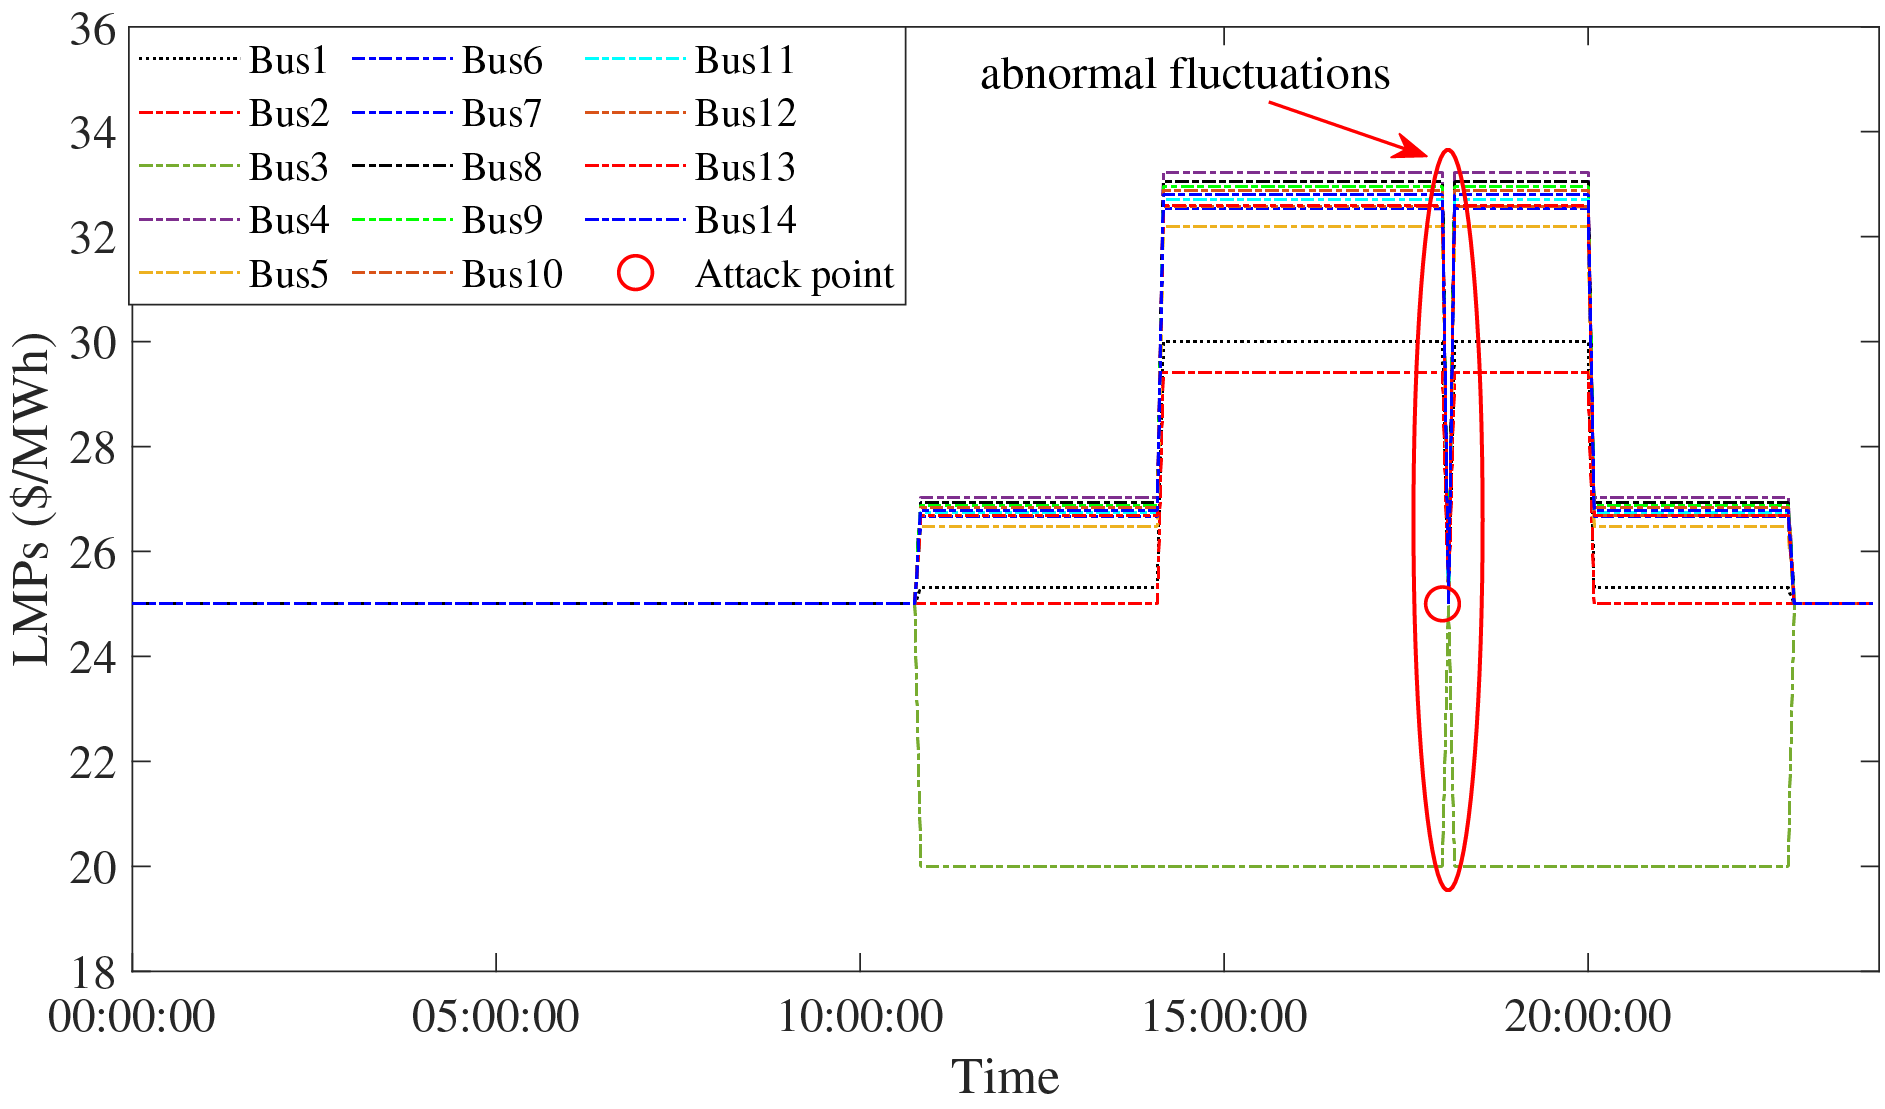
Figure 2: The LMPs are changed dramatically under a random attack (at 18:00:00, LMPs of all buses suddenly changed to 25$ due to the attack.), which shows a potentially malicious activity
By utilizing the DH-LDA, the attackers can generate deeply hidden malicious load data. Then, they can make profits from the electricity market by executing the following operational process. The specific attack process is shown in Fig. 3.
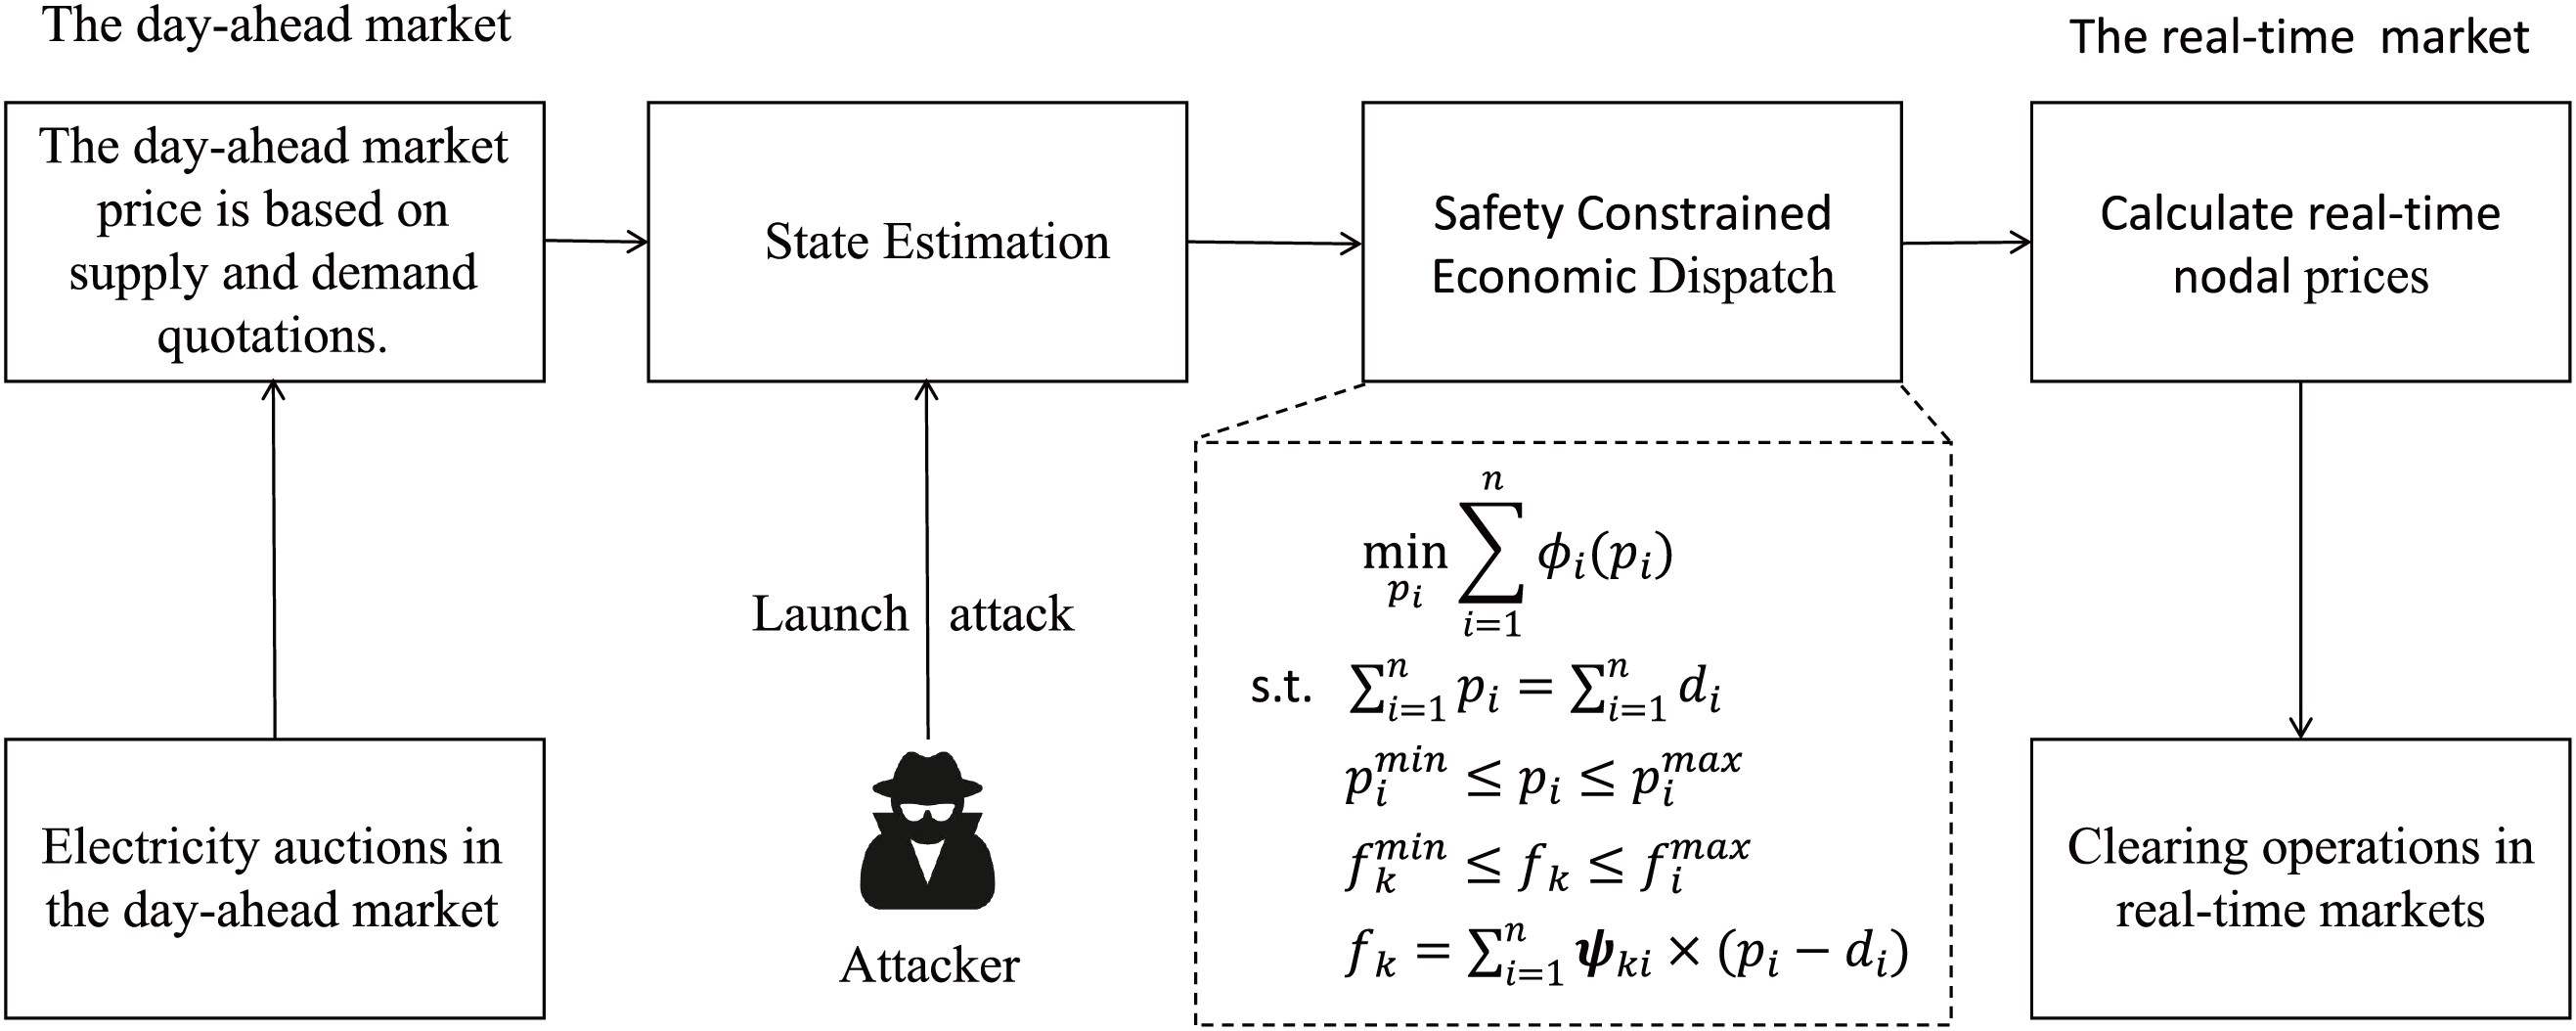
Figure 3: The data injection attack process for nodal electricity prices
• Step 1: In the day-ahead market, the attacker is engaged in the electricity trading between any two buses based on the day-ahead prices published by the market. They purchase electricity at the bus at a lower price, incurring a cost
• Step 2: In the real-time market, the attacker launches the cyberattack to infiltrate the smart meter and tamper with the sensor measurements.
• Step 3: The attacker calculates the attack vector based on the proposed DH-LDA and injects it into the smart meters.
• Step 4: At the agreed-upon trading time, the real-time market clears the electricity auction. The attacker sells electricity at the bus where they were originally supposed to buy, gaining a profit
4 Resilience of the Electricity Market against DH-LDAs
In this section, we propose a countermeasure to mitigate the impact of DH-LDA. Although data-driven detection methods have gained prominence in attack detection by utilizing extensive data to extract correlations of the high-dimension power data, the DH-LDA has the capability of manipulating the load measurements to hide in the normal measurements, without being detected. Therefore, we consider the resilience of the electricity market against DH-LDAs. The resilience quantifies the load manipulation that induces the change in the bus price. Besides, we examine the difficulty of launching DH-LDAs in different power systems.
The DH-LDA affects LMPs by embedding attack vectors into smart meters. The core strategy behind this attack is to eliminate transmission-line congestion, thereby altering nodal prices. Under the assumption of ignoring losses cost, the LMP comprises the energy cost
where
To manipulate LMPs, the attacker must eliminate the transmission-line congestion. Consequently, the injected load error must induce a variation in the power flow across the lines, that is
To cause a variation
Considering the distance metric in the context of DH-LDA, let
where
The resilience of the electricity market is defined as its ability to defend against DH-LDA. When the load measurements are modified within a certain range, the transmission-line congestion cannot be eliminated. A larger range indicates a stronger ability of the electricity market to defend against DH-LDAs. Let
To determine the electricity market resilience, we construct the following optimization problem
where
In this section, we conduct extensive simulations to evaluate the attack schema and the electricity market resilience against DH-LDAs.
5.1 Evaluation of the Attack Impact
The DH-LDA is evaluated using the real-world load data from NYISO2. We consider different regions in NYISO as the buses and simplify the power system as an IEEE 14-bus system, which includes 14 buses and 20 transmission lines, with 5 generator units and 11 load buses. In terms of data preprocessing, due to the use of real load data from New York, there are no missing values in the actual dataset obtained. But in order to make the research more universal, if other datasets with possible missing values are used in the future, we will adopt the following solution: for a small number of missing values, interpolation methods such as linear interpolation or spline interpolation will be used to estimate the missing values based on the values of adjacent points.
The objective function of SCED is
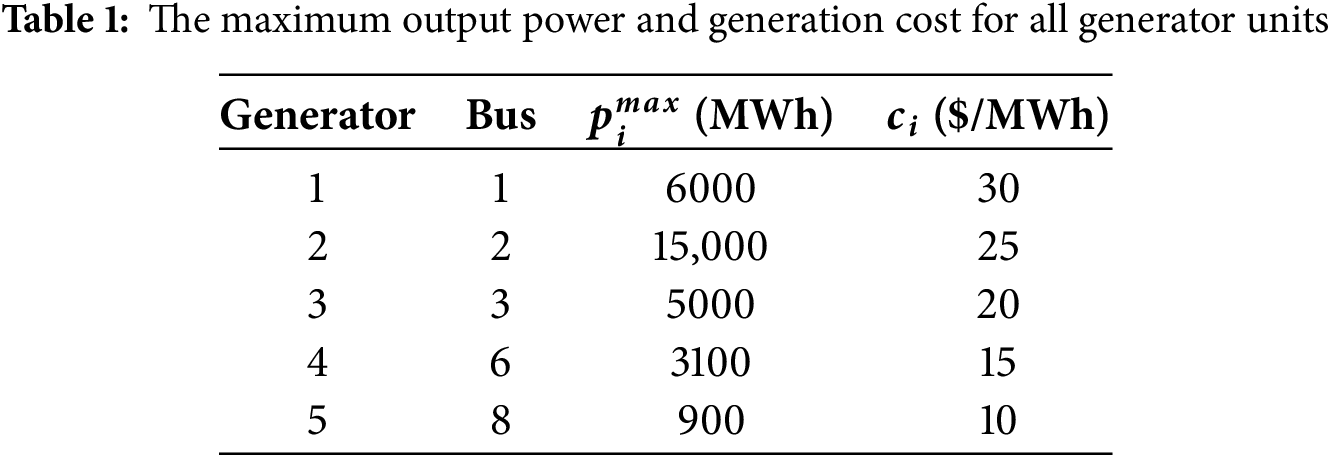
Based on the load profiles collected every 5 min, we calculate the LMPs for each bus. The results at 22:45:00 are shown in Table 2. The output power of the generating unit and the power flow of the transmission line are shown in Fig. 4. Due to the transmission-line limitations, the cheaper generation unit (bus 3, 20 $/MWh) is unable to generate the power at its maximum capacity (5000 MW). Instead, the generation is supplemented by the generator located at bus 2 (25 $/MWh). Therefore, it results in the transmission-line congestion cost, causing different LMPs of buses.

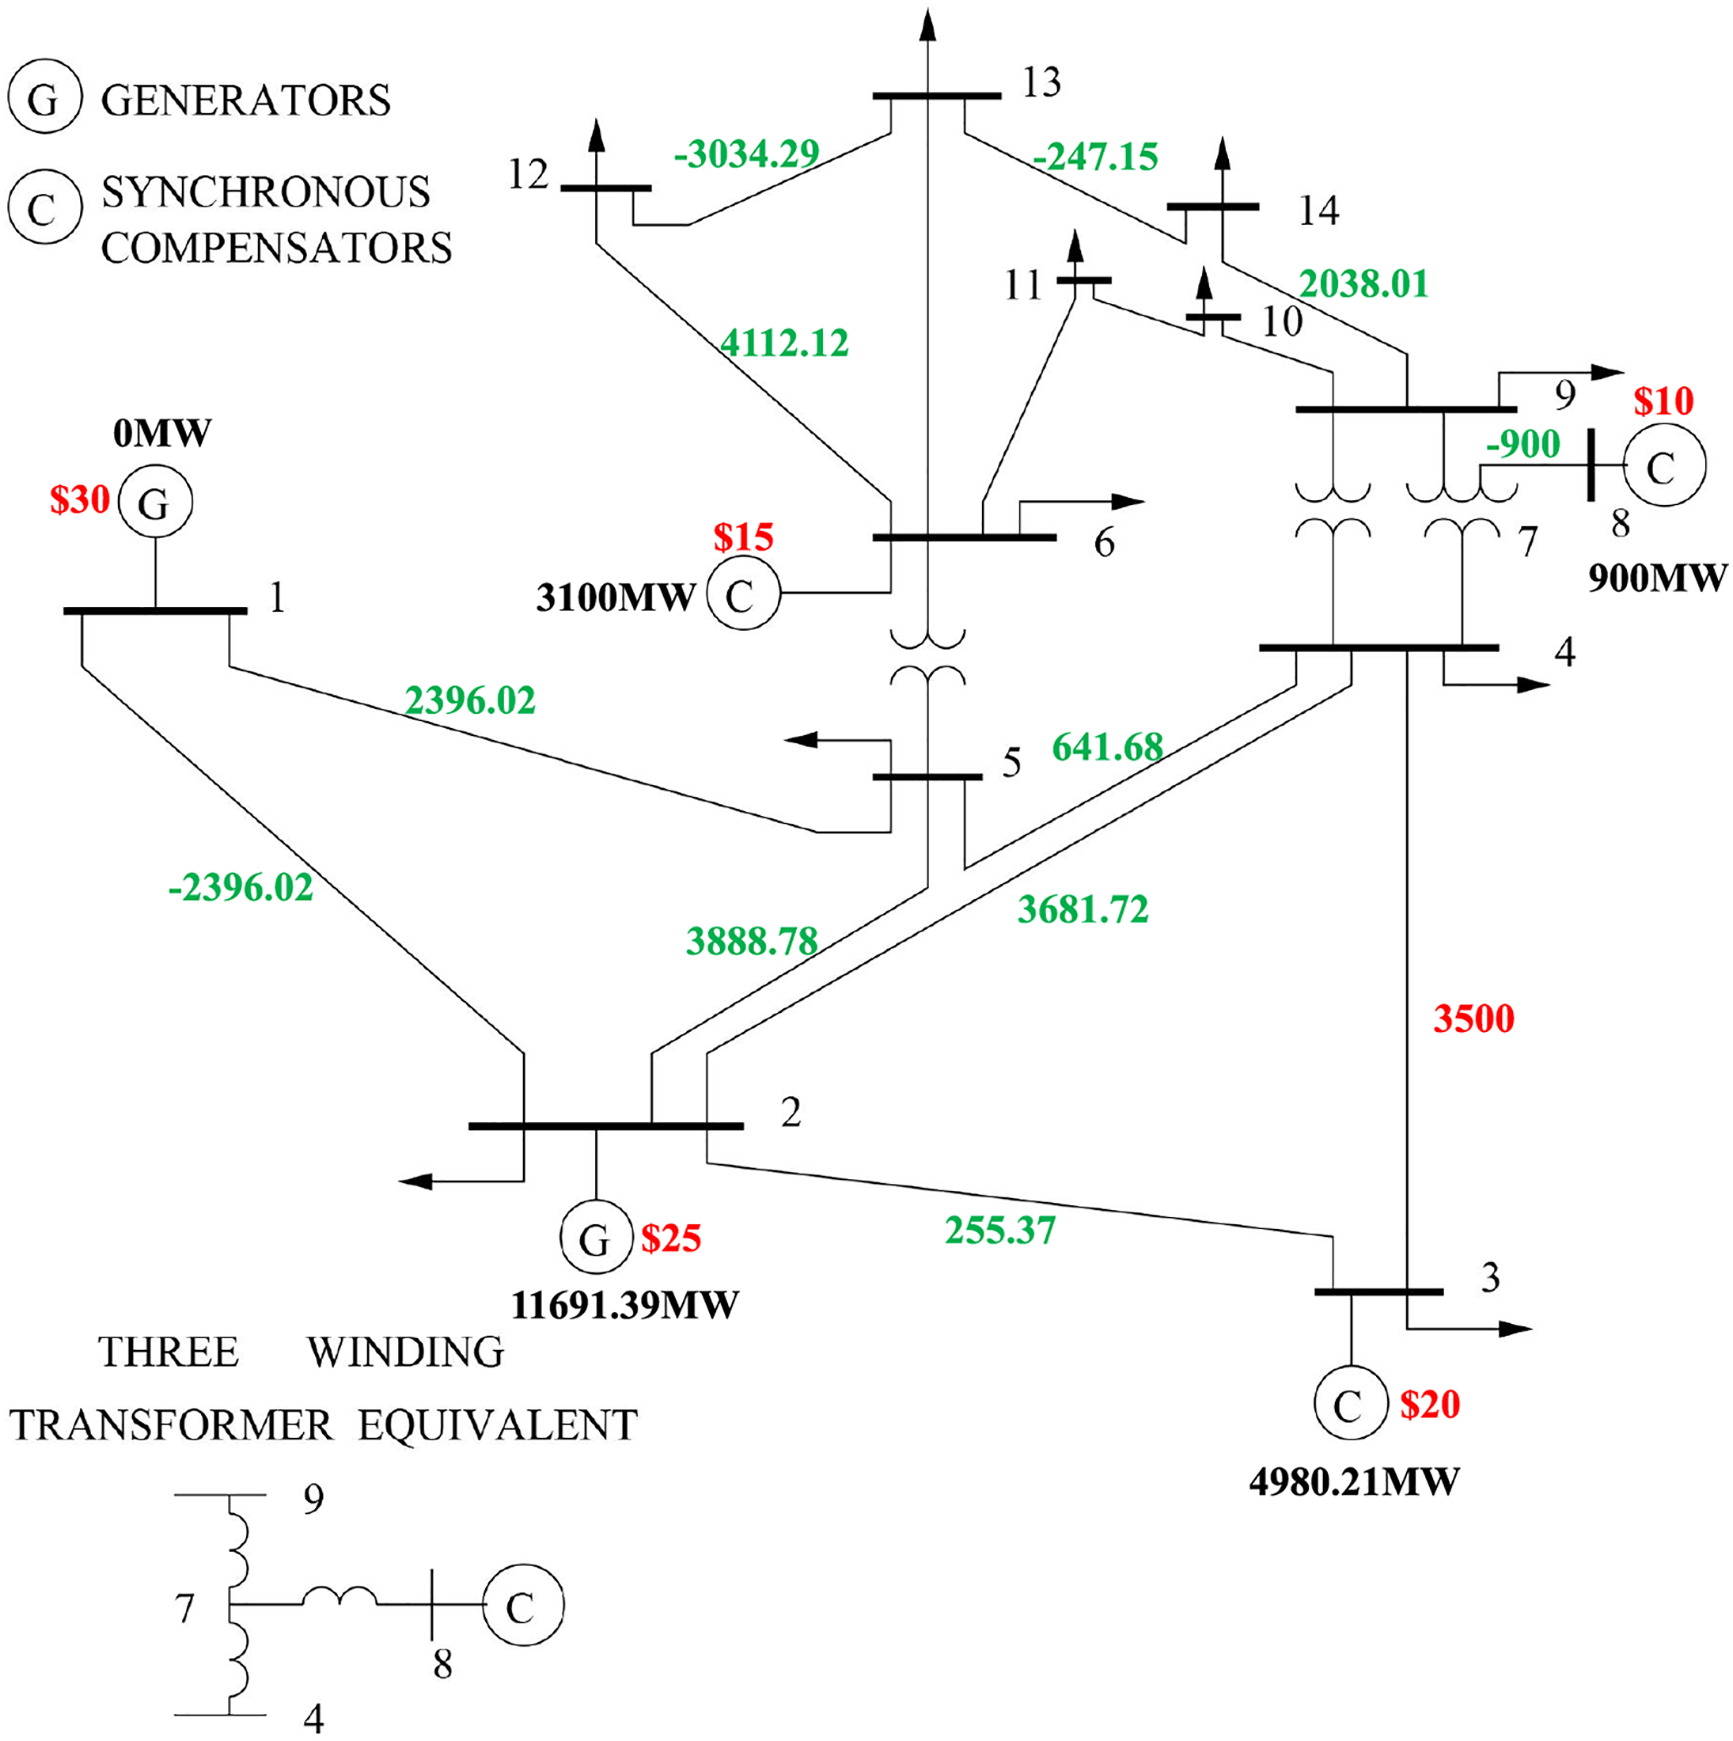
Figure 4: The output power of generation units and power flows at 22:45:00
Before launching DH-LDAs, we need to choose an appropriate time window because the LMPs change in a periodic pattern, as shown in Fig. 5. The optimal attack time window should be selected at the time period when the nodal prices of all buses become consistent. Interestingly, these time periods occur when the loads decrease at midnight. The reduction of loads can eliminate the congestion cost. At these periods, all nodal prices are the same. Therefore, once the DH-LDA is launched, the change in nodal prices likes the normal case.
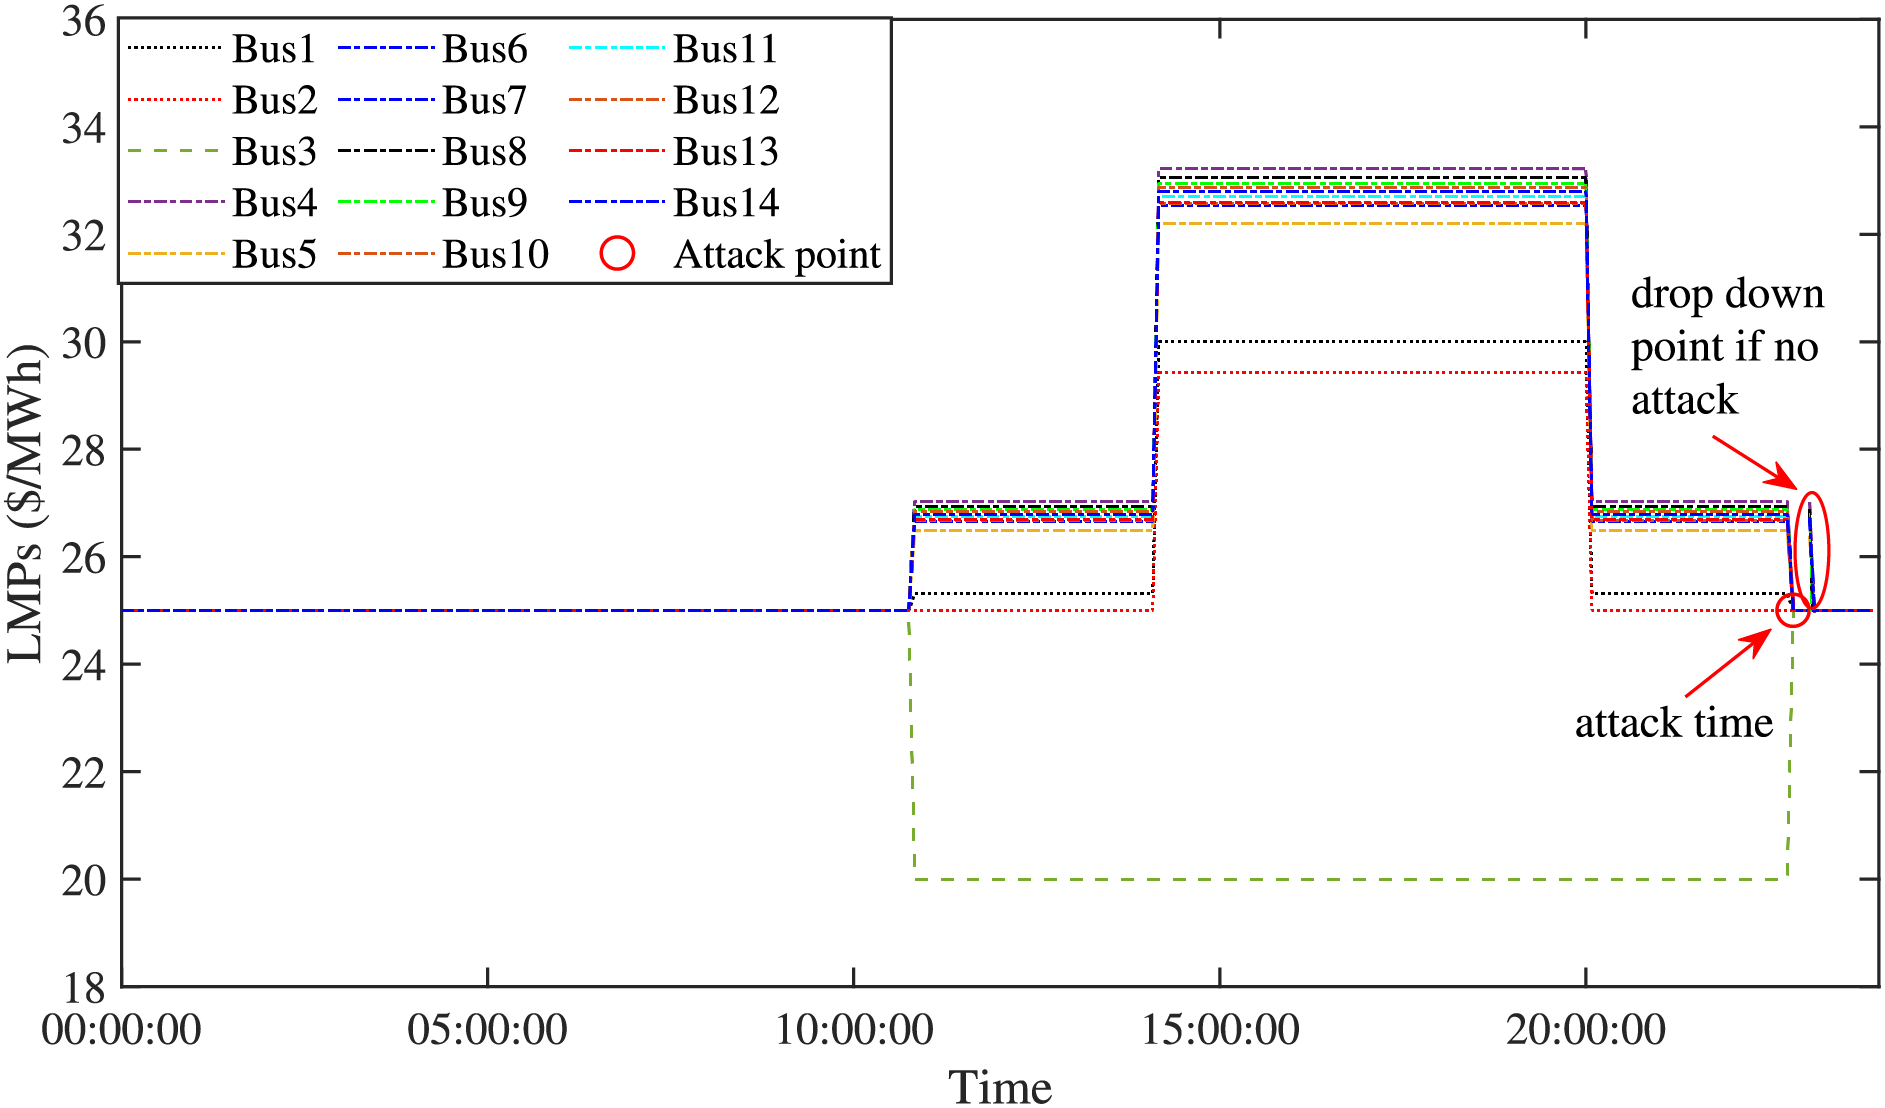
Figure 5: The LMPs under the DH-LDA
We observe the changes in LMPs after the launch of DH-LDA. The results are shown in Fig. 6. The adversary can obtain economic benefits due to the activation of high-cost generation units.
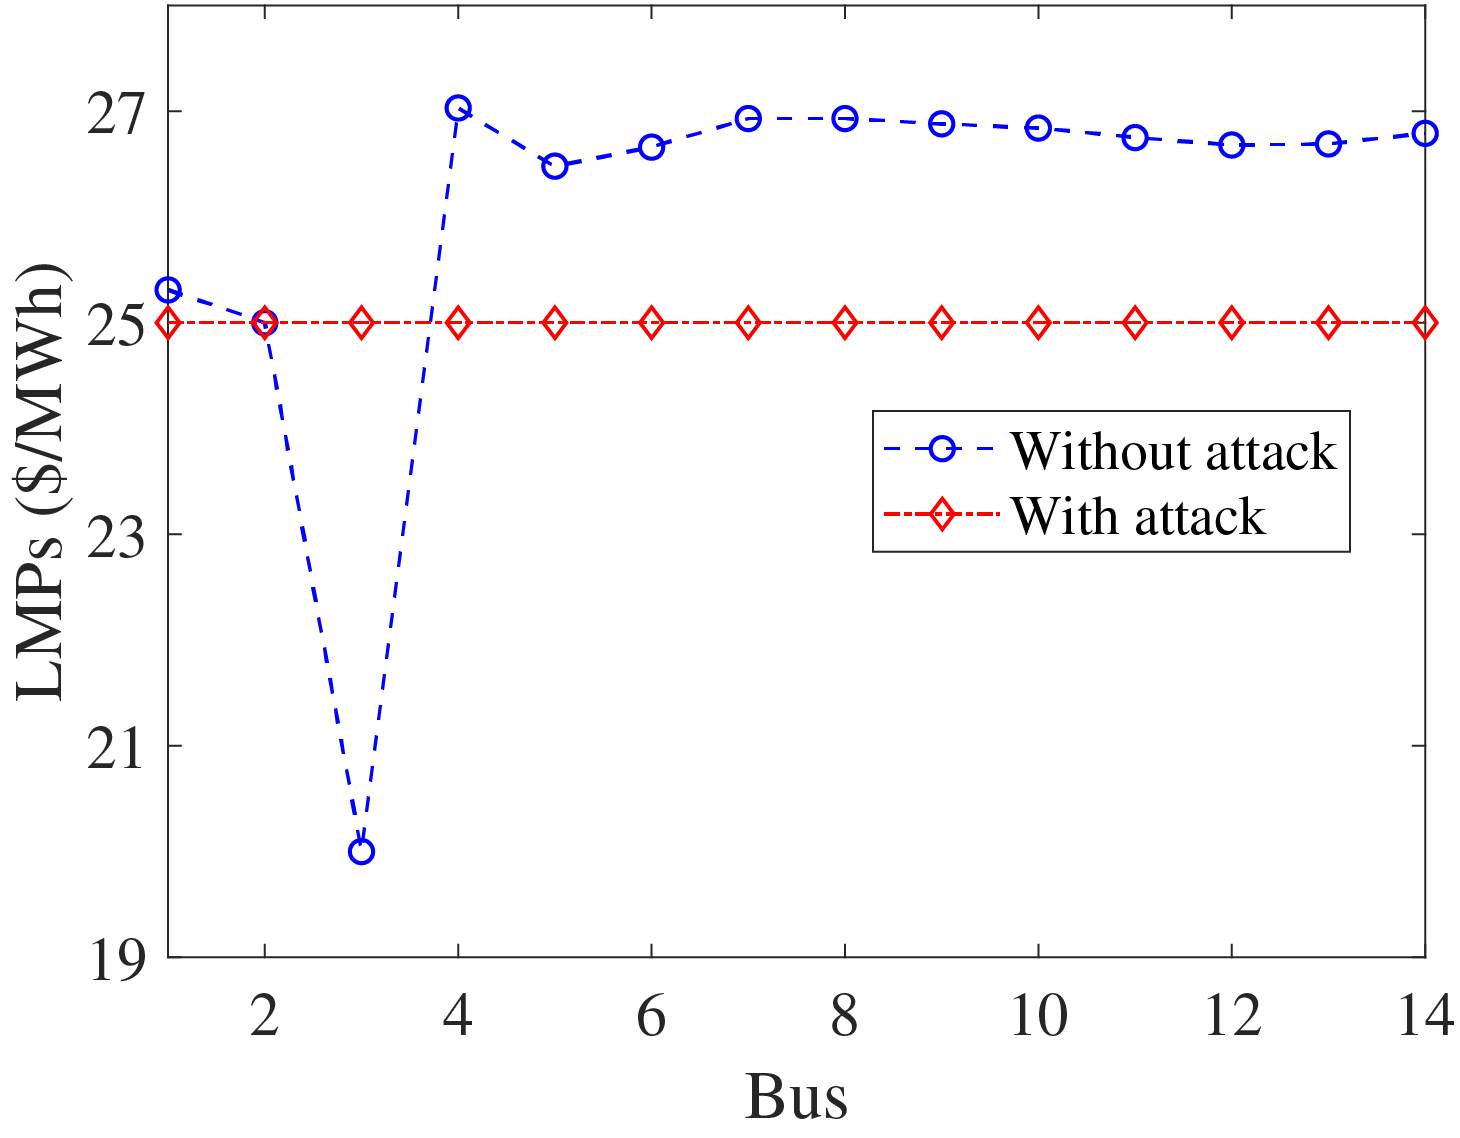
Figure 6: The LMPs with and without attack. By selecting the appropriate buses for electricity trading, the attacker can gain economic benefits from the electricity market
Next, we analyze the stealthiness of DH-LDA. The obtained residual from injecting the abnormal measurements is 0.003, which is smaller than the BDD threshold of 0.5. Furthermore, we evaluate the stealthiness with the principal component analysis and compare their differences through a visualization plot, as shown in Fig. 7. The DH-LDA is hidden within the normal historical measurements. More importantly, according to Fig. 5, the nodal prices are not changed in a sudden under the DH-LDA.
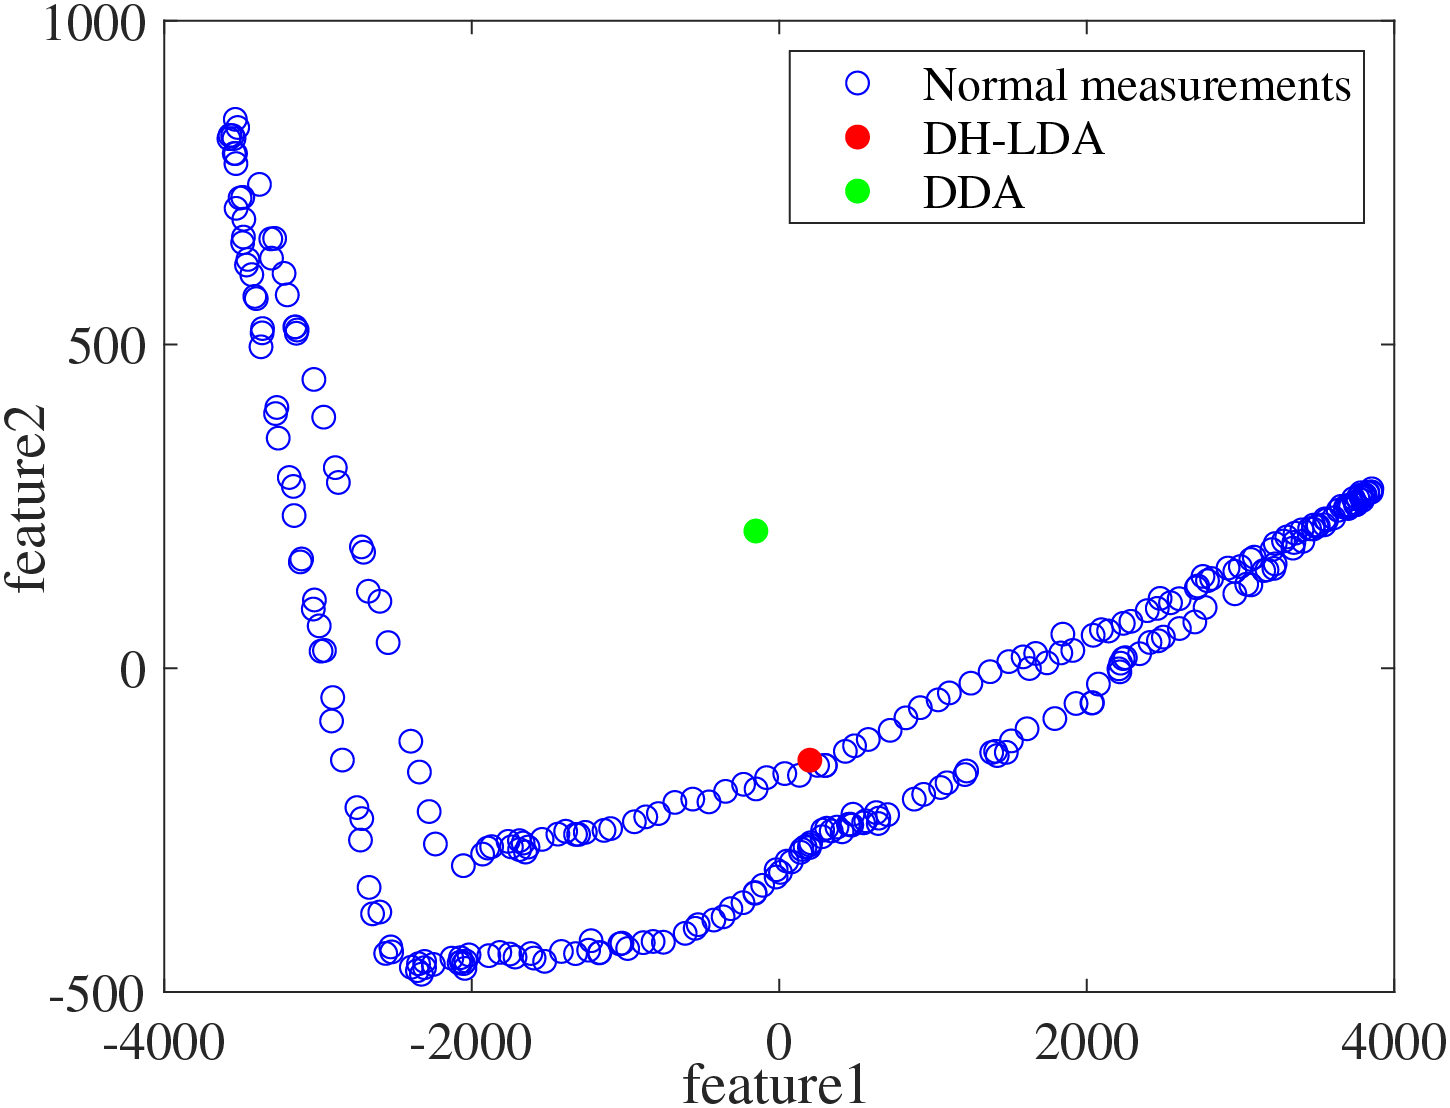
Figure 7: Enhanced hiddenness of DH-LDAs compared with DDAs
5.2 Market Resilience Analysis
Next, we analyze the resilience of the electricity market with the IEEE 14-Bus, 24-Bus, 39-Bus and 118-Bus systems. The results are shown in Fig. 8. Assuming that all transmission lines have a maximum capacity of 110 MWh. In a scenario where the actual load demand is met without the security-constrained economic dispatch, the power flow of the first transmission line has already reached 150 MWh, resulting in congestion cost and unpredictable nodal prices. The DH-LDA is launched to eliminate the congestion cost and alter the bus price. Thus, the attack can control the power flow to be less than 150 MWh. From Fig. 8, we can see that the transmission lines are all not congested after DH-LDA. Therefore, the power system only has the generation cost, achieving the attacker’s goal of predicting the clearing price.

Figure 8: Changes in transmission tine power flow with and without attack
The resilience of the electricity market against DH-LDAs depends on the modification magnitude of the load measurement. With the IEEE 14-bus power system, if there is a line
Furthermore, we analyze the impact of relaxing the load-change limits at the load buses on
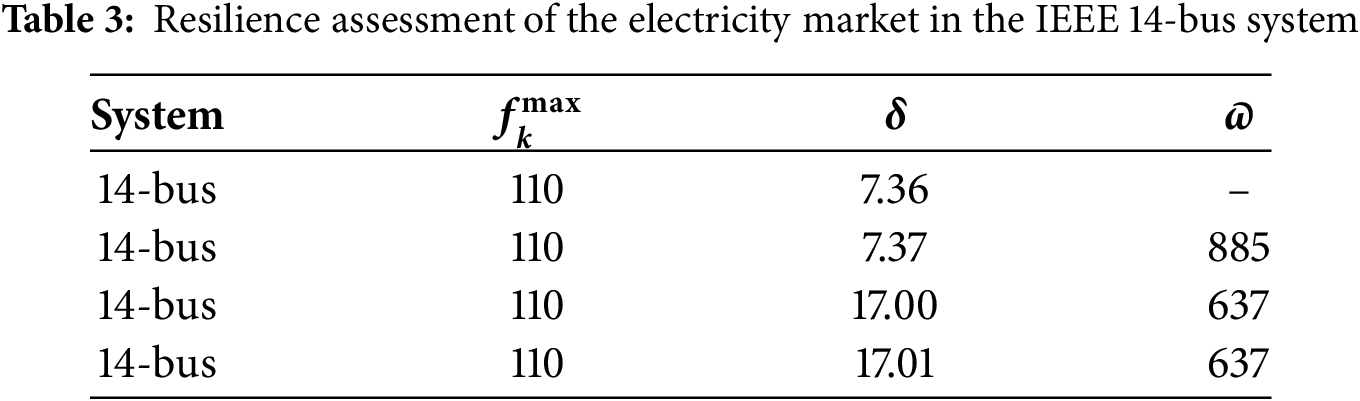
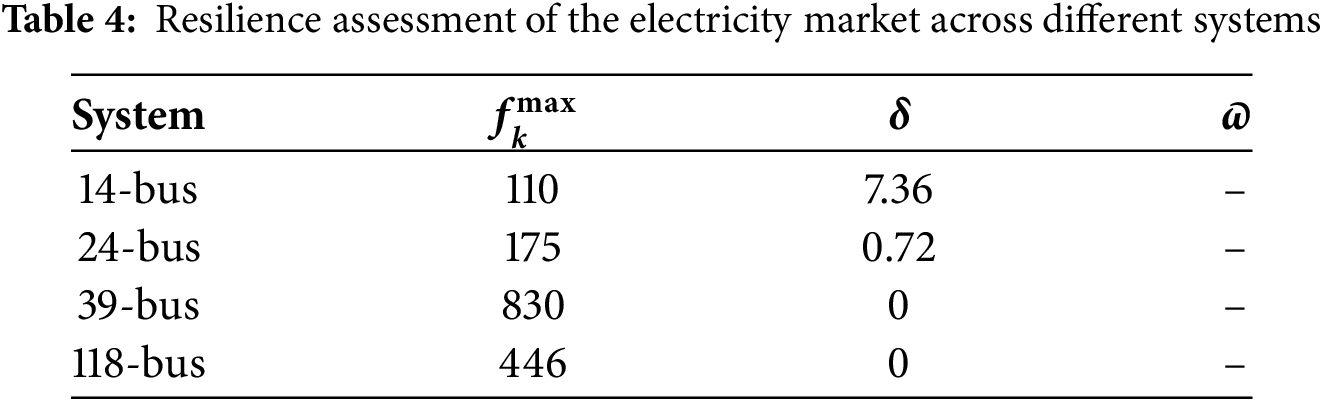
The resilience of the electricity markets against DH-LDA with different power systems is shown in Table 4. It is observed that as the size of the power system increases, the difficulty of constructing a DH-LDA also grows. With the IEEE 24-bus system, if the transmission line has an upper limit of
In this paper, we proposed the deeply hidden load data attack against the electricity market. First, we explored the vulnerability of manipulating nodal prices by injecting false load data into meter measurements, taking into account the cyber vulnerability of load meters. Then, leveraging the changing properties of real-world load profiles, we designed the DH-LDA that can evade multiple detection methods. Next, we analyzed the optimal time window for injecting load data to achieve a deeply hidden attack, making the modified nodal price align with its natural fluctuation. In addition, we propose a method to evaluate the resilience of the electricity market against DH-LDAs. Finally, we conducted experiments to verify that the adversary can profit from the electricity market without being detected.
Acknowledgement: We express our gratitude to the members of our research group, i.e., the Intelligent System Security Lab (ISSLab) of Guizhou University, and Guizhou Power Grid Co., Ltd. Electric Power Dispatching and Control Center, for their invaluable support and assistance in this investigation. We also extend our thanks to our university for providing essential facilities and environment.
Funding Statement: This paper is supported by the project Major Scientific and Technological Special Project of Guizhou Province ([2024]014).
Author Contributions: The authors confirm contribution to the paper as follows: Conceptualization, Yunhao Yu, Meiling Dizha, Boda Zhang, Ruibin Wen, Fuhua Luo, Xiang Guo, Junjie Song, Bingdong Wang, and Zhenyong Zhang; methodology, Yunhao Yu, Meiling Dizha, Boda Zhang, Ruibin Wen, Fuhua Luo, Xiang Guo, Junjie Song, Bingdong Wang, and Zhenyong Zhang; software, Yunhao Yu, Junjie Song, and Zhenyong Zhang; validation, Yunhao Yu and Zhenyong Zhang; formal analysis, Yunhao Yu and Zhenyong Zhang; investigation, Yunhao Yu and Zhenyong Zhang; resources, Yunhao Yu and Zhenyong Zhang; data curation, Yunhao Yu and Zhenyong Zhang; writing—original draft preparation, Yunhao Yu and Zhenyong Zhang; writing—review and editing, Yunhao Yu and Zhenyong Zhang; visualization, Yunhao Yu and Zhenyong Zhang; supervision, Zhenyong Zhang; project administration, Yunhao Yu and Zhenyong Zhang; funding acquisition, Yunhao Yu and Zhenyong Zhang. All authors reviewed the results and approved the final version of the manuscript.
Availability of Data and Materials: Due to the nature of this research, participants of this study did not agree for their data to be shared publicly, so supporting data is not available.
Ethics Approval: Not applicable.
Conflicts of Interest: The authors declare no conflicts of interest to report regarding the present study.
1NYISO load data. 2023, Available at: https://www.nyiso.com/load-data (accessed on 22 July 2025)
2https://www.nyiso.com/load-data (accessed on 22 July 2025)
References
1. Barbierato L, Estebsari A, Pons E, Pau M, Salassa F, Ghirardi M, et al. A distributed IoT infrastructure to test and deploy real-time demand response in smart grids. IEEE Int Things J. 2022;9(1):123–34. doi:10.1109/jiot.2018.2867511. [Google Scholar] [CrossRef]
2. Zhang T, Wang J, Xia Q, Li G, Zhou M. Extracting umbrella constraint-based representation of local electricity markets. IEEE Trans Smart Grid. 2023;14(2):1632–41. doi:10.1109/tsg.2022.3166793. [Google Scholar] [CrossRef]
3. Liu C, Zhou M, Wu J, Long C, Kundur D. Financially motivated FDI on SCED in real-time electricity markets: attacks and mitigation. IEEE Trans Smart Grid. 2019;10(2):1949–59. doi:10.1109/tsg.2017.2784366. [Google Scholar] [CrossRef]
4. Chen Y, Tang Y, Zhang S, Liu G, Liu T. Weather sensitive residential load forecasting using neural networks. In: 2023 IEEE 6th International Electrical and Energy Conference; 2023 May 12–14; Hefei, China. p. 3392–7. [Google Scholar]
5. Yao D, Wen M, Liang X, Fu Z, Zhang K, Yang B. Energy theft detection with energy privacy preservation in the smart grid. IEEE Internet Things J. 2019;6(5):7659–69. doi:10.1109/jiot.2019.2903312. [Google Scholar] [CrossRef]
6. Zhang Z, Deng R, Tian Y, Cheng P, Ma J. SPMA: stealthy physics-manipulated attack and countermeasures in cyber-physical smart grid. IEEE Transact Inform Foren Secur Publicat Inform. 2023;18:581–96. doi:10.1109/tifs.2022.3226868. [Google Scholar] [CrossRef]
7. Negrete-Pincetic M, Yoshida F, Gross G. Towards quantifying the impacts of cyber attacks in the competitive electricity market environment. In: 2009 IEEE Bucharest PowerTech; 2009 Jun 28–Jul 2; Bucharest, Romania. p. 1–8. doi:10.1109/ptc.2009.5282237. [Google Scholar] [CrossRef]
8. Xie L, Mo Y, Sinopoli B. False data injection attacks in electricity markets. In: The First IEEE International Conference on Smart Grid Communications; 2010 Oct 4–6; Gaithersburg, MD, USA. p. 226–31. [Google Scholar]
9. Xie L, Mo Y, Sinopoli B. Integrity data attacks in power market operations. IEEE Trans Smart Grid. 2011;2(4):659–66. doi:10.1109/tsg.2011.2161892. [Google Scholar] [CrossRef]
10. Zhang Z, Yang Z, Yau DKY, Tian Y, Ma J. Data security of machine learning applied in low-carbon smart grid: a formal model for the physics-constrained robustness. Appl Energy. 2023;347(1):121405. doi:10.1016/j.apenergy.2023.121405. [Google Scholar] [CrossRef]
11. Jia L, Thomas RJ, Tong L. Malicious data attack on real-time electricity market. In: IEEE International Conference on Acoustics, Speech and Signal Processing; 2011 May 22–27; Prague, Czech Republic. p. 5952–5. [Google Scholar]
12. Yuan Y, Li Z, Ren K. Modeling load redistribution attacks in power systems. IEEE Trans Smart Grid. 2011;2(2):382–90. doi:10.1109/tsg.2011.2123925. [Google Scholar] [CrossRef]
13. Choi D-H, Xie L. Ramp-induced data attacks on look-ahead dispatch in real-time power markets. IEEE Trans Smart Grid. 2013;4(3):1235–43. doi:10.1109/tsg.2012.2228508. [Google Scholar] [CrossRef]
14. Xiang Y, Wang L, Liu N. A framework for modeling load redistribution attacks coordinating with switching attacks. In: IEEE Power & Energy Society General Meeting; 2017 Jul 16–20; Chicago, IL, USA. p. 1–5. [Google Scholar]
15. Zhang ZJ, Bloch M, Saeedifard M. Load redistribution attacks in multi-terminal DC grids. In: IEEE Energy Conversion Congress and Exposition; 2022 Oct 9–13; Detroit, MI, USA. p. 1–7. doi:10.1109/ecce50734.2022.9948106. [Google Scholar] [CrossRef]
16. Liu X, Li Z. Local load redistribution attacks in power systems with incomplete network information. IEEE Trans Smart Grid. 2014;5(4):1665–76. doi:10.1109/tsg.2013.2291661. [Google Scholar] [CrossRef]
17. Zhu H, Liu C, Zhou M, Tang Y, Du W. Load redistribution attack in optimal power flow with phase shifting transformers. In: 2023 IEEE 6th International Conference on Industrial Cyber-Physical Systems; 2023 May 8–11; Wuhan, China. p. 1–6. [Google Scholar]
18. Zheng DL, Zhou L, Song ZH. Kernel generalization of multi-rate probabilistic principal component analysis for fault detection in nonlinear process. IEEE/CAA J Automatica Sinica. 2021;8(8):1465–76. doi:10.1109/jas.2021.1004090. [Google Scholar] [CrossRef]
19. Esmalifalak M, Nguyen NT, Zheng R, Han Z. Detecting stealthy false data injection using machine learning in smart grid. In: 2013 IEEE Global Communications Conference; 2013 Dec 9–13; Atlanta, GA, USA. p. 808–13. [Google Scholar]
20. Esmalifalak M, Liu L, Nguyen N, Zheng R, Han Z. Detecting stealthy false data injection using machine learning in smart grid. IEEE Syst J. 2017;11(3):1644–52. doi:10.1109/jsyst.2014.2341597. [Google Scholar] [CrossRef]
21. Pinceti A, Sankar L, Kosut O. Load redistribution attack detection using machine learning: a data-driven approach. In: 2018 IEEE Power & Energy Society General Meeting; 2018 Aug 5–9; Portland, OR, USA. p. 1–5. [Google Scholar]
22. Khaleghi A, Ghazizadeh MS, Aghamohammadi MR. A deep learning-based attack detection mechanism against potential cascading failure induced by load redistribution attacks. IEEE Trans Smart Grid. 2023;14(6):4772–83. doi:10.1109/tsg.2023.3256480. [Google Scholar] [CrossRef]
23. Peng S, Zhang Z, Deng R, Cheng P. Localizing false data injection attacks in smart grid: a spectrum-based neural network approach. IEEE Trans Smart Grid. 2023;14(6):4827–38. doi:10.1109/tsg.2023.3261970. [Google Scholar] [CrossRef]
24. Liu X, Song Y, Li Z. Dummy data attacks in power systems. IEEE Trans Smart Grid. 2020;11(2):1792–5. doi:10.1109/tsg.2019.2929702. [Google Scholar] [CrossRef]
25. Zhang Z, Qin Y, Wang J, Li H, Deng R. Detecting the one-shot dummy attack on the power industrial control processes with an unsupervised data-driven approach. IEEE/CAA J Automatica Sinica. 2023;10(2):550–3. doi:10.1109/jas.2023.123243. [Google Scholar] [CrossRef]
26. Li F. Continuous locational marginal pricing (CLMP). IEEE Trans Power Syst. 2007;22(4):1638–46. doi:10.1109/tpwrs.2007.907521. [Google Scholar] [CrossRef]
27. Li F, Wei Y, Adhikari S. Improving an unjustified common practice in Ex Post LMP calculation: an expanded version. In: 2010 IEEE PES General Meeting; 2010 Jul 25–29; Minneapolis, MN, USA. p. 1–4. [Google Scholar]
28. Zhang Z, Liu M, Sun M, Deng R, Cheng P, Niyato D. Vulnerability of machine learning approaches applied in IoT-based smart grid: a review. IEEE Internet Things J. 2024;11(11):18951–187. doi:10.1109/jiot.2024.3349381. [Google Scholar] [CrossRef]
29. Li F, Bo R. Congestion and price prediction under load variation. IEEE Trans Power Syst. 2009;24(2):911–22. doi:10.1109/tpwrs.2009.2016599. [Google Scholar] [CrossRef]
Cite This Article
 Copyright © 2025 The Author(s). Published by Tech Science Press.
This work is licensed under a Creative Commons Attribution 4.0 International License , which permits unrestricted use, distribution, and reproduction in any medium, provided the original work is properly cited.
 Downloads
 Citation Tools