
 Submit a Paper
 Propose a Special lssue
 Open Access
ARTICLE
Localization of False Data Injection Attacks in Power Grid Based on Adaptive Neighborhood Selection and Spatio-Temporal Feature Fusion
School of Control and Computer Engineering, North China Electric Power University, Beijing, 102206, China
* Corresponding Author: Sixing Wu. Email:
Computers, Materials & Continua 2025, 85(2), 3739-3766. https://doi.org/10.32604/cmc.2025.067180
Received 26 April 2025; Accepted 01 August 2025; Issue published 23 September 2025
 View Full Text
 Download PDF
Abstract
False Data Injection Attacks (FDIAs) pose a critical security threat to modern power grids, corrupting state estimation and enabling malicious control actions that can lead to severe consequences, including cascading failures, large-scale blackouts, and significant economic losses. While detecting attacks is important, accurately localizing compromised nodes or measurements is even more critical, as it enables timely mitigation, targeted response, and enhanced system resilience beyond what detection alone can offer. Existing research typically models topological features using fixed structures, which can introduce irrelevant information and affect the effectiveness of feature extraction. To address this limitation, this paper proposes an FDIA localization model with adaptive neighborhood selection, which dynamically captures spatial dependencies of the power grid by adjusting node relationships based on data-driven similarities. The improved Transformer is employed to pre-fuse global spatial features of the graph, enriching the feature representation. To improve spatio-temporal correlation extraction for FDIA localization, the proposed model employs dilated causal convolution with a gating mechanism combined with graph convolution to capture and fuse long-range temporal features and adaptive topological features. This fully exploits the temporal dynamics and spatial dependencies inherent in the power grid. Finally, multi-source information is integrated to generate highly robust node embeddings, enhancing FDIA detection and localization. Experiments are conducted on IEEE 14, 57, and 118-bus systems, and the results demonstrate that the proposed model substantially improves the accuracy of FDIA localization. Additional experiments are conducted to verify the effectiveness and robustness of the proposed model.Keywords
With the continuous advancement of modern communication and information technologies, power systems have evolved beyond being mere physical networks composed of generation, transmission, distribution, and consumption. They are gradually transforming into smart grids where communication networks have become an indispensable component. A large number of electrical, sensing, and computing devices are interconnected through two physical networks, the power system and the communication network, which greatly enhances the complexity and interactivity of the power grid [1,2]. The traditional physical device-centered power system has gradually evolved into a highly coupled Cyber-Physical System (CPS). This framework integrates computational and physical processes through real-time sensing, communication, and control to enhance automation, adaptability, and efficiency [3,4].
The increasing frequency of information exchanges in power systems raises the risk of cyberattacks. Among these, False Data Injection Attacks (FDIA) pose a significant threat by introducing operational uncertainties, potentially undermining system security and stability [5]. FDIA, initially proposed by Liu et al. [6], is a class of sophisticated cyberattacks that target the state estimation processes in power grids. These attacks involve the deliberate injection of falsified data into the grid’s measurement system, which is specifically crafted to evade detection by conventional bad data detection (BDD) algorithms. This type of attack poses a significant threat to the security, stability, and reliability of the power grid, as it can be difficult to detect and mitigate, particularly in real-time operational environments [7]. The severity of such attacks is exemplified by the 2015 Ukrainian grid incident, in which remote manipulation of substation breakers left approximately 225,000 customers without power for several hours.
Given the potential impact of FDIA, prior research has primarily focused on developing detection methods, which can be broadly categorized into model-based and data-driven methods [8]. Model-based methods for FDIA detection utilize system models to compare predicted and observed measurements, identifying discrepancies that may signify the presence of injected false data. For instance, Anwar et al. [9] combined a nodal voltage stability index with clustering to detect vulnerable buses. Singh et al. [10] used relative entropy to distinguish FDIA data from normal data. Khalid and Peng [11] proposed a Bayesian filter for node monitoring, and Musleh et al. [12] introduced a wide-area control scheme for enhanced FDIA resistance. However, these methods struggle with dynamic data, are costly, and rely heavily on model accuracy [13]. Data-driven methods for FDIA detection develop advanced statistical techniques and machine learning models to identify anomalous patterns in measurement data, enabling adaptive and data-centric detection without relying on explicit physical system models. With advancements in machine learning, deep neural networks are increasingly used for FDIA detection. Lu et al. [14] employed a Convolutional Neural Network (CNN) to exploit its strengths in data processing for FDIA detection. Zhao et al. [15] utilized the memory capabilities of Long Short-Term Memory (LSTM) for time-series prediction to identify compromised measurements. He et al. [16] proposed a method combining Bidirectional Temporal Convolutional Networks (Bi-TCN) and Bidirectional Gated Recurrent Units (Bi-GRU) with an attention mechanism to capture both short-term and long-term dependencies in grid data.
Existing research on FDIA detection has demonstrated its effectiveness in identifying attacks within power grids. However, they primarily formulate the problem as a general anomaly detection task, classifying the overall system state without providing granular localization of the compromised components. Localization is more critical than detection, as it enables targeted responses such as isolating compromised buses or redirecting power flows, thereby avoiding disruptive system-wide interventions. Without precise localization, detection alone is operationally ineffective, forcing operators to choose between costly over-protection or unchecked attack propagation. Research on FDIA localization remains underdeveloped compared to detection. Some previous studies on FDIA localization have framed the task as a multi-label classification problem, where each measurement or system component is assigned a label indicating whether it has been compromised. Wang et al. [17] combined CNN with a traditional bad data detector for model-free FDIA detection. Wu et al. [18] proposed an extreme learning machine-based method but struggled with high-dimensional data. Luo et al. [19] developed distributed interval observers with a logical discriminant matrix for localization. Mukherjee [20] introduced a model that combines CNN and LSTM for multi-label classification, while Mallikarjunaswamy et al. [21] used clustering and vector autoregression for detection and localization. Although these methods effectively localize attack nodes, their limited ability to capture complex topological dependencies in power grids may restrict localization accuracy and weaken attack identification.
Power grids are networks of interconnected components with explicit topologies. Ignoring these topological connections during analysis risks losing critical information. Graph Neural Networks (GNNs) effectively capture such structures, offering significant advantages in representing power grid data. Li and Wang [22] modeled the power grid as a weighted bi-directional graph and used a vector-based capsule GNN for FDIA detection and localization. Boyaci et al. [23] proposed a GNN model that utilizes the graph adjacency matrix to incorporate system topology, thereby enabling the detection of stealthy attacks. Ref. [24] proposed a method based on Graph Convolutional Network (GCN) using Chebyshev convolution to efficiently model grid topology and operational data, enabling faster computation while preserving spatial correlations in smart grid data. Ref. [25] proposed a GNN with an Autoregressive Moving Average Model (ARMA)-type graph filter to detect FDIA and identify attack locations by integrating spatial correlations of grid topology and data. Li et al. [26] enhanced grid topology representation using Gated Graph Neural Network (GGNN) features and attention mechanisms to assign weights to neighboring nodes. Xia et al. [27] developed an FDIA detector based on a Graph Attention Network (GAT), using graph attention to assign operators for improved location detection. Li et al. [28] proposed a spatio-temporal Transformer (ST-Transformer) that integrates spatial and temporal self-attention to capture both global and local dependencies, enhancing detection accuracy. Han et al. [29] converted bus and branch data into graph-structured form and employed a Modified Temporal Multi-graph Convolutional Network (MTMCN) to extract hidden spatio-temporal features.
However, these approaches overlook an important fact: GNNs such as GCN and GAT are designed based on the assumption of high homophily in graphs [30]. In contrast, when power grid nodes are represented as a graph, they often exhibit low homogeneity. Homogeneity is a fundamental characteristic of graph-structured data, where connected nodes tend to have similar features and the same labels [31]. Power grid nodes (buses) can be categorized into generation, load, and balancing nodes, each with distinct functions and operational characteristics. Neighboring nodes often differ in roles, creating heterogeneous interactions that challenge traditional graph-based modeling. Moreover, even nodes of the same type exhibit significant variations in measured data due to load fluctuations, weather conditions, and network topology, further amplifying feature discrepancies. These factors hinder GNNs from effectively transferring information between structurally and functionally diverse nodes, limiting their generalization across the power grid. Relying solely on physical topology for neighborhood aggregation may introduce noise, degrading feature representation and localization accuracy. In contrast, temporally similar but physically distant nodes may reveal latent spatial correlations overlooked by traditional models.
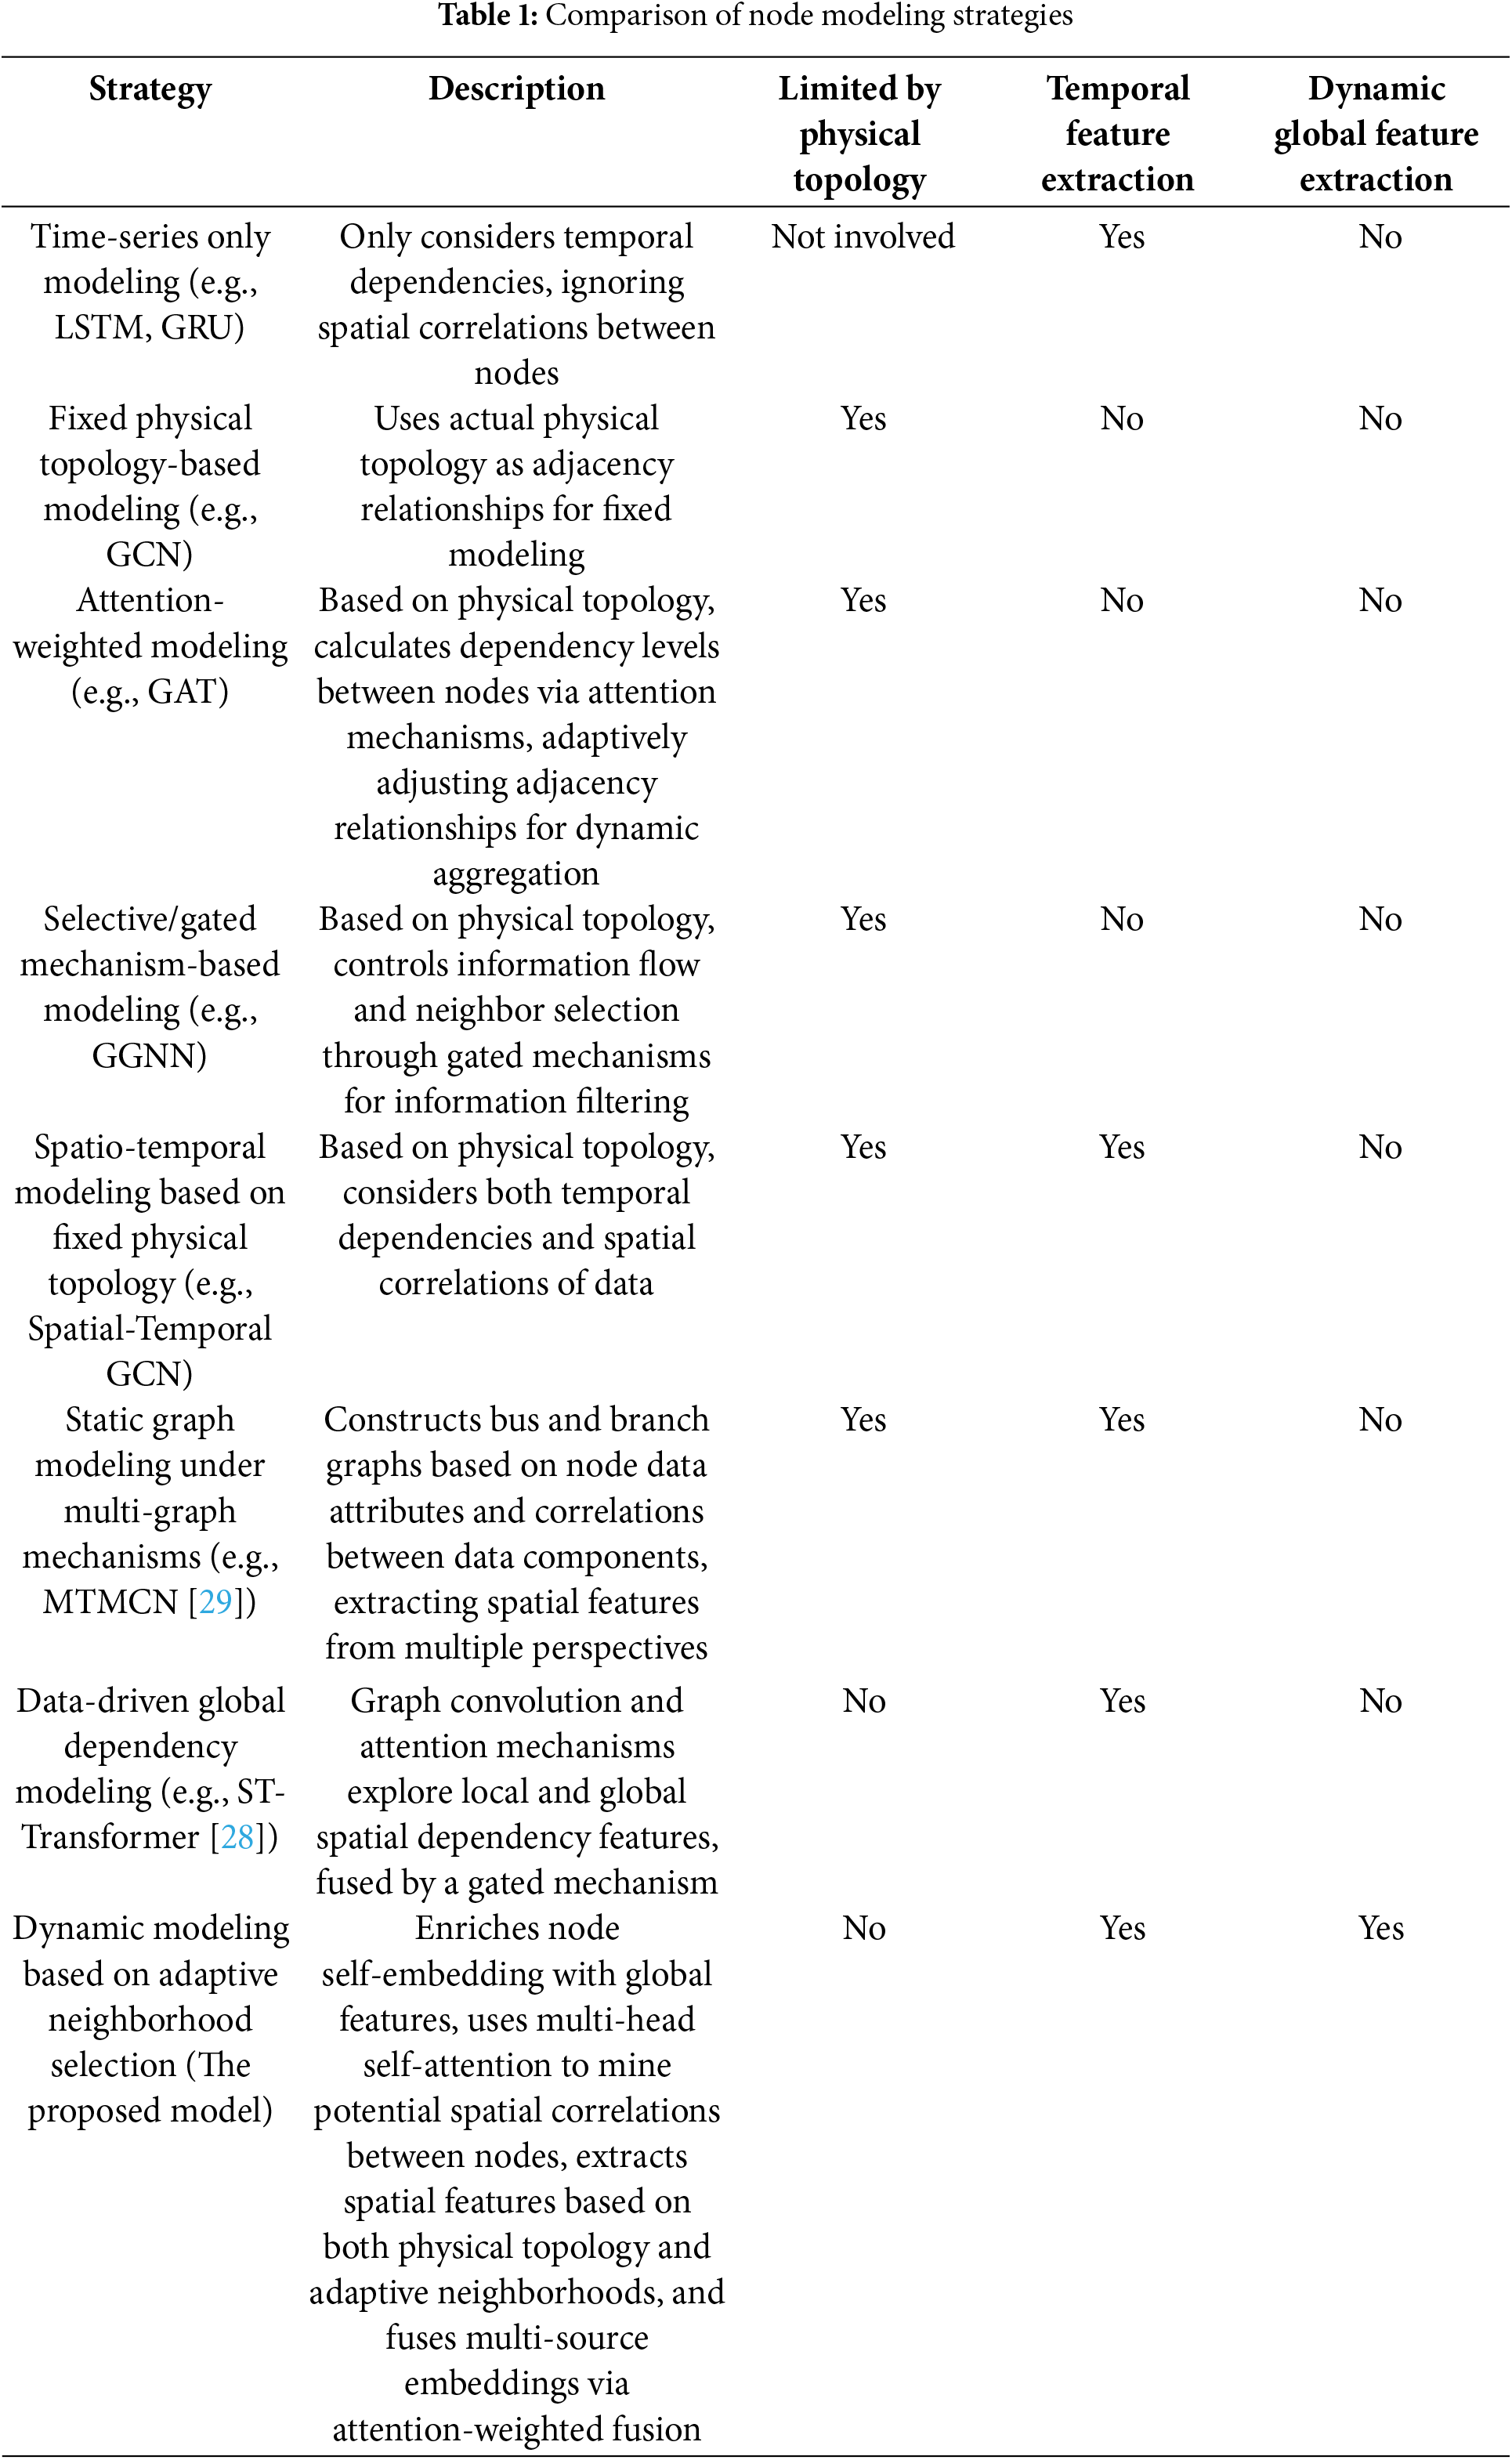
To address the above limitations, this paper proposes a novel FDIA localization approach. Based on the observation that overcoming physical connectivity constraints and effectively extracting both spatial and temporal correlations from grid data is crucial, this paper proposes an adaptive neighborhood selection mechanism and a spatio-temporal feature fusion method. The adaptive neighborhood selection mechanism leverages node features to compute cosine similarity via multi-head self-attention, generating a sparsified adjacency matrix that captures hidden dependencies beyond the physical topology. Differences in node modeling strategies are shown in Table 1. The main contributions of this work are as follows:
• An adaptive neighborhood selection method is proposed to mitigate the negative impact of low node homogeneity on FDIA localization, which utilizes a multi-head self-attention mechanism to uncover potential spatial correlation between nodes and identify latent associations beyond the physical topology.
• The improved Transformer is utilized to pre-fuse global spatial features of the graph, which are then concatenated with node features to form self-embeddings. These self-embeddings, serving as part of the final node embeddings, preserve the original attributes of the nodes and prevent information loss.
• To fully capture the spatio-temporal correlations of grid data, dilated causal convolution with a gating mechanism is employed for temporal feature extraction. Graph convolution aggregates information based on both physical topology and adaptively selected neighborhoods. The fusion of multi-source features generates highly robust node embeddings.
• The proposed model is experimentally validated and extensively evaluated on three IEEE bus systems, demonstrating significant improvements in attack localization performance compared to prior approaches.
The remainder of this paper is organized as follows: Section 2 introduces the theoretical foundations of FDIA. Section 3 outlines the overall framework of the model proposed in this paper. Section 4 presents the experimental results and specific analysis. Section 5 summarizes this work and discusses future research.
2.1 Power System State Estimation and Bad Data Detection
State estimation calculates system state variables from measurements in real time, aiming to provide the best estimate of the current power system state. This is essential for better monitoring and control of the power system during real-time operations. In Power Cyber-Physical Systems, the estimated values from state estimation are typically used to support system monitoring and operational decision-making during actual operation. The estimated values from state estimation exhibit greater smoothness and robustness compared to raw measurements, which helps suppress measurement noise and errors, thereby offering more stable and reliable system state information. State estimation can be applied to power dispatch, fault diagnosis, power flow analysis, and other critical operations. It serves as a vital foundation for the safe and reliable operation of smart grids. The measurement equation is as follows:
where the vector z represents the original measurement vector from the Supervisory Control And Data Acquisition (SCADA) system, including bus injection power and transmission line power flow, while the vector x represents the system state variables, including the voltage phase angles at the buses. The Jacobian matrix H reflects the system topology, line admittances, and sensor configurations. The vector e denotes the random measurement error vector, which has a zero mean and follows a Gaussian distribution. For Direct Current (DC) state estimation, assuming a unit voltage of 1 at each node in the system, and ignoring the effects of line resistance and grounded branches, the power is calculated as:
The objective function to be minimized is obtained through linear weighted least squares estimation, given by:
where R represents the measurement error covariance matrix, and the value of x that minimizes the objective function is given by:
In power systems, traditional bad data detection (BDD) methods are commonly employed to detect faulty measurements, telemetry defects, and hostile attacks. The maximum standardized residual test is a classical BDD method, where the residual r is the difference between the measurement vector z and the estimated measurement values
The residual r is compared with a given threshold
2.2 False Data Injection Attacks
To evade bad data detection, the attacker can construct FDIAs without requiring complete knowledge of the system’s topology. By leveraging partial information from the measurement matrix, the attacker can generate specific attack vectors that evade traditional bad data detection mechanisms, thereby compromising the accuracy of state estimation.
Specifically, let the tampered actual measurement data be denoted as
If
This implies that after the attack injection, the tampered measurement data remains consistent with the objective function during bad data detection, and the measurement residuals do not increase. Consequently, traditional bad data detection mechanisms fail to identify FDIA.
Building on an analysis of FDIA mechanisms and stealth features, this paper develops effective detection and localization methods to identify hidden FDIA that evade conventional bad data detection techniques.
To better locate the attacked buses in the power grid, this paper proposes a novel localization method based on Adaptive Neighborhood Selection and Spatio-Temporal Feature Fusion Graph Neural Network (ANS-STGNN). Fig. 1 illustrates the overall architecture of ANS-STGNN. The model comprises an adaptive neighborhood selection module, a global feature fusion module, a spatio-temporal feature fusion module, a multi-source feature fusion module, and a classification output module. The adaptive neighborhood selection module identifies internal correlations between nodes to reveal potential spatial associations and select reliable neighbors. The global feature fusion module captures global spatial features and aggregates valuable information across the entire graph. The spatio-temporal feature fusion module deeply extracts both temporal dependencies and spatial correlations. The multi-source feature fusion module integrates node embeddings from multiple sources to generate robust final embeddings. Finally, the classification output obtains the anomaly probability for each node.
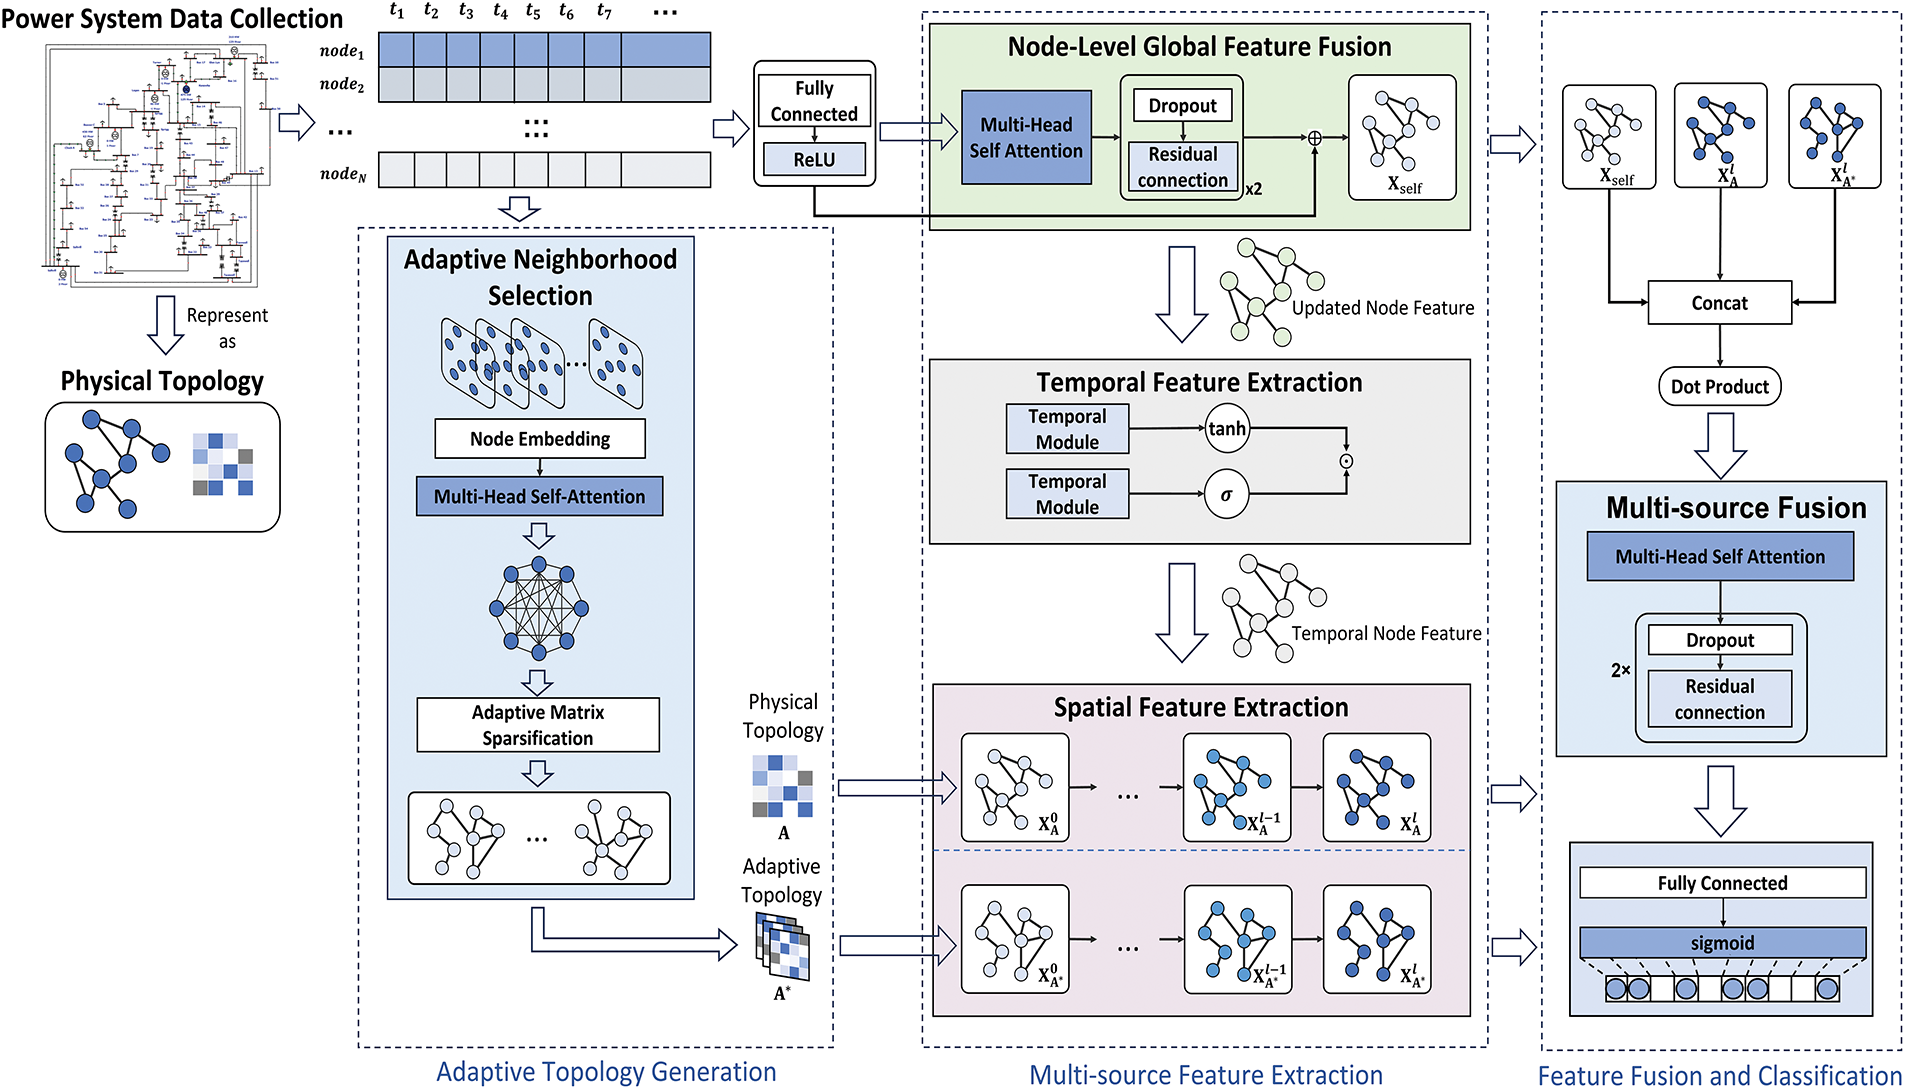
Figure 1: Architecture of ANS-STGNN model
The power system can be modeled as a connected, undirected, weighted graph
Some previous studies formulate FDIA detection as a system-level binary classification problem over time, where the objective is to determine whether the entire power system is under attack. In this formulation, the model performs a classification at each time step, indicating whether an attack is present in the system. Mathematically, given the input feature matrix, the model learns a mapping:
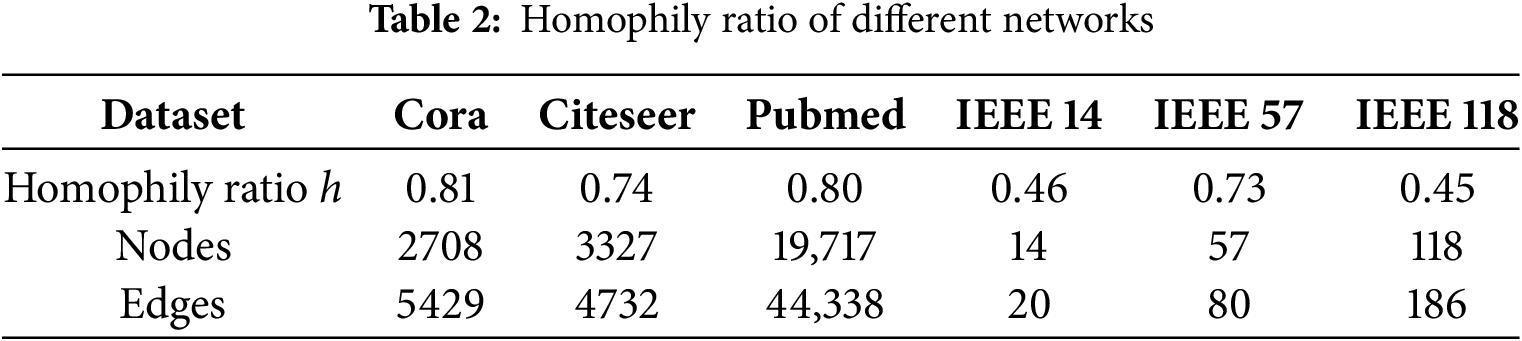
In [30], the level of homogeneity of the graph is measured using the homogeneity ratio in Eq. (11).
3.2 Adaptive Neighborhood Selection
Grid measurement data, a time series exhibiting strong daily and seasonal patterns, varies significantly across nodes with different roles such as generation, load, and balancing. Neighboring nodes may serve various functions, and post-attack, load nodes targeted to satisfy Kirchhoff’s Current Law (KCL) are more susceptible to FDIA due to flexible power measurements, deviating from normal behavior. This low homogeneity can introduce noise when aggregating graph information using a predefined adjacency matrix based on physical topology, weakening feature representation.
Beyond the constraints of physical connectivity, certain buses that are not directly linked to the power grid may exhibit similar measurement patterns due to underlying operational correlations. Capturing these latent relationships can provide valuable insights for improving FDIA detection and localization. To this end, this paper introduces an adaptive neighborhood selection module that dynamically adjusts node connectivity during training to uncover spatial dependencies from data. Leveraging this mechanism, the model constructs multiple graph structures
Specifically, a multi-head self-attention mechanism calculates node similarities to determine internal correlations. This mechanism dynamically adjusts attention to each input sequence element based on their similarities. In multi-head self-attention, multiple parallel heads capture different relationships in the input, and its results are concatenated, then transformed linearly to produce the final output. For an input node feature matrix X, the calculation proceeds as follows:
where
The physical topology of the power grid is represented as an undirected graph, where buses correspond to nodes and transmission lines correspond to edges. Therefore, our ultimate goal is to generate an undirected reconstructed graph. Based on the method of generating a reconnected graph in [32], this paper introduces an improved graph regeneration module. Firstly, the multi-head self-attention mechanism is modified:
where
Power grid measurement data is a time series with both short-term fluctuations and long-term trends. Short-term variations are generally minor, characterized by gradual changes or occasional sharp fluctuations caused by load shifts or system adjustments. Consequently, short-term correlations between nodes exhibit minimal and often subtle variation. Long-term variations, such as daily and seasonal cycles, have a more pronounced impact on the power grid measurement data, leading to significant shifts in correlations over extended periods.
To address the complex variations in power grid data, a window size
The method calculates node similarities to construct an adaptive adjacency matrix, forming a fully adaptive topology that addresses the information constraints of the original physical graph. Sequential feature aggregation increases computational complexity. To further select the important features in the graph and enhance computational efficiency, a matrix sparsification method is employed to optimize the graph. Specifically, a positive integer
In the equation,
The adaptive neighborhood selection module enables the extraction of spatial correlations between nodes from dynamic data, yielding a sparse adaptive adjacency matrix. This matrix allows for the identification and selection of more relevant new neighbors for the nodes.
This matrix enables the identification and selection of relevant neighbors for each node, thereby dynamically constructing an additional topology beyond the physical topology. This enhanced topology facilitates more effective graph-level feature extraction, as illustrated in Fig. 1.
In graph neural networks, information propagates through the graph’s adjacency matrix, where nodes exchange messages with their neighbors. However, this approach encounters challenges when handling long-range dependencies, particularly in complex relationships or interactions between distant nodes. In the context of power grids, the reliance on a predefined topology restricts feature aggregation to immediate neighboring buses, thereby overlooking potentially valuable information from non-adjacent buses. This limitation hinders the model’s ability to capture the full scope of the grid’s dynamic behavior, which may involve interactions across longer distances.
To address this issue, this paper proposes a global feature fusion method to enhance the model’s ability to capture long-range dependencies in the graph. A modified Transformer module is introduced to improve the grid graph representation, particularly tackling the imbalance between nodes and edges. The original Transformer’s regularization is replaced with dropout to avoid over-penalizing low-degree nodes and reduce overfitting. The feed-forward layer is removed to focus more on the multi-head self-attention mechanism, effectively capturing long-range spatial dependencies. Feature transformations are handled by subsequent modules, minimizing redundant computations while maintaining performance:
where
To overcome the gradient vanishing problem and mitigate overfitting, residual join and Dropout operations are introduced to obtain the fused feature vector
3.4 Temporal Feature Extraction
FDIA may involve deceptive patterns that are difficult to detect using spatial features alone. Incorporating temporal feature extraction enables the model to become more adept at recognizing and distinguishing between normal operational fluctuations and malicious manipulations, thereby enhancing the overall effectiveness of FDIA detection in power grid systems.
Traditional CNNs, while effective at capturing local patterns, have limited receptive fields and struggle to capture long-range dependencies in time series data without significantly increasing computational complexity. Recurrent Neural Networks (RNNs) and their modified variants, such as GRU and LSTM networks, by contrast, excel at modeling sequential data but can suffer from vanishing gradient problems and are computationally expensive, especially with long time series.
Therefore, this paper employs dilated causal convolution with a gating mechanism to effectively capture both short- and long-term temporal patterns while preserving computational efficiency. In dilated causal convolutional networks [33], a dilation factor controls the convolution’s jump distance, selecting inputs every d steps to expand the model’s receptive field and efficiently capture long-term temporal dependencies. For a temporal convolutional network with
where l is the current number of network layers. m is the size of the convolution kernel. d is the scaling factor, the size of which controls the hopping distance, i.e., an input is selected every d steps. s is the scaling factor, a parameter that controls the range of neighboring nodes.
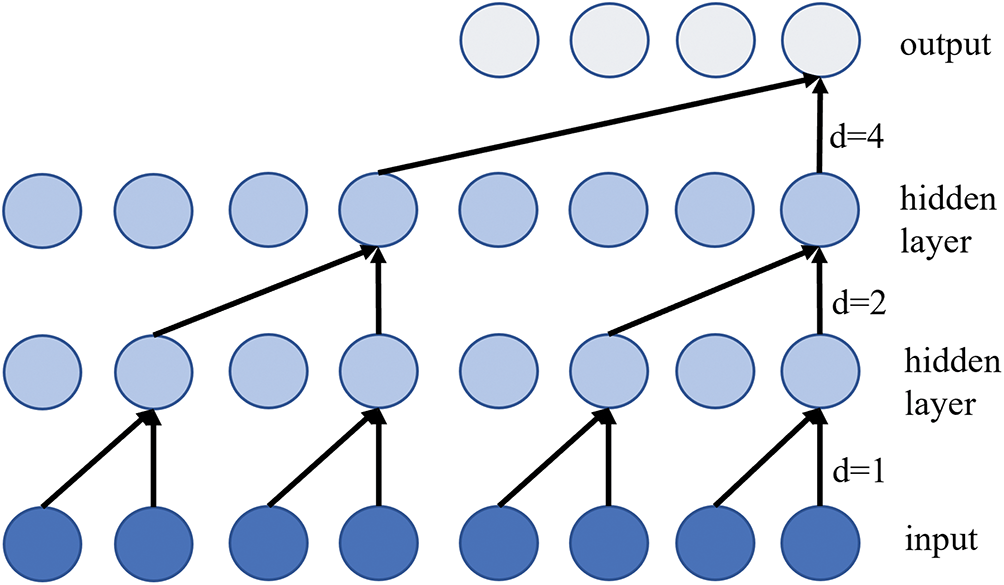
Figure 2: Dilated causal convolution
Further, to improve the efficiency of time convolution, selectively retaining important information and suppressing irrelevant or redundant information, a gating mechanism is introduced to adequately capture the nonlinear relationship of the measurement data in the time dimension, defining the gated time convolution layer as in the following equation:
where the initial input is the self-embedding
3.5 Spatial Feature Extraction
Building upon the extraction of temporal features, spatial feature extraction is equally crucial for FDIA detection in power grids. Given the interconnected nature of power systems, the interactions between buses, generators, and other network elements can significantly influence the system’s behavior, making spatial features essential for accurate anomaly detection. Extracting these spatial dependencies helps identify compromised nodes and detect inconsistencies in the grid’s operation, complementing temporal analysis for more robust FDIA detection.
To effectively extract spatial features, this paper utilizes the GCN to capture spatial dependencies between nodes based on the grid topology in power grids. Unlike traditional CNNs that process Euclidean data, GCNs operate on non-Euclidean graph structures by aggregating each node’s feature vector with those of its neighboring nodes. Using the admittance matrix of the grid
where
Graph convolution is closely linked to the graph Fourier transform, which designs filters in the Fourier domain to operate directly on graph nodes. By leveraging the graph’s adjacency matrix, GCN extracts spatial features by aggregating information from first-order neighboring nodes. By stacking multiple convolutional layers, a hierarchical GCN model is built, enabling layer-by-layer information propagation:
where H represents the layer’s output, the superscript is the number of feature layers,
In the proposed ANS-STGNN model, the spatial feature extraction module performs convolution operations on the inputs using both the adjacency matrix A derived from the grid’s predefined physical topology and the adaptive adjacency matrix
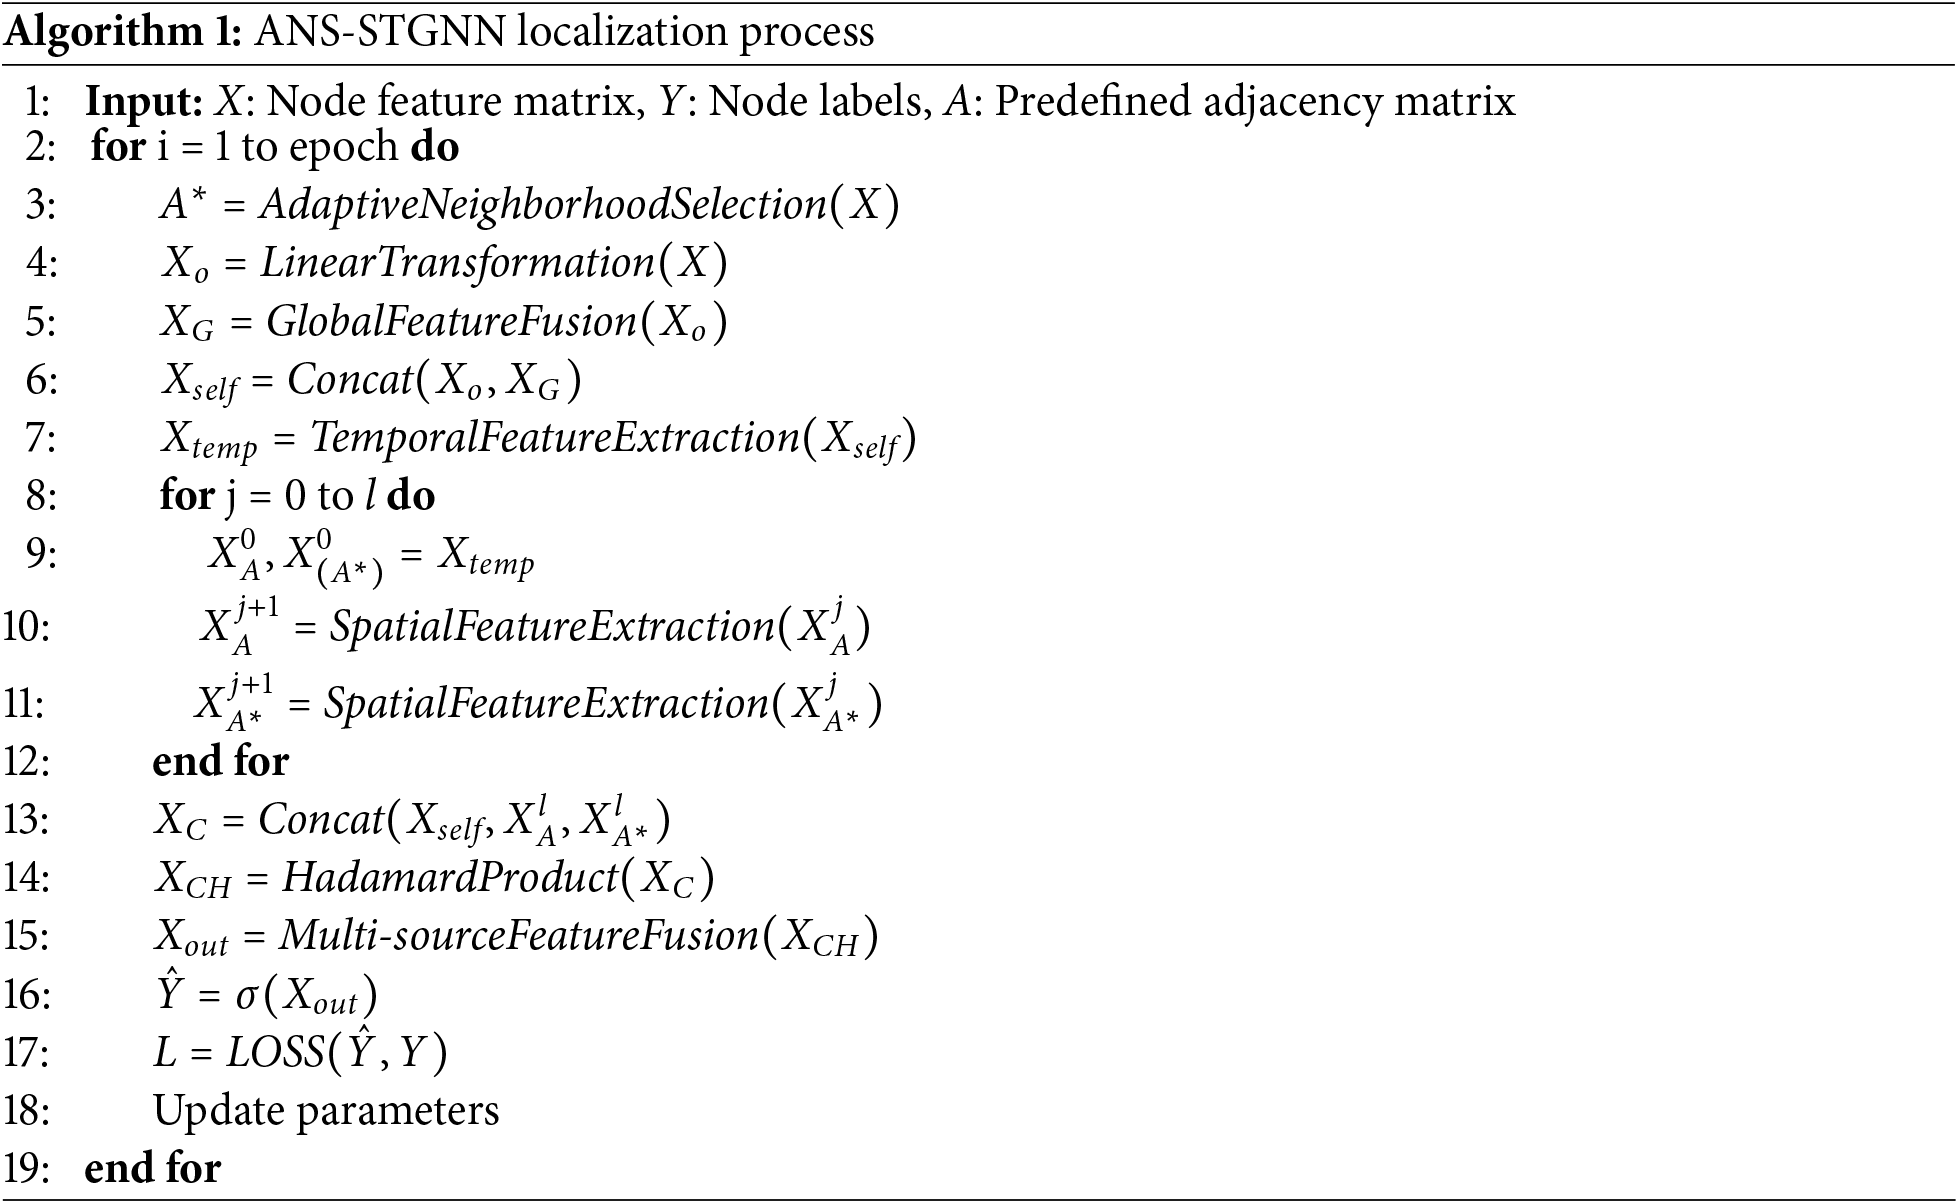
3.6 The Localization Process of FDIA Based on ANS-STGNN
Building upon the feature extraction framework presented in the previous sections, the ANS-STGNN frames the localization problem of FDIA as a multi-label binary classification task, where each bus is assigned a label. A label value of 0 indicates normal operation, while a value of 1 signifies an attack on the respective bus. The detection model is trained on historical data to estimate the probability of attacks on each node, enabling accurate localization of FDIA within the power grid.
Power system measurement data includes dynamic time series features such as voltage phase angle, node injection active and reactive power, and branch active and reactive power. To avoid overfitting and focus on node features, only vertex features—node injected active power and reactive power—are used as inputs in the power system graph model. The overall framework of the ANS-STGNN model is shown in Fig. 1. Node features
Subsequently, X is linearly transformed and activated to obtain
Splice
The self-embedding, neighbor embedding, and adaptive neighbor embedding of the node are connected as the total embedding of the node,
Finally, the input classification layer, after the fully connected layer and sigmoid activation function, gives the probability of each node being anomalous:
All unknown parameters in the model are trained and learned using the cross-entropy loss function:
where N denotes the number of samples in the training set,
In this paper, the proposed methodology is evaluated through simulations on three power systems of varying sizes: the IEEE 14-bus, the IEEE 57-bus, and the IEEE 118-bus. The network topology, measured data, and parameter information of these systems are obtained from the Matpower toolbox in MATLAB. All model building experiments except simulations were coded and tested with the deep learning library PyTorch, versions 3.10.9 and 2.0.1 of Python and PyTorch, respectively, and were performed on a computer equipped with an Intel(R) Core(TM) i7-9750H CPU @ 2.60 GHz, 16.0 GB of RAM, and an NVIDIA GeForce GTX 1650 to execute on a machine.
Due to power system data privacy constraints, there are no publicly available datasets that can be used to simulate and model the construction of the FDIA using manual methods. To overcome this limitation, simulation experiments are conducted in MATLAB R2016a to generate datasets containing both normal and attacked data for the IEEE 14, 57, and 118-bus power systems. The network topology and related configuration information are available from the Matpower 7.1 toolbox. The historical real load data is downloaded from the official website of the New York Independent System Operator (NYISO). At each time step, the load values are scaled and assigned to the buses according to a specified scaling ratio. The system state vector x is obtained through power flow calculation. The topological configuration matrix H of the grid is extracted from the toolbox, and the system measurements are calculated according to
As power grids scale up and measurement data volumes surge, state estimation based on the DC power flow model strikes a balance between computational efficiency and effective preservation of key features such as active power and voltage phase angles, making it well-suited for real-time large-scale security analysis. In this study, attack samples are generated based on the FDIA principles and construction methods described in Section 2.1 and Section 2.2, with a focus on simultaneous false data injection attacks targeting multiple buses in a DC power grid. Only load buses are selected as injection targets because their measurement data exhibits significant uncertainty and a wide distribution. Attackers can exploit the critical role of load nodes in state estimation to construct covert and physically consistent attack vectors. Additionally, load nodes have weaker security protection, lower attack costs, and are easier to implement while being difficult to detect. Alternatively, generator buses and slack buses typically have more stringent protection systems, making attacks more difficult to execute and easier to detect. The attack strength, defined as the difference between injected false data and actual measurements, is set to 0.1 in this study. This value is sufficient to produce noticeable anomalies for effective model training and detection, while avoiding exaggerated effects to preserve the realism of the simulation. To enhance realism, unavoidable dynamic noise introduced during data acquisition and transmission is simulated by adding Gaussian noise with a mean of 0 and a standard deviation of 0.05 to the measurement data. Each attack lasts for 15 consecutive time steps, during which one power flow calculation is performed per step using the Matpower toolkit. The resulting measurement residuals are verified to remain below the detection threshold
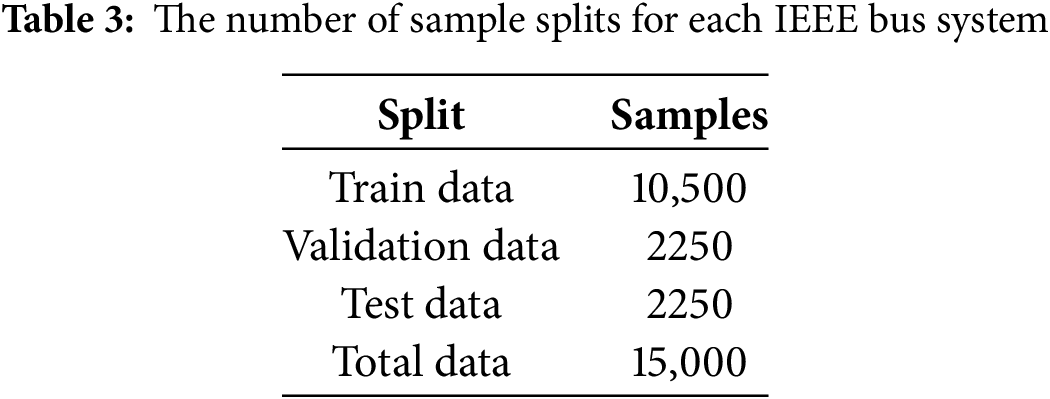
During the model training process, the dataset is divided into training, validation, and test sets in the ratio of 70%, 15%, and 15%, respectively. The data splitting strictly follows the principle of temporal integrity, with each set drawn from non-overlapping time intervals to prevent data leakage. The number of sample splits is shown in Table 3 and each sample of the dataset contains node features and corresponding labeled values for each node.
To prevent overfitting during training, a mini-batch gradient descent method is employed, in which the training set is divided into small batches, each containing 128 data instances. During training, a fixed number of mini-batches are sequentially fed into the model to compute gradients and update parameters. An early stopping strategy is adopted to improve the model’s generalization ability. The Adam optimizer is used with an initial learning rate of 0.001, and a learning rate decay strategy is applied with a patience of 6 epochs and a decay factor of 0.6. The loss function is the binary cross-entropy defined in Eq. (40), which is used to calculate the loss values and corresponding gradients for parameter updates. The number of heads in the multi-head self-attention mechanism is set to 4, and the Dropout is set to 0.2. The hidden layer dimension is 128. To ensure reproducibility, the random seed for all experiments is fixed at 26. The training process is conducted over 500, 800, and 1000 epochs for the IEEE 14-bus, 57-bus, and 118-bus systems, respectively.
4.3 FDIA Localization Model Performance
This section compares the proposed ANS-STGNN with the following methods, including various deep learning models, Long Short-Term Memory (LSTM), Gated Recurrent Unit (GRU), Gated Temporal Convolutional Network (G-TCN), Temporal Transformer, Graph Convolutional Network (GCN), Graph Attention Network (GAT), and Gated Graph Neural Network (GGNN). Additionally, a comparison is conducted with existing methods, including the Spatial-Temporal Graph Convolutional Network (STGCN) and the Spatial-Temporal Transformer Network (ST-Transformer).
To evaluate the performance of the proposed localization model, this paper uses accuracy, precision, recall, and F1-score metrics to assess the effectiveness and feasibility of the proposed FDIA localization method. The following variables are defined: True Positive (TP) is the number of attack samples correctly identified as being under attack. False Positive (FP) is the number of normal samples incorrectly identified as being under attack. True Negative (TN) is the number of normal samples correctly identified as not being under attack. False Negative (FN) is the number of attack samples incorrectly identified as not being under attack. Evaluation metrics are defined as:
Accuracy measures the percentage of correct predictions, reflecting the classifier’s overall performance. Precision represents the likelihood that a predicted attack sample is a true attack, while recall measures the probability of correctly identifying actual attack samples. To balance precision and recall, the F1-score, their harmonic mean, is used to evaluate overall performance:
4.3.1 Training Loss and Validating Accuracy of the Models
Fig. 3 shows the variation of the change in loss values with the number of iteration rounds during the training of ANS-STGNN alongside several other models on the IEEE 14-bus system. The training loss values reported in this study represent the cumulative sum of the losses computed across all batches within each epoch. As the number of iteration rounds increases, the overall loss of all models gradually decreases and eventually stabilizes. Among them, ANS-STGNN achieves the lowest final loss. It shows that the ANS-STGNN is capable of extracting features more effectively and achieving higher consistency between its localization outcomes and the actual categories of the sample data, resulting in a reduced loss.
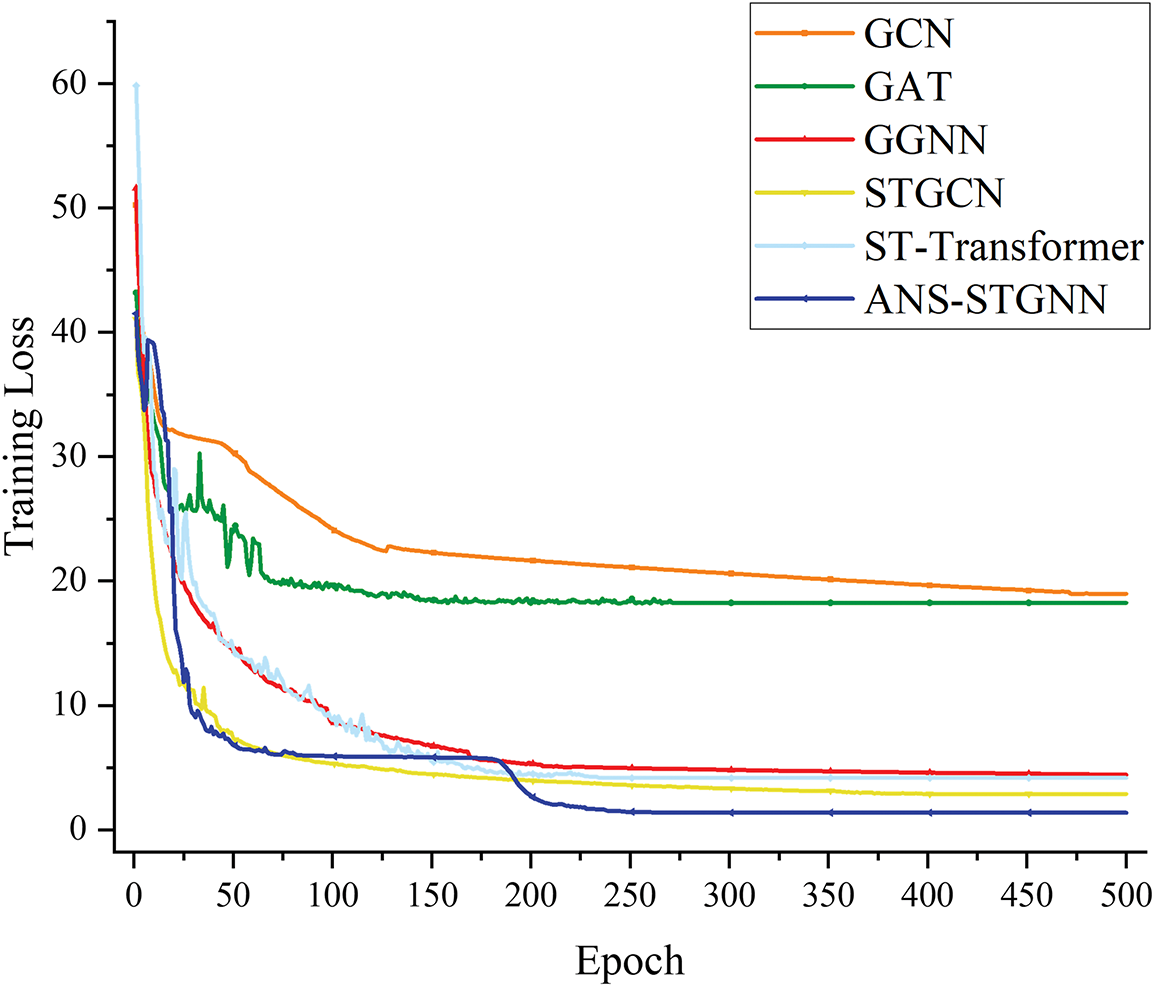
Figure 3: Loss variation during models training in IEEE 14-bus system
Figs. 4 and 5 show the variation of training and validation loss values for ANS-STGNN across different iteration rounds on the IEEE 14, 57, and 118-bus systems. Furthermore, across power grids of varying complexity, the model consistently achieves lower final loss values. With adaptive neighborhood selection and spatio-temporal feature fusion, the model adapts to complex structures, enabling it to extract richer information. Increased neighborhood complexity allows the model to capture more detailed node and neighborhood features, thereby deepening insights into the data and enhancing feature representation. Furthermore, multi-source fusion enhances node characterization, increasing sensitivity to anomalies and improving attack detection.
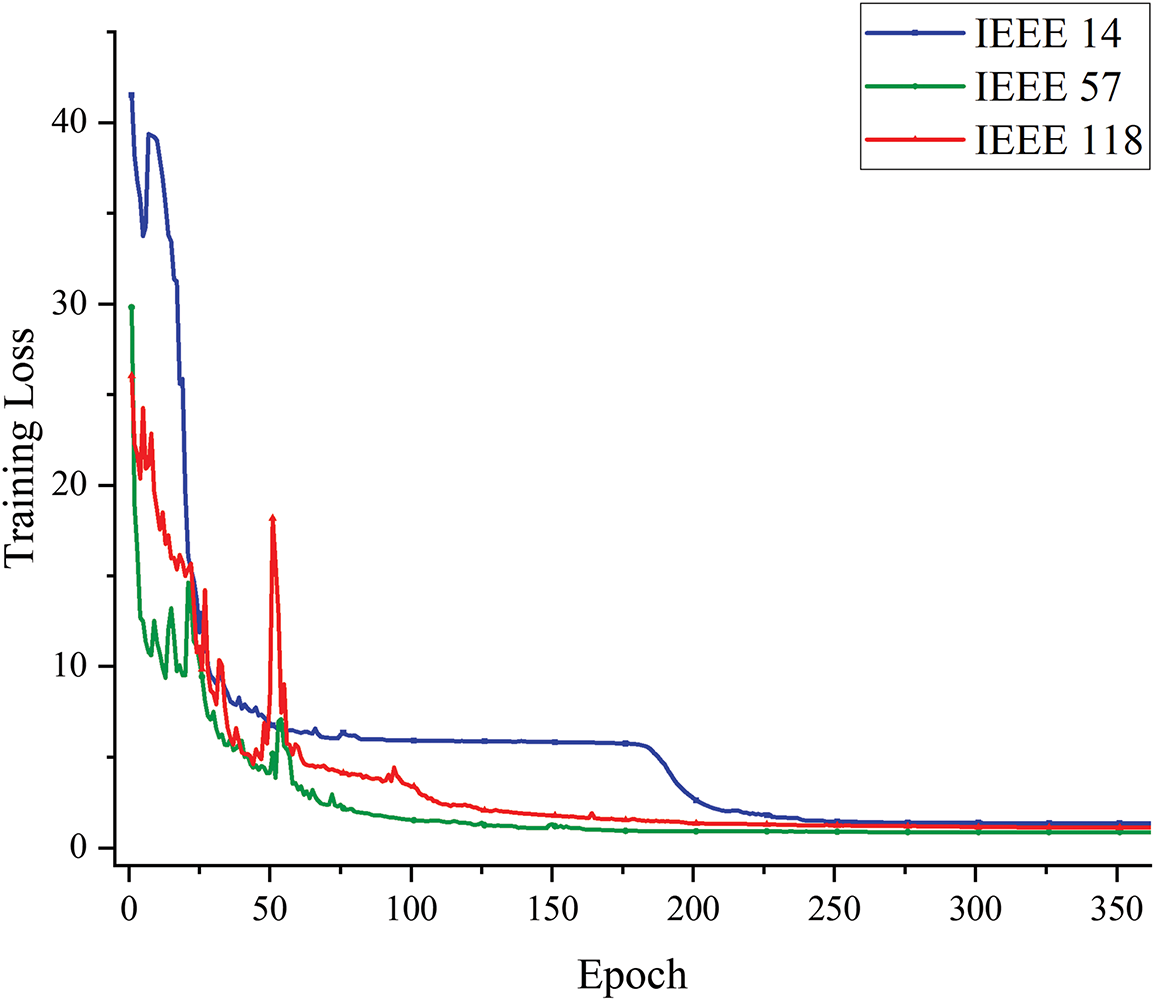
Figure 4: Loss variation during training for different bus systems
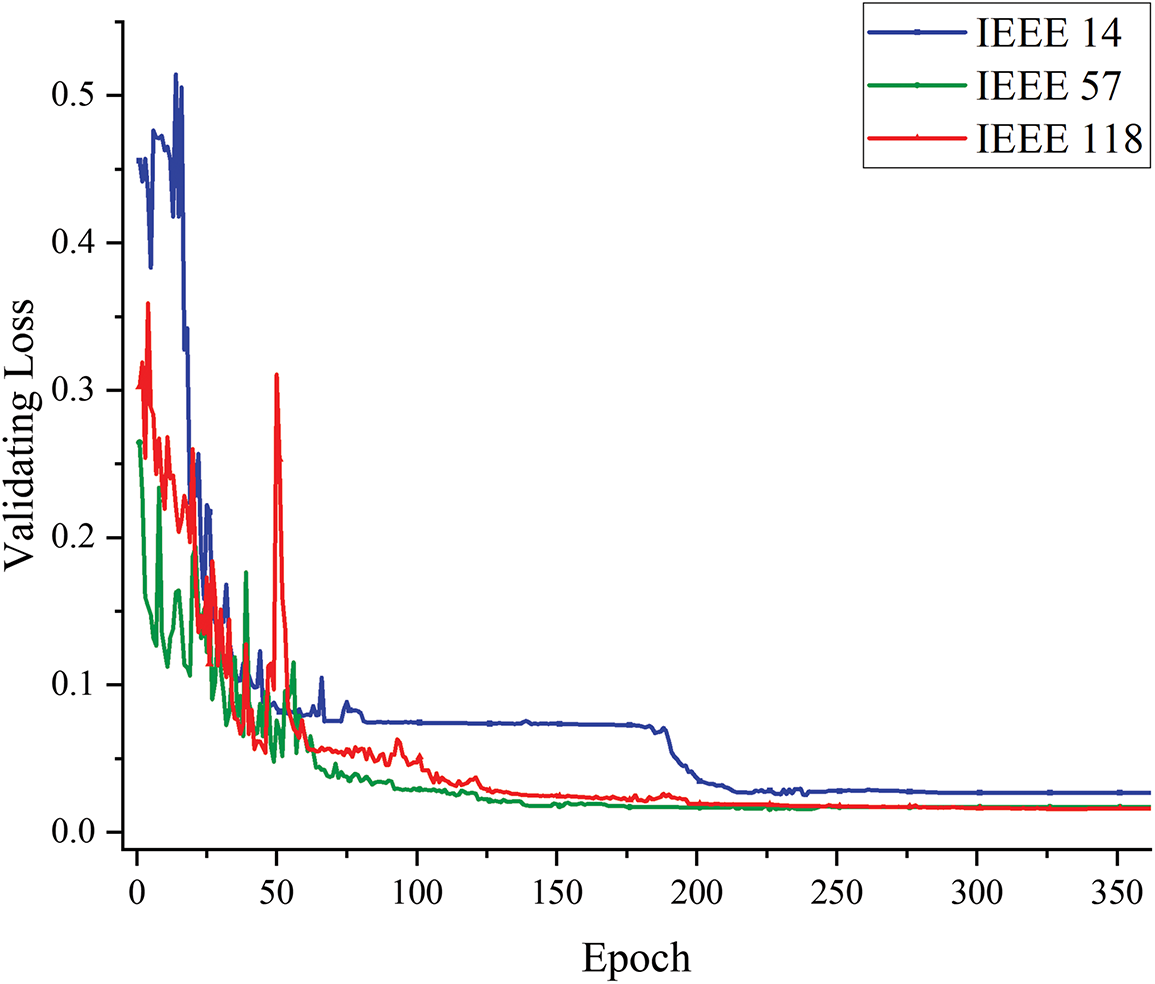
Figure 5: Loss variation during validating for different bus systems
4.3.2 Performance Comparison of the Models
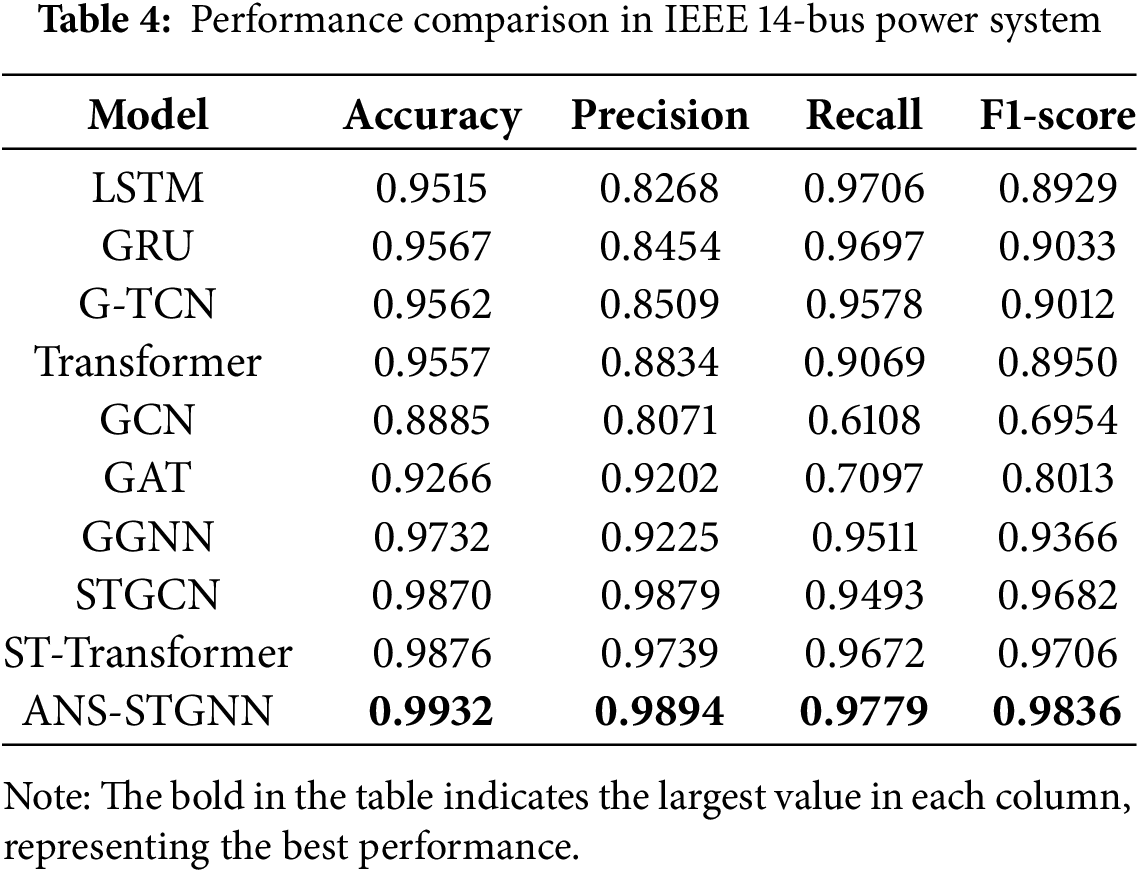
The following table summarizes the localization performance of different models for FDIA across each test system. As can be seen from Table 4, multiple algorithms are compared in the IEEE 14-bus system, among which ANS-STGNN achieves the highest performance in all four metrics, which are 0.9932, 0.9894, 0.9779 and 0.9836, respectively, indicating that the model has achieved the highest performance in the IEEE 14-bus system after combining the adaptive neighborhood selection, global feature fusion, gated temporal convolution, and graph convolution, and adopting relevant measures to reduce the risk of overfitting, fully captures the spatio-temporal correlations in the data and mines the hidden spatial correlations among the nodes, effectively enhancing the ability of attack localization.
Performance comparisons of the different models were also performed on two larger systems, the IEEE 57-bus system and the IEEE 118-bus system, with the results shown in Tables 5 and 6. The models achieved the highest results in accuracy, recall, and F1-score on both systems. It shows that ANS-STGNN can effectively adapt to power systems of varying sizes and structures while delivering outstanding performance.
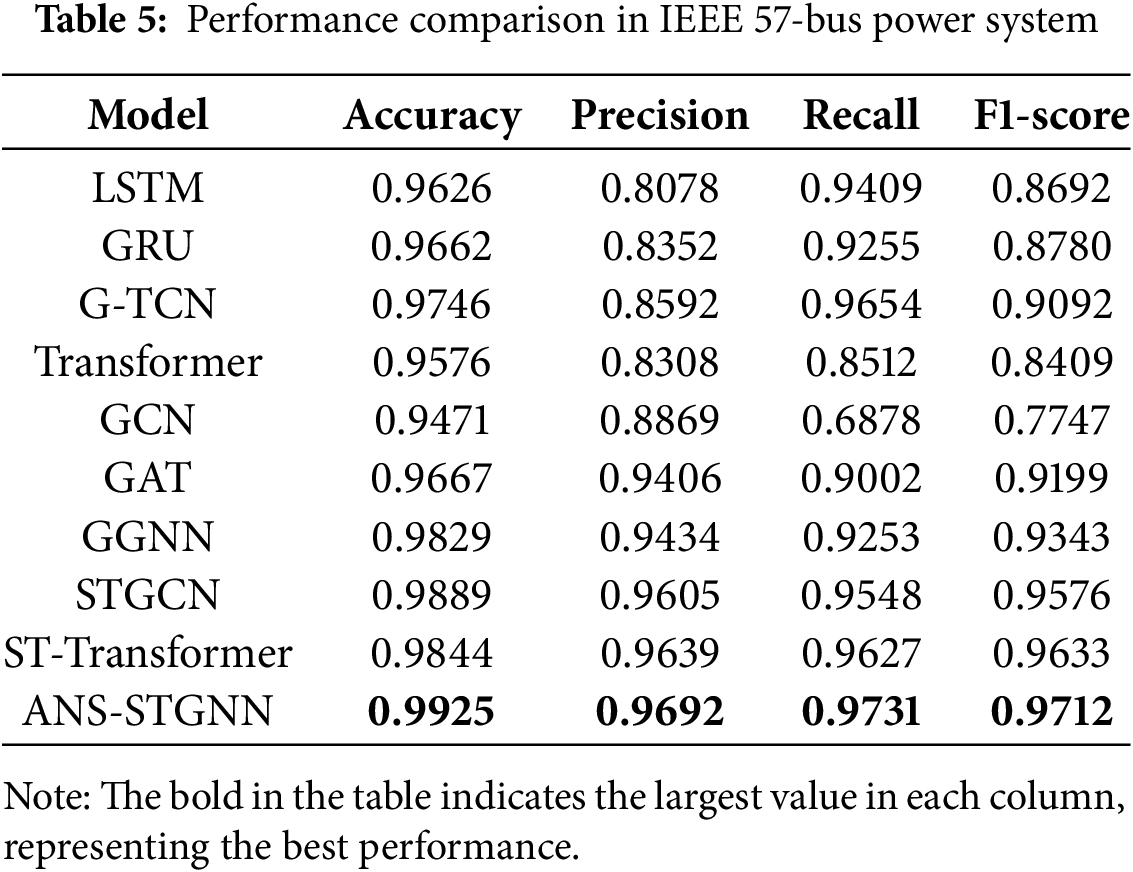
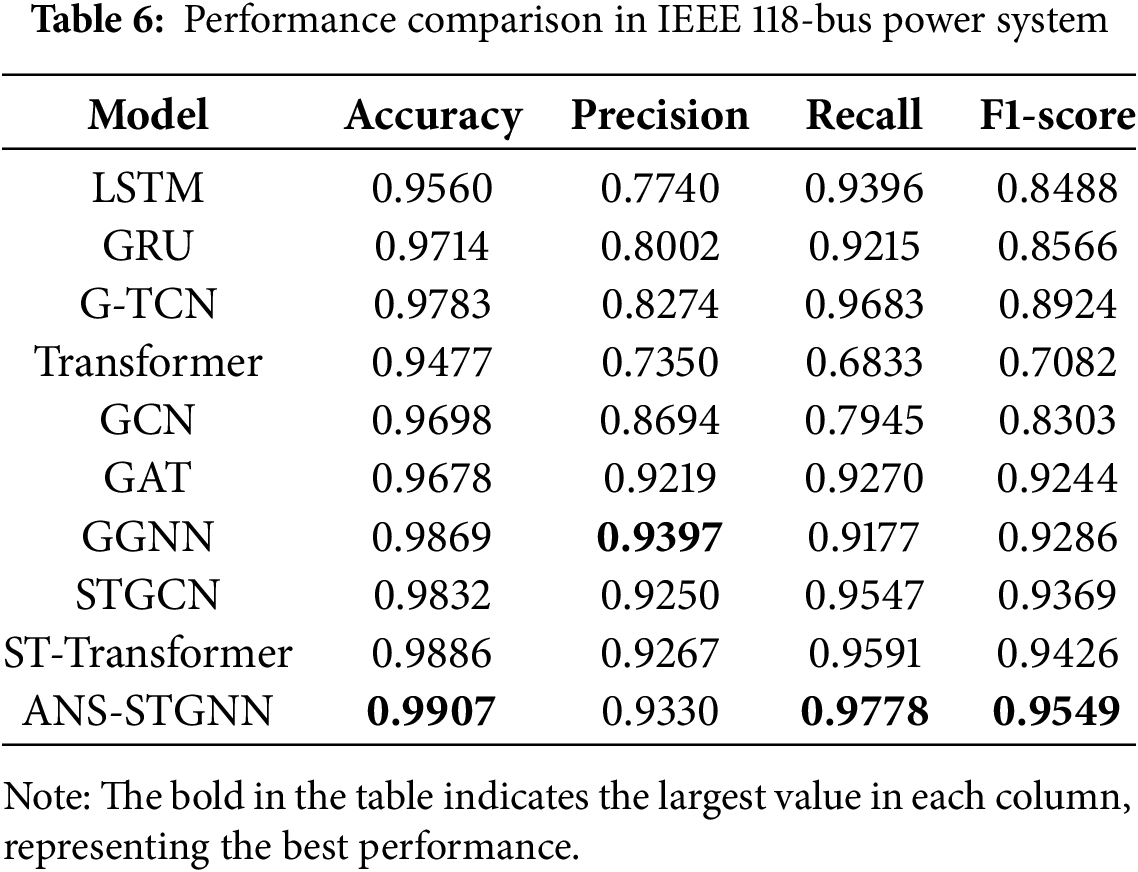
Overall, the temporal models LSTM, GRU, and G-TCN show higher recall across the three tested systems, but lower F1-score due to reduced precision. GCN and GAT demonstrate improved performance with increasing grid topology complexity, facilitating a more comprehensive capture of spatial correlations in the data. And ANS-STGNN consistently delivers high performance across all three systems, owing to its ability to extract a greater amount of available information.
4.3.3 Receiver Operating Characteristic (ROC) Curve of the Models
The ROC curve evaluates the effectiveness of a binary classification model by plotting the True Positive Rate (TPR) against the False Positive Rate (FPR) over a range of thresholds, reflecting its discriminative ability. For the IEEE 14-bus system, ROC curves and 3D waterfall plots for different models are shown in Fig. 6. TPR represents the proportion of correctly identified positive samples. FPR indicates the proportion of negative samples misclassified as positive. An optimal curve is close to the upper left corner, maximizing TPR while minimizing FPR. The Area Under the Curve (AUC) quantifies overall performance, with values closer to 1 indicating superior classification ability. As demonstrated in the figure, the ANS-STGNN model achieves the highest AUC, confirming its exceptional performance in attack localization tasks.
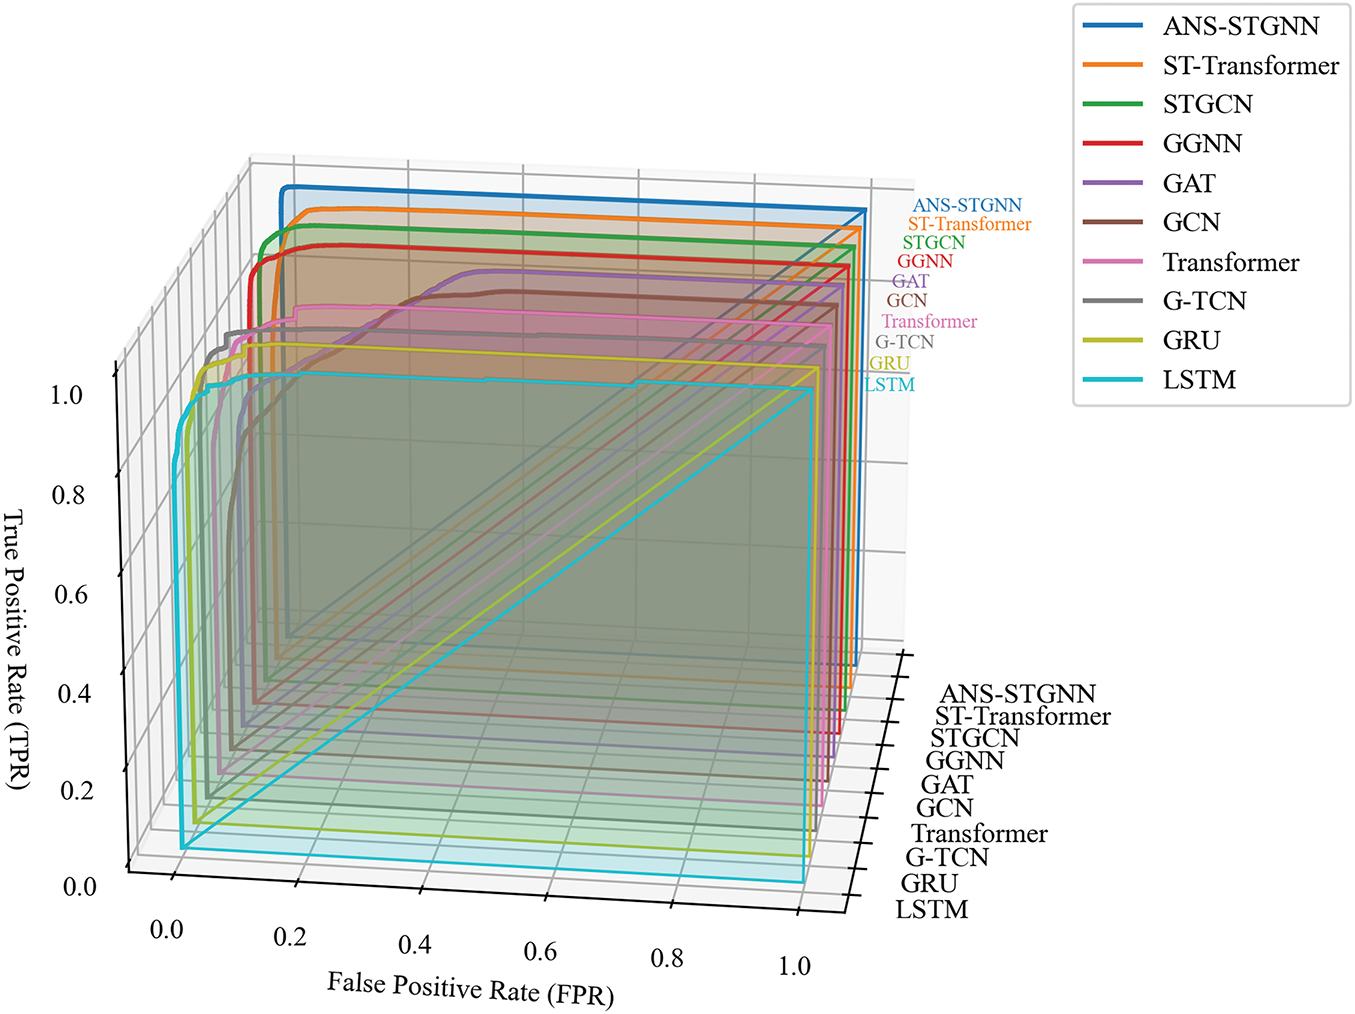
Figure 6: ROC curves of different models in IEEE 14-bus system
In the context of a larger-scale network, such as the IEEE 118-bus system, Fig. 7 compares the ANS-STGNN against GGNN, STGCN, and ST-Transformer models. The results demonstrate that even in this more complex network environment, the proposed ANS-STGNN model maintains superior localization performance relative to these alternative approaches.
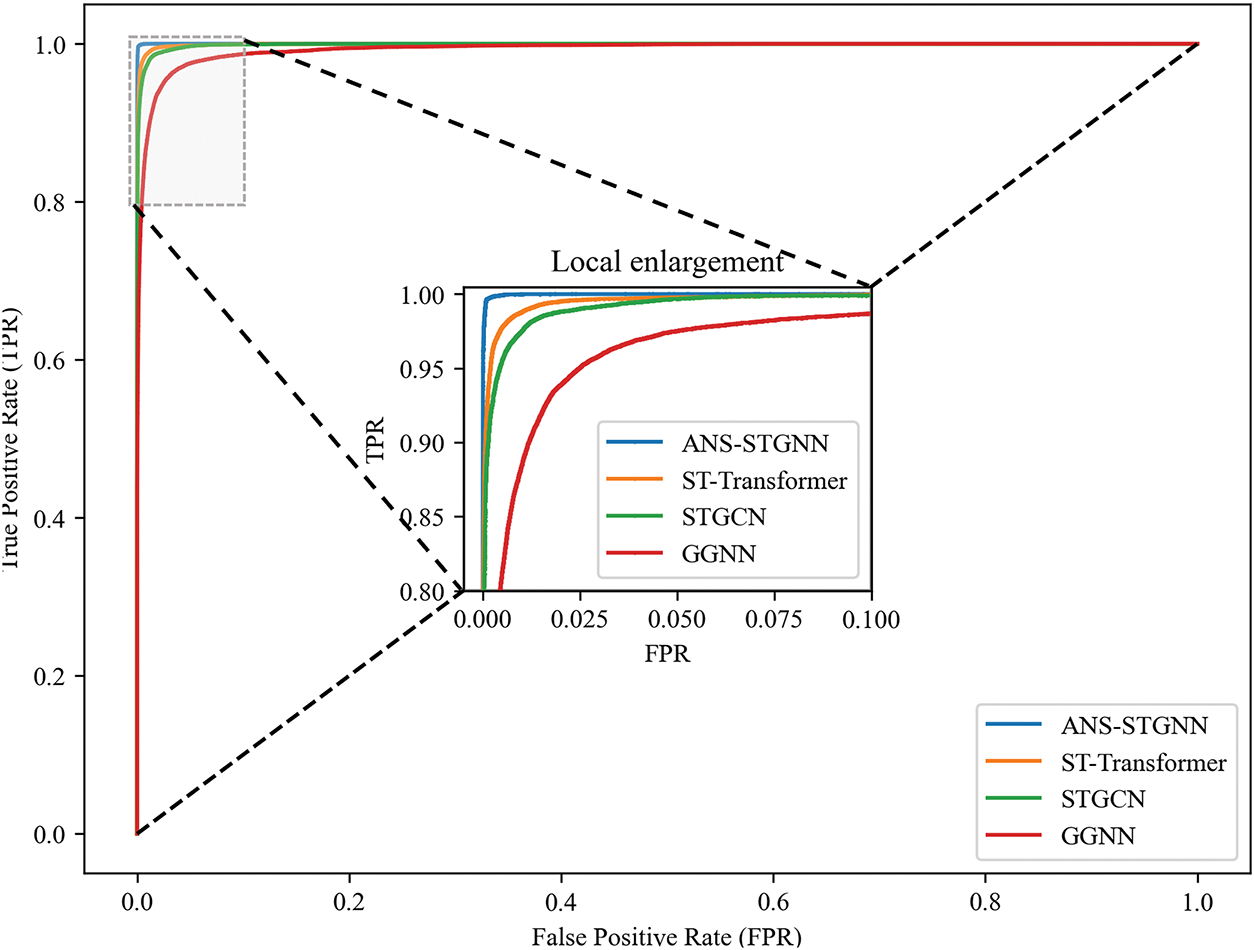
Figure 7: ROC curves of different models in IEEE 118-bus system
To verify the effectiveness of different modules in the proposed model for FDIA localization, ablation experiments are conducted on IEEE 14, 57, and 118-bus systems, respectively. Ablation experiments are performed in four cases, and the results are illustrated in Fig. 8.
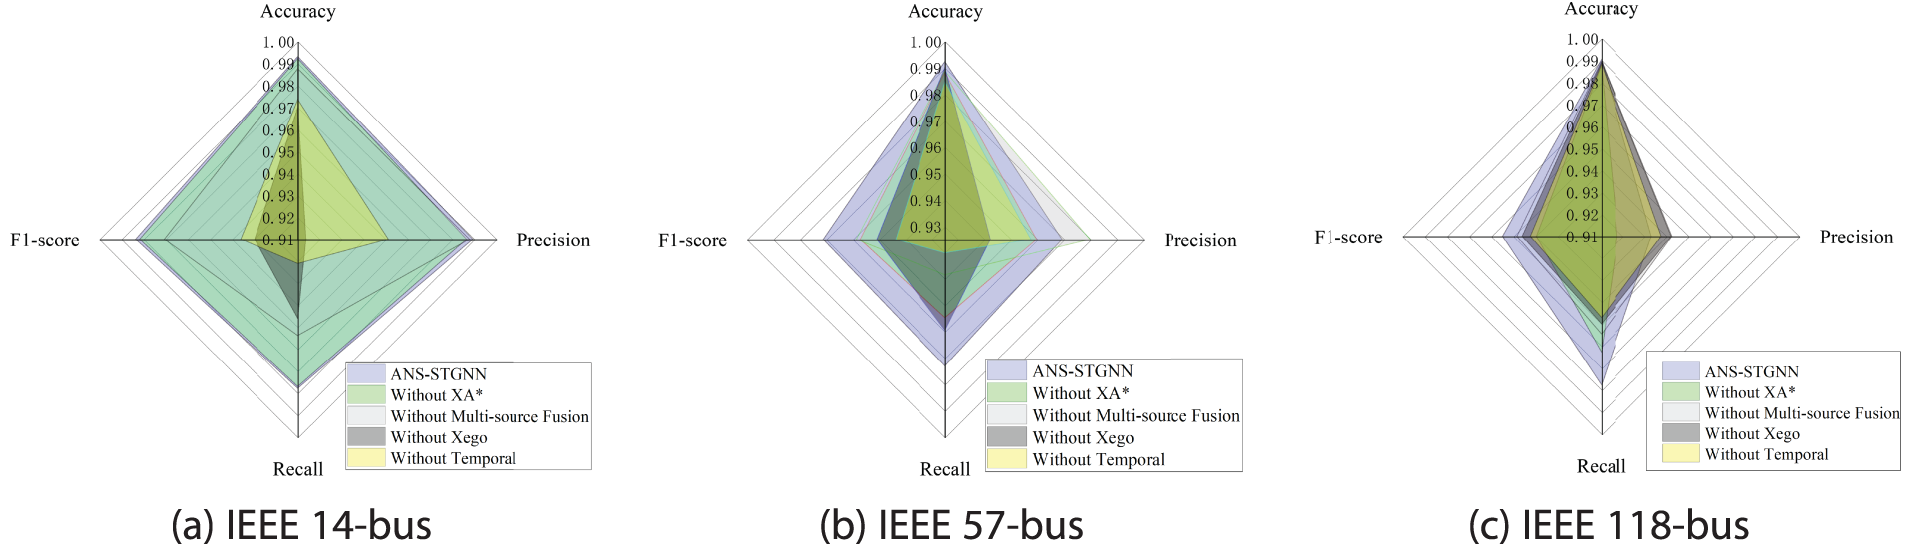
Figure 8: Comparison of ablation experiments results on different bus systems
When the adaptive neighbor embedding is removed from the final node representation, and the spatial feature extraction relies solely on the graph convolution based on physical topology, the F1-score of the model on the three systems decrease by 0.0018, 0.014, and 0.0153, respectively. This suggests that the hidden associations between nodes, uncovered by the adaptive neighbor selection, play an increasingly significant role in attack localization as topological complexity grows. Similarly, when the multi-source fusion module is removed, the F1-score of the model on the three systems drop by 0.013, 0.0125, and 0.0065, indicating that this module is particularly crucial for enhancing performance in systems with simpler graph structures. Removing the node self-embedding results in F1-score reductions of 0.054, 0.0203, and 0.0088 across the three systems. This highlights that a node’s intrinsic features play a more prominent role in systems with simpler topologies, whereas neighborhood information becomes more significant as network complexity increases. Lastly, when the temporal feature extraction module is removed, the F1-score decline by 0.0477, 0.0276, and 0.0126. Given the strong temporal correlation inherent in grid data, the absence of temporal feature extraction inevitably impairs performance. each module within ANS-STGNN plays a distinct and essential role, collectively enabling the model to effectively capture deep features and significantly enhance its ability to localize FDIAs.
4.5 Effect of Adaptive Neighborhood Selection on Localization Performance
Adaptive neighborhood selection empowers the model to discover potential spatial correlations between nodes that extend beyond physical topological connections within the data. For the IEEE 14-bus system, Fig. 9a,b displays the edge weights of the adjacency matrix from the grid admittance matrix and the adaptive adjacency matrix generated at a specific time. Physically unconnected nodes may show similarity after computation, while some existing physical connections may introduce less valuable information during neighbor aggregation.
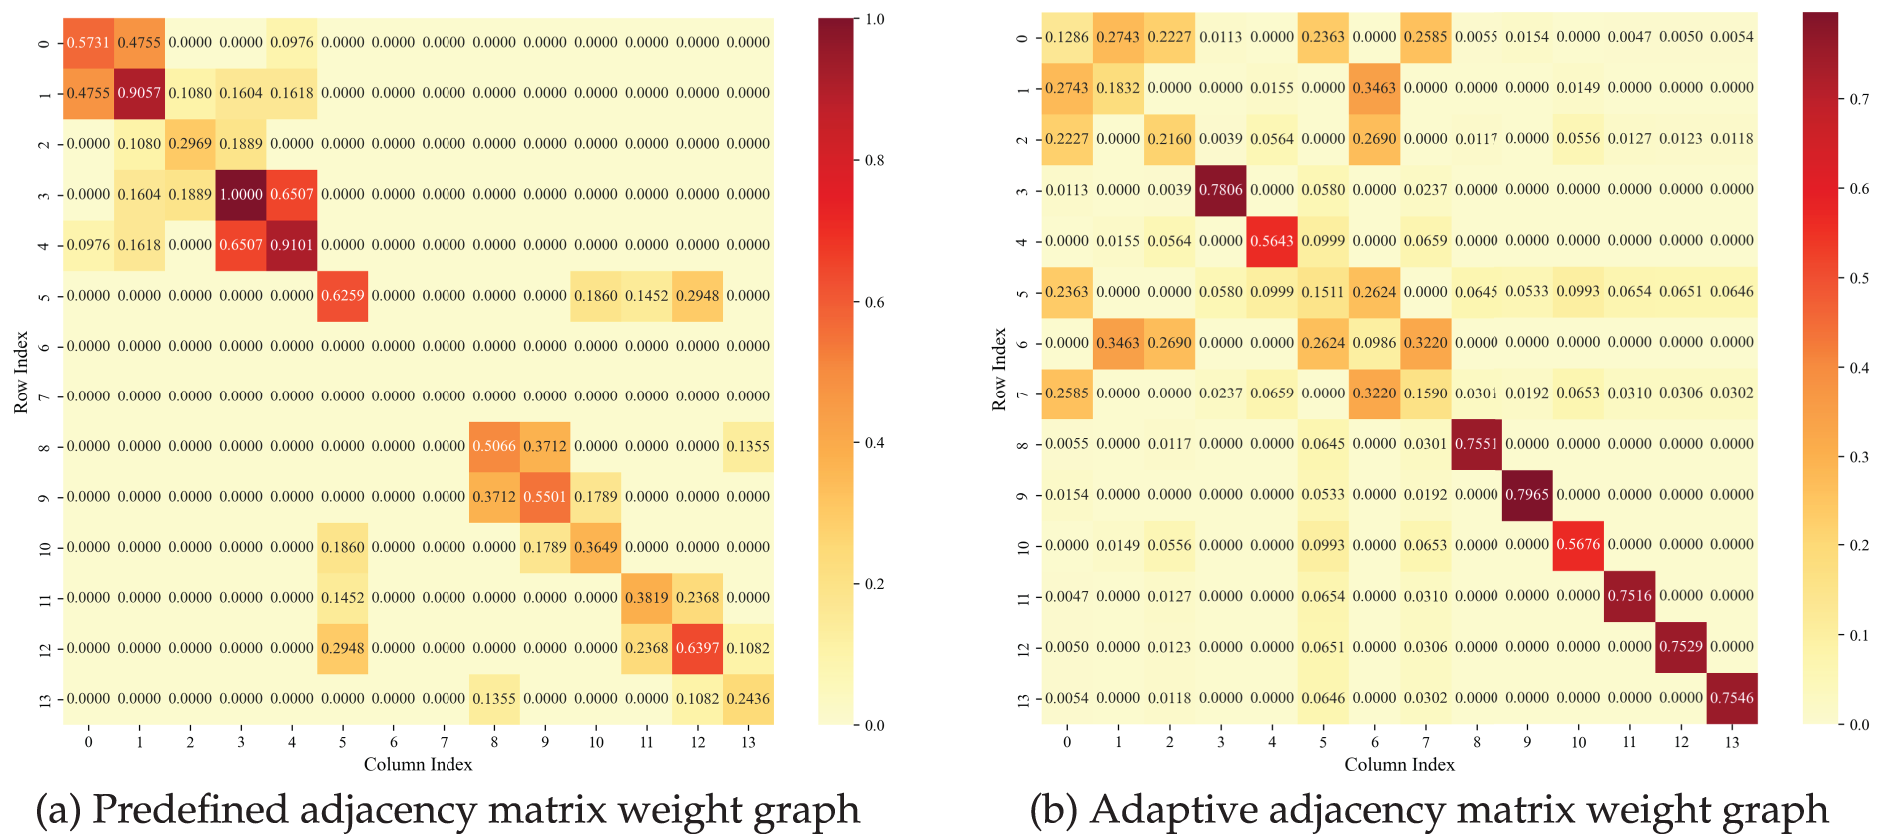
Figure 9: Adjacency matrix weight graph of IEEE 14-bus system
In the Adaptive Neighborhood Selection module, the number of top scores
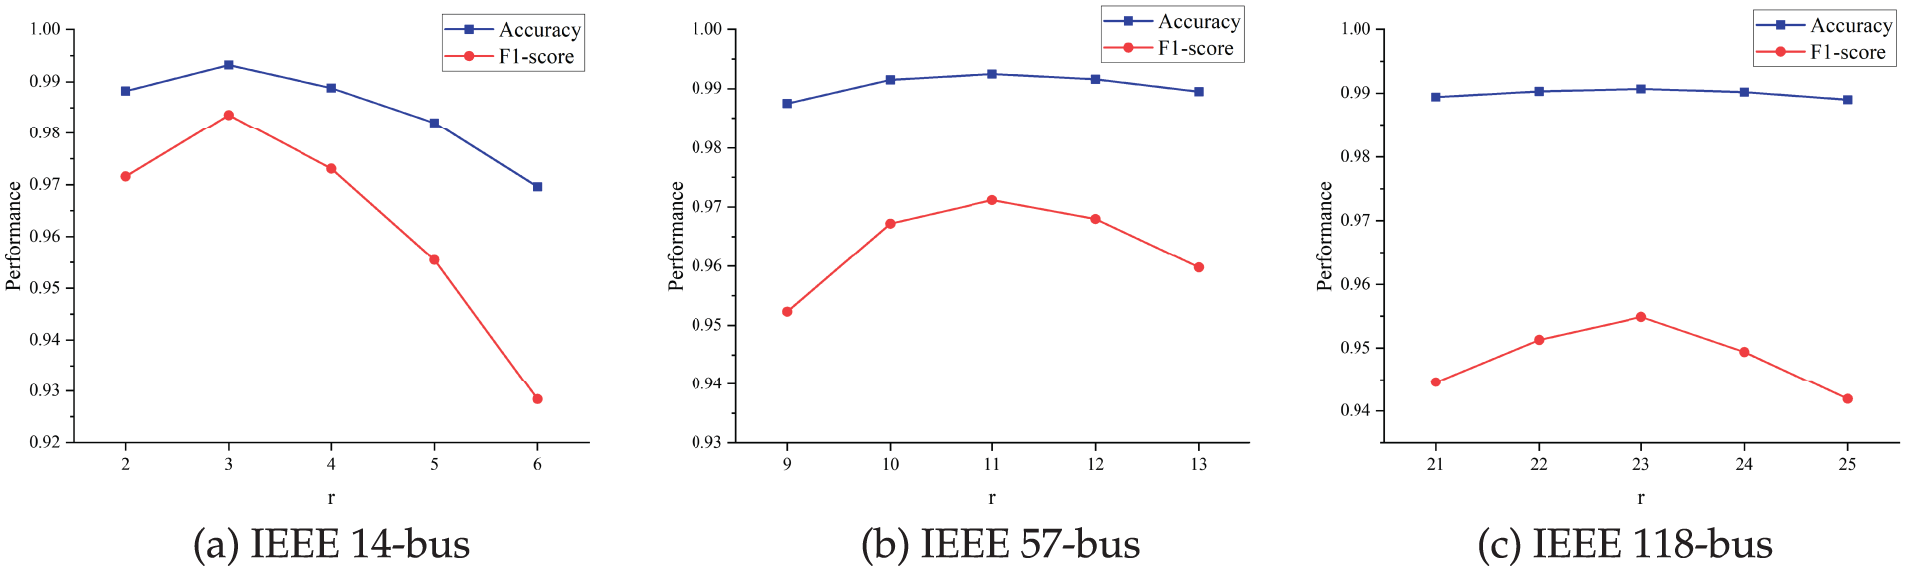
Figure 10: Relationship between F1-score and hyperparameter
Furthermore, by replacing the predefined adjacency matrix with the adaptive adjacency matrix in classical GCN and GAT models and evaluating their performance on the IEEE 14 and 118-bus systems, substantial improvements can be observed in Fig. 11a,b. Across both systems, most performance metrics improve, with the only exception being a slight decrease in precision for GCN. Specifically, the F1-score of GCN on the IEEE 14-bus system increases from 0.6954 to 0.7709. This indicates the adaptive matrix better captures spatial dependencies and local feature structures, adapting to dynamic data variations and enhancing system state perception.
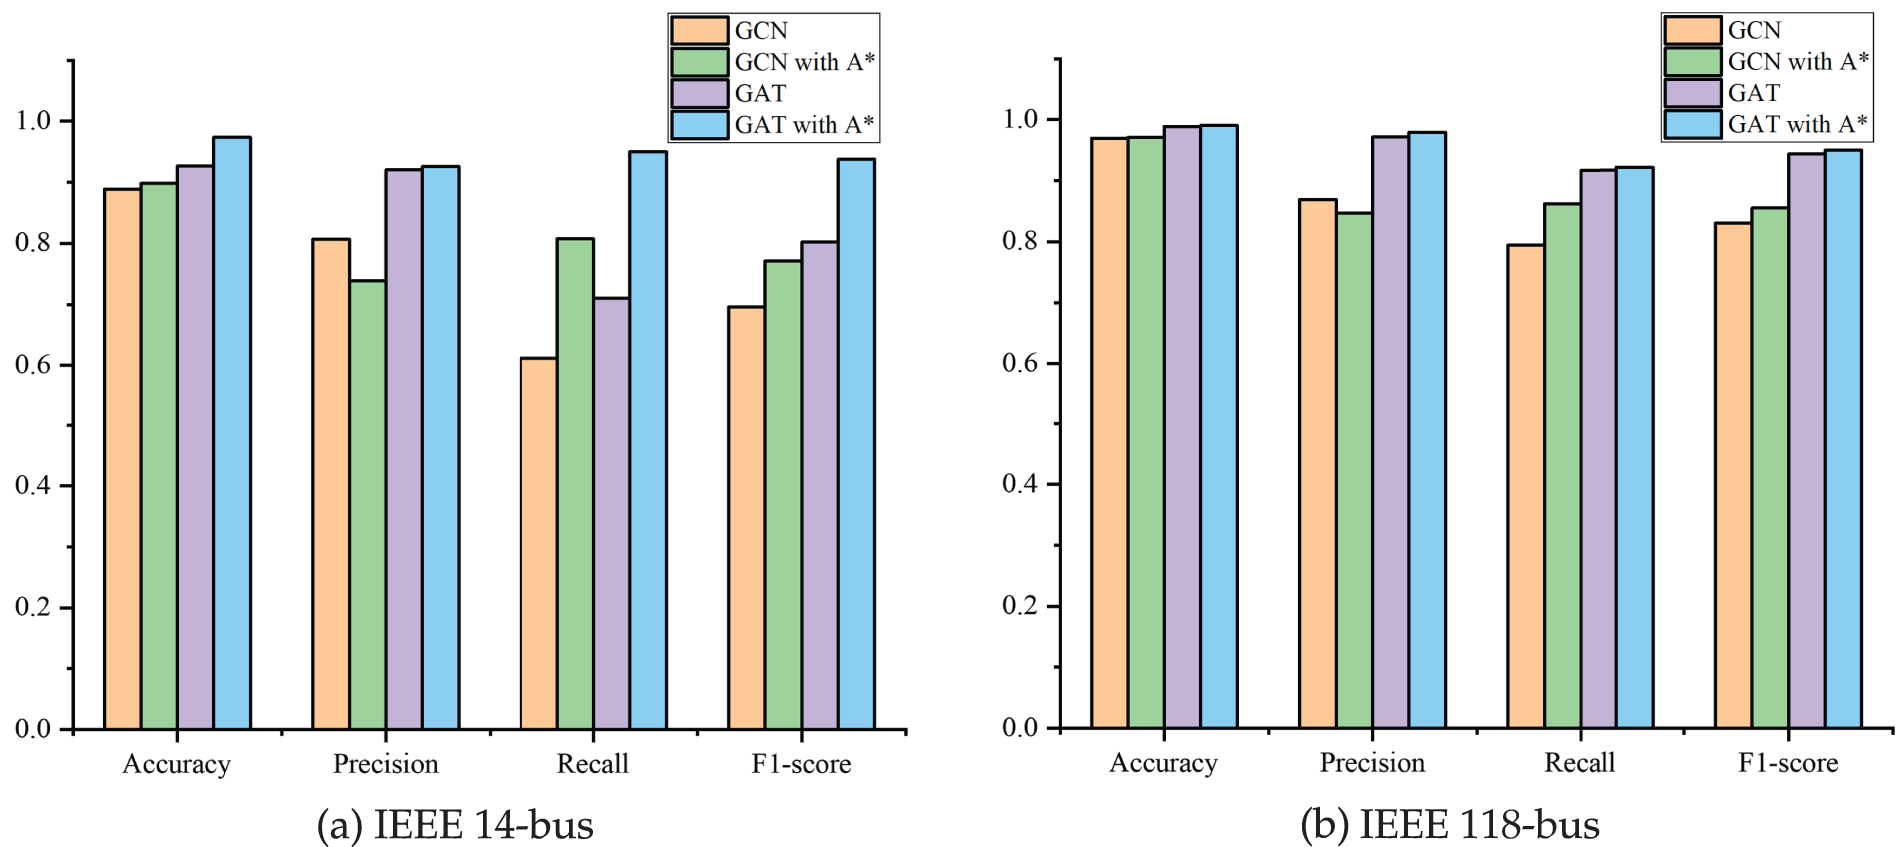
Figure 11: Effect of different adjacency matrices on attack localization in classic graph neural networks
4.6 Hyperparameters Study and Generalization Ability
This section presents the performance of the proposed model under different hyperparameter settings. The results indicate that the model’s robustness is not highly sensitive to specific parameter settings. Specifically, the effects of the hidden layer dimension and the number of attention heads in the multi-head self-attention mechanism are examined. Fig. 12a,b shows the model’s accuracy and F1-score across three systems under varying hidden layer dimensions. When the hidden dimension changes from 16 to 256, the model performance remains relatively stable, with fluctuations in accuracy and F1-score both within 0.015. Fig. 12c,d further analyzes the impact of the number of attention heads. As the number of heads increases from 2 to 10, the model’s performance generally shows a rising-then-declining trend, while the variation in accuracy and F1-score remains within 0.009. Notably, the slight performance degradation at larger head numbers can be attributed to the possibility that different attention heads may learn redundant or ineffective information, leading to an averaged attention distribution that is less effective at highlighting critical nodes or features.

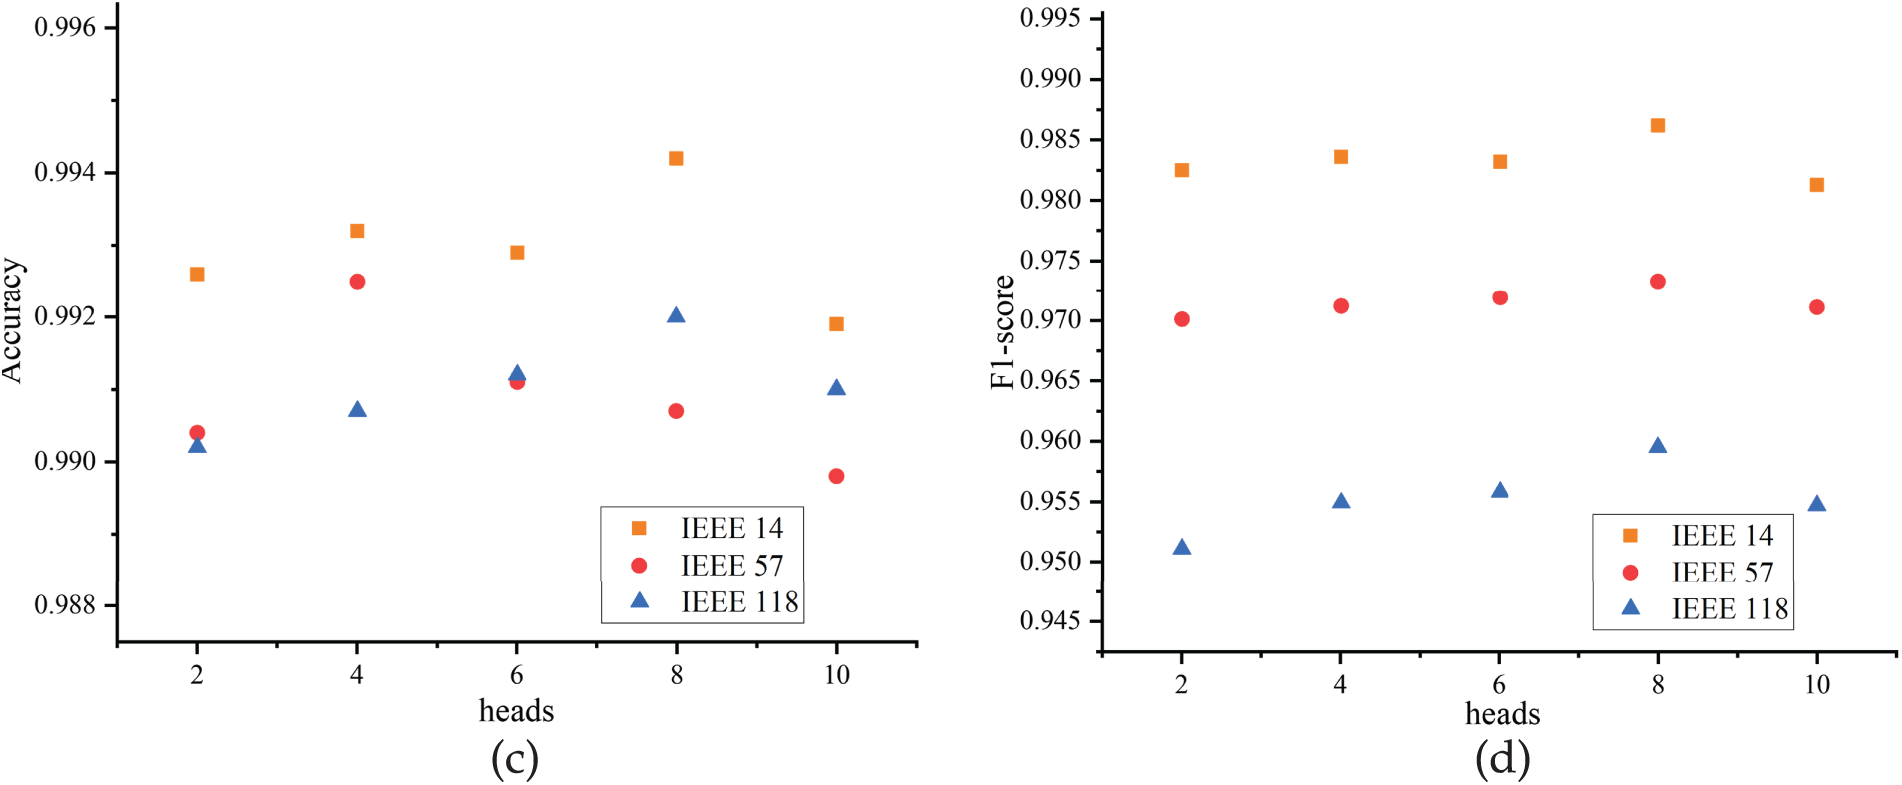
Figure 12: Model performance across different hyperparameters
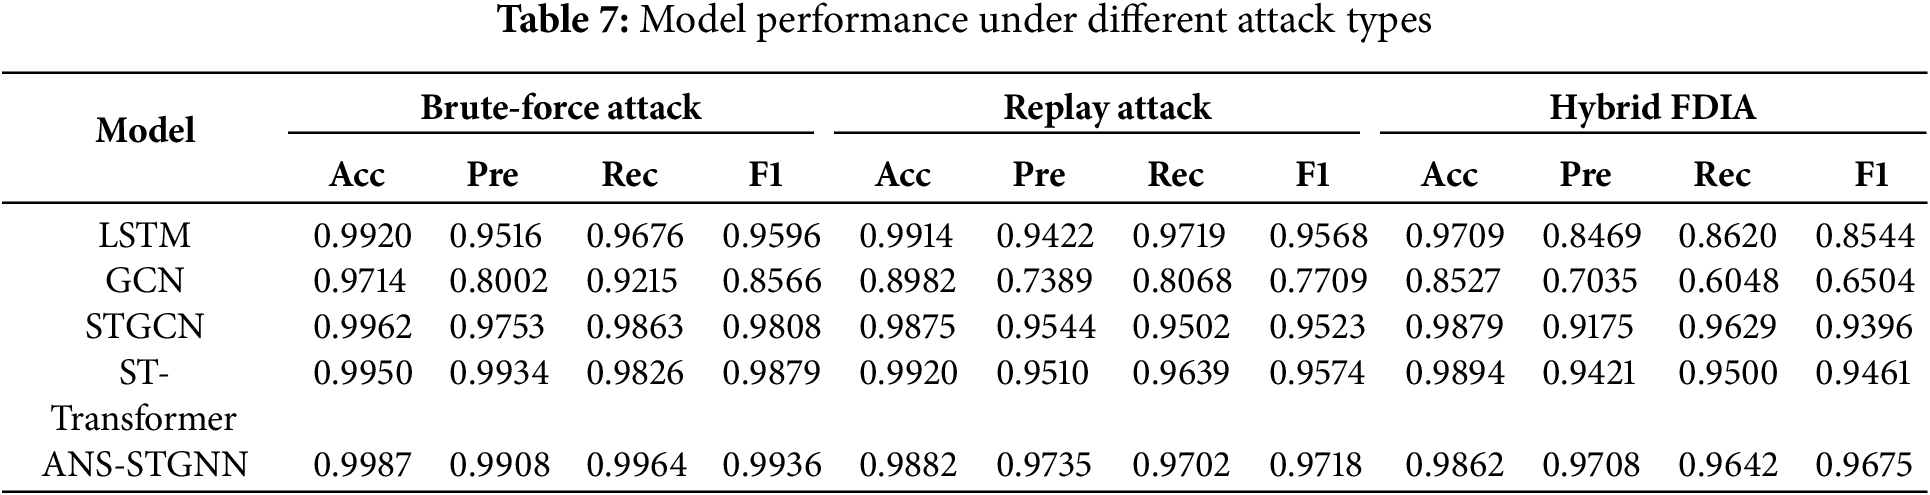
To evaluate the generalization capability of the proposed model, this section also presents a comparison of model performance under different types of attacks. Three types of attacks are introduced: brute-force attack, which directly tampers with node measurement values; replay attack, which modifies node measurement values to the same values from the previous time step; and hybrid FDIA, which combines stealthy FDIAs constructed based on formulas with data scaling attacks (multiplying values by numbers sampled from a uniform distribution between 0.95 and 1.05) while injecting them into normal operational data. Table 7 presents the performance of various models under these three attacks on the IEEE 14-bus system. It can be observed that for brute-force attacks, the model can accurately identify anomalous patterns. Replay attacks reuse historical data, aligning well with the strengths of temporal modeling and enabling the LSTM-based model to achieve strong performance. When facing hybrid FDIAs, the proposed model still demonstrates strong performance, indicating that the ANS-STGNN possesses excellent generalization capability and adaptability to different attack patterns.
In power systems, data measurements are frequently influenced by external noises from errors, communication instability, or equipment malfunctions, making noise-resistant models essential for accurate attack detection. Previous experiments used a dataset with Gaussian noise (mean of 0, standard deviation of 0.05). This section evaluates model robustness by introducing Gaussian noise (mean of 0, standard deviation ranging from 0.01 to 0.15) into the IEEE 14-bus system dataset, with F1-score comparisons shown in Fig. 13a. As noise intensity increases, model performance declines; however, ANS-STGNN shows a slower degradation rate and consistently higher F1-score, demonstrating strong robustness and stability against environmental noise.
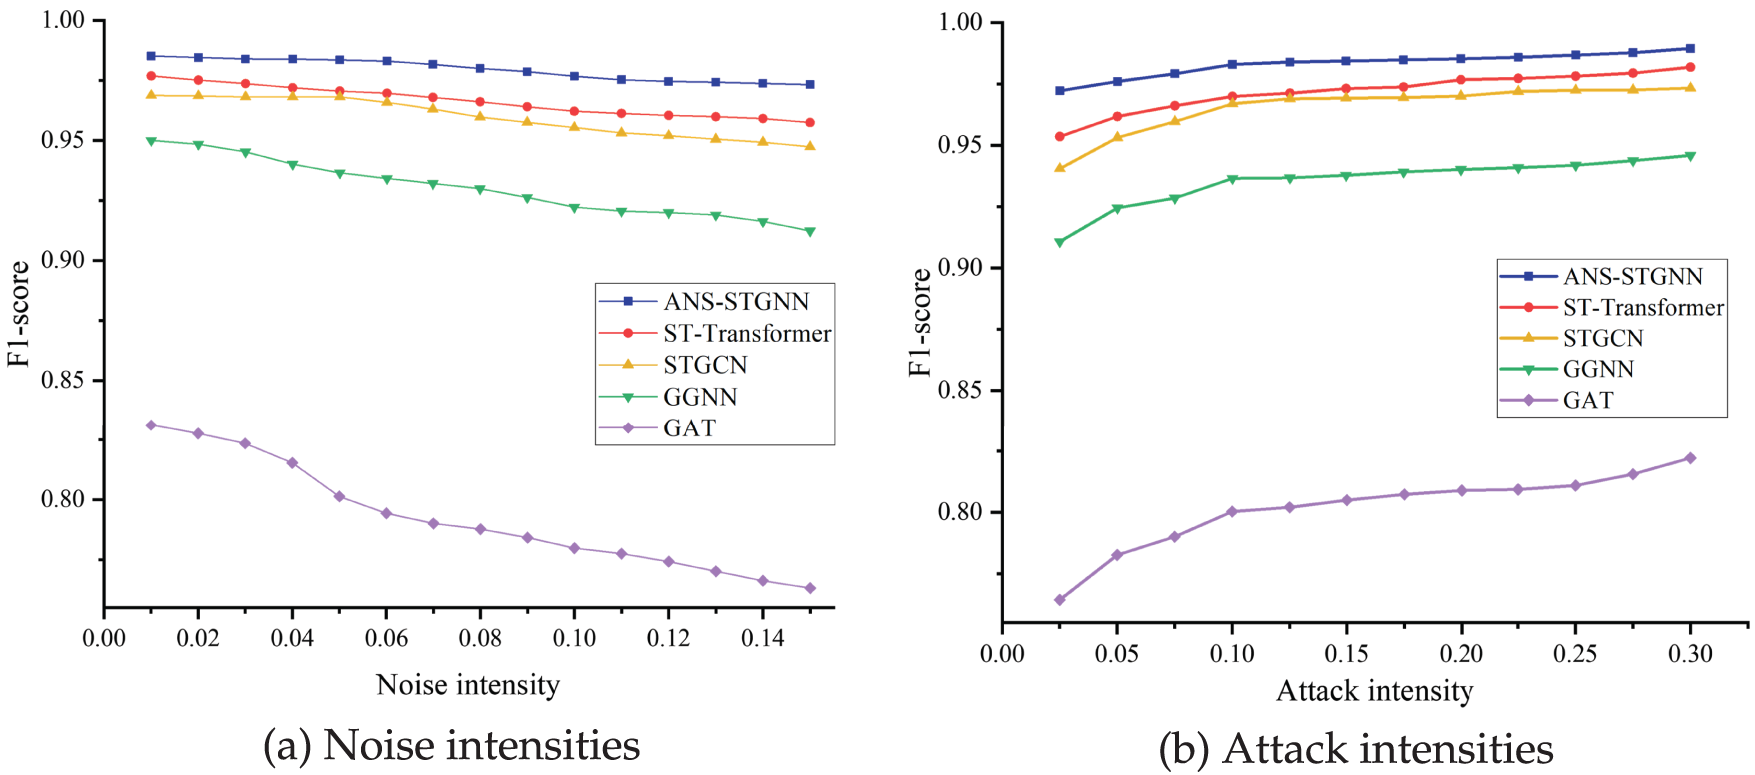
Figure 13: Effect of noise intensities and attack intensities on model localization performance
Moreover, the strength of FDIA is a critical factor in evaluating model robustness, defined as the difference between injected false data and actual measurements. A higher attack strength indicates greater deviation, while a lower one shows less. Previous experiments employed an attack strength of 0.1. To evaluate the impact of varying attack intensities, this study introduces attack strengths ranging from 0.025 to 0.30 in increments of 0.025 on the IEEE 14-bus system dataset, with F1-score comparisons presented in Fig. 13b. The F1-score for all five methods rises with rising attack intensity, as stronger attacks cause larger data deviations, thereby making attack features easier to detect. Among them, ANS-STGNN performs best across all intensities, achieving a high F1-score of 0.9723 even under low-strength attacks.
To precisely locate buses affected by FDIA in power grids, this paper proposes a novel localization method based on adaptive neighborhood selection and spatio-temporal feature fusion. The heterogeneous roles and environments of different buses create low node homogeneity in graph-based grid modeling, making direct aggregation solely based on physical topology suboptimal. To address this, this paper employs a multi-head self-attention mechanism to compute node similarities, adaptively select neighbors, and generate dynamic adjacency matrices, facilitating more reliable neighborhood aggregation. Furthermore, dilated causal convolution with a gating mechanism is utilized to extract long-range temporal dependencies while preventing gradient explosion. Spatial features are extracted by aggregating information through graph convolution from both the physical topology and adaptively selected neighborhoods. The fusion of these multi-source features generates highly robust node embeddings for accurate attack localization. Evaluated across the IEEE 14, 57, and 118-bus systems, the proposed ANS-STGNN model surpasses both classical and state-of-the-art methods, showcasing exceptional effectiveness and robustness in ablation studies, noise resilience tests, and scenarios with varying attack intensities. In this work, the adaptive neighborhood selection introduces computational complexity, and the model requires a large number of labeled samples for training, making it less effective in coping with emerging attacks under label-scarce conditions. Future work will focus on lightweighting the model and enhancing its adaptability to few-shot or even unlabeled scenarios.
Acknowledgement: Not applicable.
Funding Statement: This work is supported by National Key Research and Development Plan of China (No. 2022YFB3103304).
Author Contributions: The authors confirm contribution to the paper as follows: Conceptualization, Zehui Qi, Sixing Wu and Jianbin Li; methodology, Zehui Qi and Sixing Wu; software, Zehui Qi; validation, Zehui Qi; formal analysis, Zehui Qi and Sixing Wu; investigation, Zehui Qi; resources, Jianbin Li; data curation, Zehui Qi; writing—original draft preparation, Zehui Qi; writing—review and editing, Sixing Wu and Jianbin Li; visualization, Zehui Qi; supervision, Sixing Wu and Jianbin Li; project administration, Sixing Wu; funding acquisition, Sixing Wu. All authors reviewed the results and approved the final version of the manuscript.
Availability of Data and Materials: Data available on request from the authors.
Ethics Approval: Not applicable.
Conflicts of Interest: The authors declare no conflicts of interest to report regarding the present study.
References
1. Ghiasi M, Niknam T, Wang Z, Mehrandezh M, Dehghani M, Ghadimi N. A comprehensive review of cyber-attacks and defense mechanisms for improving security in smart grid energy systems: past, present and future. Elect Power Syst Res. 2023;215:108975. doi:10.1016/j.epsr.2022.108975. [Google Scholar] [CrossRef]
2. Bitirgen K, Filik ÜB. Markov game based on reinforcement learning solution against cyber-physical attacks in smart grid. Expert Syst Appl. 2024;255(2):124607. doi:10.1016/j.eswa.2024.124607. [Google Scholar] [CrossRef]
3. Wang L, Qu Z, Li Y, Hu K, Sun J, Xue K, et al. Method for extracting patterns of coordinated network attacks on electric power CPS based on temporal-topological correlation. IEEE Access. 2020;8:57260–72. doi:10.1109/access.2020.2982057. [Google Scholar] [CrossRef]
4. Haes Alhelou H, Hamedani-Golshan ME, Njenda TC, Siano P. A survey on power system blackout and cascading events: research motivations and challenges. Energies. 2019;12(4):682. doi:10.3390/en12040682. [Google Scholar] [CrossRef]
5. Li Y, Zhang M, Chen C. A deep-learning intelligent system incorporating data augmentation for short-term voltage stability assessment of power systems. Appl Energy. 2022;308(3):118347. doi:10.1016/j.apenergy.2021.118347. [Google Scholar] [CrossRef]
6. Liu Y, Ning P, Reiter MK. False data injection attacks against state estimation in electric power grids. ACM Trans Inf Syst Secur (TISSEC). 2011;14(1):1–33. doi:10.1145/1952982.1952995. [Google Scholar] [CrossRef]
7. Liang J, Sankar L, Kosut O. Vulnerability analysis and consequences of false data injection attack on power system state estimation. IEEE Trans Power Syst. 2015;31(5):3864–72. doi:10.1109/TPWRS.2015.2504950. [Google Scholar] [CrossRef]
8. Musleh AS, Chen G, Dong ZY. A survey on the detection algorithms for false data injection attacks in smart grids. IEEE Trans Smart Grid. 2019;11(3):2218–34. doi:10.1109/TSG.2019.2949998. [Google Scholar] [CrossRef]
9. Anwar A, Mahmood AN, Tari Z. Identification of vulnerable node clusters against false data injection attack in an AMI based smart grid. Inf Syst 2015;53(1):201–12. doi:10.1016/j.is.2014.12.001. [Google Scholar] [CrossRef]
10. Singh SK, Khanna K, Bose R, Panigrahi BK, Joshi A. Joint-transformation-based detection of false data injection attacks in smart grid. IEEE Trans Ind Inform. 2017;14(1):89–97. doi:10.1109/TII.2017.2720726. [Google Scholar] [CrossRef]
11. Khalid HM, Peng JCH. A Bayesian algorithm to enhance the resilience of WAMS applications against cyber attacks. IEEE Trans Smart Grid. 2016;7(4):2026–37. doi:10.1109/tsg.2016.2544854. [Google Scholar] [CrossRef]
12. Musleh AS, Khalid HM, Muyeen SM, Al-Durra A. A prediction algorithm to enhance grid resilience toward cyber attacks in WAMCS applications. IEEE Syst J. 2017;13(1):710–9. doi:10.1109/JSYST.2017.2741483. [Google Scholar] [CrossRef]
13. Wang X, Luo X, Zhang M, Jiang Z, Guan X. Detection and isolation of false data injection attacks in smart grid via unknown input interval observer. IEEE Int Things J. 2020;7(4):3214–29. doi:10.1109/jiot.2020.2966221. [Google Scholar] [CrossRef]
14. Lu M, Wang L, Cao Z, Zhao Y, Sui X. False data injection attacks detection on power systems with convolutional neural network. J Phys Conf Ser. 2020;1633(1):012134. doi:10.1088/1742-6596/1633/1/012134. [Google Scholar] [CrossRef]
15. Zhao Y, Jia X, An D, Yang Q. LSTM-based false data injection attack detection in smart grids. In: 2020 35th Youth Academic Annual Conference of Chinese Association of Automation (YAC). Zhanjiang, China: IEEE; 2020. p. 638–44. [Google Scholar]
16. He W, Liu W, Wen C, Yang Q. Detection of false data injection attacks on smart grids based on A-BiTG approach. Electronics. 2024;13(10):1938. doi:10.3390/electronics13101938. [Google Scholar] [CrossRef]
17. Wang S, Bi S, Zhang YJA. Locational detection of the false data injection attack in a smart grid: a multilabel classification approach. IEEE Int Things J. 2020;7(9):8218–27. doi:10.1109/jiot.2020.2983911. [Google Scholar] [CrossRef]
18. Wu T, Xue W, Wang H, Chung CY, Wang G, Peng J, et al. Extreme learning machine-based state reconstruction for automatic attack filtering in cyber physical power system. IEEE Trans Industr Inform. 2020;17(3):1892–904. doi:10.1109/TII.2020.2984315. [Google Scholar] [CrossRef]
19. Luo X, Li Y, Wang X, Guan X. Interval observer-based detection and localization against false data injection attack in smart grids. IEEE Int Things J. 2020;8(2):657–71. doi:10.1109/jiot.2020.3005926. [Google Scholar] [CrossRef]
20. Mukherjee D. A novel strategy for locational detection of false data injection attack. Sustain Energy Grids Netw. 2022;31(3):100702. doi:10.1016/j.segan.2022.100702. [Google Scholar] [CrossRef]
21. Mallikarjunaswamy S, Sharmila N, Siddesh GK, Nataraj KR, Komala M. A novel architecture for cluster based false data injection attack detection and location identification in smart grid. In: Advances in Thermofluids and Renewable Energy: Select Proceedings of TFRE 2020. Singapore: Springer Singapore; 2021. p. 599–611. [Google Scholar]
22. Li Y, Wang Y. Developing graphical detection techniques for maintaining state estimation integrity against false data injection attack in integrated electric cyber-physical system. J Syst Archit. 2020;105(6):101705. doi:10.1016/j.sysarc.2019.101705. [Google Scholar] [CrossRef]
23. Boyaci O, Umunnakwe A, Sahu A, Narimani MR, Ismail M, Davis KR, et al. Graph neural networks based detection of stealth false data injection attacks in smart grids. IEEE Syst J. 2021;16(2):2946–57. doi:10.1109/JSYST.2021.3109082. [Google Scholar] [CrossRef]
24. Boyaci O, Narimani MR, Davis K, Serpedin E. Cyberattack detection in large-scale smart grids using Chebyshev graph convolutional networks. In: 2022 9th International Conference on Electrical and Electronics Engineering (ICEEE). Alanya, Turkey: IEEE; 2022. p. 217–21. [Google Scholar]
25. Boyaci O, Narimani MR, Davis KR, Ismail M, Overbye TJ, Serpedin E. Joint detection and localization of stealth false data injection attacks in smart grids using graph neural networks. IEEE Trans Smart Grid. 2021;13(1):807–19. doi:10.1109/TSG.2021.3117977. [Google Scholar] [CrossRef]
26. Li X, Wang Y, Lu Z. Graph-based detection for false data injection attacks in power grid. Energy. 2023;263(5):125865. doi:10.1016/j.energy.2022.125865. [Google Scholar] [CrossRef]
27. Xia W, He D, Yu L. Locational detection of false data injection attacks in smart grids: a graph convolutional attention network approach. IEEE Int Things J. 2023;11(6):9324–37. doi:10.1109/jiot.2023.3323565. [Google Scholar] [CrossRef]
28. Li X, Hu L, Lu Z. Detection of false data injection attack in power grid based on spatial-temporal transformer network. Expert Syst Appl. 2024;238(2):121706. doi:10.1016/j.eswa.2023.121706. [Google Scholar] [CrossRef]
29. Han Y, Feng H, Li K, Zhao Q. False data injection attacks detection with modified temporal multi-graph convolutional network in smart grids. Comput Secur. 2023;124(1):103016. doi:10.1016/j.cose.2022.103016. [Google Scholar] [CrossRef]
30. Zhu J, Yan Y, Zhao L, Heimann M, Akoglu L, Koutra D. Beyond homophily in graph neural networks: current limitations and effective designs. Adv Neural Inf Process Syst. 2020;33:7793–804. [Google Scholar]
31. Li WZ, Wang CD, Xiong H, Lai J. Homogcl: rethinking homophily in graph contrastive learning. In: Proceedings of the 29th ACM SIGKDD Conference on Knowledge Discovery and Data Mining. Long Beach, CA, USA: Association for Computing Machinery; 2023. p. 1341–52. [Google Scholar]
32. Jiang M, Liu G, Su Y, Wu X. Self-attention empowered graph convolutional network for structure learning and node embedding. Pattern Recognit. 2024;153(3):110537. doi:10.1016/j.patcog.2024.110537. [Google Scholar] [CrossRef]
33. Debbi H. Causal explanation of convolutional neural networks. In: Machine Learning and Knowledge Discovery in Databases Research Track: European Conference; ECML PKDD 2021; 2021 Sep 13–17; Bilbao, Spain: Springer International Publishing. p. 633–49. [Google Scholar]
Cite This Article
 Copyright © 2025 The Author(s). Published by Tech Science Press.
This work is licensed under a Creative Commons Attribution 4.0 International License , which permits unrestricted use, distribution, and reproduction in any medium, provided the original work is properly cited.
 Downloads
 Citation Tools