
 Submit a Paper
 Propose a Special lssue
 Open Access
ARTICLE
Dynamic Interaction-Aware Trajectory Prediction with Bidirectional Graph Attention Network
School of Computer Science and Information, Anhui Polytechnic University, Wuhu, 241000, China
* Corresponding Authors: Jun Li. Email: ; Kai Xu. Email:
#These authors contributed equally to this work
Computers, Materials & Continua 2025, 85(2), 3349-3368. https://doi.org/10.32604/cmc.2025.067316
Received 29 April 2025; Accepted 17 July 2025; Issue published 23 September 2025
 View Full Text
 Download PDF
Abstract
Pedestrian trajectory prediction is pivotal and challenging in applications such as autonomous driving, social robotics, and intelligent surveillance systems. Pedestrian trajectory is governed not only by individual intent but also by interactions with surrounding agents. These interactions are critical to trajectory prediction accuracy. While prior studies have employed Convolutional Neural Networks (CNNs) and Graph Convolutional Networks (GCNs) to model such interactions, these methods fail to distinguish varying influence levels among neighboring pedestrians. To address this, we propose a novel model based on a bidirectional graph attention network and spatio-temporal graphs to capture dynamic interactions. Specifically, we construct temporal and spatial graphs encoding the sequential evolution and spatial proximity among pedestrians. These features are then fused and processed by the Bidirectional Graph Attention Network (Bi-GAT), which models the bidirectional interactions between the target pedestrian and its neighbors. The model computes node attention weights (i.e., similarity scores) to differentially aggregate neighbor information, enabling fine-grained interaction representations. Extensive experiments conducted on two widely used pedestrian trajectory prediction benchmark datasets demonstrate that our approach outperforms existing state-of-the-art methods regarding Average Displacement Error (ADE) and Final Displacement Error (FDE), highlighting its strong prediction accuracy and generalization capability.Keywords
Pedestrian trajectory prediction aims to forecast a pedestrian’s future path based on their historical movement information. In recent years, this task has found wide application across various domains, including autonomous driving [1–3], intelligent transportation systems [4–6], robotic navigation [7,8], and video surveillance [9]. Accurate trajectory prediction is essential in autonomous driving to ensure vehicular safety in complex traffic scenarios. Despite its significance, pedestrian trajectory prediction remains a challenging task due to the complexity of social interactions, the diversity of spatio-temporal environments, and the varying intentions of individual pedestrians.
In practical scenarios, autonomous driving and robotic systems require precise trajectory prediction to guarantee both safety and operational efficiency. In the early stages, physical and dynamic models were widely adopted, relying on handcrafted rules and mathematical formulations for trajectory estimation [10,11]. While they offered reliable short-term predictions, their rigidity hindered adaptation to complex scenarios. To overcome this, statistical learning-based approaches were introduced [12,13], aiming to improve adaptability by learning from historical trajectory data.
However, statistical methods are constrained by linear assumptions and struggle to capture the nonlinear and complex nature of pedestrian behaviors, often leading to reduced prediction accuracy. With the rapid development of deep learning, more effective modeling techniques have emerged. Recurrent Neural Networks (RNNs) demonstrate strong capabilities in handling sequential data. Nevertheless, their inherently sequential structure leads to high computational complexity and slow training speed [14]. In contrast, CNNs provide a lightweight and efficient alternative with fewer parameters [15,16]. However, they often struggle to capture complex social interactions in crowded scenes, which limits their performance. To overcome this limitation, some studies represent pedestrian interactions as unstructured data and use GCNs to model relational dependencies. GCNs are well suited for this task, as they aggregate information from neighboring nodes and learn structured interaction features. One key limitation of standard GCNs is their uniform weighting of neighboring node information, which assumes that all surrounding pedestrians exert equal influence on the target agent. This assumption is often unrealistic. For example, pedestrians walking in opposite directions tend to influence the target pedestrian more significantly than those moving in the same direction.
In addition, pedestrian movements are not only influenced by their neighbors, but also feed back and influence others in return—forming complex, bidirectional, and temporally evolving social dynamics. However, most existing methods still rely on a unidirectional modeling paradigm, where only the influence of surrounding pedestrians on the target agent is considered. This simplification overlooks the inherently asymmetric and mutual nature of human interactions. For example, models such as Social-LSTM [17], Social-GAN [18], and Sophie [19] use pooling mechanisms to aggregate neighbor information into a social context vector for predicting the target trajectory. While pooling mechanisms can capture general social context, they often suppress fine-grained interactions and bias the model toward a small subset of salient neighbors, potentially overlooking less obvious yet influential neighbors.
To address these limitations, we propose a novel Dynamic Interaction-Aware with Bidirectional Graph Attention Network, termed DIABiGAT. Our approach begins by constructing separate temporal and spatial graphs to model the dynamic evolution of pedestrian trajectories and their social interactions, respectively. The temporal graph captures motion transitions over time, whereas the spatial graph focuses on inter-pedestrian relationships at each time step.
We further introduce a Frequency-domain Feature Construction Module (FFCM), which extracts multi-scale local features and transforms them into the frequency domain to capture global trends. This enhances the model’s ability to jointly represent local motion patterns and long-range temporal dependencies. Sparse adjacency matrices are constructed to explicitly define the graph topology, and a Bidirectional Graph Attention Network (Bi-GAT) is employed to model inter-node dependencies and generate socially-aware attention features. Finally, the outputs from both graphs are fused and decoded using a stacked Temporal Convolutional Network (TCN) to accurately predict future pedestrian trajectories. An overview of the proposed framework is illustrated in Fig. 1.

Figure 1: The overall framework of the model
The main contributions of this paper are summarized as follows:
• We propose a Frequency-domain Feature Construction Module (FFCM) that transforms trajectory features into the frequency domain after extracting local details. This enables the joint modeling of local and global information, addressing the short-term memory limitations of conventional temporal models and enhancing long-range dependency modeling.
• We develop a Bidirectional Graph Attention Network (Bi-GAT) that focuses on modeling asymmetric social interactions among pedestrians by constructing sparse spatial graphs. Unlike conventional GATs that assign a single attention score per edge, Bi-GAT computes direction-specific attention from both the source and target perspectives, enabling more accurate and context-aware representation of interpersonal influence in complex scenes.
• We incorporate a stacked TCN in the prediction module to enhance temporal feature extraction across multiple layers. This improves the model’s ability to learn temporal dependencies and significantly boosts prediction accuracy.
The remaining structure of the paper is as follows: Section 2 discusses the related works, Section 3 provides a detailed description of the implementation of DIABiGAT, Section 4 presents the experimental setup and results, and Section 5 summarizes the entire paper.
Traditional trajectory prediction methods have gradually been replaced by deep learning approaches due to their poor generalization capabilities. RNNs have demonstrated remarkable effectiveness in handling sequential information but face limitations in modeling long-range dependencies [20]. To address this issue, improved models such as Long Short-Term Memory (LSTM) networks and Gated Recurrent Units (GRUs) have been proposed, which show excellent performance in modeling long-range sequences [21]. Pedestrian trajectory prediction can be regarded as a sequence modeling problem, and thus, the aforementioned models have been widely applied in this field. For example, the most representative work, Social-LSTM, proposed by Alahi et al. [17], utilized LSTM for pedestrian trajectory prediction and introduced the concept of Social Pooling to model the social relationships between pedestrians, significantly improving prediction accuracy. Although the improved RNNs models perform well in handling sequential problems, their ability to model spatial relationships is limited. In contrast, CNNs have an advantage in capturing spatial features. In pedestrian trajectory prediction, the spatial dimension typically refers to the social interactions between pedestrians.
One of the key challenges in spatio-temporal modeling is the entanglement of spatial and temporal information, which can negatively affect prediction performance. To address this issue, Chen et al. [22] proposed a Deformable Spatio-Temporal Convolutional Neural Network (DSTCNN), which effectively mitigates the spatio-temporal entanglement problem and enhances the accuracy of spatio-temporal interaction modeling. Additionally, Yoon et al. [23] introduced a novel CNN-based architecture tailored for human trajectory prediction. Their approach applies 2D convolutions directly to raw trajectory coordinates, enabling more refined and precise trajectory modeling.
Generative models are often employed to address the uncertainty inherent in multi-trajectory prediction. Their core principle lies in learning an internal probability distribution to generate data with similar characteristics. In pedestrian trajectory prediction, generative models learn the latent distribution of future trajectories, thereby producing multiple representative samples to better capture potential motion trends. This enhances both the accuracy and robustness of predictions.
The introduction of Generative Adversarial Networks (GANs) has brought a new research perspective to this task. Gupta et al. [18] were the first to apply the GAN framework to pedestrian trajectory prediction, introducing a Social Pooling Layer to effectively model pedestrian interactions and generate socially compliant, diverse trajectories. The success of Social-GAN has spurred a surge of GAN-based methods [24–26], and other variants. These approaches have alleviated, to some extent, the limitations of traditional methods in handling trajectory uncertainty. However, GAN-based models inherently suffer from mode collapse, making it difficult to cover the full range of plausible trajectory samples. As a result, researchers have explored alternative generative models, such as Conditional Variational Autoencoders (CVAEs) and Diffusion Models, to further improve the diversity and accuracy of multimodal trajectory prediction.
The Conditional Variational Autoencoder (CVAE), a type of generative model, learns a latent distribution based on historical trajectories, explicitly modeling the distributional properties of future target trajectories. Unlike traditional deterministic approaches, CVAEs allow latent space sampling to generate multiple plausible future trajectories, capturing the inherent uncertainty in pedestrian motion. In pedestrian trajectory prediction tasks, CVAEs exhibit strong multimodal modeling capabilities. CVAE-based methods condition the learning of latent variables on observed historical trajectories, guiding the generation of diverse future trajectories that are consistent with past movement patterns. Representative works include [27,28].
In recent years, diffusion models have emerged as a powerful generative approach in pedestrian trajectory prediction, following their remarkable success in tasks such as image generation. Unlike GANs or CVAEs, diffusion models gradually corrupt data into noise and then learn to reverse this process, allowing them to model complex probability distributions more stably. They are particularly effective at capturing multimodal characteristics and modeling high uncertainty in data.
As a representative diffusion-based method, Gu et al. [29] applied diffusion models to pedestrian trajectory prediction. It defines a forward diffusion process to represent motion uncertainty and constructs a Markov chain with parameterized Gaussian transitions to model the reverse trajectory generation. Generative models for pedestrian trajectory prediction capture the diversity and uncertainty of future trajectories by introducing latent variables or generative mechanisms. This enables generating multiple plausible trajectories, better reflecting the complexity and unpredictability of human behavior. Such methods demonstrate strong potential in modeling the ambiguity of human motion. However, training generative models is often complex and prone to issues such as mode collapse and unstable generation quality, posing significant challenges in their application to pedestrian trajectory prediction.
Graph Neural Networks (GNNs) are neural network models specifically designed for graph-structured data, integrating the advantages of graph computation and neural networks. They efficiently capture graph structure and abstract node features. In pedestrian trajectory prediction tasks, Chen et al. [30] are commonly used to model social interactions among pedestrians. Specifically, pedestrians in the same scene are regarded as nodes, and social relationships between them are treated as edges, forming a social interaction graph. For example, Shi et al. [31] proposed a sparse graph convolutional network (SGCN) for pedestrian trajectory prediction to reduce the redundancy in pedestrian interaction modeling found in traditional graph convolutional network. Chen et al. [32] proposed an interpretable masked graph convolutional network (IMGCN) for pedestrian trajectory prediction. By leveraging interpretable features such as pedestrian field-of-view regions, distance, and motion direction, the model intelligently masks interaction features, enabling more accurate modeling of social interactions and motion dynamics. Li et al. [33] introduced a Behavioral pseudo-label informed sparse graph convolution network (BP-SGCN), which captures the behavior distribution of pedestrians and heterogeneous traffic agents. This approach significantly improves trajectory prediction accuracy by incorporating behavior-aware priors into the modeling process. However, due to inherent limitations of GCNs, they aggregate neighbor information using a fixed weighted average, failing to dynamically assign different weights to various social relationships. Consequently, it assumes all surrounding pedestrians exert equal influence on the target pedestrian, which is unrealistic in real-world scenarios. To address this issue, Velicković et al. [34] proposed the Graph Attention Network (GAT), which dynamically adjusts the weights between nodes through an attention mechanism. In pedestrian trajectory prediction, GAT enables pedestrians with stronger interactions to have greater influence on the target pedestrian, aligning social relationship modeling more closely with real-world dynamic interactions and improving prediction accuracy. For example, Huang et al. [35] proposed a pedestrian trajectory prediction method based on the sequence-to-sequence (Seq2Seq) architecture. This method employs GAT to capture spatial interactions at each time step and introduces an LSTM to encode temporal dependencies, enhancing the model’s adaptability to complex dynamic scenarios.
The pedestrian trajectory prediction problem can be described as predicting a pedestrian’s future trajectory based on their past trajectory. Specifically, we define the trajectory of pedestrians as:
The pedestrian trajectory prediction task aims to infer a pedestrian’s future motion trajectory based on historical trajectory data. Due to the significant temporal continuity of pedestrian movement behavior, their trajectories exhibit a high correlation between time steps. To capture this temporal dependency, we construct a temporal graph to model the dynamic correlations across time steps, revealing how a pedestrian’s current state influences future movements. Specifically, we incorporate positional encoding into each frame’s positional information and fuse it with the pedestrian’s spatial coordinates to enhance the model’s ability to capture temporal dependencies. For each pedestrian i, we construct a corresponding temporal graph over their observed trajectory with an observation window of length
Another major challenge in pedestrian trajectory prediction is modeling the influence of surrounding pedestrians on the target pedestrian, commonly referred to as social interaction. To effectively capture these interaction relationships, we construct a spatial graph, where nodes represent pedestrian trajectory information, and edges represent the relative positional relationships between pedestrians. Through the Spatial Graph, the model can explicitly capture the spatial dependencies between pedestrians, enabling a more accurate understanding of how social interactions influence the target pedestrian’s future trajectory. For each time frame, we construct a Spatial Graph to model the spatial interactions among pedestrians. The Spatial Graph is defined as:
We employ directed edges to capture the directionality of social influence, thereby distinguishing the asymmetric interactions between pedestrians.
3.2 Spatio-Temporal Feature Fusion
To more effectively model temporal and spatial dependencies in trajectory sequences, we adopt a Bidirectional Graph Attention Network (Bi-GAT) instead of traditional GATs. By introducing the attention mechanism, GATs dynamically adjust weights according to the relative importance of nodes, thereby capturing complex spatio-temporal interactions more precisely. The implementation of Bi-GAT relies on two types of input: the feature graph, which represents node features, and the adjacency matrix, which describes node connectivity. In the previous section, we have already constructed the spatio-temporal graph, where the graph structure defines the nodes and edges. Next, we focus on the construction of the adjacency matrix, as illustrated in Fig. 2.

Figure 2: Spatio-temporal fusion process
Considering the rich temporal information embedded in pedestrian trajectory data, we further enhance the model’s temporal feature representation by introducing the Fast Fourier Convolution Module (FFCM) for temporal graph modeling. FFCM transforms input sequences into the frequency domain and uses a multi-scale convolutional structure to extract both local details and global trends in trajectories. Its multi-scale design, enabled by convolutional kernels of different sizes, captures behavioral patterns across various temporal scales. This enables the model to identify short-term key movements (e.g., imminent avoidance) more effectively, enhancing its ability to model complex temporal dynamics. Its internal structure primarily relies on multi-scale fusion to capture local features. Specifically, multi-scale fusion employs deep convolutional networks, where different convolution kernels are used to extract local information at various scales. After feature fusion, the representation of trajectory details is enhanced. This approach effectively captures short-term behavioral features, such as imminent avoidance maneuvers. This process can be defined as:
where
where
where
here, X denotes the concatenated local features in the spatial domain. The features
batch normalization
In this process, T denotes the input feature, and
where
where S denotes the spatial adjacency matrix and
To further enhance the representation, we normalize the resulting fusion matrix using the Softmax function, producing the final spatial-temporal fusion adjacency matrix:
where
Similar to the construction of the spatial-temporal fusion adjacency matrix, we adopt the same method to obtain the spatial feature vector and concatenate it with the temporal graph to form the temporal-spatial adjacency matrix. Then, we concatenate the temporal-spatial adjacency matrix with the original temporal graph and normalize it using a sigmoid activation function to obtain the final temporal-spatial fusion adjacency matrix. This process is described by the following equation:
3.3 Bidirectional Graph Attention Network
To extract information from different pedestrians in the scene, we employ a GAT-based approach. Due to its unique attention mechanism, GAT can effectively aggregate features in structured data while preserving sequence dependencies. The network structure of Bi-GAT is illustrated in Fig. 3. Specifically, GAT accepts the temporal graph, spatial graph and their corresponding adjacency matrix to integrate multi-scale information. Unlike traditional GATs that compute a single attention score, we propose a bidirectional-attention mechanism to more accurately model the positional relationships among pedestrians. We first apply a linear transformation to the input features to project them into a new feature space, which serves as the foundation for the subsequent attention computation. Then, we compute separate attention scores for source and target nodes, enabling a more fine-grained representation of interaction weights among nodes. In this structure, we consider the target pedestrian as the information sender and the surrounding pedestrians as the receivers. The attention score of the source node is used to measure the importance of the information sender to the neighbor node, while the attention score of the target node is used to measure the sensitivity of the information receiver to the incoming information. This design allows the model to capture feature contributions from multiple perspectives, thereby enabling a more comprehensive modeling of pedestrian interactions. Then, we concatenate the attention score of the source node with the attention score of the target node after transformation (cat operation) to obtain the comprehensive attention score. Finally, we apply LeakyReLu activation function to nonlinear transform the attention score to obtain the final attention score. The corresponding definition is as follows:
where Z denotes the linearly transformed input feature matrix,
where

Figure 3: Bi-GAT module structure
After obtaining the attention score, we need to mask the attention score using the previously constructed adjacency matrix to ensure that the calculation is only carried out between the connected node pairs. Specifically, we set the attention scores of unconnected node pairs in the spatio-temporal graph to negative infinity, so that these unconnected attention scores tend to zero in the subsequent process of softmax normalization to avoid the influence of invalid information. After masking, we obtain a new attention score matrix, which only retains the attention weight between the node pairs with edges in the graph structure. This masking mechanism can effectively strengthen the model’s focus on key interactions, reduce invalid calculations, and improve the accuracy and computational efficiency of trajectory prediction.
where
On the masked attention score matrix, we first apply the softmax operation to normalize so that the sum of the attention weights of all adjacent nodes is 1. Next, we use the dropout operation to randomly reset part of the attention weight to zero to prevent the over fitting problem in the training process.
We use the obtained attention weight to sum the input features, in order to realize the aggregation of features. Specifically, the final feature representation of the target pedestrian is obtained by the weighted sum of the features of its neighbor nodes, and the weighting coefficient is the calculated attention weight.
The pseudo-code of the Bi-GAT algorithm is presented in Algorithm 1.

3.4 Temporal Convolutional Network
To address the need for spatio-temporal feature coupling in pedestrian trajectory prediction, we adopt a Temporal Convolutional Network (TCN) architecture. TCN establishes a foundation for temporal modeling through multi-dimensional feature transformation and deep feature extraction. Specifically, a 2D convolutional layer is first applied to the input trajectory data to adjust the temporal dimension, leveraging convolutional kernels to reorganize temporal features and adapt to the timestep requirements of trajectory prediction tasks.
Next, we construct a feature extraction unit composed of Conv2d, PReLU, and Dropout, employing a three-layer stacked convolutional structure to progressively extract high-dimensional temporal features. The PReLU activation function enables the model to adaptively adjust nonlinear expressions in negative regions, while the Dropout layer randomly masks neurons to enhance generalization capability. Additionally, residual connections are introduced between convolutional layers to integrate shallow spatial features with deep temporal features through element-wise addition of feature matrices. This mechanism effectively alleviates the vanishing gradient problem and enhances the efficiency of information propagation.
Finally, the multi-level fused features are aligned in both temporal and spatial dimensions with the social interaction features extracted by the Bi-GAT, forming a unified representation that captures both individual motion patterns and collective behavioral constraints. This provides a robust feature foundation for subsequent trajectory prediction. Fig. 4 clearly illustrates the structure of the TCN.
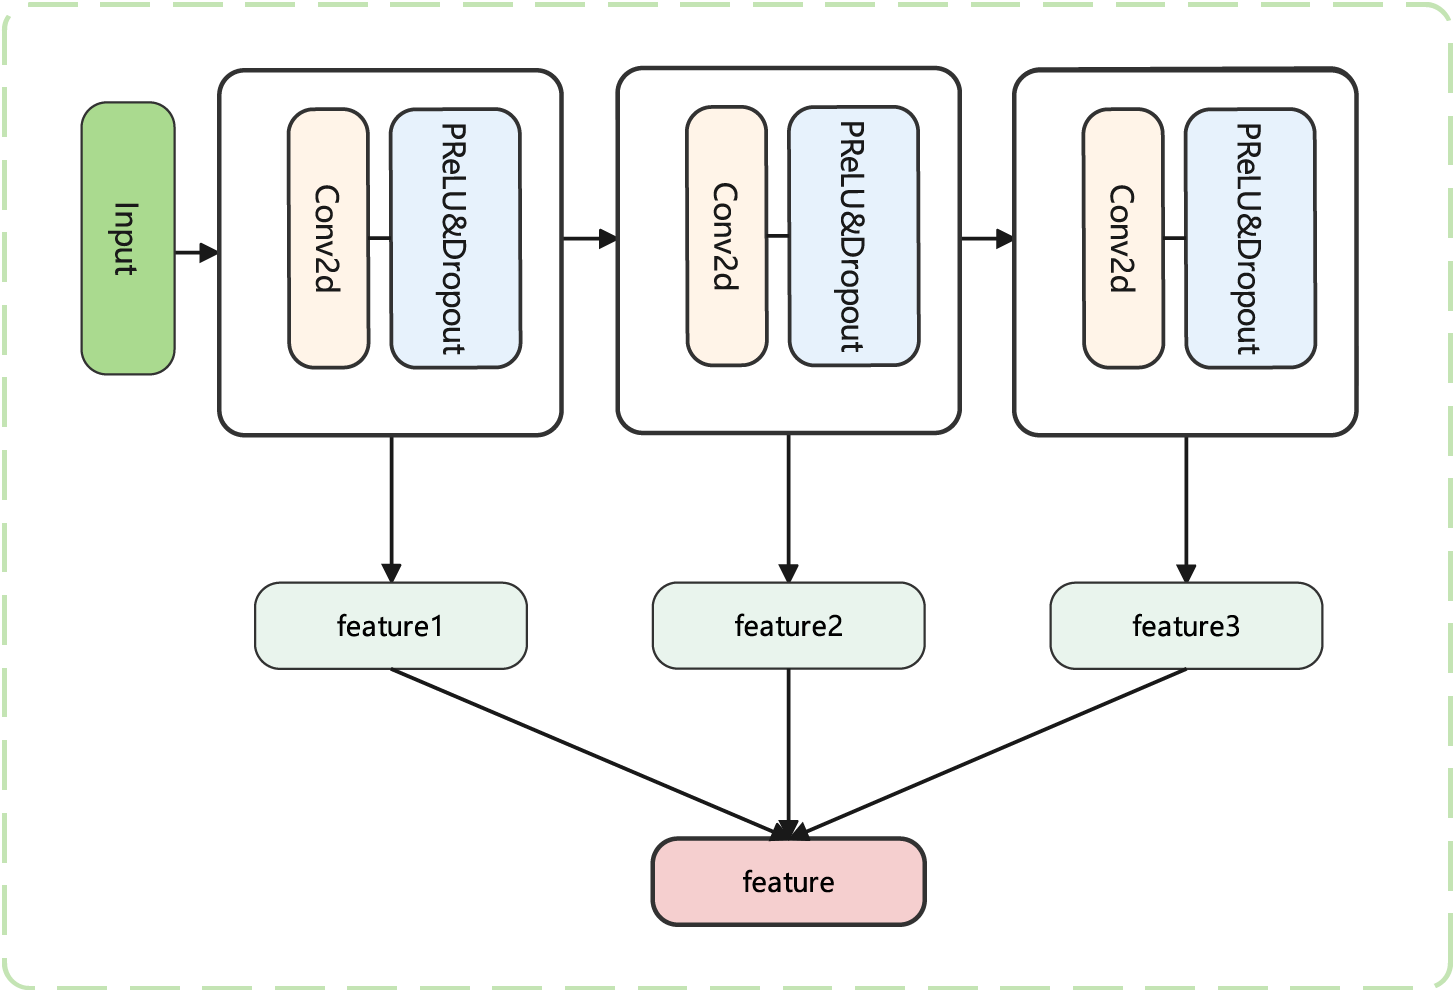
Figure 4: TCN module architecture
This paper adopts deep learning methods and utilizes an NVIDIA RTX 4090 GPU and an Intel Core i7-13700KF CPU for model training on the hardware side. On the software side, we implemented model training and testing using the PyTorch framework in a Python 3.9 environment on the Ubuntu 22.4 operating system.
Dataset: we use two challenging datasets, ETH [36] and UCY [37], to validate our model. These two public datasets record pedestrian location information in multiple scenarios, with each dataset containing different subsets. The ETH dataset includes eth and hotel subsets, while the UCY dataset consists of zara1, zara2, and univ. These datasets capture pedestrian movement trajectories from a static viewpoint, encompassing various pedestrian interaction behaviors such as walking side by side, walking in opposite directions, avoiding, gathering, and dispersing, thus fully demonstrating the complex crowd dynamics in real-world scenarios.
Metrics: To comprehensively evaluate the performance of our model, we follow existing studies and use Average Displacement Error (ADE) [38] and Final Displacement Error (FDE) [39] as evaluation metrics:
Average Displacement Error (ADE): Measures the average Euclidean distance between the predicted trajectory and the ground truth trajectory over the entire time sequence, reflecting the overall accuracy of the model’s predictions.
Final Displacement Error (FDE): Measures the Euclidean distance between the predicted position and the ground truth position at the final time step, evaluating the model’s accuracy in predicting the pedestrian’s final location.
Lower ADE and FDE values indicate that the model has higher accuracy and generalization ability in pedestrian trajectory prediction tasks, enabling it to better adapt to pedestrian behavior patterns in different scenarios. To ensure a fair comparison with all existing studies, we use an input sequence of 8 frames (3.2 s) and predict a target trajectory of 12 frames (4.8 s). This allows for an objective evaluation of the model’s predictive performance under the same experimental settings.
When processing graph data, our model employs a function with an embedding dimension of 64. In the proposed graph attention mechanism, the linear transformation embedding dimension is set to 16, with 4 attention heads. Additionally, the TCN consists of 3 layers. During experiments, we adopt a leave-one-out training strategy, where the model is trained on four scene datasets and tested on the remaining one.
For model training, we use the Adam optimizer for 500 epochs with a batch size of 128. The initial learning rate is set to 0.01 and decays every 50 epochs with a decay factor of 0.1. Furthermore, our method supports multimodal prediction, generating 20 possible future trajectories and selecting the one closest to the ground truth to compute the Average Displacement Error (ADE) and Final Displacement Error (FDE).
We selected various baseline algorithms to compare with our method to verify its effectiveness. The following is a brief introduction to these algorithms.
1.Social-Lstm [17]: A pedestrian trajectory prediction model based on LSTM proposed the concept of a social pool to simulate social relationships between pedestrians.
2.Social-Gan [18]: A pedestrian trajectory prediction model based on GAN, which predicts future pedestrian trajectories through sequence prediction and generative adversarial network techniques.
3.STGAT [35]: A pedestrian trajectory prediction model based on the Spatio-Temporal Graph Attention Network (STGAT), which integrates temporal and spatial features to predict future pedestrian trajectories.
4.SGCN [31]: A pedestrian trajectory prediction model based on the Sparse Graph Convolutional Network (SGCN), which captures adaptive interactions and motion trends among pedestrians by constructing sparse directed spatial and temporal graphs.
5.AST-GNN [40]: A pedestrian trajectory prediction algorithm based on the attention mechanism for constructing spatio-temporal graphs, designed to predict interaction-aware pedestrian trajectories.
6.RDGCN [41]: By constructing a spatio-temporal graph to simulate social interactions and group movement factors, and employing asymmetric 3D convolution to fuse spatio-temporal information, precise prediction of pedestrian future trajectories is achieved.
7.Social-SAGAN [42]: It integrates a Generative Adversarial Network (GAN) framework, including a generator for predicting pedestrian future trajectories and a discriminator for assessing trajectory authenticity, while employing a social self-attention mechanism to filter and refine interaction information.
We compare our model with multiple baseline algorithms, and the experimental results are presented in Table 1. In our approach, we construct a spatio-temporal graph to simultaneously model temporal dynamics and spatial social interactions, enabling the model to comprehensively capture complex relationships among pedestrians. We introduce the FFCM module to integrate local temporal features with global frequency-domain information, addressing the limitations of traditional methods in modeling long-term dependencies. Furthermore, we incorporate a bidirectional graph attention mechanism (Bi-GAT), which computes bidirectional attention scores for source and target nodes, allowing for a more accurate representation of influence among pedestrians and significantly enhancing feature expressiveness. Lastly, we adopt a stacked TCN architecture to further extract deep temporal features, improving both prediction accuracy and model robustness. In summary, our method integrates multiple advantageous mechanisms in its architectural design, providing stronger expressive power in modeling complex social interactions and long-term dependencies, and thereby achieving superior prediction performance across multiple datasets.
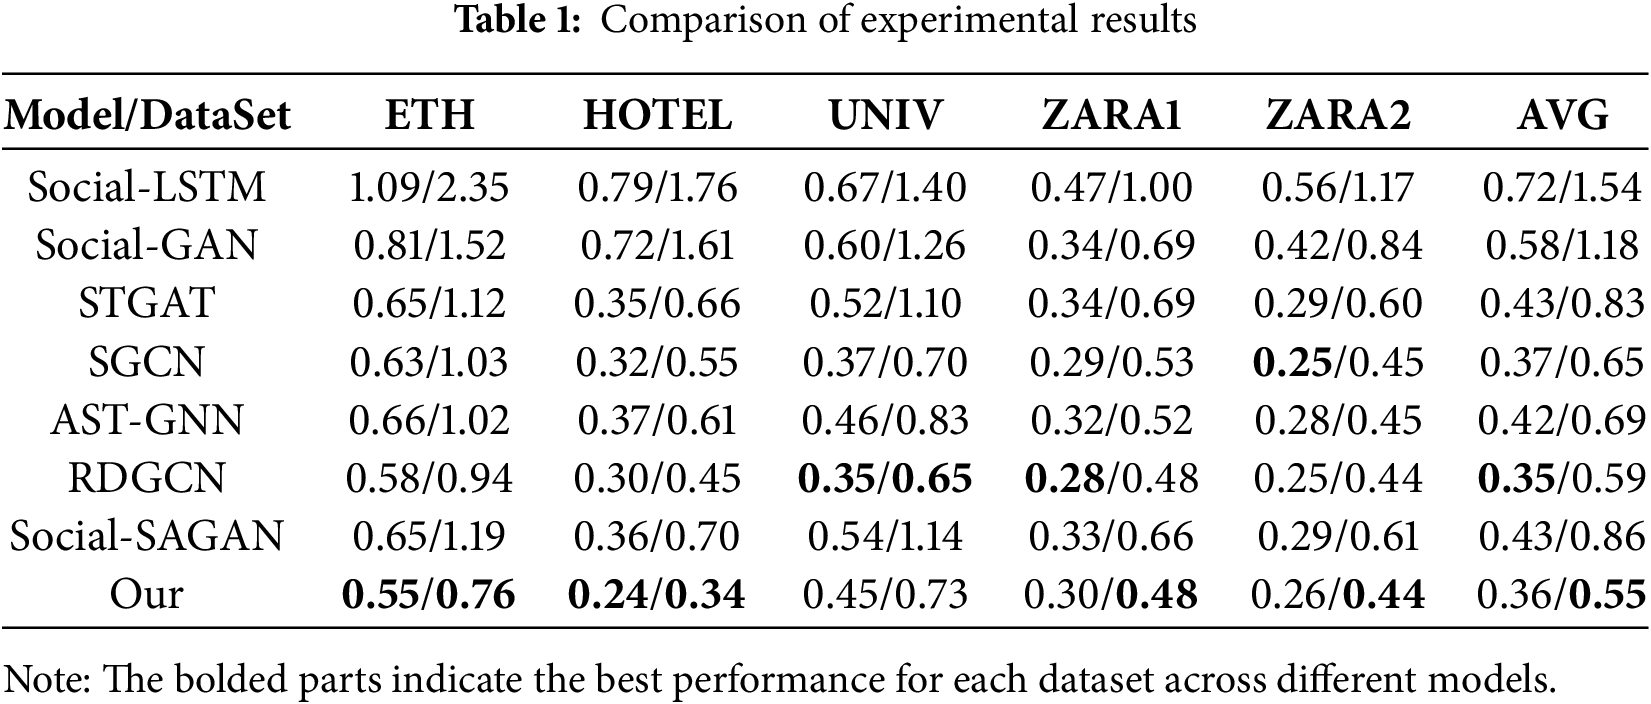
It can be observed that our method achieves improved prediction performance across all five scenarios. Notably, in the ETH dataset, our model demonstrates superior performance. This is because pedestrian movement patterns in the ETH dataset are relatively clear, making it easier for the model to capture social relationships among pedestrians. Specifically, in the UCY dataset, the improvement achieved by our method is relatively smaller. Particularly in the UNIV scenario, where the number of pedestrians is large, the model faces certain challenges in capturing social relationships among pedestrians, preventing it from achieving the best results.
Compared with methods such as STGAT that also employ Graph Attention Networks, our proposed Bi-GAT introduces a more principled and interpretable mechanism for modeling spatio-temporal dependencies. STGAT adopts a unified spatio-temporal graph where spatial and temporal relations are entangled within a single attention structure. While this design simplifies implementation, it often fails to distinguish the different dynamics across spatial and temporal dimensions, leading to suboptimal feature representation. In contrast, our Bi-GAT explicitly decouples spatial and temporal modeling by constructing separate spatial graphs at each time step and applying a bidirectional attention mechanism. This mechanism not only captures how neighboring pedestrians influence the target agent, but also models the reverse influence of the target on its neighbors—reflecting the inherently asymmetric and reciprocal nature of human interactions. By structuring attention in this way, Bi-GAT enables finer-grained interaction reasoning and achieves stronger generalization in diverse and complex crowd scenarios.
To provide a more comprehensive evaluation of the model’s generalization ability, we report the average ADE and FDE across all test scenarios. Specifically, our method achieves an ADE score of 0.36, representing a 19.4% improvement over the baseline algorithm STGAT and a 6.6% improvement over the best baseline algorithm SGCN. For the FDE metric, our method achieves a score of 0.55, which is 50.9% better than the STGAT baseline and 18.1% better than the best baseline algorithm SGCN.
Importance of Ablation Study. We designed multiple model variants to assess the contribution of each component to the overall performance. The experimental results, as shown in Table 2, clearly demonstrate the effectiveness of our proposed modules. Through systematic ablation, we are able to quantify the impact of individual components and validate their necessity within the full model architecture.
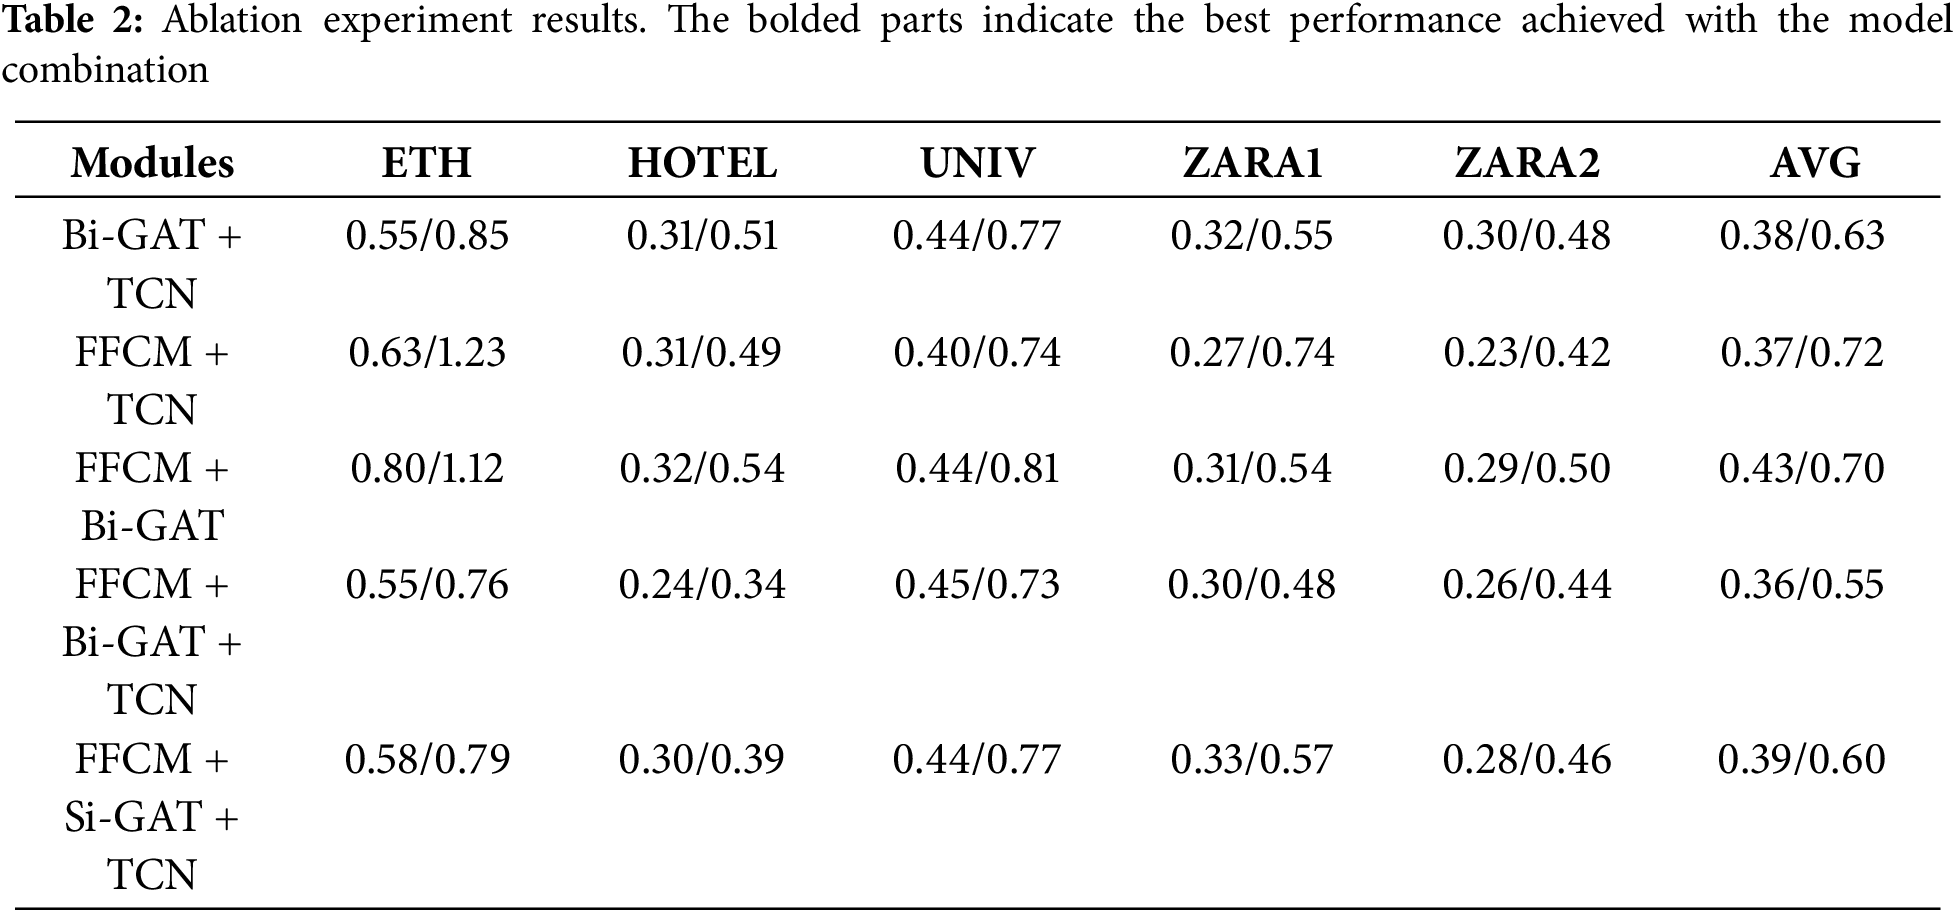
1. FFCM Ablation Experiment: In this study, we leveraged the FFCM module to transform input signals into the frequency domain, enabling the extraction of both local details and global trend information from pedestrian trajectories. The introduction of FFCM enhances the model’s capacity to express temporal features by capturing significant local patterns and global statistical characteristics. This allows for comprehensive multi-level modeling of temporal dependencies. Additionally, FFCM also improves the understanding of local social interactions and global scene context at the spatial level. To evaluate the effectiveness of FFCM, we conducted an ablation study in which the FFCM module was removed. Instead, we applied max pooling and average pooling to extract global and local features. Experiments on five datasets revealed that the absence of FFCM led to a performance drop, with ADE/FDE degrading from 0.36/0.55 to 0.38/0.63. These results validate the significant role of the FFCM module in feature extraction.
2. Bi-GAT Ablation Experiment: In this paper, pedestrian trajectory prediction is achieved primarily by modeling temporal information and spatial social interactions, both of which play a significant role in the effectiveness of our method. To evaluate the contribution of social interaction modeling, we conducted an ablation study focusing on the Bi-GAT module. Specifically, we replaced the Bi-GAT module wit0h a linear layer and performed experiments on five benchmark datasets. The results show that removing the Bi-GAT module caused the ADE/FDE to drop from 0.36/0.55 to 0.37/0.73, indicating that Bi-GAT is more effective at capturing the influence of neighboring pedestrians on the target pedestrian’s motion behavior, thereby improving prediction accuracy. It is worth noting that the performance gain of the Bi-GAT module is less prominent on the UNIV dataset compared to others. We attribute this to the relatively open spatial layout of the UNIV scene, where Bi-GAT struggles to effectively capture the interactions with distant neighbors, which in turn limits its performance in this particular scenario.
3. TCN Ablation Experiment: In addition to the ablation on social interaction modeling, we conducted an ablation study focusing on temporal modeling. While social relationships are essential for capturing pedestrian interactions, temporal relations help in modeling the trajectory of each individual pedestrian. Temporal information allows us to understand the complete movement pattern of a pedestrian, and when combined with social context, provides insights into their motion habits during navigation. To evaluate the effectiveness of temporal modeling, we replaced the TCN module with a linear layer and conducted experiments on five benchmark datasets. The results show that removing the TCN module led to a performance drop, with ADE/FDE increasing from 0.36/0.55 to 0.43/0.70. This demonstrates the advantage of the TCN module in capturing temporal dependencies, confirming its critical role in trajectory prediction.
4. Bi-GAT branch Ablation Experiment: To further assess the effectiveness of the proposed Bi-GAT module in modeling complex social interactions, we conducted a detailed ablation study by comparing it with a simplified variant, referred to as Single-Branch GAT (Si-GAT). In our design, Bi-GAT introduces two independent attention branches—one originating from the source node and the other from the target node. This bidirectional attention mechanism allows the model to capture mutual influences between pedestrians, accounting for both how surrounding pedestrians affect the target pedestrian and how the target pedestrian, in turn, influences its neighbors. To isolate the contribution of each direction, we constructed the Si-GAT by preserving only the attention from surrounding pedestrians to the target pedestrian, while removing the reverse path. This choice is based on the observation that, in trajectory prediction, the influence from neighbors to the target pedestrian typically plays a more dominant role. The Si-GAT serves as a baseline to evaluate the added value of bidirectional modeling. Experimental results show that the full Bi-GAT outperforms its single-branch counterpart across all datasets, reducing the average ADE from 0.39 to 0.36 and the average FDE from 0.70 to 0.55. These findings clearly demonstrate that incorporating attention in both directions significantly enhances the model’s ability to capture social dynamics, leading to more accurate trajectory predictions.
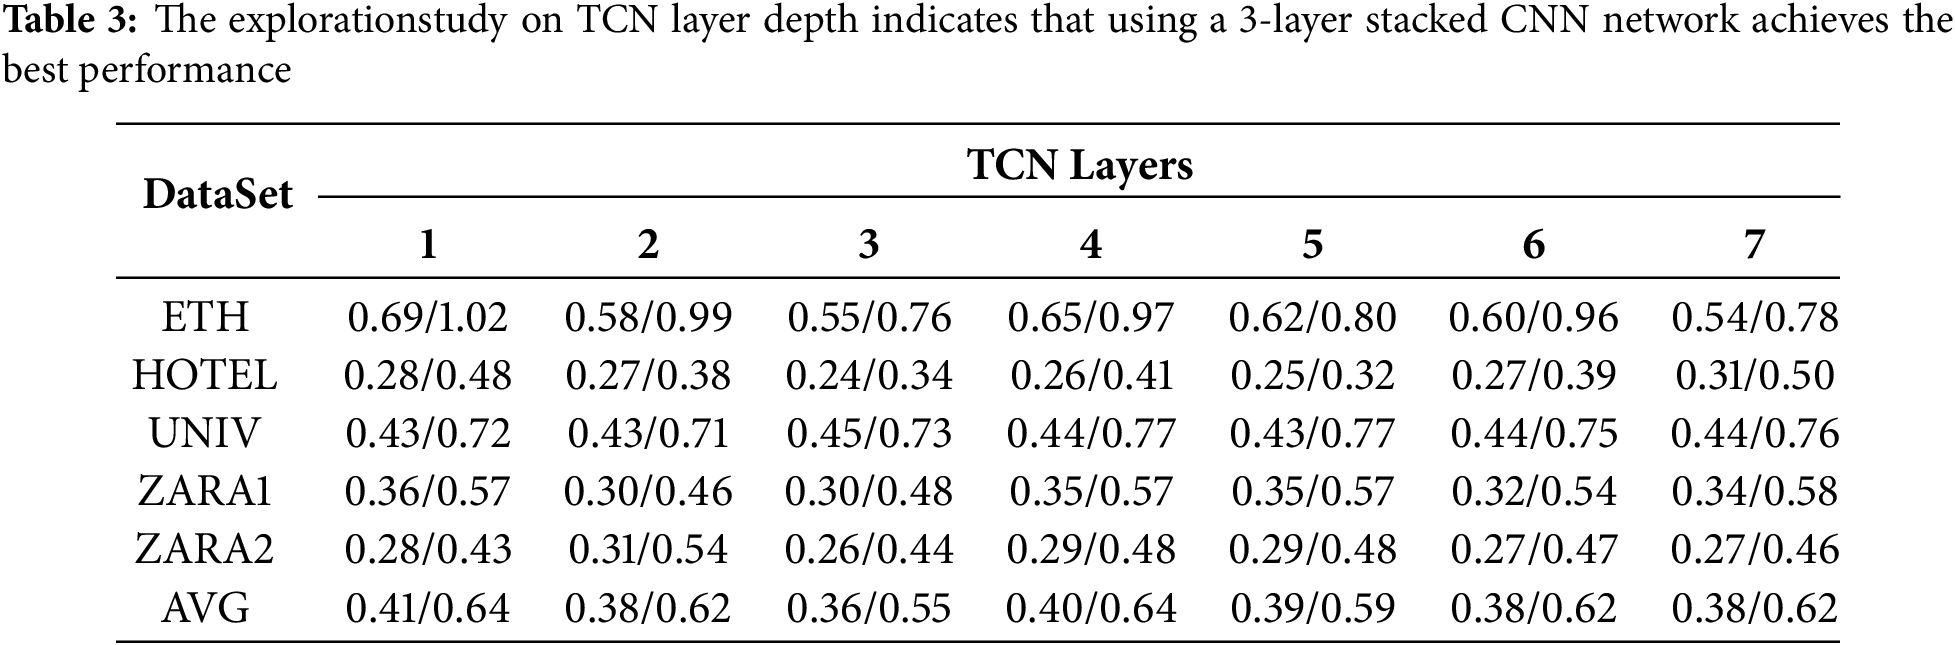
4.6 TCN Layer Design Exploration
While previous studies such as DSTCNN and STIGCN have demonstrated that properly stacking Temporal Convolutional Network (TCN) layers enhances temporal feature extraction, we still include a TCN stacking experiment for two reasons specific to our method. First, the number of TCN layers varies across prior works, and the optimal depth may depend on the model architecture and dataset. Therefore, we conducted this experiment to determine the most effective TCN depth in our framework. Second, since our model includes an FFCM module that fuses and modulates temporal features, we aim to investigate how it interacts with different TCN depths and assess its overall contribution.
As shown in Table 3, model performance improves as the number of TCN layers increases, reaching the best performance at three layers. However, further increasing the depth does not yield continued improvements. In fact, an overly deep TCN may introduce issues such as feature redundancy, vanishing gradients, and overfitting, which weaken the model’s generalization capability and lead to performance degradation. These results suggest that moderately stacking TCN layers helps to fully capture temporal dependencies while maintaining model robustness.
To intuitively demonstrate the effectiveness of our proposed approach, we visualize prediction results on the ETH dataset in Fig. 5. These visualizations compare our model with several existing methods, including AST-GNN, IMGCN, and STIGCN, under both the ETH and Hotel scenarios.

Figure 5: Trajectory visualization comparison
In our visualization, the temporal progression and spatial changes are clearly depicted, which helps reveal how different models capture dynamic motion patterns over time. We also ensured temporal alignment across all visualized samples to maintain consistency and comparability across methods and scenes.
As shown in Panels A through D, which depict scenarios with strong social interactions (e.g., two pedestrians walking side-by-side), our model generates highly synchronized trajectories that closely match the ground truth. In contrast, AST-GNN and IMGCN struggle to model such coordinated movements, resulting in diverging predictions. While STIGCN captures part of the social behavior, its predictions are less precise due to limited attention to asymmetric interactions.
Panels E through H illustrate cases with weak or no explicit social interactions. Even in these less structured contexts, our model accurately predicts future trajectories, demonstrating strong generalization and temporal modeling capabilities. In comparison, other baselines exhibit larger deviations and less smooth trajectories, particularly IMGCN and STIGCN.
For clarity, we use distinct colors in the visualization: purple for historical trajectories, red for ground truth futures, and blue for our predicted results. Moreover, our model supports multimodal prediction, and we present the best trajectory (with the lowest ADE and FDE) among the predicted candidates. These visualizations not only validate the accuracy of our method but also highlight its ability to model complex social behaviors and spatio-temporal dynamics more effectively than existing approaches.
In this paper, we propose the DIABiGAT model, which fully leverages the spatio-temporal relationships of trajectories to construct a spatio-temporal graph. By integrating Bi-GAT and TCN modules, the model efficiently processes spatio-temporal information, thereby improving the accuracy of pedestrian trajectory prediction. Experimental results demonstrate that our approach outperforms existing methods in trajectory prediction accuracy. Future work will focus on enhancing the model’s robustness to improve its adaptability across different scenarios, further strengthening the stability and generalization capability of the prediction results.
Acknowledgement: The authors are grateful to all the editors and anonymous reviewers for their comments and suggestions.
Funding Statement: This research was funded by the National Natural Science Foundation of China, grant number 624010. This research was funded by the Natural Science Foundation of Anhui Province, grant number 2408085QF202. This research was funded by the Anhui Future Technology Research Institute Industry Guidance Fund Project, grant number 2023cyyd04. This research was funded by the Project of Research of Anhui Polytechnic University, grant number Xjky2022150.
Author Contributions: Conceptualization, Jun Li and Kai Xu; methodology, Kai Xu; writing—original draft preparation, Kai Xu; writing—review and editing, Jun Li; supervision, Jun Li; Jun Li and Kai Xu have contributed equally to this work and share first authorship. Validation, Baozhu Chen, Xiaohan Yang, Mengting Sun, Guojun Li and Haojie Du. All authors reviewed the results and approved the final version of the manuscript.
Availability of Data and Materials: The data that support the findings of this study are available from the Corresponding Author, Jun Li, upon reasonable request.
Ethics Approval: Not applicable.
Conflicts of Interest: The authors declare no conflicts of interest to report regarding the present study.
References
1. Poibrenski A, Klusch M, Vozniak I, Müller C. M2P3: multimodal multi-pedestrian path prediction by self-driving cars with egocentric vision. In: Proceedings of the 35th Annual ACM Symposium on Applied Computing. Brno, Czech Republic; 2020. p. 190–7. [Google Scholar]
2. Huynh M, Alaghband G. Online adaptive temporal memory with certainty estimation for human trajectory prediction. In: Proceedings of the IEEE/CVF Winter Conference on Applications of Computer Vision. Los Alamitos, CA, USA; 2023. p. 940–9. [Google Scholar]
3. Li L, Pagnucco M, Song Y. Graph-based spatial transformer with memory replay for multi-future pedestrian trajectory prediction. In: Proceedings of the IEEE/CVF Conference on Computer Vision and Pattern Recognition. New Orleans, LA, USA; 2022. p. 2231–41. [Google Scholar]
4. Shao W, Salim FD, Gu T, Dinh NT, Chan J. Traveling officer problem: managing car parking violations efficiently using sensor data. IEEE Internet of Things J. 2017;5(2):802–10. doi:10.1109/jiot.2017.2759218. [Google Scholar] [CrossRef]
5. Yu B, Yin H, Zhu Z. Spatio-temporal graph convolutional networks: a deep learning framework for traffic forecasting. In: Proceedings of the 27th International Joint Conference on Artificial Intelligence (IJCAI). Stockholm, Sweden; 2018. p. 3634–40. [Google Scholar]
6. Boltes M, Zhang J, Tordeux A, Schadschneider A, Seyfried A. Empirical results of pedestrian and evacuation dynamics. In: Complex dynamics of traffic management. New York, NY, USA: Springer; 2019. p. 671–99. [Google Scholar]
7. Zhou C, Miao MC, Chen XR, Hu YF, Chang Q, Yan MY, et al. Human-behaviour-based social locomotion model improves the humanization of social robots. Nat Mach Intell. 2022;4(11):1040–52. doi:10.1038/s42256-022-00542-z. [Google Scholar] [CrossRef]
8. Zhang B, Amirian J, Eberle H, Pettre J, Holloway C, Carlson T. From HRI to CRI: crowd robot interaction—understanding the effect of robots on crowd motion: empirical study of pedestrian dynamics with a wheelchair and a pepper robot. Int J Soci Robot. 2022;14(3):1–13. doi:10.1007/s12369-021-00812-7. [Google Scholar] [CrossRef]
9. Chen Z, Peng C, Liu S, Ding W. Visual object tracking: review and challenges. Appl Soft Comput. 2025;177(6):113140. doi:10.1016/j.asoc.2025.113140. [Google Scholar] [CrossRef]
10. Helbing D, Molnar P. Social force model for pedestrian dynamics. Phys Rev E. 1995;51(5):4282–6. doi:10.1103/physreve.51.4282. [Google Scholar] [PubMed] [CrossRef]
11. Rudenko A, Palmieri L, Arras KO. Joint long-term prediction of human motion using a planning-based social force approach. In: 2018 IEEE International Conference on Robotics and Automation (ICRA). Brisbane, QLD, Australia; 2018. p. 4571–7. [Google Scholar]
12. Lehrmann AM, Gehler PV, Nowozin S. Efficient nonlinear markov models for human motion. In: Proceedings of the IEEE Conference on Computer Vision and Pattern Recognition. Columbus, OH, USA; 2014. p. 1314–21. [Google Scholar]
13. Møgelmose A, Trivedi MM, Moeslund TB. Trajectory analysis and prediction for improved pedestrian safety: integrated framework and evaluations. In: 2015 IEEE Intelligent Vehicles Symposium (IV). Seoul, Republic of Korea; 2015. p. 330–5. [Google Scholar]
14. Salzmann T, Ivanovic B, Chakravarty P, Pavone M. Trajectron++: dynamically-feasible trajectory forecasting with heterogeneous data. In: Computer Vision-ECCV 2020: 16th European Conference. Glasgow, UK; 2020. p. 683–700. [Google Scholar]
15. Zamboni S, Kefato ZT, Girdzijauskas S, Norén C, Dal Col L. Pedestrian trajectory prediction with convolutional neural networks. Pattern Recognit. 2022;121:108252. doi:10.1016/j.patcog.2021.108252. [Google Scholar] [CrossRef]
16. Tang L, Yan F, Zou B, Li W, Lv C, Wang K. Trajectory prediction for autonomous driving based on multiscale spatial-temporal graph. IET Intell Trans Syst. 2023;17(2):386–99. doi:10.1049/itr2.12265. [Google Scholar] [CrossRef]
17. Alahi A, Goel K, Ramanathan V, Robicquet A, Fei-Fei L, Savarese S. Social LSTM: human trajectory prediction in crowded spaces. In: Proceedings of the IEEE Conference on Computer Vision and Pattern Recognition. Las Vegas, NV, USA; 2016. p. 961–71. [Google Scholar]
18. Gupta A, Johnson J, Fei-Fei L, Savarese S, Alahi A. Social GAN: socially acceptable trajectories with generative adversarial networks. In: Proceedings of the IEEE Conference on Computer Vision and Pattern Recognition. Salt Lake City, UT, USA; 2018. p. 2255–64. [Google Scholar]
19. Sadeghian A, Kosaraju V, Sadeghian A, Hirose N, Rezatofighi H, Savarese SS. An attentive gan for predicting paths compliant to social and physical constraints. In: Proceedings of the IEEE/CVF Conference on Computer Vision and Pattern Recognition. Long Beach, CA, USA; 2019. p. 1349–58. [Google Scholar]
20. Mo X, Huang Z, Xing Y, Lv C. Multi-agent trajectory prediction with heterogeneous edge-enhanced graph attention network. IEEE Trans Intell Trans Syst. 2022;23(7):9554–67. doi:10.1109/tits.2022.3146300. [Google Scholar] [CrossRef]
21. Yao Y, Atkins E, Johnson-Roberson M, Vasudevan R, Du X. Bitrap: Bi-directional pedestrian trajectory prediction with multi-modal goal estimation. IEEE Robot Autom Lett. 2021;6(2):1463–70. doi:10.1109/lra.2021.3056339. [Google Scholar] [CrossRef]
22. Chen W, Sang H, Wang J, Zhao Z. DSTCNN: deformable spatial-temporal convolutional neural network for pedestrian trajectory prediction. Inf Sci. 2024;666(9):120455. doi:10.1016/j.ins.2024.120455. [Google Scholar] [CrossRef]
23. Yoon H, Ali U, Choi J, Park E. Rethinking convolutional neural networks for trajectory refinement. Pattern Recognit. 2025;157(10):110883. doi:10.1016/j.patcog.2024.110883. [Google Scholar] [CrossRef]
24. Amirian J, Hayet JB, Pettré J. Social ways: learning multi-modal distributions of pedestrian trajectories With GANs. In: 2019 IEEE/CVF Conference on Computer Vision and Pattern Recognition Workshops (CVPRW). Long Beach, CA, USA; 2019. p. 2964–72. [Google Scholar]
25. Huang L, Zhuang J, Cheng X, Xu R, Ma H. STI-GAN: multimodal pedestrian trajectory prediction using spatiotemporal interactions and a generative adversarial network. IEEE Access. 2021;9:50846–56. doi:10.1109/access.2021.3069134. [Google Scholar] [CrossRef]
26. Lai WC, Xia ZX, Lin HS, Hsu LF, Shuai HH, Jhuo IH, et al. Trajectory prediction in heterogeneous environment via attended ecology embedding. In: Proceedings of the 28th ACM International Conference on Multimedia. New York, NY, USA; 2020. p. 202–10. [Google Scholar]
27. Xu B, Wang X, Li S, Li J, Liu C. Social-CVAE: pedestrian trajectory prediction using conditional variational auto-encoder. In: International Conference on Neural Information Processing. Changsha, China; 2024. p. 476–89. [Google Scholar]
28. Lee M, Sohn SS, Moon S, Yoon S, Kapadia M, Pavlovic V. MUSE-VAE: multi-scale vae for environment-aware long term trajectory prediction. In: Proceedings of the IEEE/CVF Conference on Computer Vision and Pattern Recognition. New Orleans, LA, USA; 2022. p. 2221–30. [Google Scholar]
29. Gu T, Chen G, Li J, Lin C, Rao Y, Zhou J, et al. Stochastic trajectory prediction via motion indeterminacy diffusion. In: Proceedings of the IEEE/CVF Conference on Computer Vision and Pattern Recognition. New Orleans, LA, USA; 2022. p. 17113–22. [Google Scholar]
30. Chen W, Sang H, Wang J, Zhao Z. STIGCN: spatial-temporal interaction-aware graph convolution network for pedestrian trajectory prediction. J Supercomput. 2024;80(8):10695–719. doi:10.21203/rs.3.rs-3170302/v1. [Google Scholar] [CrossRef]
31. Shi L, Wang L, Long C, Zhou S, Zhou M, Niu Z, et al. SGCN: sparse graph convolution network for pedestrian trajectory prediction. In: Proceedings of the IEEE/CVF Conference on Computer Vision and Pattern Recognition. Nashville, TN, USA; 2021. p. 8994–9003. [Google Scholar]
32. Chen W, Sang H, Wang J, Zhao Z. IMGCN: interpretable masked graph convolution network for pedestrian trajectory prediction. Transport B Trans Dynam. 2024;12(1):2389896. doi:10.1080/21680566.2024.2389896. [Google Scholar] [CrossRef]
33. Li R, Katsigiannis S, Kim TK, Shum HP. BP-SGCN: behavioral pseudo-label informed sparse graph convolution network for pedestrian and heterogeneous trajectory prediction. IEEE Trans Neural Netw Learn Syst. 2025:1–15. doi:10.1109/tnnls.2025.3545268. [Google Scholar] [PubMed] [CrossRef]
34. Veličković P, Cucurull G, Casanova A, Romero-Soriano A, Liò P, Bengio Y. Graph attention networks. In: International Conference on Learning Representations. Vancouver, BC, Canana; 2018. [Google Scholar]
35. Huang Y, Bi H, Li Z, Mao T, Wang Z. STGAT: modeling spatial-temporal interactions for human trajectory prediction. In: Proceedings of the IEEE/CVF International Conference on Computer Vision. Seoul, Republic of Korea; 2019. p. 6272–81. [Google Scholar]
36. Pellegrini S, Ess A, Schindler K, Van Gool L. You’ll never walk alone: modeling social behavior for multi-target tracking. In: 2009 IEEE 12th International Conference on Computer Vision. Kyoto, Japan; 2009. p. 261–8. [Google Scholar]
37. Lerner A, Chrysanthou Y, Lischinski D. Crowds by example. Comput Graph Forum. 2007;26(3):655–64. [Google Scholar]
38. Lin X, Zhang Y, Wang S, Hu Y, Yin B. OST-HGCN: optimized spatial-temporal hypergraph convolution network for trajectory prediction. IEEE Trans Intell Transp Syst. 2025;26(3):3056–70. doi:10.1109/tits.2025.3529666. [Google Scholar] [CrossRef]
39. Ruan K, Di X. Infostgcan: an information-maximizing spatial-temporal graph convolutional attention network for heterogeneous human trajectory prediction. Computers. 2024;13(6):151. doi:10.3390/computers13060151. [Google Scholar] [CrossRef]
40. Zhou H, Ren D, Xia H, Fan M, Yang X, Huang H. AST-GNN: an attention-based spatio-temporal graph neural network for interaction-aware pedestrian trajectory prediction. Neurocomputing. 2021;445:298–308. doi:10.1016/j.neucom.2021.03.024. [Google Scholar] [CrossRef]
41. Sang H, Chen W, Wang J, Zhao Z. RDGCN: reasonably dense graph convolution network for pedestrian trajectory prediction. Measurement. 2023;213(5):112675. doi:10.1016/j.measurement.2023.112675. [Google Scholar] [CrossRef]
42. Yang C, Pan H, Sun W, Gao H. Social self-attention generative adversarial networks for human trajectory prediction. IEEE Trans Artificial Intell. 2023;5(4):1805–15. doi:10.1109/tai.2023.3299899. [Google Scholar] [CrossRef]
Cite This Article
 Copyright © 2025 The Author(s). Published by Tech Science Press.
This work is licensed under a Creative Commons Attribution 4.0 International License , which permits unrestricted use, distribution, and reproduction in any medium, provided the original work is properly cited.
 Downloads
 Citation Tools