
 Submit a Paper
 Propose a Special lssue
 Open Access
ARTICLE
A Comparative Study of Data Representation Techniques for Deep Learning-Based Classification of Promoter and Histone-Associated DNA Regions
1 Computer Science Department, College of Computer and Information Sciences, King Saud University, P.O. Box 51178, Riyadh, 11543, Saudi Arabia
2 Chemical Engineering, Indian Institute of Technology Kharagpur, Kharagpur, 721302, India
3 Computer Science and Engineering Department, Punjab Engineering College, Sector 12, Chandigarh, 160012, India
* Corresponding Author: Sarab Almuhaideb. Email:
(This article belongs to the Special Issue: Emerging Machine Learning Methods and Applications)
Computers, Materials & Continua 2025, 85(2), 3095-3128. https://doi.org/10.32604/cmc.2025.067390
Received 01 May 2025; Accepted 09 July 2025; Issue published 23 September 2025
 View Full Text
 Download PDF
Abstract
Many bioinformatics applications require determining the class of a newly sequenced Deoxyribonucleic acid (DNA) sequence, making DNA sequence classification an integral step in performing bioinformatics analysis, where large biomedical datasets are transformed into valuable knowledge. Existing methods rely on a feature extraction step and suffer from high computational time requirements. In contrast, newer approaches leveraging deep learning have shown significant promise in enhancing accuracy and efficiency. In this paper, we investigate the performance of various deep learning architectures: Convolutional Neural Network (CNN), CNN-Long Short-Term Memory (CNN-LSTM), CNN-Bidirectional Long Short-Term Memory (CNN-BiLSTM), Residual Network (ResNet), and InceptionV3 for DNA sequence classification. Various numerical and visual data representation techniques are utilized to represent the input datasets, including: label encoding, -mer sentence encoding, -mer one-hot vector, Frequency Chaos Game Representation (FCGR) and 5-Color Map (ColorSquare). Three datasets are used for the training of the models including H3, H4 and DNA Sequence Dataset (Yeast, Human, Arabidopsis Thaliana). Experiments are performed to determine which combination of DNA representation and deep learning architecture yields improved performance for the classification task. Our results indicate that using a hybrid CNN-LSTM neural network trained on DNA sequences represented as one-hot encoded -mer sequences yields the best performance, achieving an accuracy of 92.1%.Keywords
The volume of biological data available to researchers is growing at an unprecedented pace, especially with recent developments in sequencing technologies. For example, GenBank contains 15.3 trillion base pairs from over 2.5 billion nucleotide sequences for 504,000 species [1]. Also, as of December 2024, the National Institutes of Health’s (NIH) Sequence Read Archive (SRA) hosts a total of 34.5 million samples from all domains of life, comprising more than 107 petabases of sequencing data—equivalent to 38 petabytes of raw data [2]. Thus, the analysis of this huge data is an important step for many applications, such as finding changes in genes, associations with diseases and phenotypes, as well as the ability to identify potential drug targets. Deoxyribonucleic acid (DNA) is the main biomolecule that carries all genetic information and instructions. The task of DNA sequence classification involves determining whether an unlabelled DNA sequence belongs to a certain class. The problem of sequence classification can be formulated as follows: Given a set of sequences
Given the vast volume and variety of biological data, relying on wet-lab experiments has become inefficient. Traditional manual laboratory experiments cannot scale to handle the millions of samples available in repositories such as GenBank and the SRA. There are several computational methods to classify DNA sequences such as sequence alignment and consensus search-based methods [4], however, recent studies show that machine learning techniques have been adopted to accomplish this task, with varying degrees of success [5]. The task of classifying DNA sequences remains challenging due to the nature of biological sequences. A DNA sequence is a non-numerical sequence, with unknown relationships between nucleotides that contribute to the structure and function of the produced proteins. Moreover, the variability in DNA sample lengths further complicates the classification task [5], highlighting the need for innovative, AI-driven solutions that mimic biological processes to improve accuracy and efficiency in this domain.
Many machine learning algorithms are designed to work on an explicit set of features. However, sequence data have no explicit features and thus need to be transformed first using a preprocessing step. The resulting feature space may be high dimensional, which results in high computation and memory requirements. There are many data representation techniques that are used to deal with DNA data, such as label encoding [6],
The aim of this research is to provide a deeper understanding of the impact of DNA sequence-representation techniques, i.e., the preprocessing step, on the performance of various deep learning models. In order to accomplish this task, we compare the two main types of representation: numerical and visual, using appropriate models. To compare the numerical representations, we use two custom-built convolutional neural networks (CNN), and two custom-built hybrid CNN-Long Short-Term Memory (CNN-LSTM) neural networks. To compare the visual representations, we use two publicly available successful models, namely: Residual Network (ResNet50) [12] and InceptionV3 [13]. We evaluate the performance of our proposed models using the three benchmark datasets, H3 occupancy, H4 occupancy [14], and DNA Sequence Dataset (Yeast, Human, Arabidopsis Thaliana). The benefits of this paper to future research are three-fold, firstly, the comparison of various data representation techniques allows researchers to select the most successful one. Secondly, for the numerical representation, we compare the convolutional and hybridized recurrent neural network architectures for the DNA classification task, to ascertain the more successful approach. Finally, we allow future researchers to determine whether their own custom-built network is more desirable, compared with using transfer learning on an existing and publicly available model. The comparative results demonstrate that one-hot vector representation of DNA sequence
DNA sequence analysis is a key task in bioinformatics for understanding an organism’s genes, functions, and evolutionary relationships. With the ever-increasing availability of DNA sequences, relying solely on wet-lab experiments is no longer efficient, as they require specialized equipment, time, and costly reagents [15]. DNA sequence analysis is an indispensable tool for understanding gene expression regulation, gene function, and genome structure, to name just a few. Many bioinformatics applications involve the classification of DNA sequences, such as identifying enhancers, promoters, splice sites, and transcription factor binding sites. Depending on the application, the problem can be formulated as a binary, multi-class, or multi-label classification task.
Machine learning algorithms have been widely used for biological sequence classification [16]. One of the earliest attempts to address biological sequence classification was conducted by [17], who evaluated the performance of
The demonstrated success of deep learning in various fields has encouraged its adoption in numerous bioinformatics tasks [22–25]. This presents an opportunity to harness the power of DL methods as an alternative to more traditional alignment and consensus search-based techniques to classify DNA/Ribonucleic acid (RNA) sequences. In 2016, Rizzo et al. [8] proposed CNNs to classify the FCGR of DNA sequences. One thousand sequences were randomly selected from three categories of bacteria from the 16S bacteria dataset and used for training a CNN that outperformed an SVM classifier on the same task. Nguyen et al. [7] utilized a neural network architecture called seqCNN to classify DNA sequences from 10 different datasets. The authors used one-hot vector representations of DNA sequence
The classification of viral DNA sequences using DL models was undertaken by Gunasekaran et al. [6]. They compared the performance of standalone one-dimensional (1D) CNNs with those of other neural network architectures that combined CNNs with LSTM recurrent layers (CNN-LSTM and CNN-BILSTM). During data preprocessing, DNA sequences are converted to an array of integers where each nucleotide corresponds to a fixed number or the arrays were used to generate
Before feeding raw biological sequences into deep learning algorithms, it is essential to convert them into an appropriate numerical or structured representation. The performance of the final model is heavily influenced by the choice of representation techniques used to encode biological sequences. These techniques play a critical role in capturing the underlying biological patterns and ensuring the model can effectively learn meaningful features from the data [28]. Bhandari et al. [29] compared the effect of various DNA sequence-encoding techniques on various machine-learning and DL algorithms during the classification of promoter sequences. They found that using frequency-based tokenization reduced training time without compromising the sensitivity and specificity of classification compared to using one-hot vectors, and that CNNs performed the best out of all the aforementioned classifiers in classifying promoter vs. non-promoter sequences (binary classification) as well as in species-specific classification of promoter sequences (multiclass classification). Related to capturing long-term interactions, a sparse and wide neural network is utilized for learning on lengthy DNA sequences, referred to as SwanDNA [30]. The model features a circular and multi-scale dilated architecture intended to capture long-range interactions within DNA sequences. The authors employ self-supervised learning allowing SwanDNA to minimize its need for supervised labels.
The identification of transcription factor binding sites (TFBSs) has gained attention due to its importance in understanding gene expression regulation and disease mechanisms. DNA sequence and shape features were integrated using convolutional neural networks (CNNs) and attention mechanisms [31]. This approach addresses the challenge of combining local and global features, demonstrating improved predictive performance across numerous validated ChIP-seq datasets. To simultaneously incorporate both DNA sequence and shape features, the authors [32] developed a model for predicting TFBSs that combines attention mechanisms, convolutional networks, and Recurrent Neural Networks (RNNs). The findings indicate that the proposed model, DeepCTF, improves TFBS prediction accuracy using 12
Transformers are advanced deep learning architectures originally introduced for natural language processing (NLP) tasks, where they demonstrated remarkable performance in modeling long-range dependencies and contextual relationships. Building on their superior performance in NLP, transformers have been applied to biological sequence classification tasks. In [28], a 1-Dimentional Deep CNN (1DCNN) and an LSTM were compared to a model consisting of dual transformer blocks used to extract deep features from DNA sequence data encoded using
The literature has evolved from traditional machine learning techniques such as SVMs and Decision Trees to deep learning architectures. Early works demonstrated the superiority of SVMs, especially with well-chosen features, while more recent studies have leveraged CNNs and RNNs for improved performance. CNNs have been particularly effective in capturing spatial patterns in encoded sequences, as shown by their success in tasks such as promoter prediction, TFBS identification, and bacterial DNA classification. However, CNNs may struggle to model long-range dependencies within sequences. To address this, hybrid models combining CNNs with LSTM or BiLSTM architectures have emerged, demonstrating improved classification accuracy, especially when using
DL methods are more efficient and effective in many applications, including computer vision, speech recognition, and medical applications [41]. In this paper, we use DL architectures to build DNA classification models. Before raw DNA sequences can be fed to DL models, data must be transformed into a suitable representation to enable the DL model to extract features. The data-representation technique plays an important role in determining the classification accuracy [5,9]. Fig. 1 illustrates a schematic view of the experiments. In the following sections, we describe the two benchmark datasets employed, the five data-representation techniques utilized, and the architectures of the five DL models examined in this study.
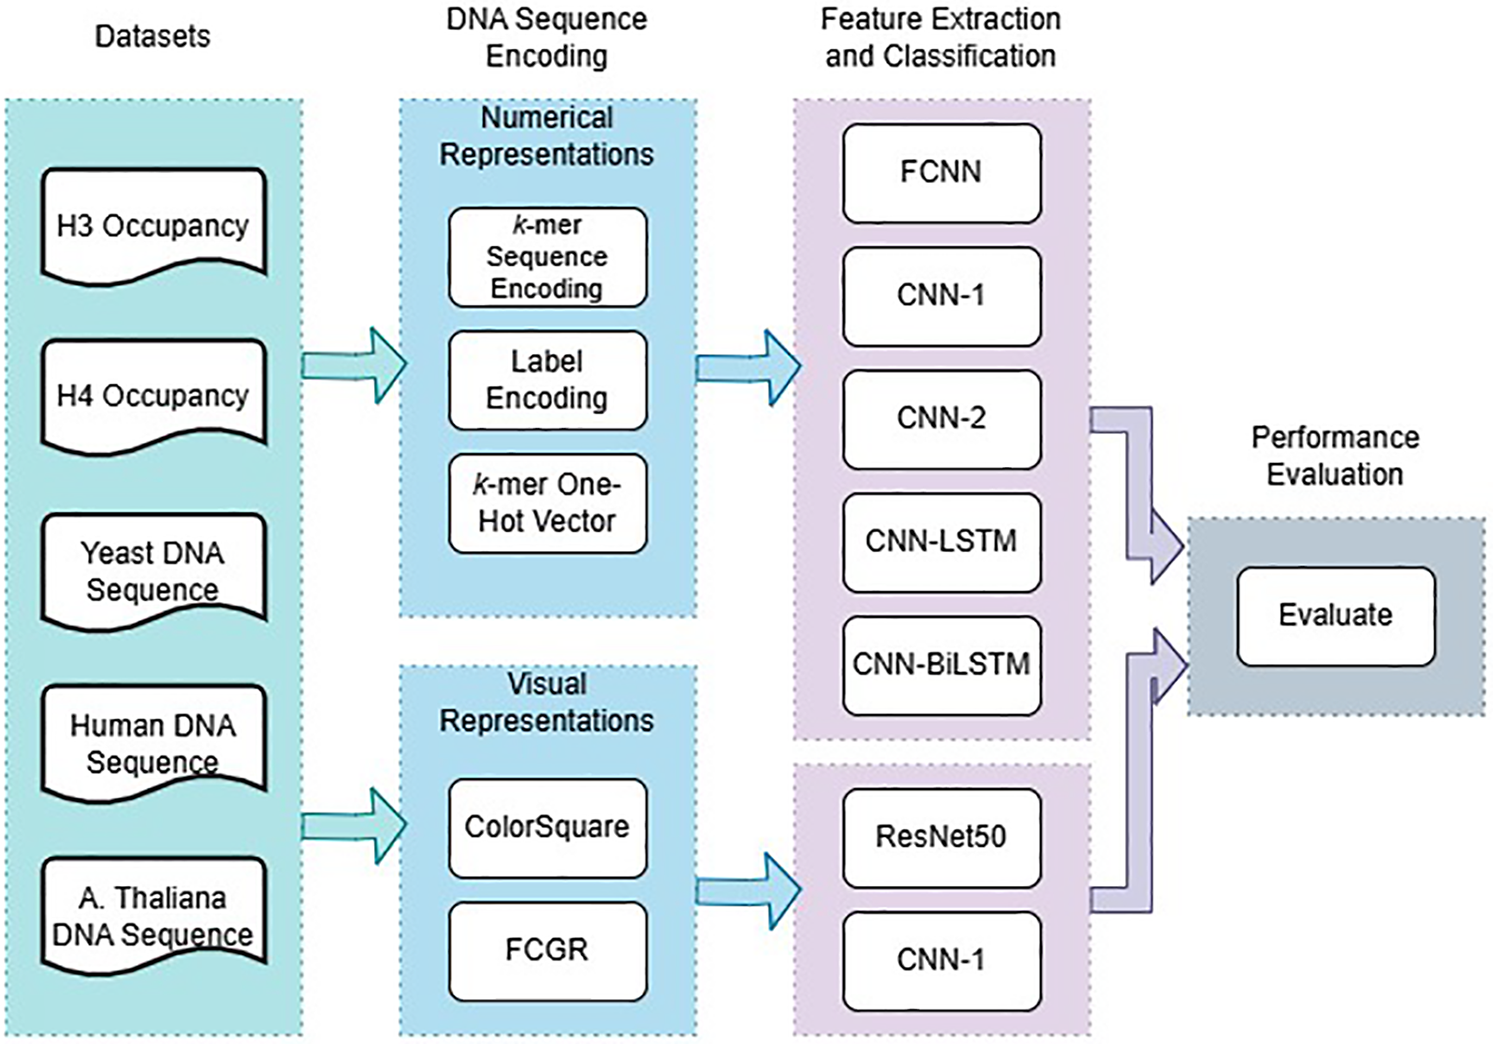
Figure 1: A schematic view of the DNA classification experiments
We employed three datasets to evaluate the performance of various models and data-representation techniques for DNA classification: H3 and H4 occupancy [14], DNA Sequence Dataset (Yeast, Human, Arabidopsis Thaliana).
3.1.1 H3 and H4 Occupancy Dataset
H3 and H4 datasets include details on yeast DNA sequences wrapped around histone proteins, forming chromatin to be packed into a cell’s nucleus. The packing process also prevents the DNA sequences from being tangled and becoming damaged. H3 and H4 refer to the type of histone around which the DNA sequence is wrapped. The histone occupancy type is one of the most important factors determining gene expression; hence, exploring computationally efficient processes to determine the type of histone occupancy in a DNA sequence is an active field of research because it enables a better understanding of expression patterns in genes. Both datasets include sequences with a length of 500 base pairs belonging to either a “Positive” or “Negative” class. H3 has 7667 positive and 7298 negative base pairs, and H4 has 6480 positive and 8121 negative base pairs. Sequences belonging to the “Positive” class contain regions that are wrapped around a histone protein of the type indicated by the name of the dataset (“H3” or “H4”).
The DNA sequence dataset consisted of genomes of Saccharomyces cerevisiae (yeast), Arabidopsis Thaliana (A. Thaliana), and human samples reported by [29], and accessed through the University of California, Santa Cruz (UCSC) Genome Browser. The original dataset comprised approximately 6125 sequences from the yeast genome (UCSC version sacCer3), 41,671 sequences from the A. Thaliana genome (UCSC version araTha1), and 61,546 sequences from the human genome (UCSC version hg38). These sequences were curated to represent putative promoter regions, which are of particular interest in gene regulation studies. To ensure consistency and manageable dataset sizes for model development, a random selection of sequences was performed following preprocessing and quality filtering. Specifically, 6000 sequences were retained for yeast, while 35,000 sequences each were selected for A. Thaliana and human genomes.
Each selected sequence represented a putative promoter region of 1000 base pairs in length, covering the region from −700 to +300 base pairs relative to the annotated transcription start site (TSS). The extraction of these sequences was conducted in two stages. In the first stage, 700 base pairs upstream of the TSS were retrieved using the UCSC Table Browser, with the Reference Sequence (RefSeq) Genes track serving as the input to create a custom annotation track. In the second stage, an additional 300 base pairs downstream of the TSS were extracted using the custom track, resulting in a complete 1000 bp promoter region for each gene, which was then saved in FASTA format [42].
To construct a balanced dataset for classification tasks, an equal number of background (negative) sequences were generated for each organism. These sequences were created through a synthetic shuffling process of the original promoter sequences. This ensured a 1:1 ratio of positive (true promoter) to negative (synthetic background) sequences, which is essential for reducing bias during model training. The final datasets were separately processed to develop and evaluate organism-specific machine learning models tailored to each genome.
3.2 DNA Sequence Representation
Preprocessing the raw data representing the DNA sequences into a suitable form for use as input to train the DL algorithms is an integral step towards building predictive systems for classification, as the method of encoding can have a significant impact on a model’s performance. In this paper, we explore five methods to encode DNA sequences:
3.2.1 Numerical Representations
1.
2. Label Encoding: In this encoding technique, each nucleotide is assigned a numerical value, for example,
3. k-mer One-Hot Vector: One-hot
1. ColorSquare: The ColorSquare encoding technique, also known as the five-color map, is derived from the representation proposed by [43]. A
2. FCGR (Frequency Chaos Game Representation) is a graphical representation of a sequence [44] that is used to convert a long 1D sequence into graphical form. The frequencies of the
(a) Start from position (0, 0).
(b) Four nucleotides are located at the four corners:
• A: (−1, 1) upper left
• T: (1, −1) lower right
• G: (1, 1) upper right
• C: (−1, −1) lower left
(c) For each nucleotide in reverse order, move and mark the new location halfway between the current location and the nucleotide. For example, if the last letter is T, the position changes from (0, 0) to the midpoint between (1, −1) and (0, 0), which is (0.5, −0.5).
(d) Repeat this procedure for all nucleotides in the
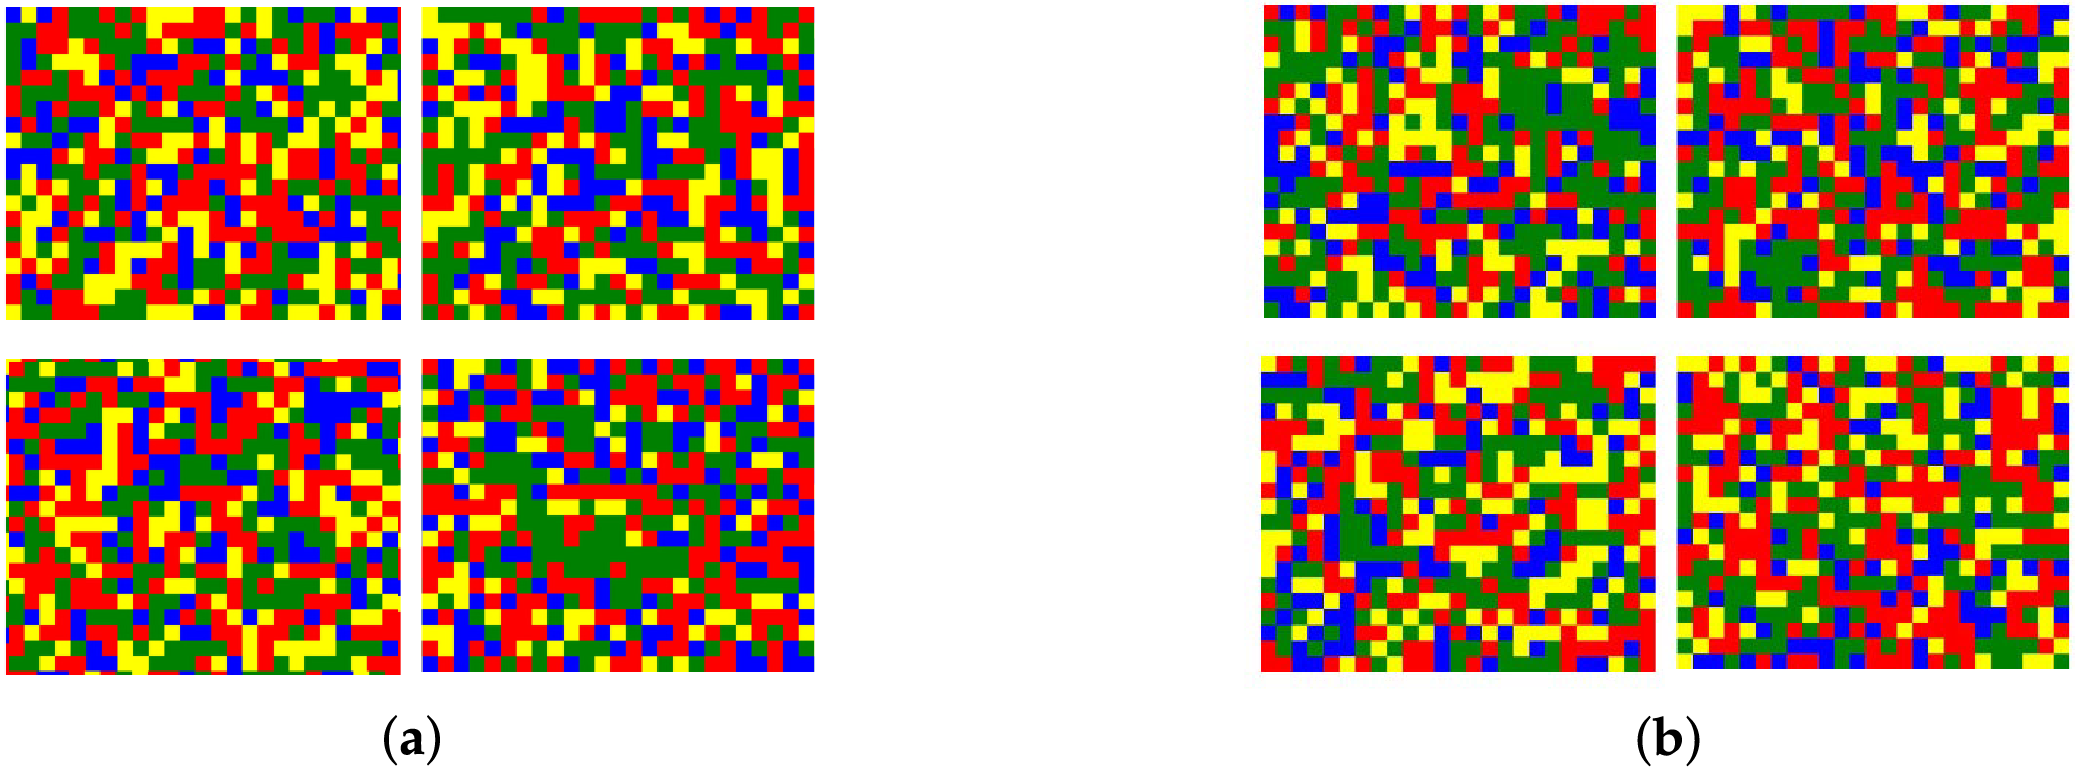
Figure 2: ColorSquare representation. (a) H3 ColorSquare example; (b) H4 ColorSquare example
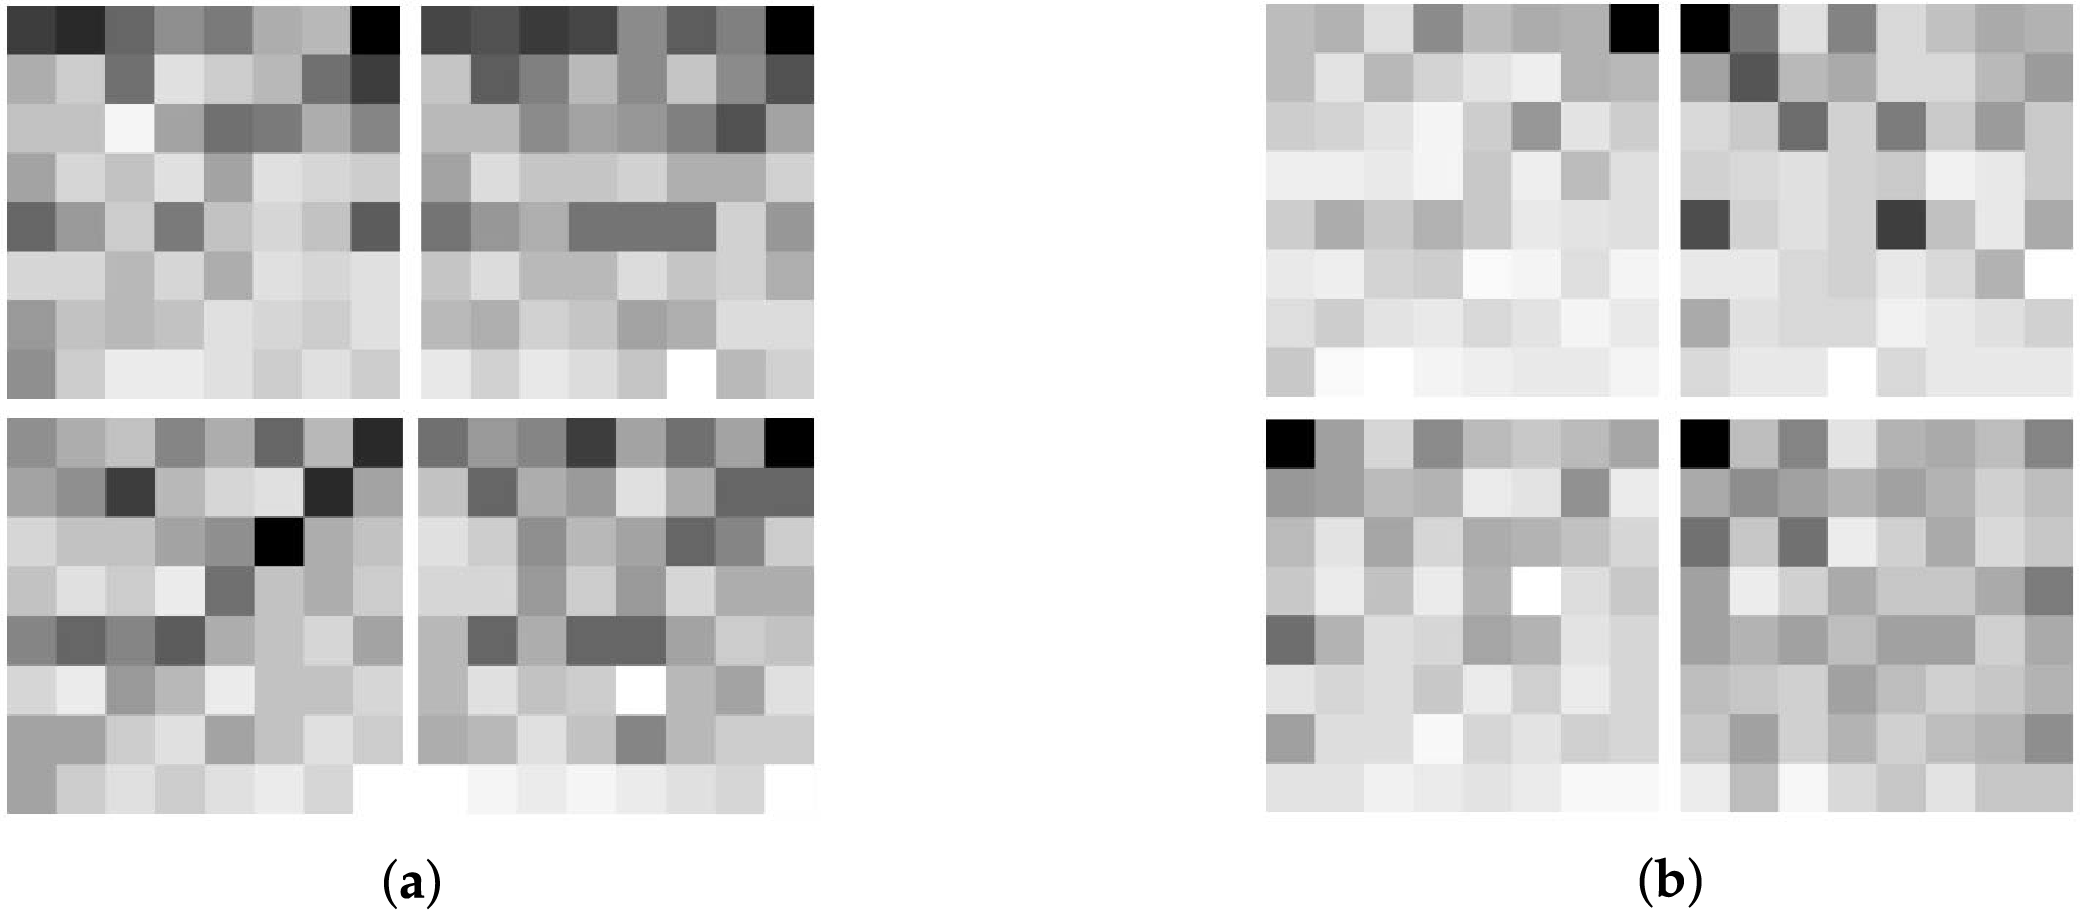
Figure 3: FCGR representation. (a) H3 FCGR example; (b) H4 FCGR example
In this paper, we use six different DL architectures (CNN (two), CNN-LSTM, CNN-BILSTM, ResNet50 and InceptionV3) to classify the various representations of DNA sequences based on the type of histone occupancy present. In addition, as a baseline, we include a simple fully connected neural network. Below, we present a brief description of each architecture utilized.
3.3.1 Numerical Representations
1. CNN: CNNs are among the best learning algorithms for understanding complicated structures. They have shown exceptional performance in tasks including picture segmentation, object detection, and computer vision. Compared to other DL models, CNNs require fewer parameters. As a result, the complexity of the model is reduced and the learning process is improved. We used two variants of a CNN with 1D convolutional layers. Each model has an input size of
(a) CNN-1 processes input images of size
(b) CNN-2 incorporates parallel convolutional layers and a self-attention mechanism to enhance feature extraction. The input layer processes images of size
2. CNN-LSTM: The given neural network architecture combines Convolutional Neural Networks (CNN) with Long Short-Term Memory (LSTM) and an attention mechanism to process image inputs of size
3. CNN-BiLSTM: integrates CNN, BiLSTM, and self-attention to extract spatial and sequential features for classification. The input is an image of size
4. FCNN: The model comprises an input layer followed by three hidden fully connected layers with 256, 128, and 64 neurons, respectively, each utilizing the ReLU activation function. It also incorporates two dropout layers with a rate of 0.3 after both the first and second hidden layers. Dropout was added to reduce overfitting and enhance generalization. The final output layer consists of two neurons with a Softmax activation function. The network was trained using the Adam optimizer and the categorical cross-entropy loss function.
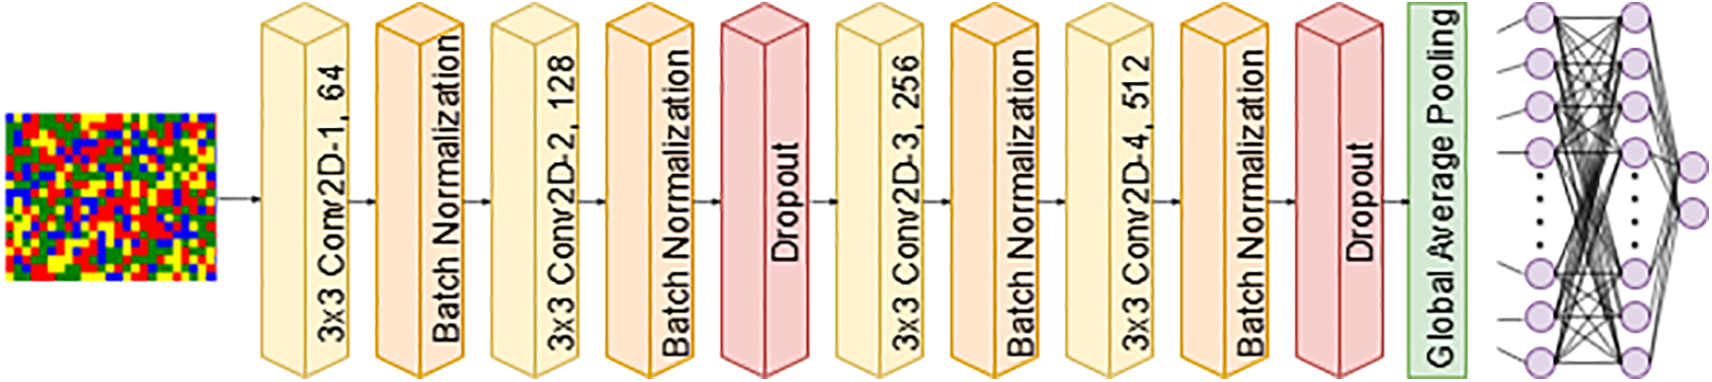
Figure 4: CNN-1 architecture
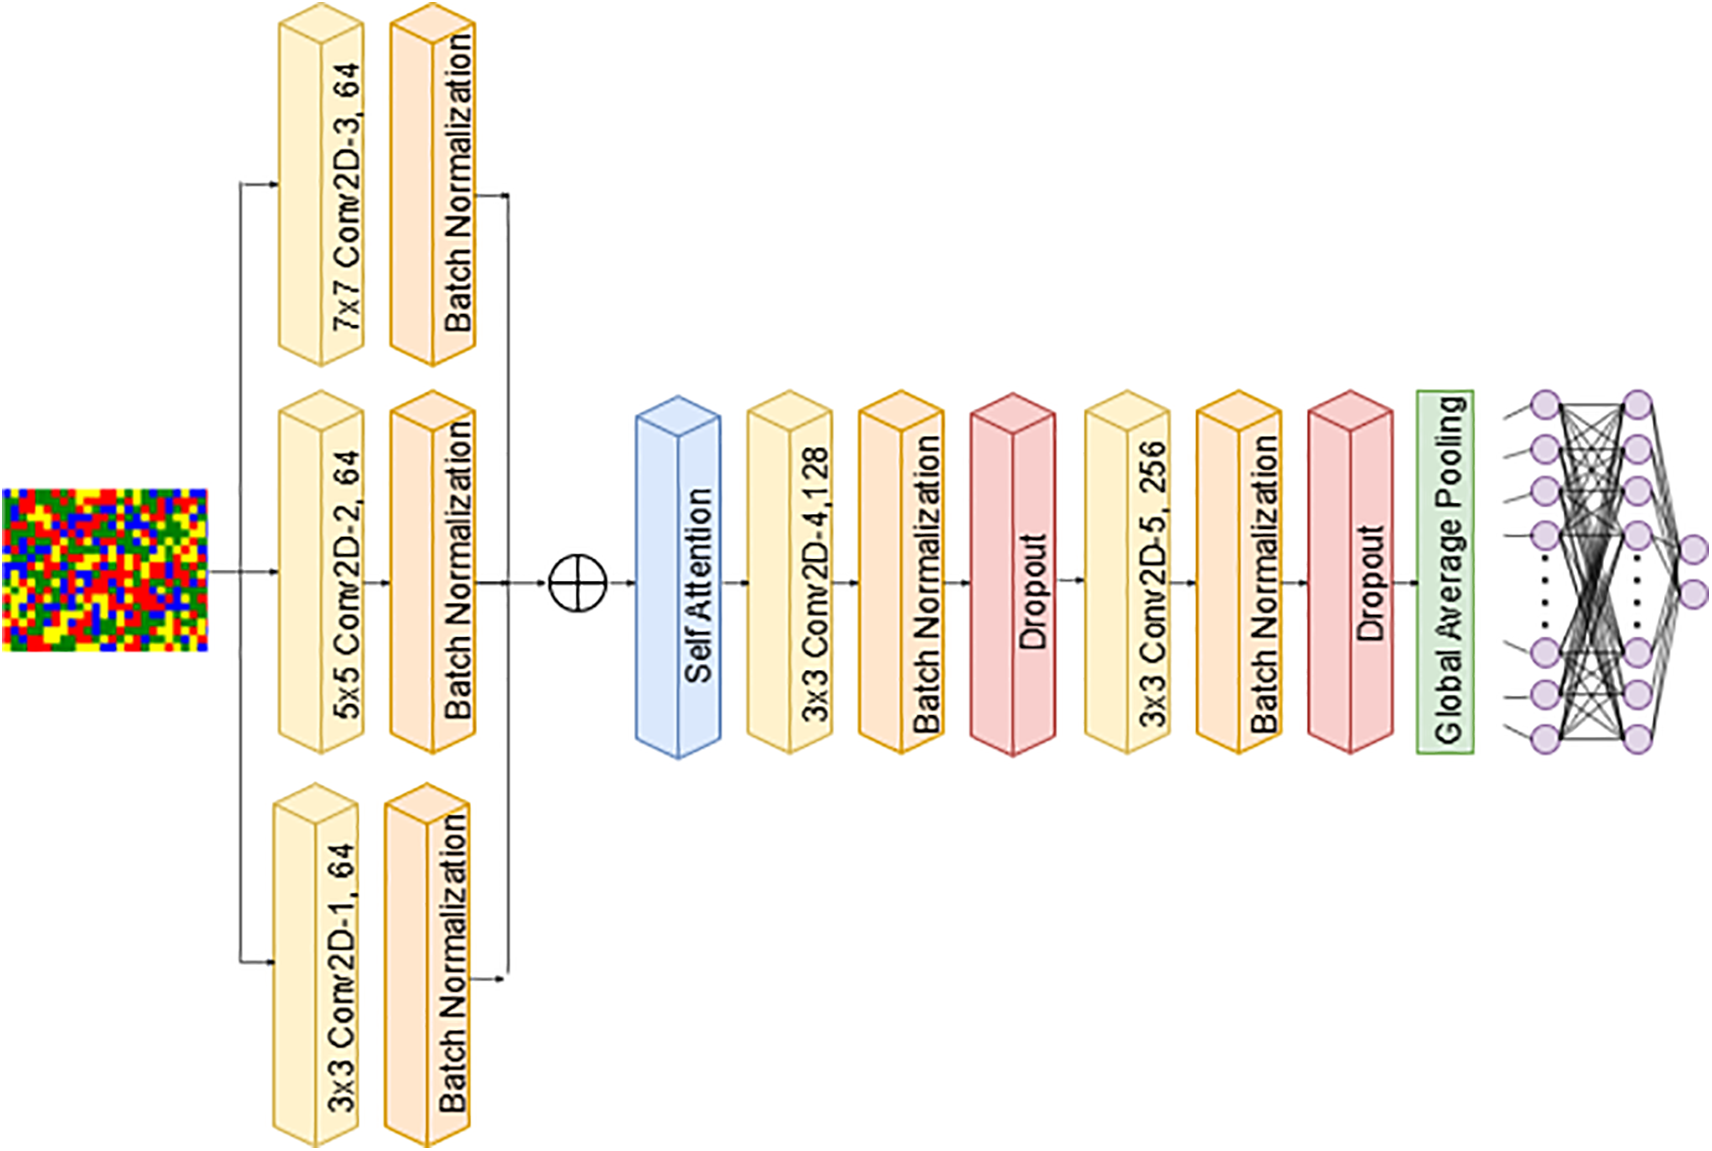
Figure 5: CNN-2 architecture

Figure 6: CNN-LSTM architecture
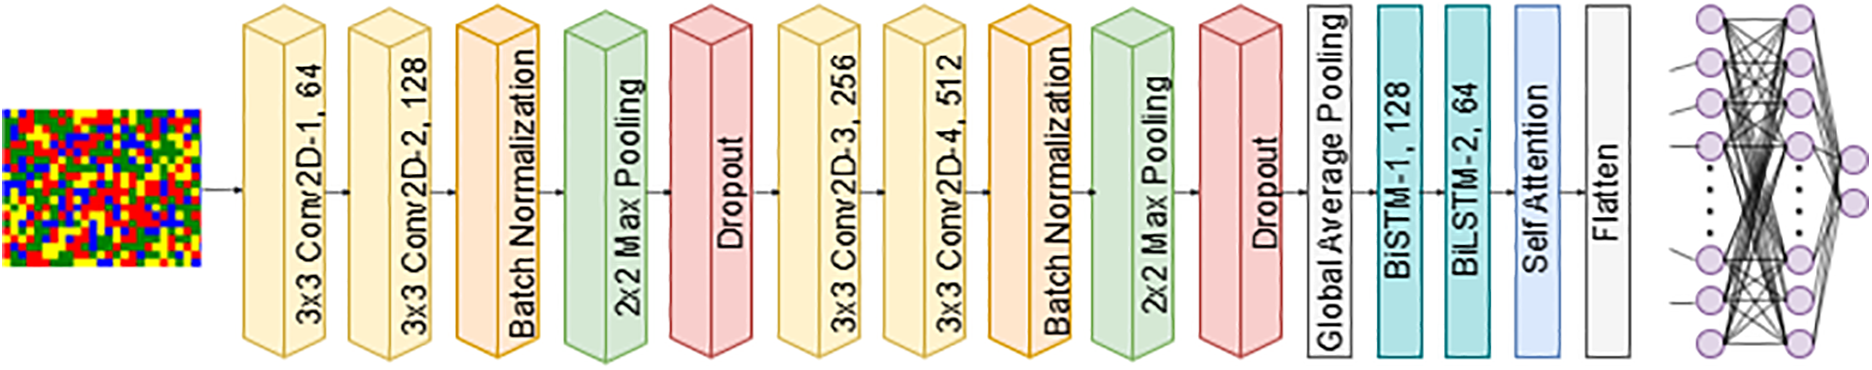
Figure 7: CNN-BiLSTM architecture
1. ResNet50: ResNet-50 [12] is a variant of the ResNet architecture that has 48 convolutional layers, one maximum pooling layer, and one average pooling layer. It is commonly used for image classification owing to its performance on the ImageNet validation dataset (Fig. 8).
2. InceptionV3: InceptionV3 [13] is a superior and more computationally efficient version of the basic InceptionV1 model, introduced as GoogLeNet in 2014. Unlike previous versions, InceptionV3 features smaller asymmetric convolutions to reduce dimensionality and auxiliary classifiers to combat the issue of vanishing gradients (Fig. 9).

Figure 8: ResNet50 architecture
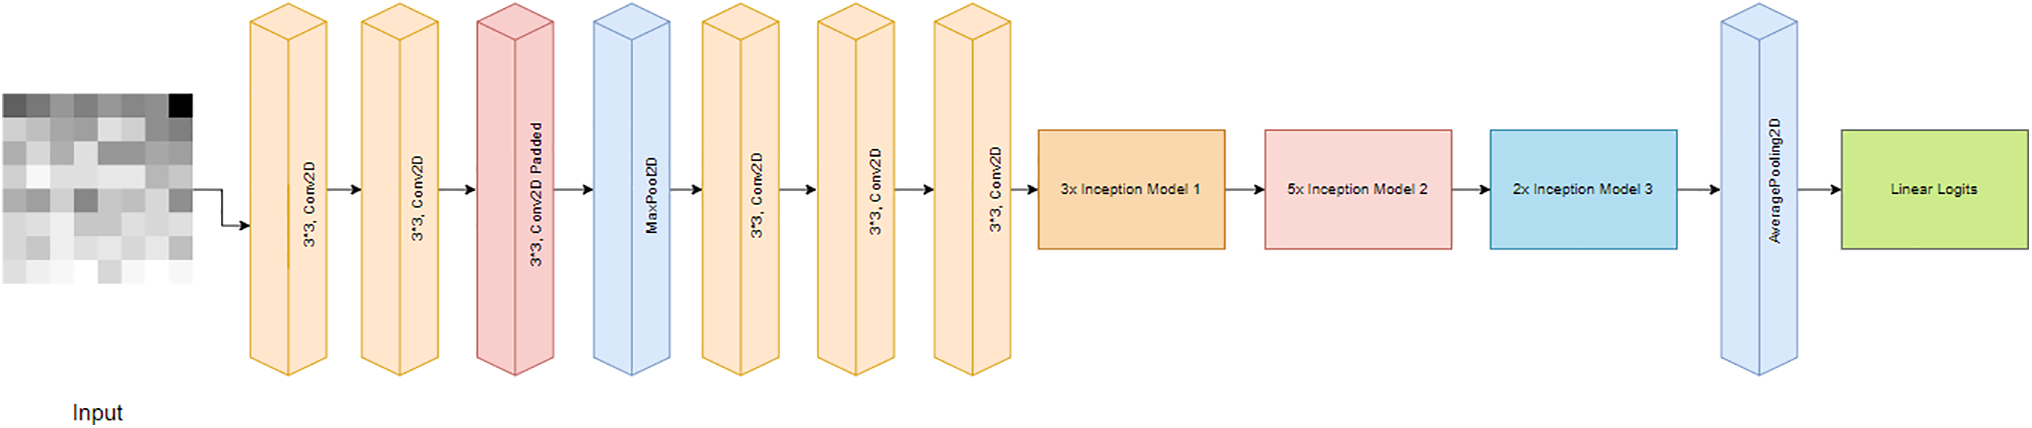
Figure 9: InceptionV3 architecture
Training and evaluation of the deep learning models included in this paper were conducted on a Linux-based system on Google Cloud’s Vertex AI platform. The machine had 4 CPUs, 15 GB RAM, and an NVIDIA Tesla T4 GPU. We used JupyterLab as the IPython notebook interface for pre-processing and modeling our data. The number of training epochs was set to 25 based on preliminary observations, where the training loss consistently followed a negative exponential trend and converged without notable fluctuations. No signs of overfitting were detected, and model performance remained stable across configurations. This choice also reflected a practical trade-off to optimize computational resources, given the large number of experimental scenarios evaluated in this study. The Adam optimizer was used in this study due to its efficient and stable convergence characteristics, particularly useful in handling the high-dimensional and sparse nature of biological sequence data. While alternative optimizers, such as stochastic gradient descent (SGD), are known for their generalization capabilities, Adam enables consistent training across a range of model and input configurations with minimal tuning. As the objective of this work was exploratory, focusing on comparative evaluation rather than fine-tuned optimization, Adam provided a practical balance between performance and training efficiency. The performance of the proposed models was evaluated using the following measures [45]: accuracy (
4.1 Hyperparameter Optimization
We used GridSearch hyperparameter optimization approach. GridSearch ranges were adapted from prior studies in the literature addressing similar biological sequence classification tasks [27,47]. This approach ensured alignment with established practices while avoiding the computational overhead of extensive hyperparameter optimization, consistent with the exploratory scope of this study. Table 1 shows the details of the GridSearch inputs and best values for custom-designed models. The hyperparameter tuning of transfer learning architectures was performed across specified ranges: Learning Rate 0.001, 0.0005, 0.0001, Dropout Rate 0.2, 0.3, 0.4, and Batch Size 16, 32, 64. The remaining hyperparameters were derived from the original implementations by the respective authors. The optimal hyperparameters identified were as follows: for Inception V3, Learning Rate 0.001, Dropout Rate 0.2, and Batch Size 32; for ResNet50, Learning Rate 0.0001, Dropout Rate 0.4, and Batch Size 32.

As mentioned in the introduction, the goal of our experiments is to demonstrate the impact of data representation on the performance of deep learning models for the classification of DNA sequences. The three dataset used in this study are H3 occupancy, H4 occupancy and DNA Sequence Dataset.
Seven deep learning architectures were developed: CNN-1, CNN-2, CNN-LSTM, CNN-BiLSTM, FCNN, ResNet50, and InceptionV3, in order to classify the DNA sequences into two classes (i.e., positive or negative) for H3 and H4, while into seven classes for DNA sequence dataset. Numerical and visual data representation techniques are utilized to represent the input datasets, including:
4.2.1 Numerical Representations
The performance comparison across different encoding schemes reveals notable trends in classification accuracy, sensitivity, specificity, and the


Figure 10: Training. loss and validation loss plots for models on H3 dataset: (a)
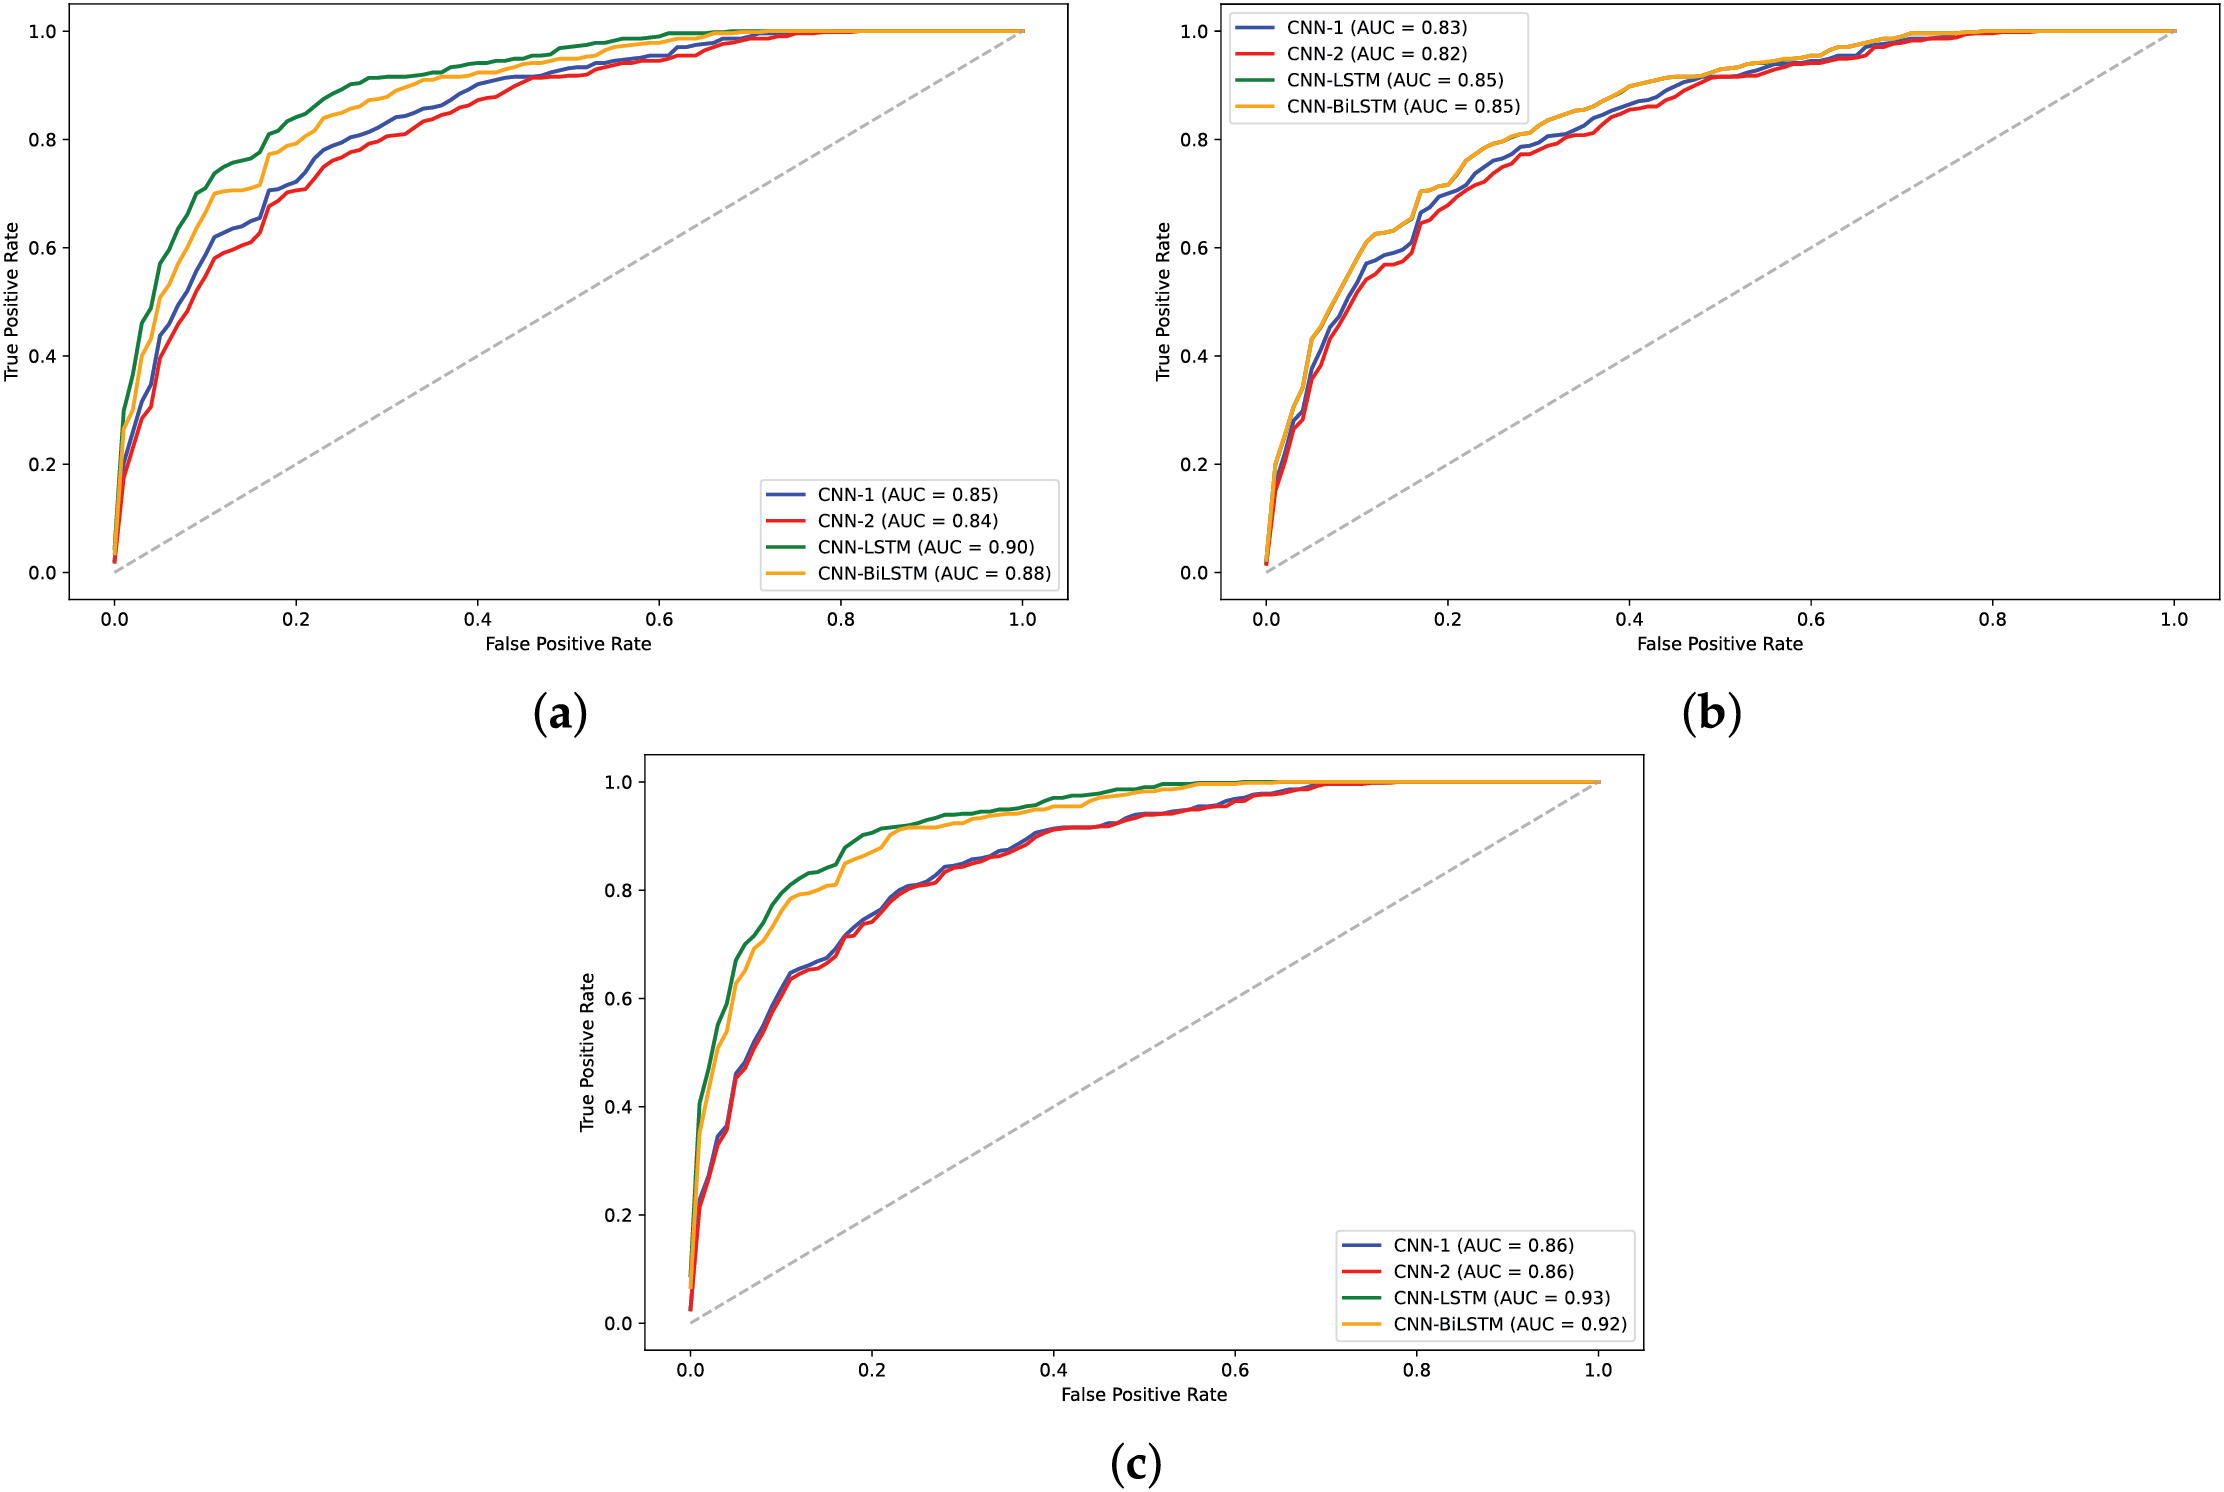
Figure 11: AUC plots for models on H3 dataset: (a)
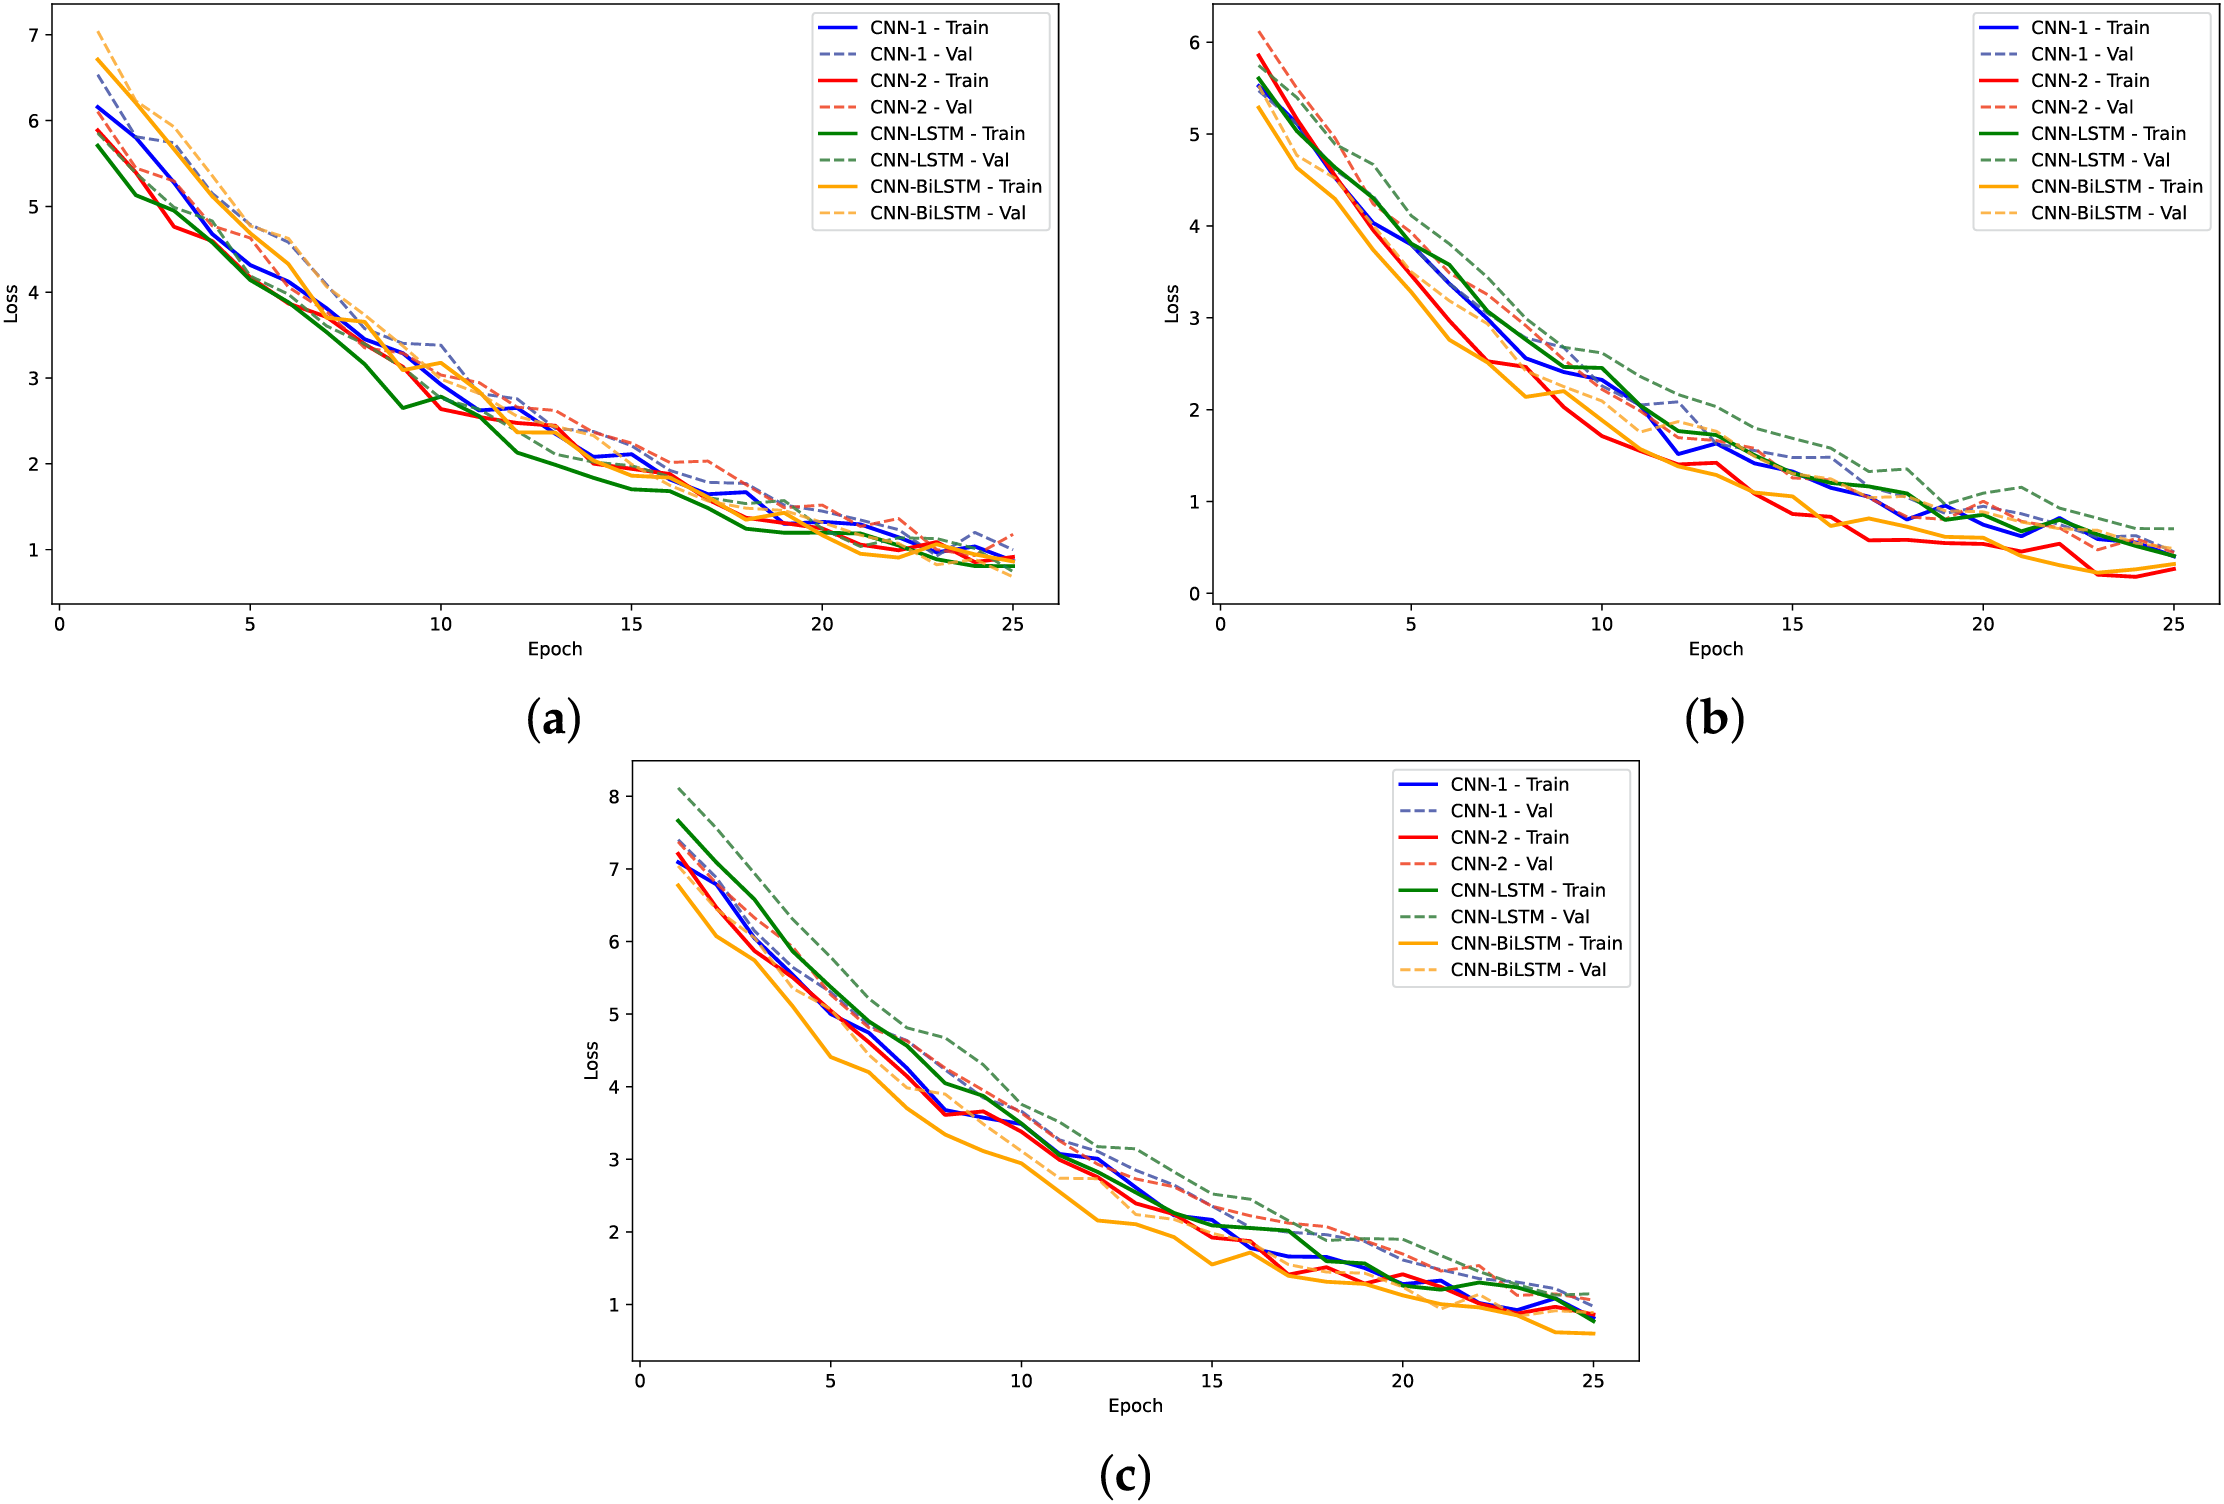
Figure 12: Training loss and validation loss plots for models on H4 dataset: (a)
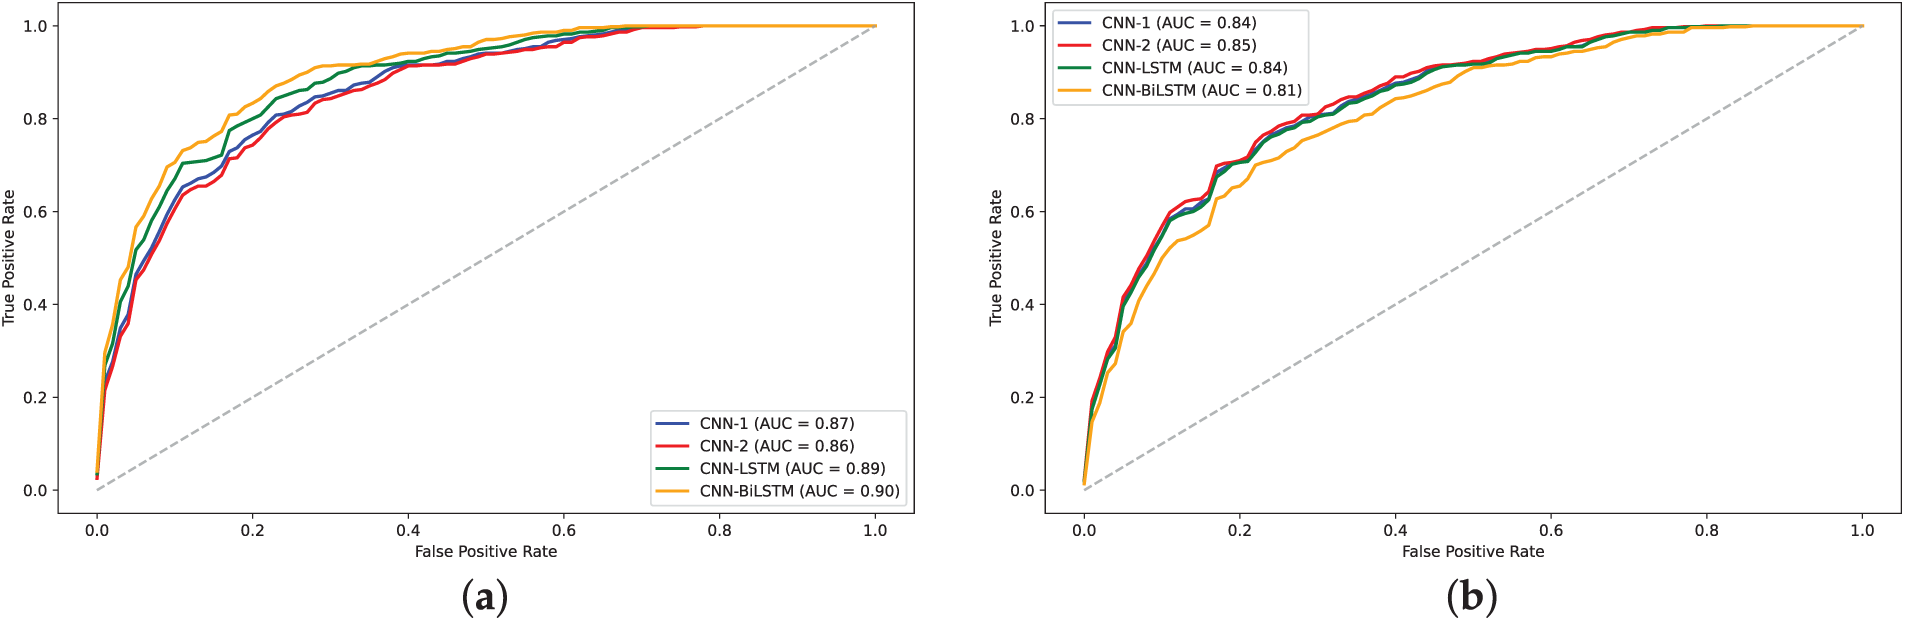
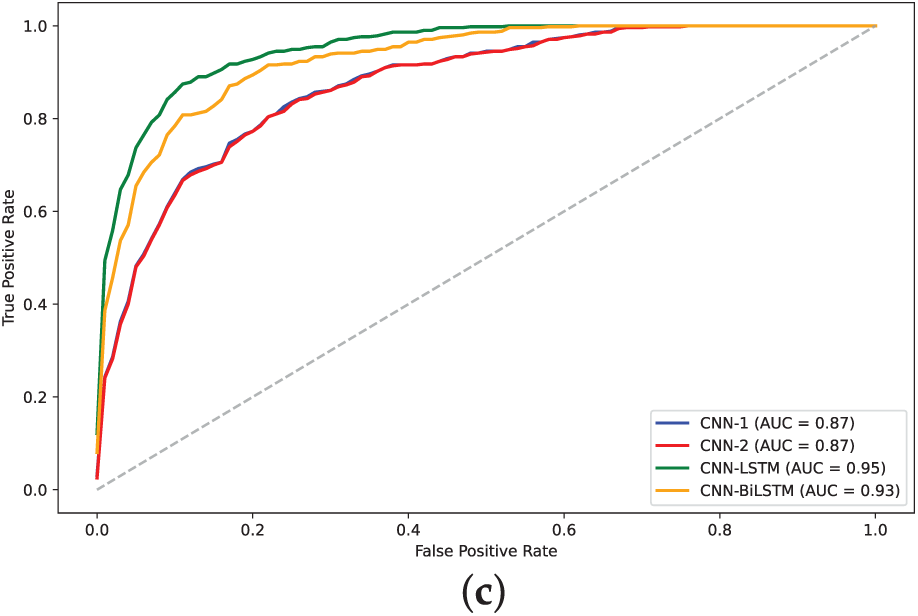
Figure 13: AUC plots for models on H4 dataset: (a)


The analysis of model performance using label encoding indicates that while models like CNN-BiLSTM and CNN-LSTM achieve relatively high accuracies on the H3 dataset, the performance does not significantly improve on the H4 dataset. This inconsistency may arise from the ordinal relationships inherent in label encoding, which LSTMs typically exploit; when such relationships are lacking, the LSTM may learn misleading patterns, leading to degraded performance. Statistical analysis of the
Further evaluation using DNA Sequence Dataset (Table 5, Figs. 14–19) across Yeast, A. Thaliana, and Human datasets shows that the CNN architectures generally outperform CNN-LSTM models. Notably, CNN-2 attained the highest accuracy across several configurations, particularly in 4-mer and 8-mer encoding, achieving up to 99% accuracy in certain cases. The CNN-LSTM models, while effective in some settings, exhibited lower accuracy and sensitivity, particularly in lower-order

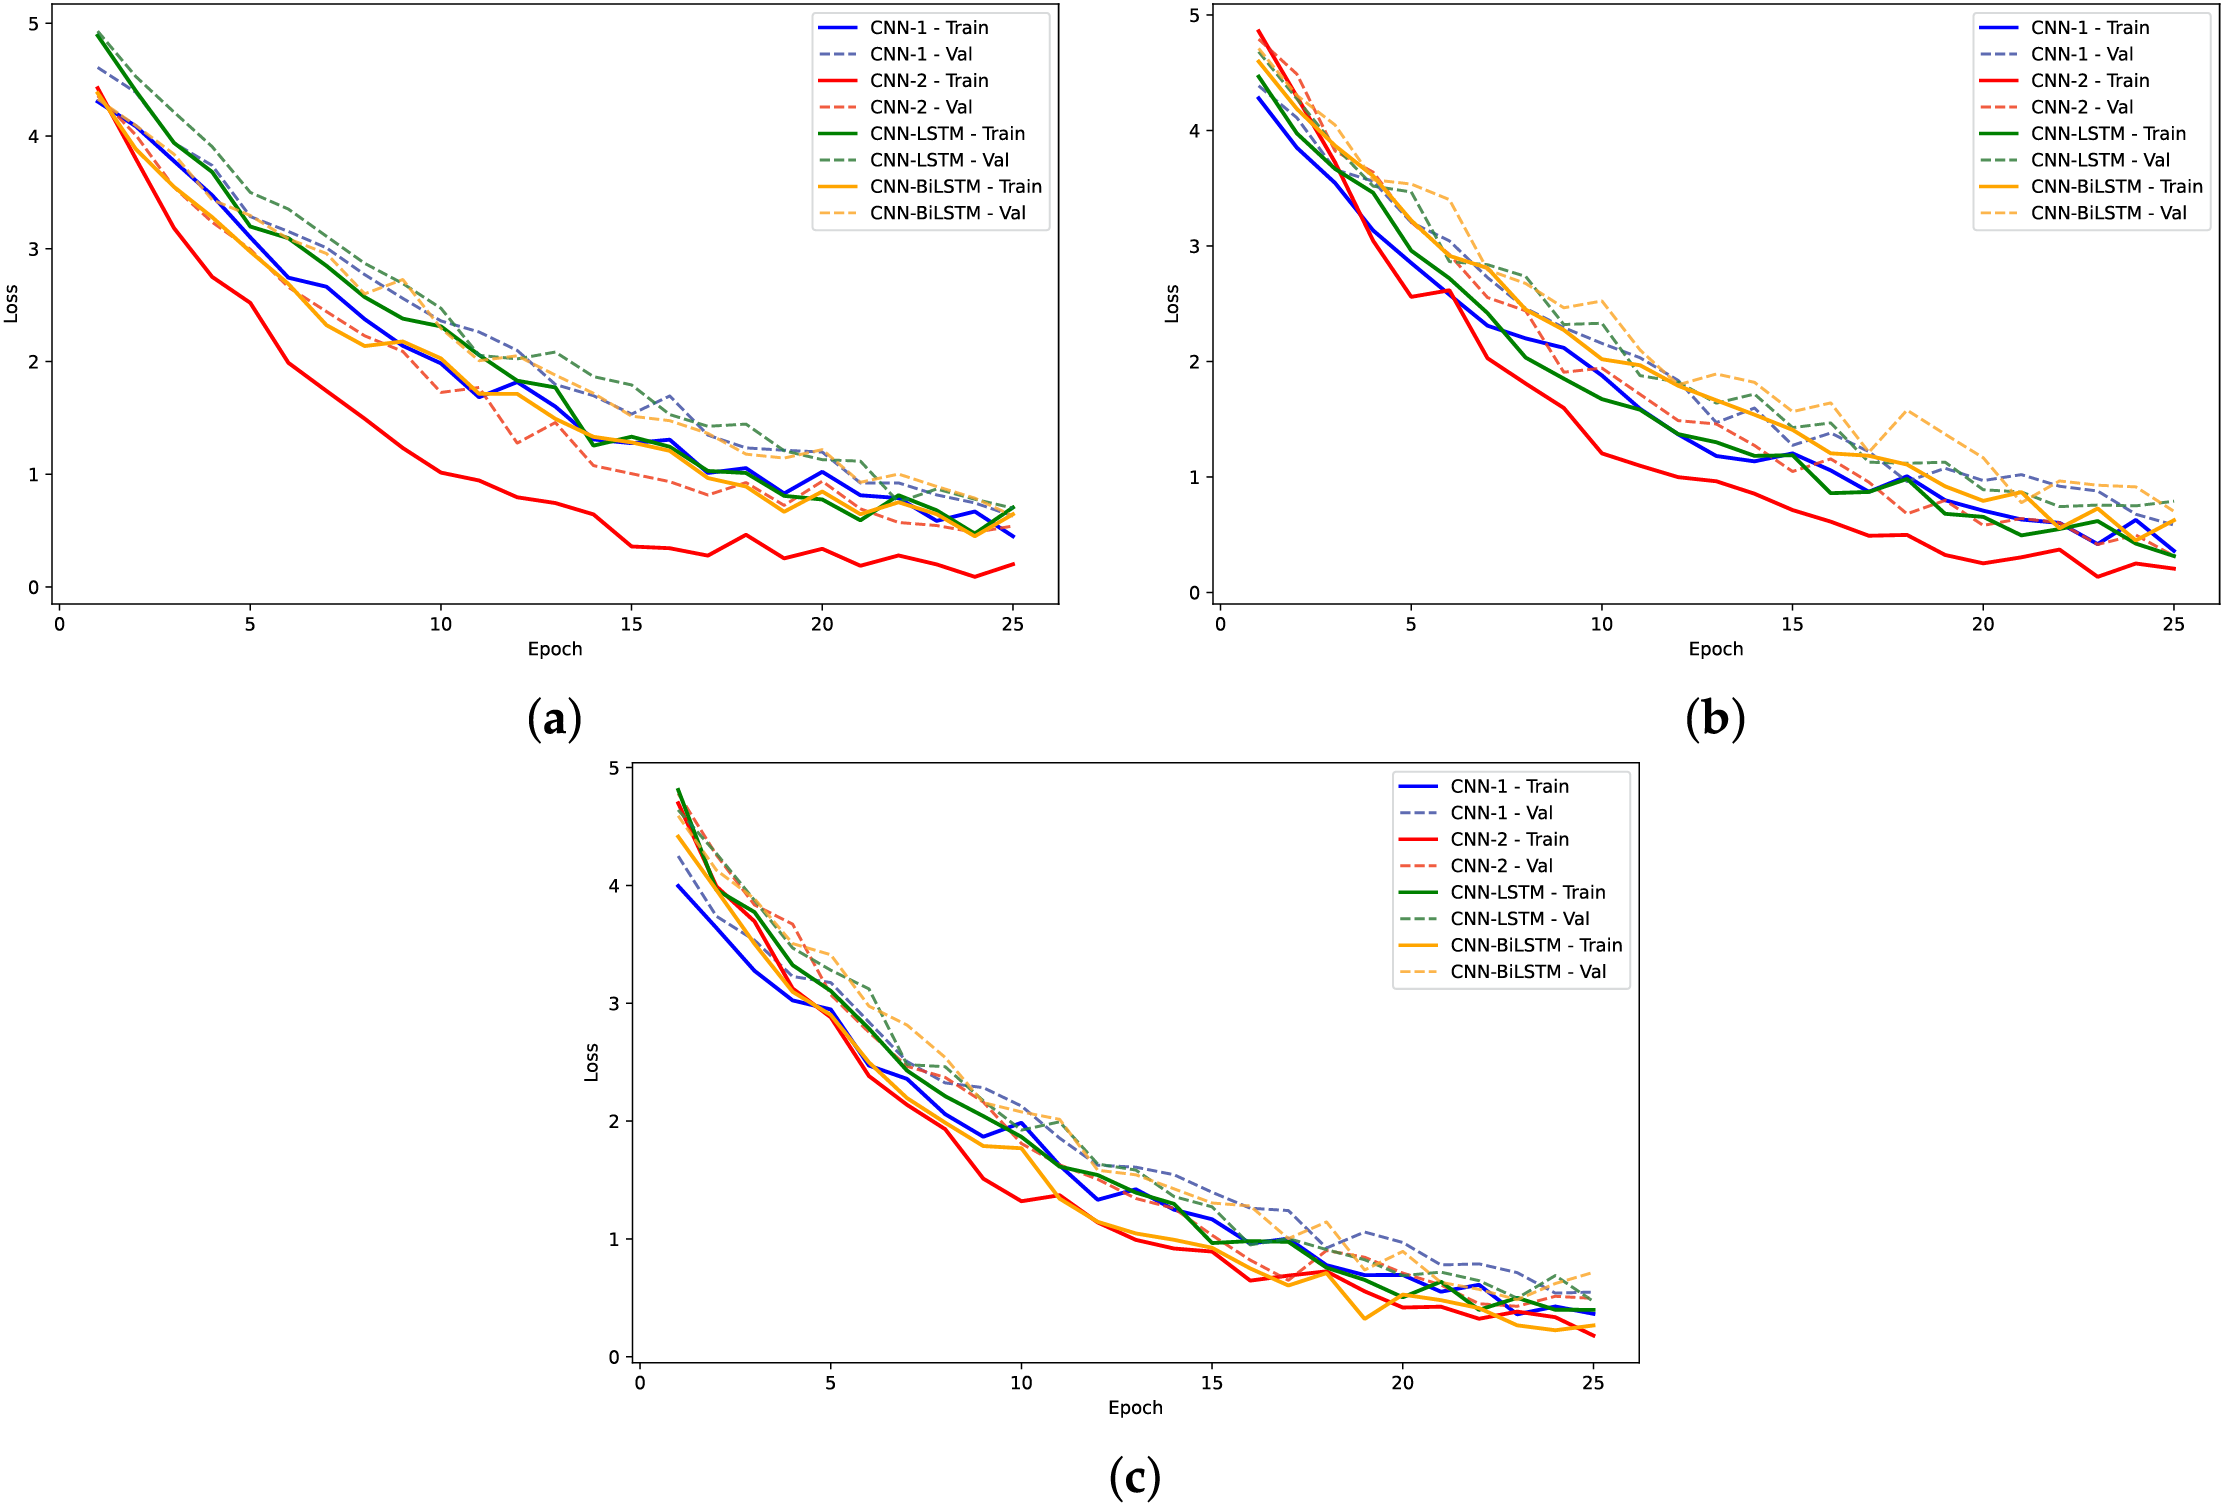
Figure 14: Training loss and validation loss plots for models on human dataset: (a) 2-mer sentence encoding; (b) 4-mer sentence encoding; (c) 8-mer sentence encoding
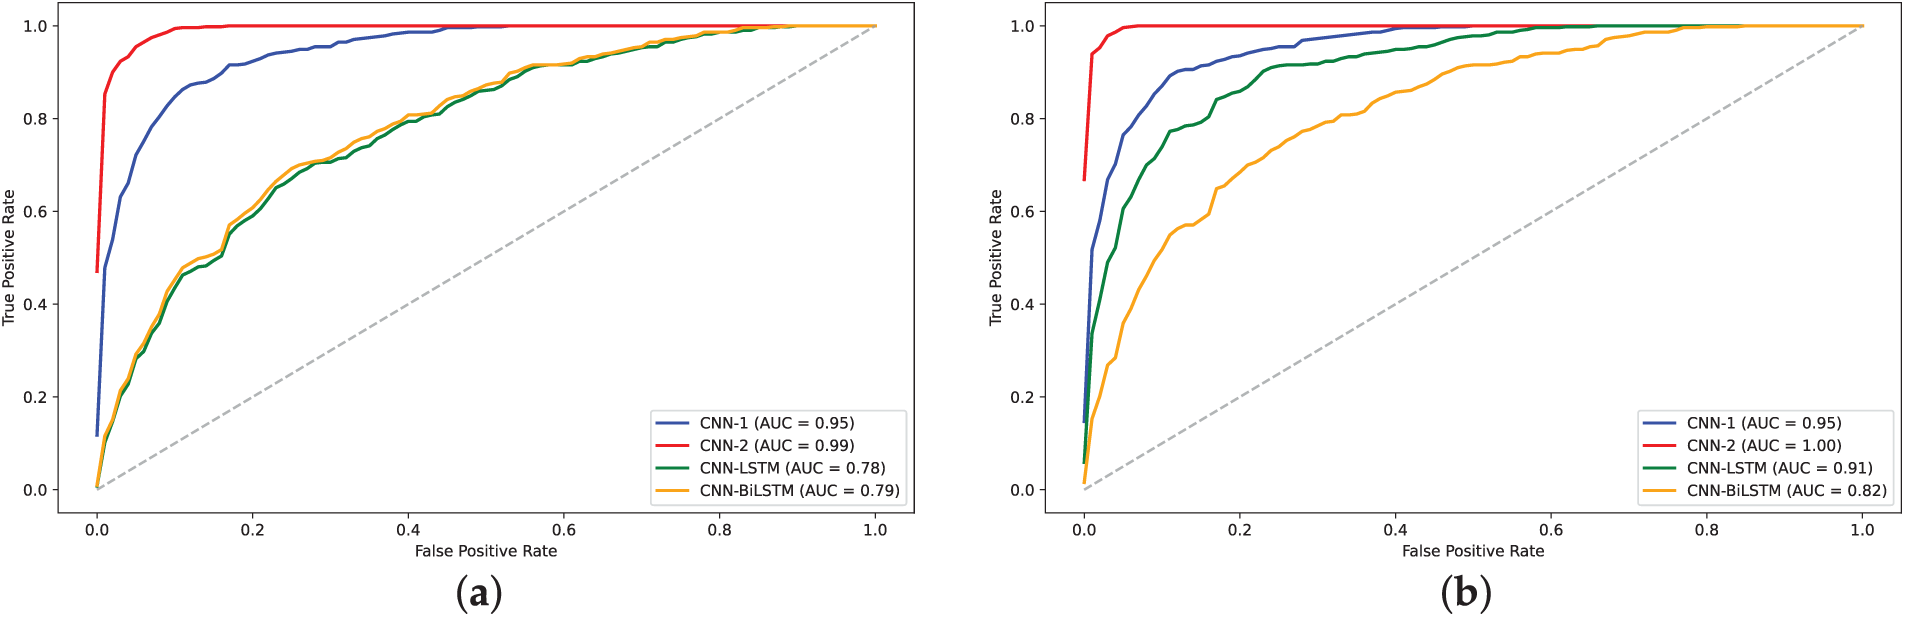
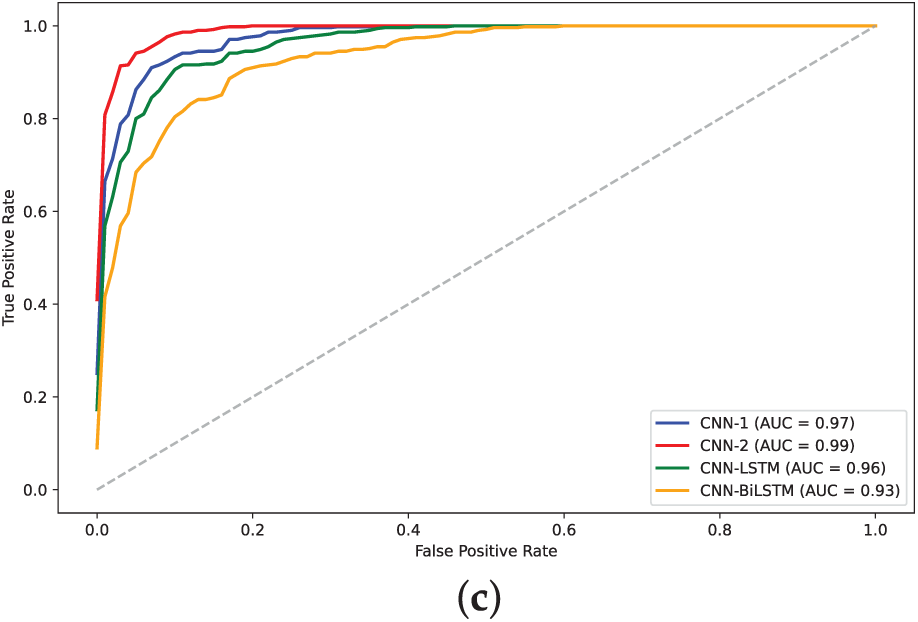
Figure 15: AUC plots for models on human dataset: (a) 2-mer sentence encoding; (b) 4-mer sentence encoding; (c) 8-mer sentence encoding
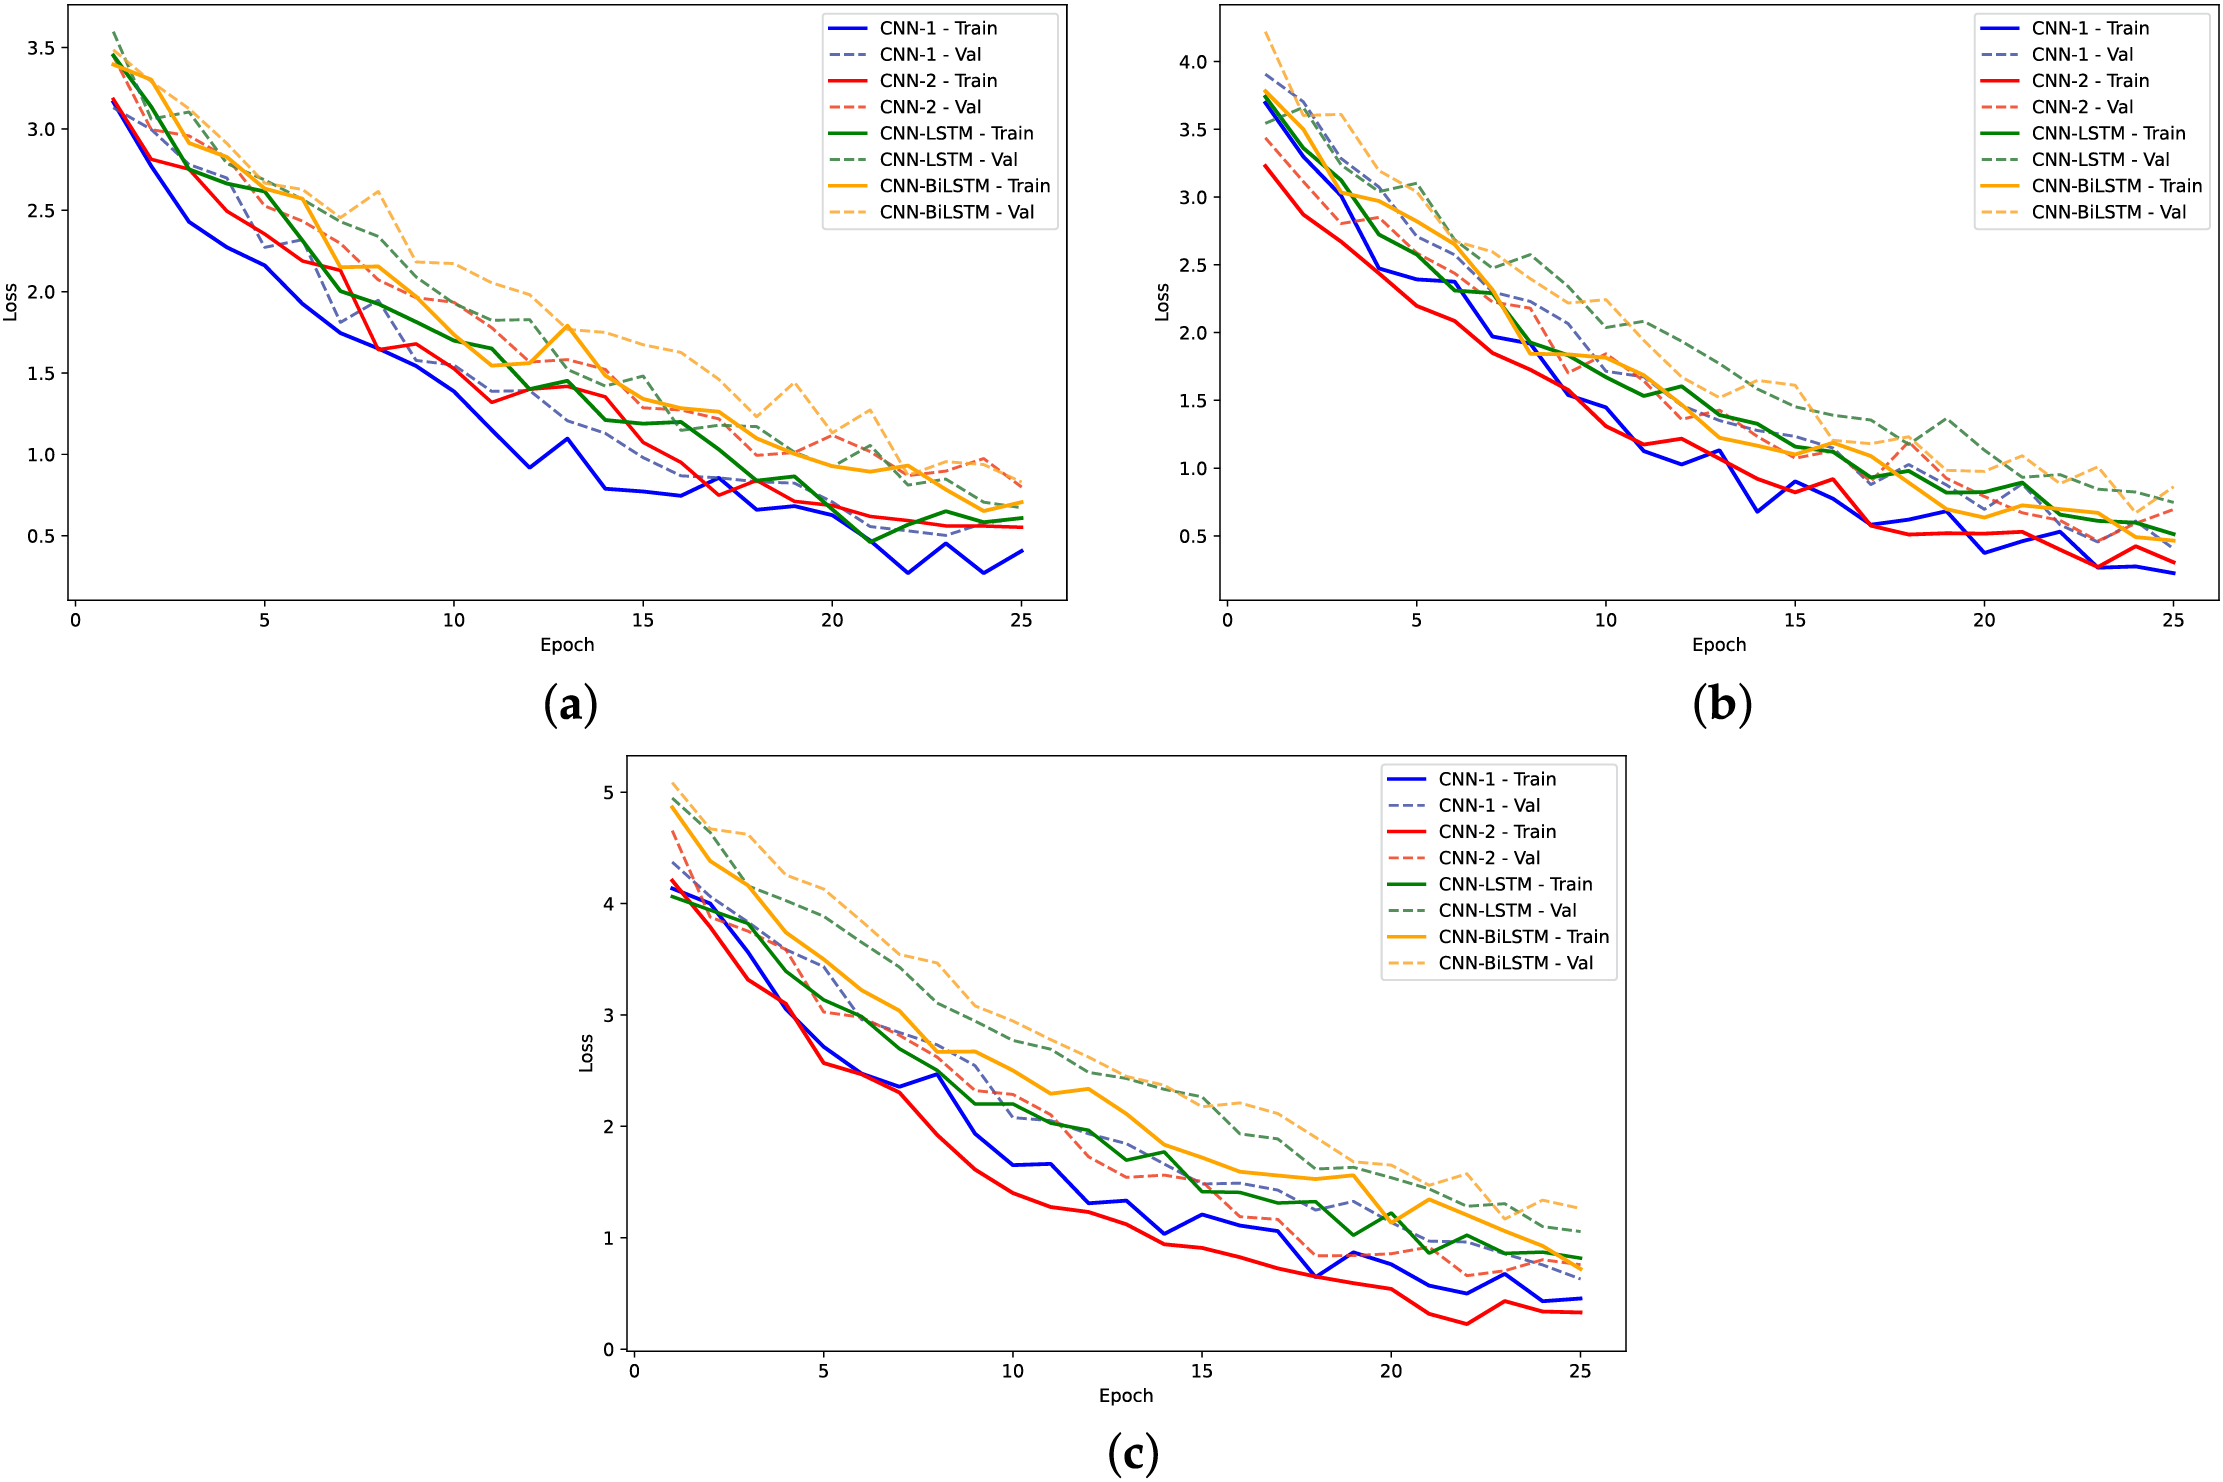
Figure 16: Training loss and validation loss plots for models on yeast dataset: (a) 2-mer sentence encoding; (b) 4-mer sentence encoding; (c) 8-mer sentence encoding

Figure 17: AUC plots for models on yeast dataset: (a) 2-mer sentence encoding; (b) 4-mer sentence encoding; (c) 8-mer sentence encoding
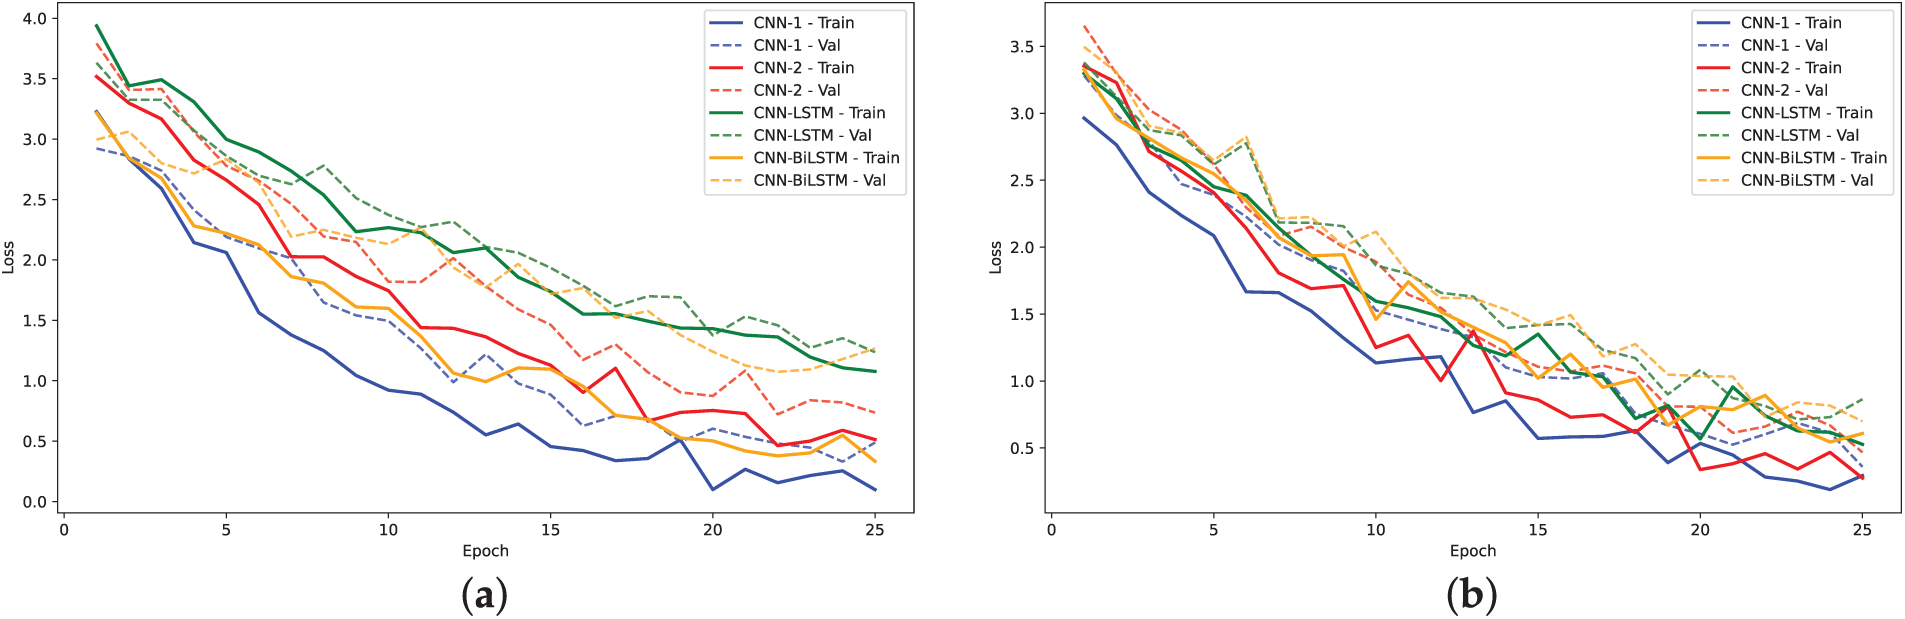
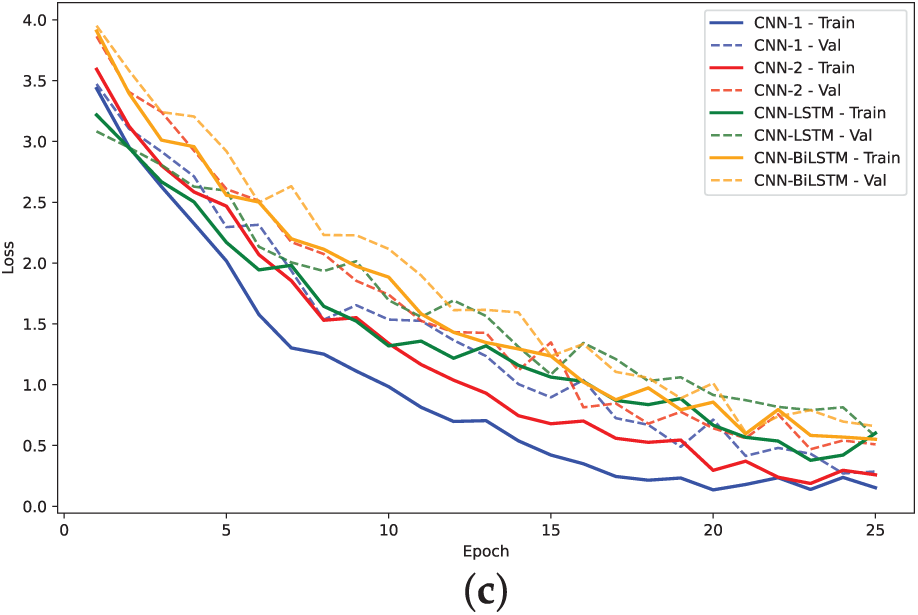
Figure 18: Training loss and validation loss plots for models on A. Thaliana Dataset: (a) 2-mer sentence encoding; (b) 4-mer sentence encoding; (c) 8-mer sentence encoding

Figure 19: AUC plots for models on A. Thaliana Dataset: (a) 2-mer sentence encoding; (b) 4-mer sentence encoding; (c) 8-mer sentence encoding
The training loss curves (Figs. 14, 16 and 18) verify the behavior given that the loss for the CNN models converged to lowest values. The negative exponential behavior is indicative of normal training behavior with validation loss following the training loss ensuring no overfitting. In addition, the AUC plots (Figs. 15, 17 and 19) verified the superior performance of CNN-2 model for human and yeast datasets while CNN-1 model for the A. Thaliana dataset with AUC value over 0.95. Table A1 presents a comparative analysis of performance using label encoding vs. one-hot vector encoding on the DNA Sequence Dataset.
The Friedman test results indicate a significant difference in the performance of the five models (CNN1, CNN2, FCNN, CNN-LSTM, and CNN-BiLSTM) across the various numerical data representations and datasets (H3 occupancy, H4 occupancy, Yeast DNA sequence, A. Thaliana, and Human DNA sequence). With a Chi-Square value of 28.610 and an asymptotic significance (
In addition to numerical encoding methods, the evaluation of visual data representation techniques (Table 6, Figs. 20–23) highlights their impact on classification performance. Among the evaluated techniques, ColorSquare representation consistently resulted in poor performance across both datasets. Although FCGR provided some improvements, it still underperformed compared to CNN and CNN-LSTM models utilizing numerical representations such as label encoding,


Figure 20: Training loss and validation loss plots for models on visual representations of H3 Dataset: (a) FCGR; (b) ColorSquare

Figure 21: Training loss and validation loss plots for models on visual representations of H4 dataset: (a) FCGR; (b) ColorSquare
Figure 22: AUC plots for models on visual representations of H3 dataset: (a) FCGR; (b) ColorSquare

Figure 23: AUC plots for models on visual representations of H4 dataset: (a) FCGR; (b) ColorSquare
This study empirically evaluates the impact of different data representation techniques on the performance of deep learning models in classifying DNA sequences. Specifically, our experiments focused on predicting key determinants of chromatin structure in DNA histone proteins. The results indicate that one-hot vector representation of DNA sequence
The comparison of training times from the tables indicates that the hybrid models, specifically CNN-LSTM and CNN-BiLSTM, consistently require more training time than their non-hybrid counterparts. This trend can be attributed to the increased complexity of these models, which combine convolutional layers with recurrent components to capture both spatial and temporal features in the data. While this complexity can enhance model performance in certain tasks, it also necessitates more computational resources and time for training. Considering the H3 and H4 datasets, the average training times for the models using different numeric representations indicate that label encoding is the most efficient, requiring only 318.01 s, followed by
Despite the theoretical appeal of visual representations, numerical encoding methods consistently delivered superior results across all experimental setups. The visual methods, although compact and maintaining positional information effectively, posed certain limitations when applied to standard, off-the-shelf deep learning models without domain-specific customization. The Frequency Chaos Game Representation (FCGR) outperformed the ColorSquare method, likely due to its ability to emphasize
The decision to employ transfer learning on image-based representations of DNA sequences was motivated by the capacity of pretrained CNNs to identify local and global dependencies efficiently, which is particularly valuable given the limited size and imbalance of biological datasets like H3, H4, and promoter regions. This approach bypasses the need for training complex custom models from scratch, which often require extensive hyperparameter tuning, large labeled datasets, and significant computational resources, making it a practical and scalable choice in bioinformatics applications where labeled data is scarce and sequence diversity is high. While custom models may offer more tailored solutions, they were beyond the scope of this study given the exploratory objectives and dataset size constraints.
Our results suggest that sequence-based representations emphasizing
Our findings reinforce prior research [6] indicating that hybrid architectures incorporating both convolutional and recurrent layers tend to perform best for H3 and H4 datasets, where CNN models perform best for the DNA Sequence Dataset classification. The comparative analysis presented here provides a foundation for future studies to select the most effective combination of data representation techniques and neural network architectures for DNA classification tasks, allowing researchers to leverage the appropriate encoding strategies. In addition, by identifying which encoding methods yield higher classification accuracy with deep learning models, better classifiers for disease-associated DNA sequences can be built, optimizing bioinformatics tools used in clinical genomics, especially in identifying genetic mutations or regulatory regions linked to specific health outcomes. Furthermore, large-scale genomics efforts (which are becoming standard) can use encoding-efficient models that reduce computational cost while maintaining high performance to interpret patient-specific genomic data, improving drug response predictions and disease risk assessments. Finally, our comparative framework and findings can be used as a benchmark in academic settings for evaluating new models, as well as a foundation for future studies in bioinformatics.
Many practical, real-world applications can benefit from the results presented in this research. Improvements in the classification of promoters and histone occupancy types contribute to a better understanding of how genes are regulated and expressed. This is particularly important for studying the activity of genes associated with diseases, whether in humans or plants. Such insights can help researchers more effectively manage and treat these diseases. Additionally, with the availability of complete genomes for many species, promoter classification models can accelerate the genome annotation process.
Despite the valuable insights provided by this study, there are several limitations. First, our study primarily focused on pre-existing deep learning models rather than designing novel architectures optimized for DNA classification, which could yield further performance improvements. Second, while we explored different data representations, hybrid approaches that integrate multiple encoding techniques were not extensively investigated and may offer further enhancements. Third, image-based representations were tested using standard deep learning architectures without specific optimizations for biological sequence data, which may have contributed to their lower performance. Finally, although the problem formulations for the classification of promoter and histone occupancy types are similar, the results from trained models are not necessarily generalizable to other types of biological sequences. This is due to various factors, including the unique characteristics of the biological phenomena associated with each sequence type—phenomena that remain poorly understood by researchers. The generalizability of bioinformatics models remains an open research challenge. To improve classification performance, accumulated biological knowledge over time must be more effectively incorporated, enabling models to leverage not only sequence data but also other data modalities, such as structural and image data.
In this study, we evaluated the impact of various numerical and image-based data representation techniques for encoding DNA sequences to understand their effect on the performance of deep learning models. Our results demonstrate that data representation significantly influences model performance, with sequence-based encoding techniques, particularly
On the other hand, visual data representations underperformed compared to numerical techniques in this study. This may be attributed to the use of off-the-shelf models with transfer learning, which may not be well-suited to the task of DNA sequence classification. Further research is needed to investigate custom-built neural networks tailored for this purpose. For future work, we aim to explore additional data representation techniques, such as Hilbert Curve representation, and investigate the use of similarity-based models, such as Siamese neural networks, to enhance classification accuracy. Additionally, we plan to focus on developing custom models optimized for visual data representations to better capture the unique patterns within DNA sequences.
Acknowledgement: The authors would like to thank the reviewers for their valuable insights and constructive comments.
Funding Statement: This research is funded by the Researchers Supporting Project number (RSPD2025R857), King Saud University, Riyadh, Saudi Arabia.
Author Contributions: The authors confirm contribution to the paper as follows: Conceptualization, Isra Al-Turaiki and Najwa Altwaijry; methodology, Najwa Altwaijry and Isra Al-Turaiki; implementation, Ahmad Raza Khan and Hamza Ali Rizvi; validation, Sarab AlMuhaideb and Ahmad Raza Khan; formal analysis, Isra Al-Turaiki, Najwa Altwaijry and Sarab AlMuhaideb; writing—original draft preparation, Isra Al-Turaiki, Najwa Altwaijry and Hamza Ali Rizvi; writing—review and editing, Sarab AlMuhaideb; visualization, Sarab AlMuhaideb, Hamza Ali Rizvi and Ahmad Raza Khan; funding, Najwa Altwaijry. All authors reviewed the results and approved the final version of the manuscript.
Availability of Data and Materials: Data openly available in a public repository: The yeast, A. thaliana and human genomes used in the study are openly available at https://drive.google.com/drive/folders/1VQ4r2SHGMmFMAq52oDhqYWz7cpTboeHE?usp=sharing (accessed on 8 July 2025). The microarray data used are available at ArrayExpress http://www.ebi.ac.uk/arrayexpress (accessed on 8 July 2025).
Ethics Approval: Not applicable.
Conflicts of Interest: The authors declare no conflicts of interest to report regarding the present study.
AppendixA: Table A1 reports a performance comparison using label encoding and one-hot vector encoding on DNA Sequence Dataset. Table A2 compares the performance of ResNet50 and Inception V3 using Visual data representations on DNA Sequence Dataset.


References
1. Sayers EW, Cavanaugh M, Frisse L, Pruitt KD, Schneider VA, Underwood BA, et al. GenBank 2025 update. Nucleic Acids Res. 2025;53(D1):D56–61. doi:10.1093/nar/gkae1114; [Google Scholar] [CrossRef]
2. Ghosh P, Fagnan K, Connor R, Pannu R, Wheeler TJ, Pop M, et al. Contributions of the Petabyte Scale Sequence Search Codeathon toward efforts to scale sequence-based searches on SRA. arXiv:2505.06395. 2025. [Google Scholar]
3. Xing Z, Pei J, Keogh E. A brief survey on sequence classification. ACM SIGKDD Explor Newsl. 2010;12(1):40–8. doi:10.1145/1882471.1882478; [Google Scholar] [CrossRef]
4. Wang JT, Rozen S, Shapiro BA, Shasha D, Wang Z, Yin M. New techniques for DNA sequence classification. J Comput Biol J Comput Mol Cell Biol. 1999;6(2):209–18. doi:10.1089/cmb.1999.6.209; [Google Scholar] [CrossRef]
5. Yang A, Zhang W, Wang J, Yang K, Han Y, Zhang L. Review on the application of machine learning algorithms in the sequence data mining of DNA. Front Bioeng Biotechnol. 2020;8:1032. doi:10.3389/fbioe.2020.01032; [Google Scholar] [CrossRef]
6. Gunasekaran H, Ramalakshmi K, Rex Macedo Arokiaraj A, Deepa Kanmani S, Venkatesan C, Suresh Gnana Dhas C. Analysis of DNA sequence classification using CNN and hybrid models. Comput Math Methods Med. 2021;2021:e1835056. doi:10.1155/2021/1835056; [Google Scholar] [CrossRef]
7. Nguyen NG, Tran VA, Ngo DL, Phan D, Lumbanraja FR, Faisal MR, et al. DNA sequence classification by convolutional neural network. J Biomed Sci Eng. 2016;9(5):280–6. doi:10.4236/jbise.2016.95021; [Google Scholar] [CrossRef]
8. Rizzo R, Fiannaca A, La Rosa M, Urso A. Classification experiments of DNA sequences by using a deep neural network and chaos game representation. In: Proceedings of the 17th International Conference on Computer Systems and Technologies 2016, CompSysTech ’16; 2016 Jun 23–24; New York, NY, USA. p. 222–8. doi:10.1145/2983468.2983489; [Google Scholar] [CrossRef]
9. Choong ACH, Lee NK. Evaluation of convolutionary neural networks modeling of DNA sequences using ordinal versus one-hot encoding method. In: Proceedings of the 2017 International Conference on Computer and Drone Applications (IConDA); 2017 Nov 9–11; Kuching, Malaysia. p. 60–5. [Google Scholar]
10. Kautsar A. DNA sequence classification using machine learning models based on k-mer features. J Comput Digital Busin. 2025;4(2):100–5. doi:10.56427/jcbd.v4i2.762; [Google Scholar] [CrossRef]
11. Vishal CH, Krishna S, Reddy JA, Likith N, Chiranjeevi N. Classification of DNA using machine learning. Int J Novel Res Develop (IJNRD). 2024 Apr;9(4):c66–70; [Google Scholar]
12. He K, Zhang X, Ren S, Sun J. Deep residual learning for image recognition. In: Proceedings of the IEEE Conference on Computer Vision and Pattern Recognition; 2016 Jun 27–30; Las Vegas, NV, USA. p. 770–8. [Google Scholar]
13. Szegedy C, Vanhoucke V, Ioffe S, Shlens J, Wojna Z. Rethinking the inception architecture for computer vision. In: Proceedings of the IEEE Conference on Computer Vision and Pattern Recognition; 2016 Jun 27–30; Las Vegas, NV, USA. p. 2818–26. [Google Scholar]
14. Pokholok DK, Harbison CT, Levine S, Cole M, Hannett NM, Lee TI, et al. Genome-wide map of nucleosome acetylation and methylation in yeast. Cell. 2005;122(4):517–27. doi:10.1016/j.cell.2005.06.026; [Google Scholar] [CrossRef]
15. Asim MN, Ibrahim MA, Zaib A, Dengel A. DNA sequence analysis landscape: a comprehensive review of DNA sequence analysis task types, databases, datasets, word embedding methods, and language models. Front Med. 2025;12:1503229. doi:10.3389/fmed.2025.1503229; [Google Scholar] [CrossRef]
16. Sastri AP, Akbar S, Suresh K. Assessment of machine learning algorithms in DNA sequence data mining. In: Computational techniques for biological sequence analysis. Boca Raton, FL, USA: CRC Press; 2025. p. 61–77. [Google Scholar]
17. Deshpande M, Karypis G. Evaluation of techniques for classifying biological sequences. In: Proceedings of the Advances in Knowledge Discovery and Data Mining, 17th Pacific-Asia Conference, PAKDD 2013; 2013 Apr 14–17; Gold Coast, Australia. [Google Scholar]
18. She R, Chen F, Wang K, Ester M, Gardy JL, Brinkman FSL. Frequent-subsequence-based prediction of outer membrane proteins. In: Proceedings of the Ninth ACM SIGKDD International Conference on Knowledge Discovery and Data Mining, KDD ’03; 2023 Aug 24–27; Washington, DC, USA. p. 436–45. [Google Scholar]
19. RuleQuest-Research. Data Mining Tools See5 and C5.0. [cited 2022 Dec 2]. Available from: https://www.rulequest.com/see5-info.html. [Google Scholar]
20. Singh OP, Vallejo M, El-Badawy IM, Aysha A, Madhanagopal J, Faudzi AAM. Classification of SARS-CoV-2 and non-SARS-CoV-2 using machine learning algorithms. Comput Biol Med. 2021;136:104650. doi:10.1016/j.compbiomed.2021.104650; [Google Scholar] [CrossRef]
21. Ao C, Jiao S, Wang Y, Yu L, Zou Q. Biological sequence classification: a review on data and general methods. Research. 2022;2022(5):0011. doi:10.34133/research.0011; [Google Scholar] [CrossRef]
22. Lazebnik T, Simon-Keren L. Cancer-inspired genomics mapper model for the generation of synthetic DNA sequences with desired genomics signatures. Comput Biol Med. 2023;164(6529):107221. doi:10.1016/j.compbiomed.2023.107221; [Google Scholar] [CrossRef]
23. Amiri Z, Heidari A, Navimipour NJ, Esmaeilpour M, Yazdani Y. The deep learning applications in IoT-based bio-and medical informatics: a systematic literature review. Neural Comput Applicat. 2024;36(11):5757–97. doi:10.1007/s00521-023-09366-3; [Google Scholar] [CrossRef]
24. Lefin N, Herrera-Belén L, Farias JG, Beltrán JF. Review and perspective on bioinformatics tools using machine learning and deep learning for predicting antiviral peptides. Molec Diver. 2024;28(4):2365–74. doi:10.1007/s11030-023-10718-3; [Google Scholar] [CrossRef]
25. Kumar N, Srivastava R. Deep learning in structural bioinformatics: current applications and future perspectives. Brief Bioinform. 2024;25(3):bbae0424. doi:10.1093/bib/bbae042; [Google Scholar] [CrossRef]
26. Trabelsi A, Chaabane M, Ben-Hur A. Comprehensive evaluation of deep learning architectures for prediction of DNA/RNA sequence binding specificities. Bioinformatics. 2019;35(14):i269–77. doi:10.1093/bioinformatics/btz339; [Google Scholar] [CrossRef]
27. Rehman MU, Tayara H, Chong KT. DCNN-4mC: densely connected neural network based N4-methylcytosine site prediction in multiple species. Computat Struct Biotechnol J. 2021;19(1748):6009–19. doi:10.1016/j.csbj.2021.10.034; [Google Scholar] [CrossRef]
28. Qayyum A, Benzinou A, Saidani O, Alhayan F, Khan MA, Masood A, et al. Assessment and classification of COVID-19 DNA sequence using pairwise features concatenation from multi-transformer and deep features with machine learning models. SLAS Technol. 2024;29(4):100147. doi:10.1016/j.slast.2024.100147; [Google Scholar] [CrossRef]
29. Bhandari N, Khare S, Walambe R, Kotecha K. Comparison of machine learning and deep learning techniques in promoter prediction across diverse species. PeerJ Comput Sci. 2021;7:e365. doi:10.7717/peerj-cs.365; [Google Scholar] [CrossRef]
30. Yu T, Cheng L, Khalitov R, Yang Z. A sparse and wide neural network model for DNA sequences. Neural Netw. 2025;184:107040. doi:10.1016/j.neunet.2024.107040; [Google Scholar] [CrossRef]
31. Wang X, Lian Q, Qu P, Yang Q. TBCA: prediction of transcription factor binding sites using a deep neural network with lightweight attention mechanism. IEEE J Biomed Health Inform. 2024;28(4):2397–407. doi:10.1109/JBHI.2024.3355758; [Google Scholar] [CrossRef]
32. Tariq S, Amin A. DeepCTF: transcription factor binding specificity prediction using DNA sequence plus shape in an attention-based deep learning model. Signal Image Video Process. 2024;16(6–7):5239–51. doi:10.1007/s11760-024-03229-7; [Google Scholar] [CrossRef]
33. Amato D, Calderaro S, Bosco GL, Vella F, Rizzo R. Proteins transcription factor prediction using graph neural networks. In: Cerulo L, Napolitano F, Bardozzo F, Cheng L, Occhipinti A, Pagnotta SM, editors. Computational intelligence methods for bioinformatics and biostatistics. CIBB 2024. Lecture notes in computer science. Vol. 15276. Cham: Springer; 2024. doi:10.1007/978-3-031-89704-7_2. [Google Scholar] [CrossRef]
34. Mock F, Kretschmer F, Kriese A, Böcker S, Marz M. Taxonomic classification of DNA sequences beyond sequence similarity using deep neural networks. Proc Natl Acad Sci U S A. 2022;119(1):e2122636119. doi:10.1101/2021.07.09.451778; [Google Scholar] [CrossRef]
35. Pipoli V, Cappelli M, Palladini A, Peluso C, Lovino M, Ficarra E. Predicting gene expression levels from DNA sequences and post-transcriptional information with transformers. Comput Methods Programs Biomed. 2022;225(8):107035. doi:10.1016/j.cmpb.2022.107035; [Google Scholar] [CrossRef]
36. Mikolov T. Efficient estimation of word representations in vector space. arXiv:1301.3781. 2023. [Google Scholar]
37. Zeng M, Wu Y, Lu C, Zhang F, Wu FX, Li M. DeepLncLoc: a deep learning framework for long non-coding RNA subcellular localization prediction based on subsequence embedding. Brief Bioinform. 2022;23:bbab360. doi:10.1101/2021.03.13.435245; [Google Scholar] [CrossRef]
38. Dong G, Wu Y, Huang L, Li F, Zhou F. TExCNN: leveraging pre-trained models to predict gene expression from genomic sequences. Genes. 2024;15(12):1593. doi:10.3390/genes15121593; [Google Scholar] [CrossRef]
39. Ji Y, Zhou Z, Liu H, Davuluri RV. DNABERT: pre-trained bidirectional encoder representations from transformers model for DNA-language in genome. Bioinformatics. 2021;37:2112–20. doi:10.1101/2020.09.17.301879; [Google Scholar] [CrossRef]
40. Zhou Z, Ji Y, Li W, Dutta P, Davuluri R, Liu H. Dnabert-2: efficient foundation model and benchmark for multi-species genome. arXiv:2306.15006. 2023. [Google Scholar]
41. Kim H. Deep learning. In: Kim H, editor. Artificial intelligence for 6G. Cham, Switzerland: Springer International Publishing; 2022. p. 247–303. doi:10.1007/978-3-030-95041-5_6. [Google Scholar] [CrossRef]
42. Lipman DJ, Pearson WR. Rapid and sensitive protein similarity searches. Science. 1985;227(4693):1435–41. doi:10.1126/science.2983426; [Google Scholar] [CrossRef]
43. Zhang Z, Song T, Zeng X, Niu Y, Jiang Y, Pan L, et al. Colorsquare: a colorful square visualization of DNA sequences. Match-Commun Math Comput Chem. 2012;68:621; [Google Scholar]
44. Almeida JS, Carriço JA, Maretzek A, Noble PA, Fletcher M. Analysis of genomic sequences by Chaos Game Representation. Bioinformatics. 2001;17(5):429–37. doi:10.1093/bioinformatics/17.5.429; [Google Scholar] [CrossRef]
45. Sokolova M, Lapalme G. A systematic analysis of performance measures for classification tasks. Inform Process Manag. 2009;45(4):427–37. doi:10.1016/j.ipm.2009.03.002; [Google Scholar] [CrossRef]
46. Nemenyi PB. Distribution-free multiple comparisons. Ann Arbor, MI, USA: Princeton University; 1963. [Google Scholar]
47. Soliman NF, Abd-Alhalem SM, El-Shafai W, Abdulrahman SESE, Ismaiel N, El-Rabaie ESM, et al. An improved convolutional neural network model for DNA classification. Comput Mater Contin. 2022;70(3):5907–27. doi:10.32604/cmc.2022.018860; [Google Scholar] [CrossRef]
Cite This Article
 Copyright © 2025 The Author(s). Published by Tech Science Press.
This work is licensed under a Creative Commons Attribution 4.0 International License , which permits unrestricted use, distribution, and reproduction in any medium, provided the original work is properly cited.
 Downloads
 Citation Tools