
 Submit a Paper
 Propose a Special lssue
 Open Access
ARTICLE
Calibration of Elastic-Plastic Degradation Model for 40Cr Steel Applied in Finite Element Simulation of Shear Pins of Friction Pendulum Bearings
1 Faculty of Architecture and Civil Engineering, Huaiyin Institute of Technology, Huai’an, 223003, China
2 Jiangsu Administration of Huaihe, Shuhe and Xinhe Rivers, Huai’an, 223005, China
* Corresponding Author: Mianyue Yang. Email:
Computers, Materials & Continua 2025, 85(2), 2749-2761. https://doi.org/10.32604/cmc.2025.068009
Received 19 May 2025; Accepted 07 August 2025; Issue published 23 September 2025
 View Full Text
 Download PDF
Abstract
The shear pin of the friction pendulum bearing (FPB) can be made of 40Cr steel. In conceptual design, the optimal cut-off point of the shear pin is predetermined, guiding the design of bridges isolated by FPBs to maximize their isolation performance. Current researches on the shear pins are mainly based on linear elastic models, neglecting their plasticity, damage, and fracture mechanical properties. To accurately predict its cutoff behavior, the elastic-plastic degradation model of 40Cr steel is indeed calibrated. For this purpose, the Ramberg-Osgood model, the Bao-Wierzbicki damage initiation criterion, and the linear damage evolution criterion were selected to develop the elastic-plastic degradation model of 40Cr. Subsequently, parameter calibration of this model was performed through uniaxial tensile tests on two sets of six smooth, round bars with different diameters. Following this, finite element simulations were conducted for the pure shear test of grade 10.9 high-strength bolts made of 40Cr steel, aiming to verify the elastic-plastic degradation model. The results showed that the failure modes and force-displacement curves simulated by the finite element method were in good agreement with the test results. Moreover, the error between the primary characteristic parameters (initial stiffness, peak load, fracture displacement, and absorbed energy) obtained by finite element calculation and the test values was within 15%. These results demonstrated that the calibration elastic-plastic degradation model of 40Cr steel can predict the cutoff of the shear pin.Keywords
Friction Pendulum Bearings (FPBs) are seismic isolation devices that protect structures from earthquake damage by dissipating seismic energy through a combination of pendular motion and frictional sliding. The friction-coupling effect, collision phenomenon, and jumping-off effects were exhibited in FPB with shear pins under extreme loading scenarios [1,2]. The shear pin of the FPB acts as a “fuse” [3,4], as shown in Fig. 1. Under normal service loads, the shear pin restricts the movement of the FPB. However, the shear pin must be cut off under rare earthquakes, triggering the swing of the friction pendulum bearing to protect structures. In conceptual design, the optimal cut-off point of the shear pin is predetermined, guiding the design of bridges isolated by FPBs to maximize their isolation performance [5–7]. Current researches [2,8] on the shear pins are mainly based on linear elastic models, neglecting their plasticity, damage, and fracture mechanical properties. To accurately predict its cutoff behavior under rare seismic events, it is essential to clarify the stress flow associated with the material’s elastic-plastic degradation behavior.

Figure 1: Schematic diagram of the shear pins in FPB
Shear pins are made of 40Cr steel [3]. The 40Cr steel is a medium-carbon quenched and tempered alloy steel characterized by notch sensitivity, enhanced low-temperature impact toughness, and balanced mechanical properties [9–12]. Current research on 40Cr steel primarily focuses on its elastic-plastic stress flow behavior to elucidate the relationship between macro deformation and microstructural changes during the high-speed cold roll-beating forming process. For instance, Chen et al. [13] developed constitutive models that consider the hot deformation and dynamic recrystallization behaviors of 40Cr steel. Cui et al. [14] established a material evolution model to reveal the relationship between the macroscopic deformation and forming factors under high-speed and large-deformation conditions. Wang et al. [15] conducted experiments at various strain rates, proposing a new model for true stress-true strain relations. Additionally, Zhou et al. [16] and Zhang et al. [17,18] investigated its fracture stress flow behavior under the tension or compression condition. However, its shear fracture behavior has not been reported.
To simulate the fracture behavior of the shear pin, it is necessary to evaluate its elastic-plastic degradation constitutive model of 40Cr steel. The initiation of steel damage can be simulated using models such as the Void Growth model [19], Gurson-Tvergaard-Needleman fracture model [20], Johnson-Cook failure model [21], and Bao-Wierzbicki damage initiation criterion [22,23]. The Bao-Wierzbicki damage initiation criterion was chosen as the damage initiation model of 40Cr steel over other models due to its combined stress triaxiality and load parameter dependency, critical for predicting shear-dominated fracture and low/negative triaxiality failure in steels [24]. Moreover, unlike the Johnson-Cook failure model (ignores Lode angle) or the Void growth and Gurson-Tvergaard-Needleman fracture models (void-growth-focused), the Bao-Wierzbicki damage initiation criterion enables direct calibration via multi-stress-state tests (e.g., shear/notched specimens) without requiring microstructural data or high-strain-rate inputs. Its triaxiality cut-off prevents unrealistic damage under compression and balances accuracy with computational efficiency. Furthermore, the Bao-Wierzbicki damage initiation criterion for predicting damage of steel is indeed justified, and the accuracy of this approach is supported by previous researches [25–27].
Therefore, a constitutive model for the elastic-plastic degradation of 40Cr steel was developed by combining the Ramberg-Osgood model, the Bao-Wierzbicki damage initiation criterion, and the linear damage evolution criterion. To calibrate the relevant parameters, uniaxial tensile tests were conducted on two sets of smooth, round bars made of 40Cr steel with diameters of 20 and 30 mm. Subsequently, a non-linear finite element model of pure shear tests of grade 10.9 high-strength bolts made of 40Cr steel was then established based on the calibrated elastic-plastic degradation model. Finally, the results, such as failure modes, force-displacement curves, and primary characteristic parameters from both tests [28] and finite element simulations were compared. This comparison verified that the calibrated elastic-plastic degradation model can predict the cutoff of shear pins.
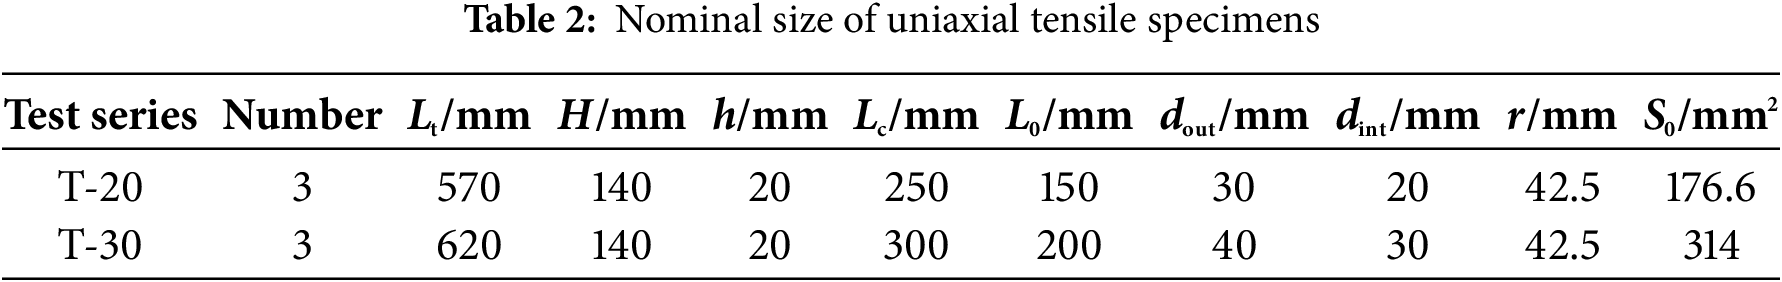
Tensile specimens were made of 40Cr steel, with their chemical compositions shown in Table 1. In accordance with Metallic Materials Tensile Testing Part 1: Room Temperature Test Method (GB/T228.1-2010) [29], the dimensions of tensile specimens were determined. The standard tensile specimen is illustrated in Fig. 2, and detailed dimensions are provided in Table 2. The specimens were manufactured using wire-cutting technology. Due to its low heat input, the residual stress generated at the cutting edge can be disregarded, as it does not significantly affect the material’s mechanical properties.
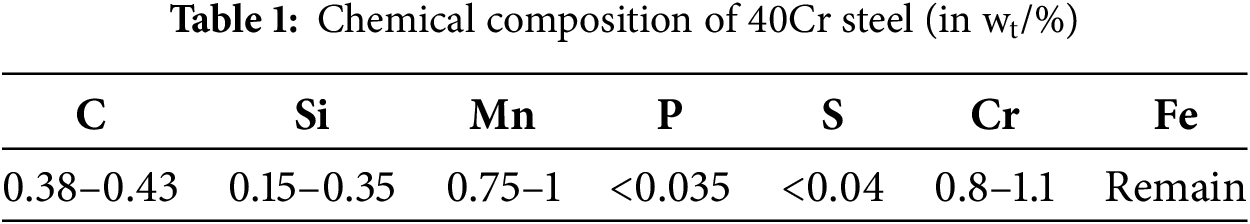

Figure 2: Tensile standard specimen
All tensile tests strictly followed the relevant provisions of Metallic Materials Tensile Testing Part 1: Room Temperature Test Method (GB/T228.1-2010) [29]. Uniaxial tensile tests were performed using a SANS microcomputer-controlled electro-hydraulic servo tensile testing machine. The tests employed a displacement-controlled loading method with a rate of 0.5 mm/min, as illustrated in Fig. 3. Simultaneously, strain gauges were placed on both sides of the mid-span of the tensile specimens. The DongHua 3816 acquisition instrument was used to record the true strain and tensile load. This setup aimed to determine the engineering stress-true strain curve of 40Cr steel before necking, which can be used to calibrate the stiffness of the SANS testing machine. Consequently, the true stress-strain curve of 40Cr steel can be obtained.

Figure 3: Test setup
As for the load, it tends to increase in the initial stage of displacement loading. However, the 40Cr steel specimens did not exhibit significant deformation. Once the displacement reached the peak load, the 40Cr steel specimens showed a “necking” phenomenon. The load decreased with increasing displacement until the 40Cr steel specimens finally fractured. Fig. 4 shows the fractured specimens from tension tests, demonstrating that 40Cr steel exhibits ductile damage characteristics.

Figure 4: Fractured specimens of tension tests
The engineering stress-strain curve was calculated by dividing the measured load by the cross-sectional area and the displacement by the calibrated length of the specimen. The true stress-strain curve of 40Cr steel before necking can be determined based on the relationship between engineering stress-strain (σe-εe) and true stress-strain (σ-ε):
Table 3 presents the fundamental mechanical properties of 40Cr steel. As shown in Table 3, the maximum coefficient of variation (CV) of mechanical properties for 40Cr steel is 11.68%, which falls within the acceptable range (CV < 15%) for metallic materials, as specified by ASTM E8-24. This confirms that the intrinsic material variability does not compromise parameter stability. The true stress-strain curve of 40Cr steel before necking is shown in Fig. 5. This curve exhibits atypical nonlinear behavior without a yield platform. Thus, the Ramberg-Osgood model is suitable for describing its elastic-plastic mechanical behavior.
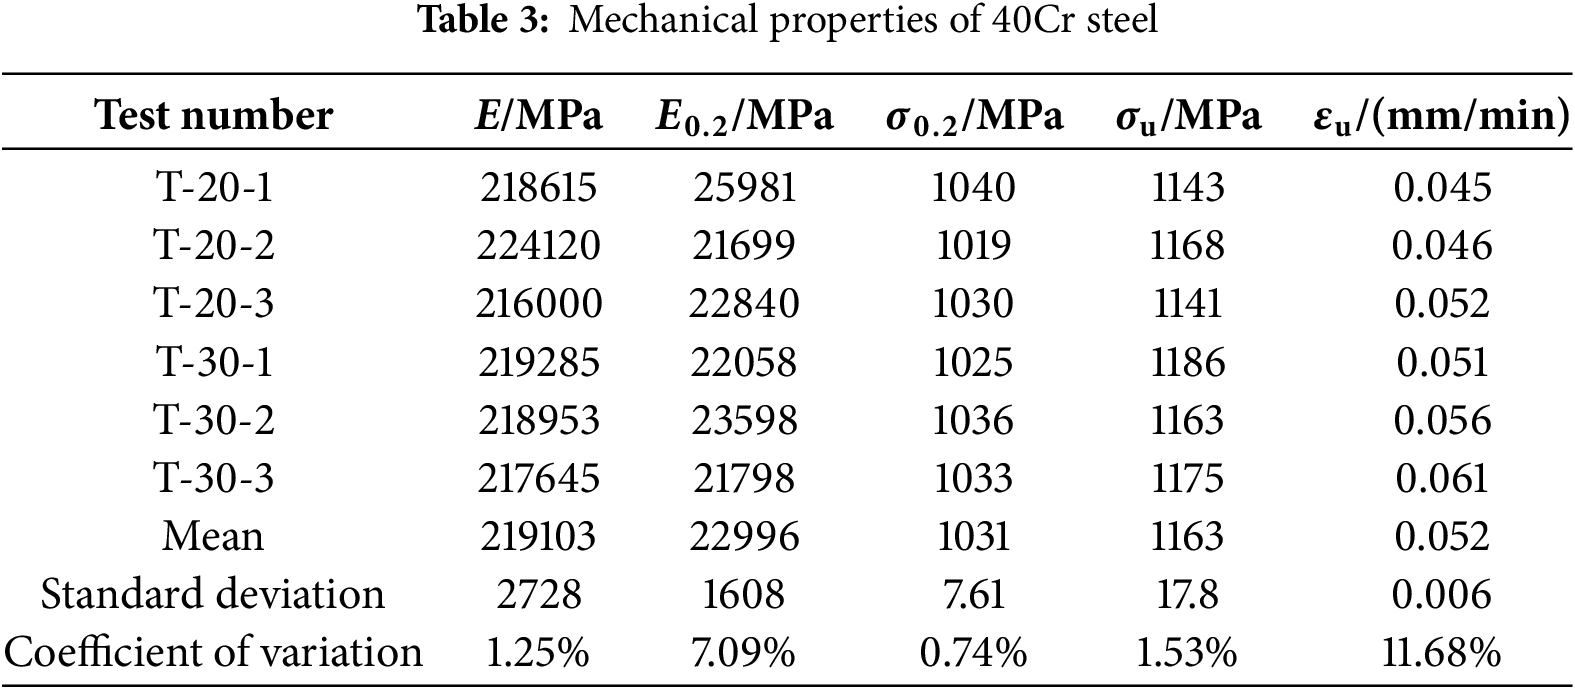

Figure 5: The true stress-strain curve (σ–ε) of 40Cr steel
3 Calibration of Elastic-Plastic Degradation Constitution
During the cutoff process of the shear pin, 40Cr steel initially undergoes elastic deformation, followed by plastic deformation, and eventually enters the damage phase until it completely fractures. Therefore, the elastic-plastic degradation constitutive model for 40Cr steel needs to describe both its elastic-plastic behavior and damage behavior. The true stress-strain curve during the deformation of traditional steel is shown in Fig. 6. As shown in Fig. 6, the red arrow indicates loading, and the blue arrow indicates unloading. The O-A segment represents the elastic deformation stage of the material, with its slope (
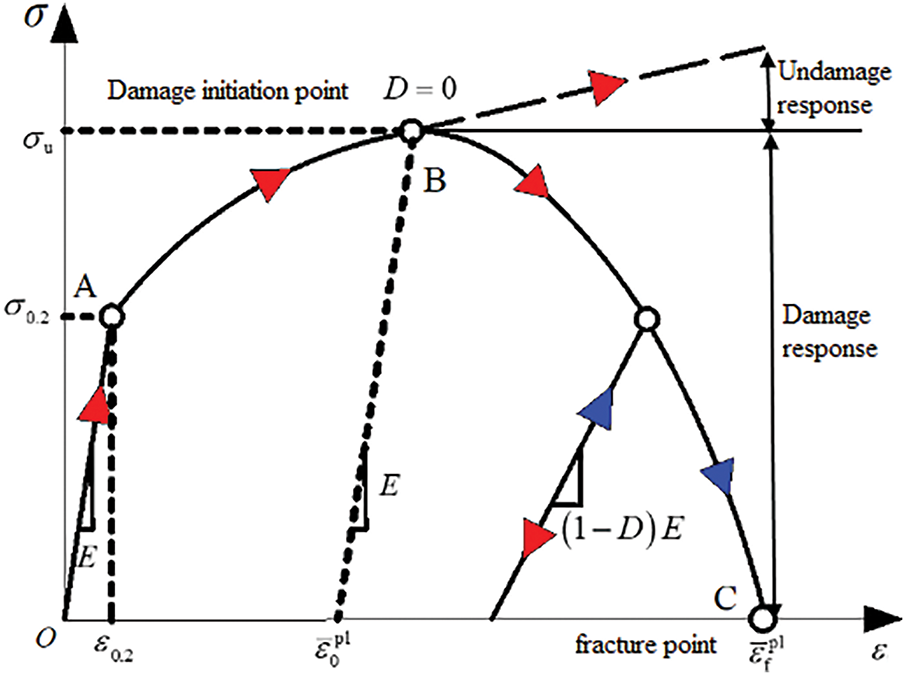
Figure 6: True stress-strain curve (σ-ε) of steel
The Ramberg-Osgood model, the Bao-Wierzbicki damage initiation criterion, and the linear damage evolution criterion were combined to construct an elastic-plastic degradation constitutive model of 40Cr steel. In this model, the Ramberg-Osgood model is used to describe the elastic-plastic deformation behavior of 40Cr steel. The Bao-Wierzbicki damage initiation criterion identifies the critical point of initial damage. The linear damage evolution criterion describes the process of damage accumulation leading to final shearing failure.
The true stress-strain relationship of 40Cr steel, from initiation to the necking stage, was described by the Ramberg-Osgood model [30]. The elastic-plastic behavior after the necking stage is described by the power law relationship [31]. Based on these settings, the elastic-plastic behavior of 40Cr steel can be defined through the following expressions:
where E and E0.2 represent the elastic modulus and the tangent modulus at the 0.2% proof stress, respectively;
Based on Formulas (3) to (8), the true stress-strain curve of 40Cr steel is plotted in Fig. 5. The parameter values required for its Ramberg-Osgood model can be fitted, where E = 219,103 MPa, E0.2 = 22,996 MPa,
3.2 Bao-Wierzbicki Damage Initiation Criterion
The initial damage critical point of 40Cr steel in the true stress-strain curve is described by the Bao-Wierzbicki damage initiation criterion [22,27]. When the equivalent plastic strain
where C1 and C2 are the effective plastic strain under pure shear and tension state, respectively; r0 and rf are the initial radius and the final radius of the specimen, respectively; k is the hardening index of isotropic strain hardening power law, which is a function of engineering strain at ultimate force; δd is the tensile displacement corresponding to the ultimate tensile force.

Figure 7: The equivalent strain to fracture and stress triaxiality for steel
By measuring the initial gauge length and the tensile displacement of the tensile specimen, k = 0.143 can be calculated by Formula (12). Based on Formula (10), C2 = 0.54 can be calculated by measuring the diameter of the uniaxial tensile specimen after fracture. The values of k and C2 are substituted into Formulas (12) and (13) to get C1 = 0.2 and η0 = 0.443, respectively.
3.3 Linear Damage Evolution Criterion
After determining the equivalent plastic strain
where L is the characteristic length of the unit;
Based on Formula (14), the linear damage evolution criterion of steel is closely related to the mesh size, which implies that different characteristic unit lengths L and different effective plastic displacements
4 Verification of the Elastic-Plastic Degradation Constitutive Model
To verify the calibrated elastic-plastic degradation constitutive model, a finite element simulation was conducted on the pure shear test of 10.9-grade high-strength bolts (M16, M20, and M24) made of 40Cr steel by Li et al. [28]. According to the references [1,2,34], the two main reasons for selecting the pure shear test are as follows:
1) The stress conditions of the tests and shear pins are identical, which are under pure shear load and no preload.
2) The construction form of the tests and the shear pins is the same, both adopting a single shear construction.
4.1 Introduction to the Single Shear Test of 10.9-Grade High-Strength Bolt
In the pure shear test of 10.9-grade high-strength bolts by Li et al. [28], the specific geometric parameters of 10.9-grade high-strength bolts (M16 and M24) are shown in Fig. 8. This test was performed using the Dartec machine at Sydney University. By rotating the test table, the loading angle of the bolts was controlled to 90°, ensuring that they were subjected to pure shear force. The specific test setup is illustrated in Fig. 9a.

Figure 8: Detailed geometric parameters of grade 10.9 high-strength bolts (unit: mm)

Figure 9: One-half of the FE model for the pure shear test of grade 10.9 high-strength bolts [28]
4.2 Establishment of Finite Element Model
The setting of the pure shear test device for 10.9-grade high-strength bolts is shown in Fig. 9. Due to its symmetry, only a half finite element model was established. The material of the test device is Q&T 80 steel [35], and its constitutive model adopts a bilinear isotropic hardening elastic-plastic model. The specific expression is as follows:
where E is the elastic modulus; σy and σu are the yield stress and ultimate stress; εy and εu are the yield strain and ultimate strain. According to Aspler and Jern [36], the elastic modulus E, yield stress σy, ultimate stress σu, yield strain εy, and ultimate strain εu of Q&T 80 steel are 205 GPa, 746 MPa, 976 MPa, 3.63 × 10⁻³ mm·min−1, and 4.71 × 10⁻¹ mm·min−1, respectively. The constitutive material of the 10.9-grade high-strength bolt adopts the relevant settings detailed in Section 2.
To partition more regular elements, this paper adopts the sweep mesh division method to create a fine grid in the shear area of the bolt, while the rest of the parts are coarse grids. The fine grid size of all parts is 1 mm, the coarse grid size of the bolt is 4 mm, and the coarse grid size of the loading plate is 10 mm. Through systematic analysis of shear-critical regions with varying mesh refinement levels (0.25, 0.5, 1, and 2 mm), Song et al. [35] demonstrated that adopting a 1 mm mesh configuration achieves optimal balance between computational accuracy and analysis efficiency. Based on Bursi and Jaspart’s research [37], eight-node nonlinearly coordinated three-dimensional solid (C3D8I) units were utilized [38] to simulate 10.9-grade high-strength bolts, thereby improving computational efficiency. The loading plate utilizes a three-dimensional solid (C3D8R) unit with eight-node reduced integration [39], as illustrated in Fig. 9b.
The Uy, Rx, and Rz of all nodes on the symmetry plane were constrained. The fixed boundary condition was adopted on the bounding surface. The loading surface of the loading block is coupled to the reference point RF1, with only the Ux displacement constraint released. The shear force is applied at RF1 along the bolt axis. The contact in the finite element model utilizes global universal contact, with the normal contact attribute set to ‘hard contact’ and the tangential contact attributes set to ‘Coulomb friction contact’. Since no preload is applied in the test, the friction coefficient between the steel plates is 1 × 10⁻⁶.
The ABAQUS/Explicit solver is suitable for analyses involving material degradation and failure, as it handles dynamic characteristic equations without iteration by solving in the form of stress wave propagation [40]. Consequently, the ABAQUS/Explicit solver is chosen for the finite element analysis of the bolt’s shear resistance performance.
4.3 Comparative Analysis of Finite Element Results and Experimental Results
Figs. 10 and 11 illustrate the load-displacement curves and failure modes, respectively. As shown in Fig. 10, the trend of the load process all exhibited an initial linear part, followed by a transitional part until the ultimate load was achieved, and then fracture. Each tested bolt showed a similar and acceptable agreement in terms of the load-deformation curves between the test results and numerical analysis. As shown in Fig. 11, the failure modes acquired by the test and FEA were pure shear failure, and the failure locations were the same.

Figure 10: Comparison of the load slip curves between test measured and FE analyzed

Figure 11: Comparison of the failure models between test measured and FE analyzed
The primary characteristic parameters (initial stiffness, peak load, fracture displacement, and absorbed energy) are shown in Table 4. Initial stiffness is the slope of the linear elastic region in the load-displacement curve. Peak load is the maximum load sustained before crack propagation. Fracture displacement is the abrupt geometric position change at the moment of fracture. Absorbed energy is the total energy dissipated until structural failure. As shown in Table 4, the load-displacement curve and failure mode predicted by FEA closely match the test results, with deviations in the primary characteristic parameters between FEA and Test within 15%. The main reason for the error is the difference between the true stress-strain curve of a single component and the average true stress-strain curve used for calibrating the constitutive model in this article. These results verified that the calibrated elastic-plastic degradation constitutive model of 40Cr steel can accurately simulate the cutoff behavior of the shear pin.

(1) The failure mode of 40Cr steel tensile specimens is characterized by ductile damage with obvious necking phenomena. Additionally, the true stress-strain curve of 40Cr steel does not exhibit a distinct yield platform, making the Ramberg-Osgood model suitable for describing its elastic-plastic behavior.
(2) Through the true stress-strain curves of the 40Cr steel, the parameters of its elastic-plastic degradation model are calibrated, including the Ramberg-Osgood model, Bao-Wierzbicki damage initiation criterion, and linear damage evolution criterion.
(3) The calibrated Ramberg-Osgood model can accurately predict the elastic-plastic behavior of 40Cr steel. For the true stress-strain elastic-plastic stage, the difference between the predicted value and the test data is within 5%.
(4) The calibrated elastic-plastic degradation constitution of 40Cr steel can accurately predict the cutoff of the shear pin. The simulated failure mode, load-displacement curve, and primary characteristic parameters of the modified elastic-plastic degradation constitution of 40Cr steel agree well with the experimental results, with errors in the primary characteristic parameters within 15%.
This study developed and experimentally validated a constitutive model for 40Cr steel, specifically for the shear pin. Subsequent research should focus on advancing its engineering implementation in structural design through three principal directions: i) Application in determining performance-critical parameters of shear pins, particularly ultimate bearing capacity and failure displacement; ii) Generation of the whole force-displacement curve to modify existing simplified mechanical models for shear pin connections; iii) Investigation into how the failure progression of shear pin connections affects the seismic performance of the friction pendulum systems; iv) Explore the application of this model for long-term performance prediction, especially under environmental changes and repetitive loads.
Acknowledgement: The authors would like to express their sincere gratitude to all those who contributed to this research. Their support and efforts were key factors in the success of this study.
Funding Statement: The Research Start-up Fund for Talents Introduction of Huaiyin Institute of Technology (Grant No. Z301B23517).
Author Contributions: Mianyue Yang: Conceptualization, Methodology, Formal analysis, Validation, Investigation, Data curation, Writing—original draft, Writing—review & editing, Project administration, Funding acquisition. Huasheng Sun: Conceptualization, Methodology, Validation, Resources, Investigation. Weigao Sheng: Validation, Resources, Data curation, Writing—review & editing. All authors reviewed the results and approved the final version of the manuscript.
Availability of Data and Materials: The data is contained in the article.
Ethics Approval: Not applicable.
Conflicts of Interest: The authors declare no conflicts of interest to report regarding the present study.
References
1. Wei B, Yang ZX, Fu YJ, Chen J, Jiang L, Chen M, et al. Decoupled calculation and case study analysis of friction pendulum bearing considering the jumping-off effect. Int J Struct Stab Dyn. 2024;25(18):2550195. doi:10.1142/s0219455425501950. [Google Scholar] [CrossRef]
2. Wei B, Yang Z, Fu Y, Xiao B, Jiang L. Seismic displacement response analysis of Friction Pendulum Bearing under friction coupling and collision effects. Eng Struct. 2024;310:118128. doi:10.1016/j.engstruct.2024.118128. [Google Scholar] [CrossRef]
3. Wang B, Xiao ZH, Zhou W, Xu YQ. Experimental investigation on the broke force of shear pin for friction pendulum bearing. Earthq Eng and Eng Dyn. 2023;43(5):112–9. (In Chinese). doi:10.13197/j.eeed.2023.0511. [Google Scholar] [CrossRef]
4. Qi Q, Shao C, Cui H, Huang H, Wei W, Wang C, et al. Shaking table tests and numerical studies on the seismic behaviors of FPB in railway continuous beam bridges. Eng Struct. 2023;290(7):116318. doi:10.1016/j.engstruct.2023.116318. [Google Scholar] [CrossRef]
5. Jin Z, Chen K, He J. Improving vehicle’s seismic safety by equipping railway bridges with FPB and misalignment control device. Adv Bridge Eng. 2022;3(1):4. doi:10.1186/s43251-022-00055-0. [Google Scholar] [CrossRef]
6. Xu X, Chen X, Hu H, Zhou X, Cheng M, Sun L, et al. Energy dissipation and seismic response reduction system for high-speed railway bridges based on multiple performance requirements. Eng Struct. 2024;307(1):117919. doi:10.1016/j.engstruct.2024.117919. [Google Scholar] [CrossRef]
7. Peng T, Guo N. Experimental and numerical studies of shear pin fractures based on linear and bilinear models. Mechanics. 2016;22(4). doi:10.5755/j01.mech.22.4.16159. [Google Scholar] [CrossRef]
8. Yuan Q, Yin W, Deng K, Lu H, Pang L, Chen X. Seismic vulnerability assessment of a railway beam bridge considering brittle failure of the restrainer in a friction pendulum system. Earthq Eng Resil. 2024;3(3):432–46. doi:10.1002/eer2.91. [Google Scholar] [CrossRef]
9. Hawkins DN, Tsinopoulos G. Effect of warm extrusion on the structure and properties of low-carbon steels. J Mech Work Technol. 1978;2(2):161–77. doi:10.1016/0378-3804(78)90005-0. [Google Scholar] [CrossRef]
10. Wang T, Wang D, Liu G, Gong B, Song N. Investigations on the nanocrystallization of 40Cr using ultrasonic surface rolling processing. Appl Surf Sci. 2008;255(5):1824–9. doi:10.1016/j.apsusc.2008.06.034. [Google Scholar] [CrossRef]
11. Hu JJ, Zhang GB, Xu HB, Chen YF. Microstructure characteristics and properties of 40Cr steel treated by high current pulsed electron beam. Mater Technol. 2012;27(4):300–3. doi:10.1179/175355511x13171168481358. [Google Scholar] [CrossRef]
12. Zhang L, Ge PQ, Zhang JH, Zhu ZJ, Luan ZY. Experimental and simulation studies on temperature field of 40Cr steel surface layer in grind-hardening. Int J Abras Technol. 2007;1(2):187. doi:10.1504/ijat.2007.015383. [Google Scholar] [CrossRef]
13. Chen L, Sun W, Lin J, Zhao G, Wang G. Modelling of constitutive relationship, dynamic recrystallization and grain size of 40Cr steel during hot deformation process. Results Phys. 2019;12:784–92. doi:10.1016/j.rinp.2018.12.046. [Google Scholar] [CrossRef]
14. Cui FK, Xie KG, Xie YF, Hou LM, Dong XD, Li Y. Constitutive model of cold roll-beating forming of 40Cr. Mater Res Innov. 2015;19(sup8):S8-284–S8-287. doi:10.1179/1432891715z.0000000001678. [Google Scholar] [CrossRef]
15. Wang XQ, Zhu WJ, Cui FK, Li YX. Plastic constitutive model and analysis of flow stress of 40Cr quenched and tempered steel. ISRN Mech Eng. 2013;2013(4):490750–6. doi:10.1155/2013/490750. [Google Scholar] [CrossRef]
16. Zhou H, Peng Z, Li G, Guan X, Chen J, Shi X, et al. A novel built-up constitutive model of 40Cr alloy steel considering the geometric effect with simulation verification. J Mater Eng Perform. 2025;34(1):356–67. doi:10.1007/s11665-023-09021-x. [Google Scholar] [CrossRef]
17. Zhang K, Zheng C. Computer simulated analyses on deformation and fracture of non-cracked and cracked specimens. Acta Mech Sin. 1991;7(3):243–50. doi:10.1007/BF02487592. [Google Scholar] [CrossRef]
18. Zhang KS, Zheng CQ. Analysis of large deformation and fracture of axisymmetric tensile specimens. Eng Fract Mech. 1991;39(5):851–7. doi:10.1016/0013-7944(91)90190-C. [Google Scholar] [CrossRef]
19. Rostampoureh A, Chakherlou TN. Estimating ductile crack initiation in structural steel under combined tension and shear stress using a modified void growth model. Proc Inst Mech Eng Part L J Mater Des Appl. 2023;237(3):616–39. doi:10.1177/14644207221121976. [Google Scholar] [CrossRef]
20. Khademi M, Naeini HM, Mirnia MJ, Kasaei MM, da Silva LF. Fracture prediction of AA6061-T6 sheet in bending process using Gurson-Tvergaard–Needleman model. Proc Inst Mech Eng Part L J Mater Des Appl. 2023;237(12):2506–19. doi:10.1177/14644207221134504. [Google Scholar] [CrossRef]
21. Sun Y, Li G, He Z, Kong X. Numerical analysis of Johnson-cook damage model parameters effectson the cutting simulation of AISI 1045. Recent Pat Eng. 2022;16(6):e241221199376. doi:10.2174/1872212116666211224095530. [Google Scholar] [CrossRef]
22. Bao Y, Wierzbicki T. On fracture locus in the equivalent strain and stress triaxiality space. Int J Mech Sci. 2004;46(1):81–98. doi:10.1016/j.ijmecsci.2004.02.006. [Google Scholar] [CrossRef]
23. Wierzbicki T, Bao Y, Lee YW, Bai Y. Calibration and evaluation of seven fracture models. Int J Mech Sci. 2005;47(4–5):719–43. doi:10.1016/j.ijmecsci.2005.03.003. [Google Scholar] [CrossRef]
24. Li WC. The application of micromechanical damage criterion of structural steel in damage analysis of steel frame under extreme loads. Xi’an, China: Chang’an University; 2014. (In Chinese). doi: 10.7666/d.D557880. [Google Scholar] [CrossRef]
25. Bao Y, Wierzbicki T. On the cut-off value of negative triaxiality for fracture. Eng Fract Mech. 2005;72(7):1049–69. doi:10.1016/j.engfracmech.2004.07.011. [Google Scholar] [CrossRef]
26. Yu HL, Jeong DY. Application of a stress triaxiality dependent fracture criterion in the finite element analysis of unnotched Charpy specimens. Theor Appl Fract Mech. 2010;54(1):54–62. doi:10.1016/j.tafmec.2010.06.015. [Google Scholar] [CrossRef]
27. Eshraghi S, Carolan ME, John A. Quick calibration of fracture behaviors in TC128 steel for finite element modeling. USA: Federal Railroad Administration. Office of Railroad Policy and Development; 2020. [Google Scholar]
28. Li D, Uy B, Wang J, Song Y. Behaviour and design of high-strength Grade 12.9 bolts under combined tension and shear. J Constr Steel Res. 2020;174(3):106305. doi:10.1016/j.jcsr.2020.106305. [Google Scholar] [CrossRef]
29. GB/T2281-2010. Metallic materials—Tensile testing—Part 1: Method of test at room temperature. Beijing, China: Standards Press of China; 2010. (In Chinese). [Google Scholar]
30. Rasmussen KJR. Full-range stress-strain curves for stainless steel alloys. J Constr Steel Res. 2003;59(1):47–61. doi:10.1016/S0143-974X(02)00018-4. [Google Scholar] [CrossRef]
31. Ling Y. Uniaxial true stress-strain after necking. AMP J Technol. 1996;5:37–48. [Google Scholar]
32. Bao YB. Prediction of ductile crack formation in uncracked bodies. Cambridge, MA, USA: Massachusetts Institute of Technology; 2003. [Google Scholar]
33. Zhang G, Gao Z, Nie X, Chang L. Study on failure criterion and microscopic damage evolution mechanism of three-dimensional braided composites. J Compos Mater. 2025;59(13):1609–29. doi:10.1177/00219983251315644. [Google Scholar] [CrossRef]
34. Wei B, Xiao B, Fu Y, Jiang L, Li S. Effect of simulation accuracy of shear keys shear state on seismic response of friction pendulum bearing. Structures. 2022;39(1):1189–203. doi:10.1016/j.istruc.2022.03.092. [Google Scholar] [CrossRef]
35. Song Y, Wang J, Uy B, Li D. Experimental behaviour and fracture prediction of austenitic stainless steel bolts under combined tension and shear. J Constr Steel Res. 2020;166(5):105916. doi:10.1016/j.jcsr.2019.105916. [Google Scholar] [CrossRef]
36. Aspler EB, Jern L. FEM the Wood Revolution In-depth FE-analysis of a wood-glue-steel joint in a wind turbine tower. Gothenburg, Sweden: Chalmers University of Technology; 2019. doi:10.13140/RG.2.2.10681.39521. [Google Scholar] [CrossRef]
37. Bursi OS, Jaspart JP. Calibration of a finite element model for isolated bolted end-plate steel connections. J Constr Steel Res. 1997;44(3):225–62. doi:10.1016/S0143-974X(97)00056-4. [Google Scholar] [CrossRef]
38. Shi YP, Zhou YR. Example explanation for finite element analysis by ABAQUS. Beijing, China: China Machine Press; 2006.(In Chinese). [Google Scholar]
39. Kim TS, Kuwamura H. Finite element modeling of bolted connections in thin-walled stainless steel plates under static shear. Thin Walled Struct. 2007;45(4):407–21. doi:10.1016/j.tws.2007.03.006. [Google Scholar] [CrossRef]
40. Chen L, Liu D, Lei M, Zhang Y, Zhao T, Zheng Y. The study on the constitutive model of concrete for explicit dynamic of ABAQUS based on damage energy. Adv Mater Sci Eng. 2022;2022:1914314–9. doi:10.1155/2022/1914314. [Google Scholar] [CrossRef]
Cite This Article
 Copyright © 2025 The Author(s). Published by Tech Science Press.
This work is licensed under a Creative Commons Attribution 4.0 International License , which permits unrestricted use, distribution, and reproduction in any medium, provided the original work is properly cited.
 Downloads
 Citation Tools