
 Submit a Paper
 Propose a Special lssue
 Open Access
ARTICLE

Short-Term Multi-Hazard Prediction Using a Multi-Source Data Fusion Approach
1 Deptment of Information Technology, The Islamia University of Bahawalpur, Bahawalpur, 63100, Pakistan
2 Deptment of Artificial Intelligence, The Islamia University of Bahawalpur, Bahawalpur, 63100, Pakistan
3 Deptment of Software Engineering, The Islamia University of Bahawalpur, Bahawalpur, 63100, Pakistan
4 Department of Computer Science, COMSATS University Islamabad, Vehari Campus, Vehari, 61100, Pakistan
5 Artificial Intelligence and Data Analytics Laboratory (AIDA), College of Computer and Information Sciences (CCIS), Prince Sultan University, Riyadh, 12435, Saudi Arabia
6 Department of Information Systems, College of Computer and Information Sciences, Princess Nourah bint Abdulrahman University, Riyadh, 11671, Saudi Arabia
* Corresponding Author: Tahani Jaser Alahmadi. Email:
Computers, Materials & Continua 2025, 85(3), 4869-4883. https://doi.org/10.32604/cmc.2025.067639
Received 08 May 2025; Accepted 22 July 2025; Issue published 23 October 2025
 View Full Text
 Download PDF
Abstract
The increasing frequency and intensity of natural disasters necessitate advanced prediction techniques to mitigate potential damage. This study presents a comprehensive multi-hazard early warning framework by integrating the multi-source data fusion technique. A multi-source data extraction method was introduced by extracting pressure level and average precipitation data based on the hazard event from the Cooperative Open Online Landslide Repository (COOLR) dataset across multiple temporal intervals (12 h to 1 h prior to events). Feature engineering was performed using Choquet fuzzy integral-based importance scoring, which enables the model to account for interactions and uncertainty across multiple features. Three individual Long Short-Term Memory (LSTM) models were trained for hazard location, average precipitation, and hazard category (i.e., to detect the potential of natural disasters). These models were trained on varying temporal scales from 12 to 1 h prior to the event. These individual models achieved the performance of Mean Absolute Error (MAE) 2.2 and 3.2, respectively, for the hazard location and average precipitation models, and an F1-score of 0.825 for the hazard category model. The results also indicate that the LSTM model outperformed traditional Machine Learning (ML) models, and the use of the fuzzy integral enhanced the prediction capability by 8.12%, 2.6%, and 6.37%, respectively, for all three individual models. Furthermore, a rule-based algorithm was developed to synthesize the outputs from the individual models into a grid of multi-hazard warnings. These findings underscore the effectiveness of the proposed framework in advancing multi-hazard forecasting and situational awareness, offering valuable support for timely and data-driven emergency response planning.Keywords
The frequency and severity of natural disasters, such as landslides and extreme precipitation, are increasing, raising significant concerns for infrastructure and communities worldwide [1]. Due to the inherent complexity and uncertainty of the risks generated by these events, it is imperative to provide timely and precise hazard warnings to mitigate them. The uncertainties and intricacies of multi-hazard scenarios present challenges to current systems [2]. This research contributes to addressing a significant gap in the field by establishing a framework that can incorporate a variety of environmental data to improve the precision of multi-hazard warnings. This study is of great importance in protecting vulnerable populations, enhancing disaster preparation and response, and mitigating potential losses.
The multi-hazard data-driven approaches are categorized into stochastic [3], empirical [4], and mechanistic models [5], each with its own strengths and limitations [6]. Stochastic models, such as multivariate models or copula-based techniques [7], effectively capture the complex relationships and dependencies between hazards [8]. However, they are not as effective in scenarios with sparse or uncertain data. The efficacy of extreme value and vine copulas in tail dependence analysis often makes it difficult to comprehend dynamic interactions among multiple hazards. Empirical models [9], including regression techniques and dependence measures, are implemented during the development of models to optimize computational efficiency and investigate hazard relationships. Regression models associated with the use of Linear and Logistic Regression [10] models are frequently used for the analysis of hazard dependencies while risking oversimplifying complex interactions. Measures such as tail dependence [11] and rank correlation [12] are used to determine the feats of dependencies but have no provision for learning from experience. Techniques such as Decision Tree [13], Support Vector Machine (SVM) [14], provide a higher level of flexibility compared to other techniques but rely heavily on large datasets and lack capability in terms of interpretable models in the geospatial-temporal context. Hazards are frequently oversimplified in interactions, relying heavily on prior experience and failing to accurately represent nonlinear or spatiotemporal complexities [15]. Mechanistic models, such as hydrological or climate-based physical models, can generate detailed hazard simulations [16]. However, they are computationally expensive and are susceptible to the uncertainties of the parameters involved, particularly in environments that are swiftly changing. Therefore, these obstacles necessitate hybrid models that integrate the advantages of these categories. As the model involves multiple heterogeneous data sources, accurately calculating feature importance becomes critical for effective prediction. Fuzzy integral techniques were selected because they account for interactions among features and manage uncertainty more robustly than traditional methods. This allows for adaptive weighting, enhancing the model’s reliability in complex multi-hazard environments.
In this study, we propose a novel multi-source data fusion approach for forecasting multi-hazard warnings that attempts to overcome the limitations of existing traditional methods. The idea for the proposed model is to improve the accuracy and reliability of short-term predictions for landslides and extreme precipitation. The key contributions of the proposed model are outlined below:
• A novel data integration framework for short-term landslide and extreme precipitation warnings is presented, integrating precipitation data, Cooperative Open Online Landslide Repository (COOLR) data, and atmospheric pressure level data.
• The model uses fuzzy integral techniques for feature importance determination and the usage of weights that enable efficient allocation of weights given the uncertainty in environmental data.
• To enhance multi-hazard prediction, we apply a novel deep learning-based approach to predict potential geographic coordinates (latitude and longitude) with which landslides are associated, and estimate average precipitation rates.
This integrated approach fills key gaps in traditional forecasting systems to provide more accurate, and actionable, early warnings.
The sections of the study are arranged as follows: Section 2 provides a comprehensive review of the existing literature. Section 3 presents the data extraction process along with feature importance and model development. Section 4 discusses the outcomes of the study. Section 5 presents the concluding insights and future research directions.
Robust modeling techniques that can capture the complicated interactions between different natural events are required to precisely predict multi-hazard risks. Data-driven models have become very successful in domains where we see success in recent years [17,18]. Some advantages of their method include computational efficiency and adaptivity to environmental behavioral factors, allowing for more accurate and dynamic predictions.
2.1 Empirical Methods for Hazard Prediction
Empirical methods for hazard prediction rely on data-driven techniques, using historical observations to establish relationships between variables. In the study [19], a discrete element model is used to investigate the failure and structural behaviour in the stepped reinforced soil retaining wall subject to loading conditions in which the patterns of force chains are used to determine any possible failure surfaces. The study [20], experiment is based on the combination of microseismic monitoring with numerical simulation to forecast the risk of rockburst in coal mining, which allows determining the precursors of the rockburst risk like the temporal changes of the energy index and the stress concentration zones to predict the early hazard.
Recent research also shows how satellite imagery is applied in the identification of landslides and in the assessment of risks. Ghorbanzadeh et al. [21] have applied ResU-Net and Object-Based Image Analysis (OBIA) integration to improve the quality of landslide maps with higher accuracy. Slope image stability analysis is done with the use of deep learning by Azmoon et al. [22] and proved to be effective for large-scale hazards. In their study, Mohan et al. [23] assessed the use of Convolutional Neural Networks (CNNs) and remote sensing images for identifying landslides with high spatial resolution and pointed out that even though the approach works well in recognizing spatial features, issues such as limited sample sizes exist. These studies demonstrate that satellite imagery is an effective tool for compiling geospatial data for the purpose of making accurate and large-scale hazard assessments.
2.2 Multi Hazard Prediction Models
Multi-hazard prediction, a complex process with implications in disaster management, is an important research field that requires more attention. Other challenges include the incorporation of multiple factors, such as climatic, geological, and hydrological factors, data limitations, and space-time dimensions. Such problems significantly hinder the development of reliable predictive models. Nevertheless, sophisticated techniques such as data-based techniques, machine learning (ML) techniques, and combined methods have greatly contributed to the development of multi-hazard forecasting.
Ali et al. [24] assessed fuzzy multi-criteria and ML methods and established that the Random Forest was more effective than other methods in landslide susceptibility assessment. Pourghasemi et al. [25] employed Random Forest model to produce multi-hazard probability maps of floods, landslides, and forest fires with high accuracy, but they mentioned the data-dependent issue. The study [26] also presented the coupled use of Geographic Information Systems (GIS) and ML for landslide, flood, and forest fire alerting and the importance of consistent data and methods. The works discussed here present a methodological pluralism of approaches and raise issues that pertain to the quality of data as well as the cross-hazard compatibility of data.
Despite numerous advances in multi-hazard prediction, substantial gaps persist in integrating multiple datasets and uncertainty in environmental factors. Most current methods lack frameworks that can correctly put heterogeneous data together, like precipitation, landslide records, and atmospheric conditions, for short-term hazards. In addition, existing approaches often have difficulties precisely defining spatial associations of hazards and dealing with uncertainties inherent in environmental data. To address these gaps, this study presents a novel data integration framework utilizing fuzzy integrals for feature importance and weight allocation. Furthermore, a ML-based technique improves the geographic precision of landslide prediction along with precipitation rate calculation.
The methodology of this study comprises four key steps designed to develop a robust multi-hazard early warning framework. These steps are outlined below:
• Data Extraction: Relevant features such as pressure levels, average precipitation, elevation, and hazard attributes were extracted from the Climate Data Store (CDS) based on COOLR dataset across multiple time intervals prior to hazard events.
• Data Fusion and Feature Importance Using Fuzzy Integral: The Choquet fuzzy integral was applied to assess and aggregate the importance of heterogeneous features, enabling effective fusion of multi-source inputs.
• Predictive Modeling: Three distinct ong Short-Term Memory (LSTM) models were trained to forecast hazard location, average precipitation, and hazard category based on temporally fused features.
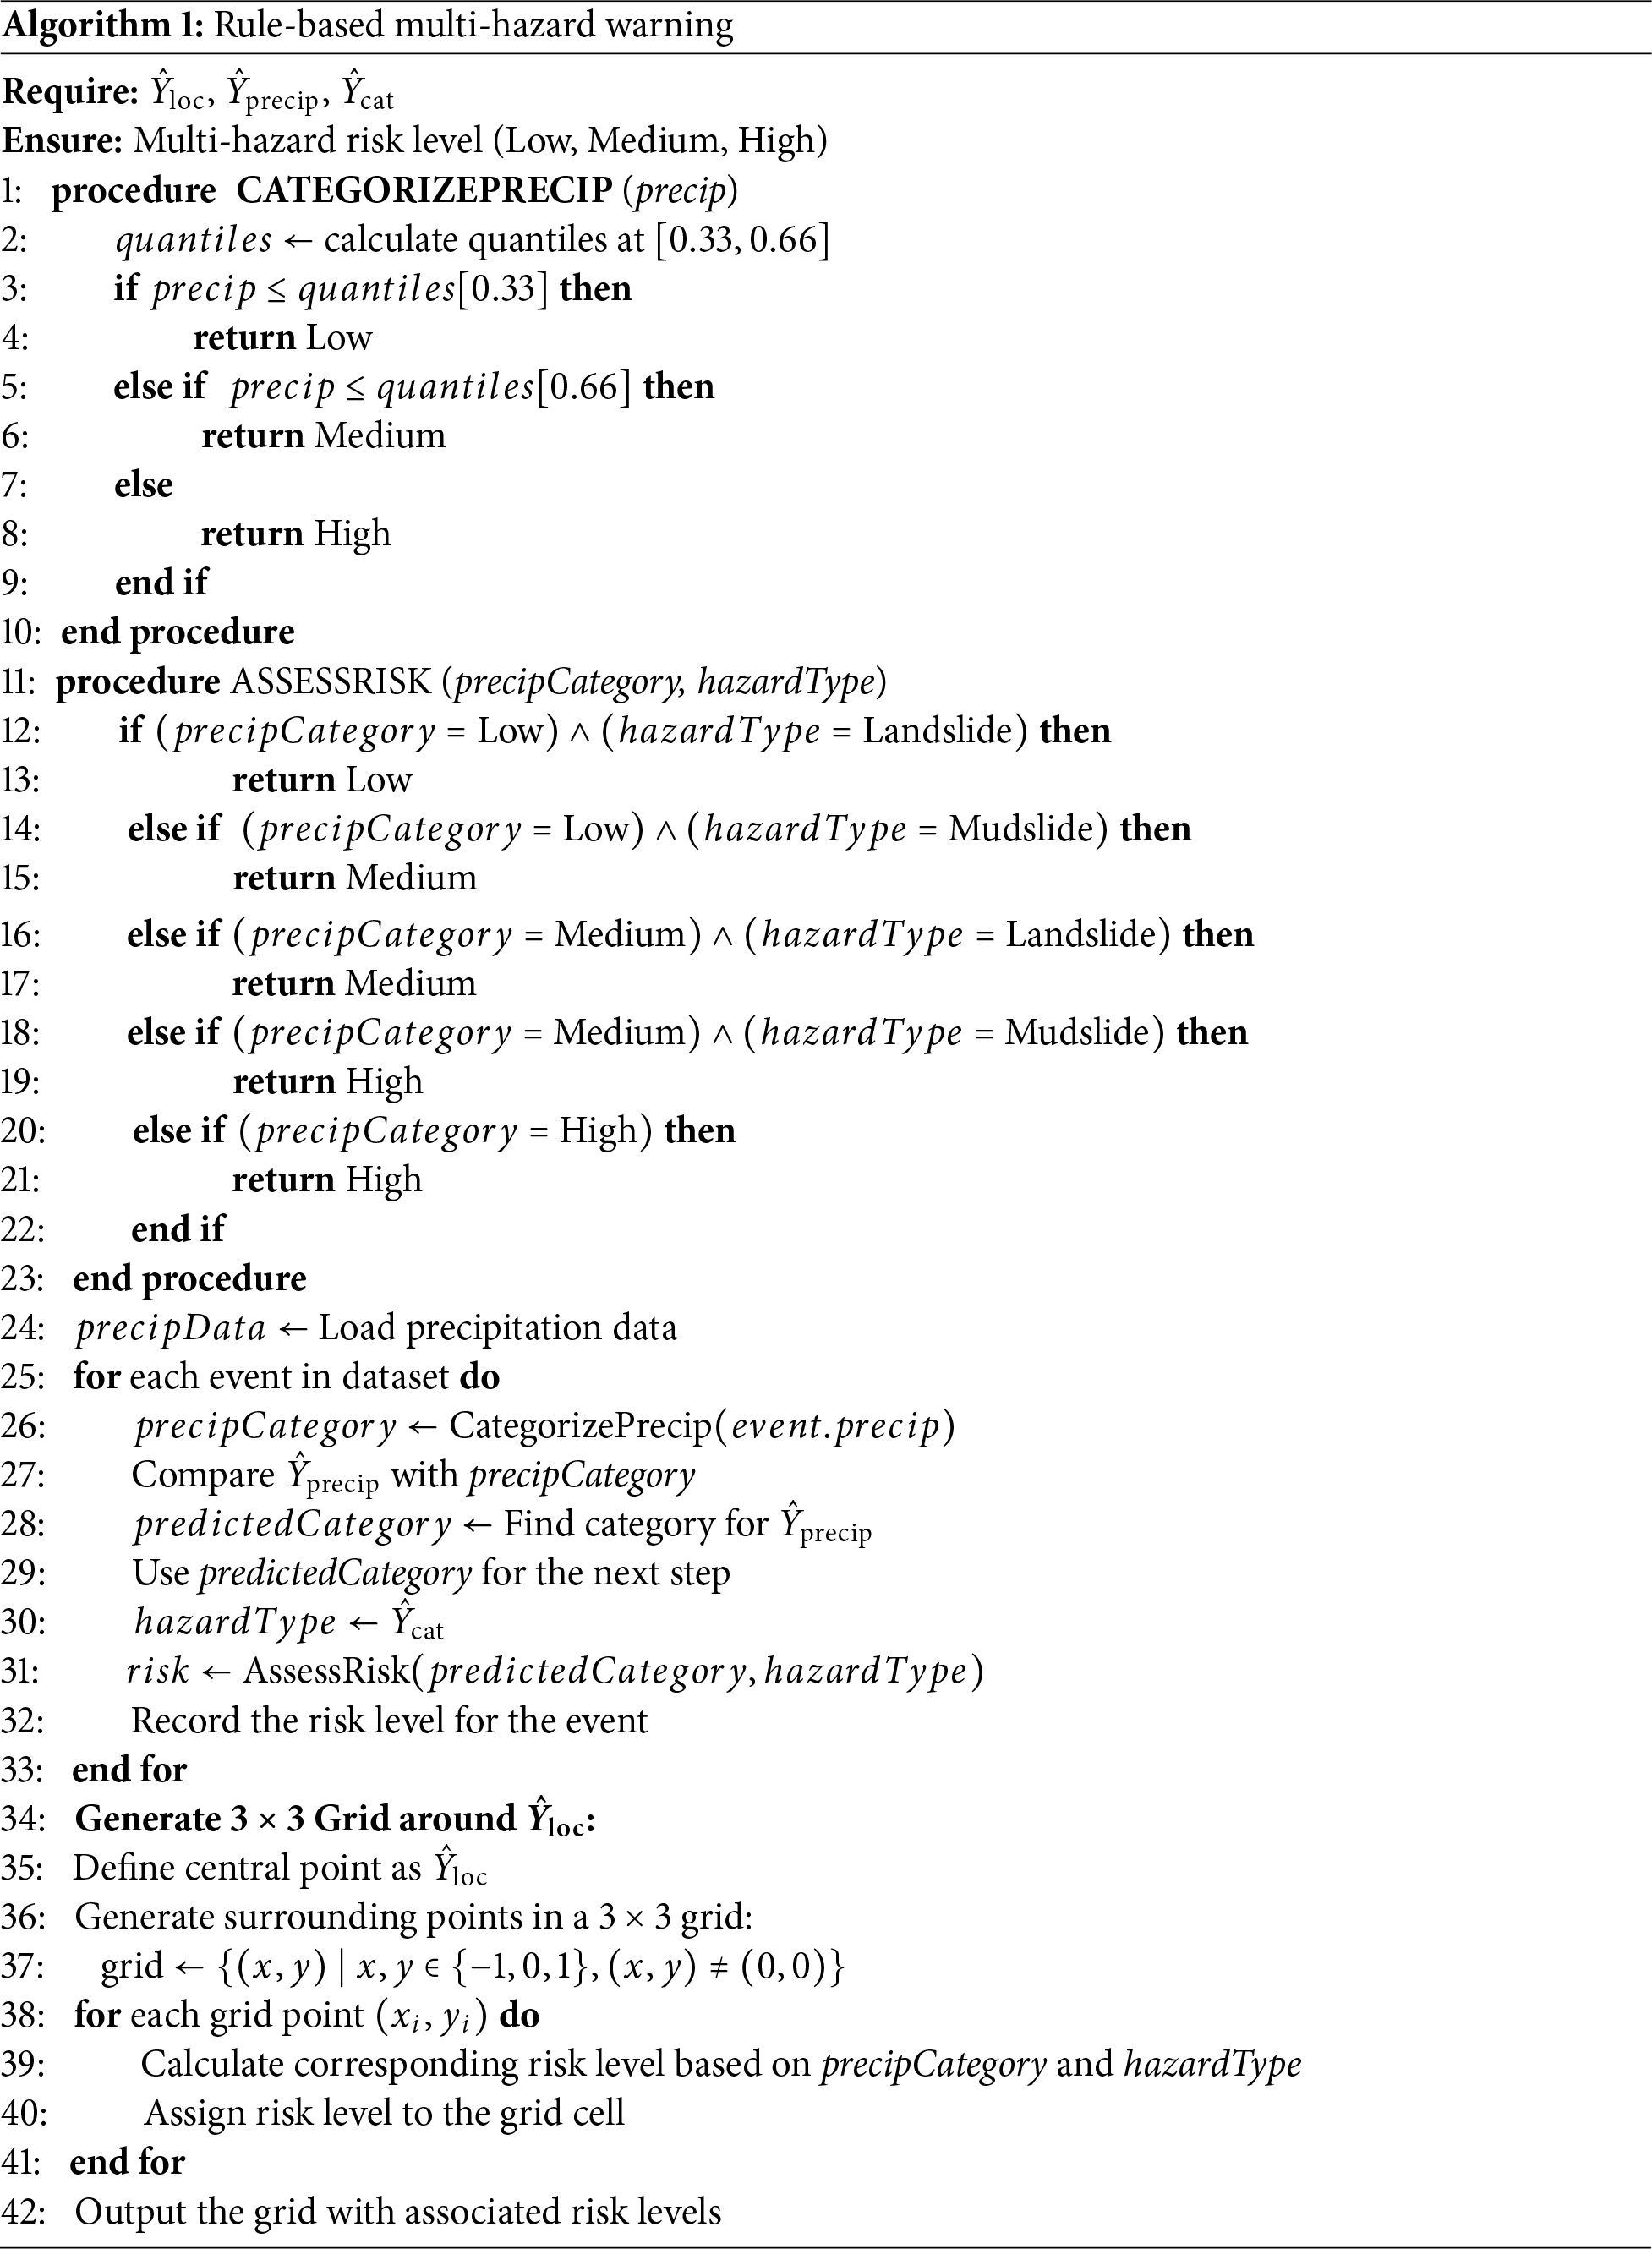
• Integration into Multi-Hazard Warning Grid: Outputs from the three LSTM models were synthesized using a rule-based approach to generate a
This study mapped the multi-hazard warning to a time series problem as forecasting
Let D represent the dataset, where each entry
where
This study utilizes multi-source data that includes environmental, atmospheric, and geospatial data. The NASA Global Precipitation Measurement (GPM) is the data provider for the COOLR [27]. COOLR serves as a useful tool for analyzing landslide events and their relationships with precipitation information. The COOLR dataset is used as the primary source of data along with other datasets including satellite precipitation data [28] and pressure level data [29]. The COOLR dataset comprises 11,033 records from 140 distinct countries. This study concentrated on ‘US’ events, which comprise 2992 records. The COOLR dataset is used to extract the event date and time, as well as its location (longitude and latitude). Based on the date, time, and location provided, satellite precipitation data and pressure level data are extracted from the CDS [30] up to 24 h early from the event interval. A dynamic grid policy is adopted to create a 3
Satellite precipitation data, available on a daily mean basis, is extracted for analysis using both 12-h and 24-h mean intervals. This extraction then allows for a more granular view of precipitation patterns, including shorter-term variations (12 h mean) as well as daily scale trends (24 h mean).
Reanalysis pressure level data is available at 1-h time intervals for 16 different variables and 37 different isobaric planes. The pressure level data extraction process in this study involves the extraction of 11 distinct variables for a single isobaric plane (1000 hPa) at five distinct time intervals, ranging from 1-h to 12-h prior to the event, as illustrated in Fig. 1.
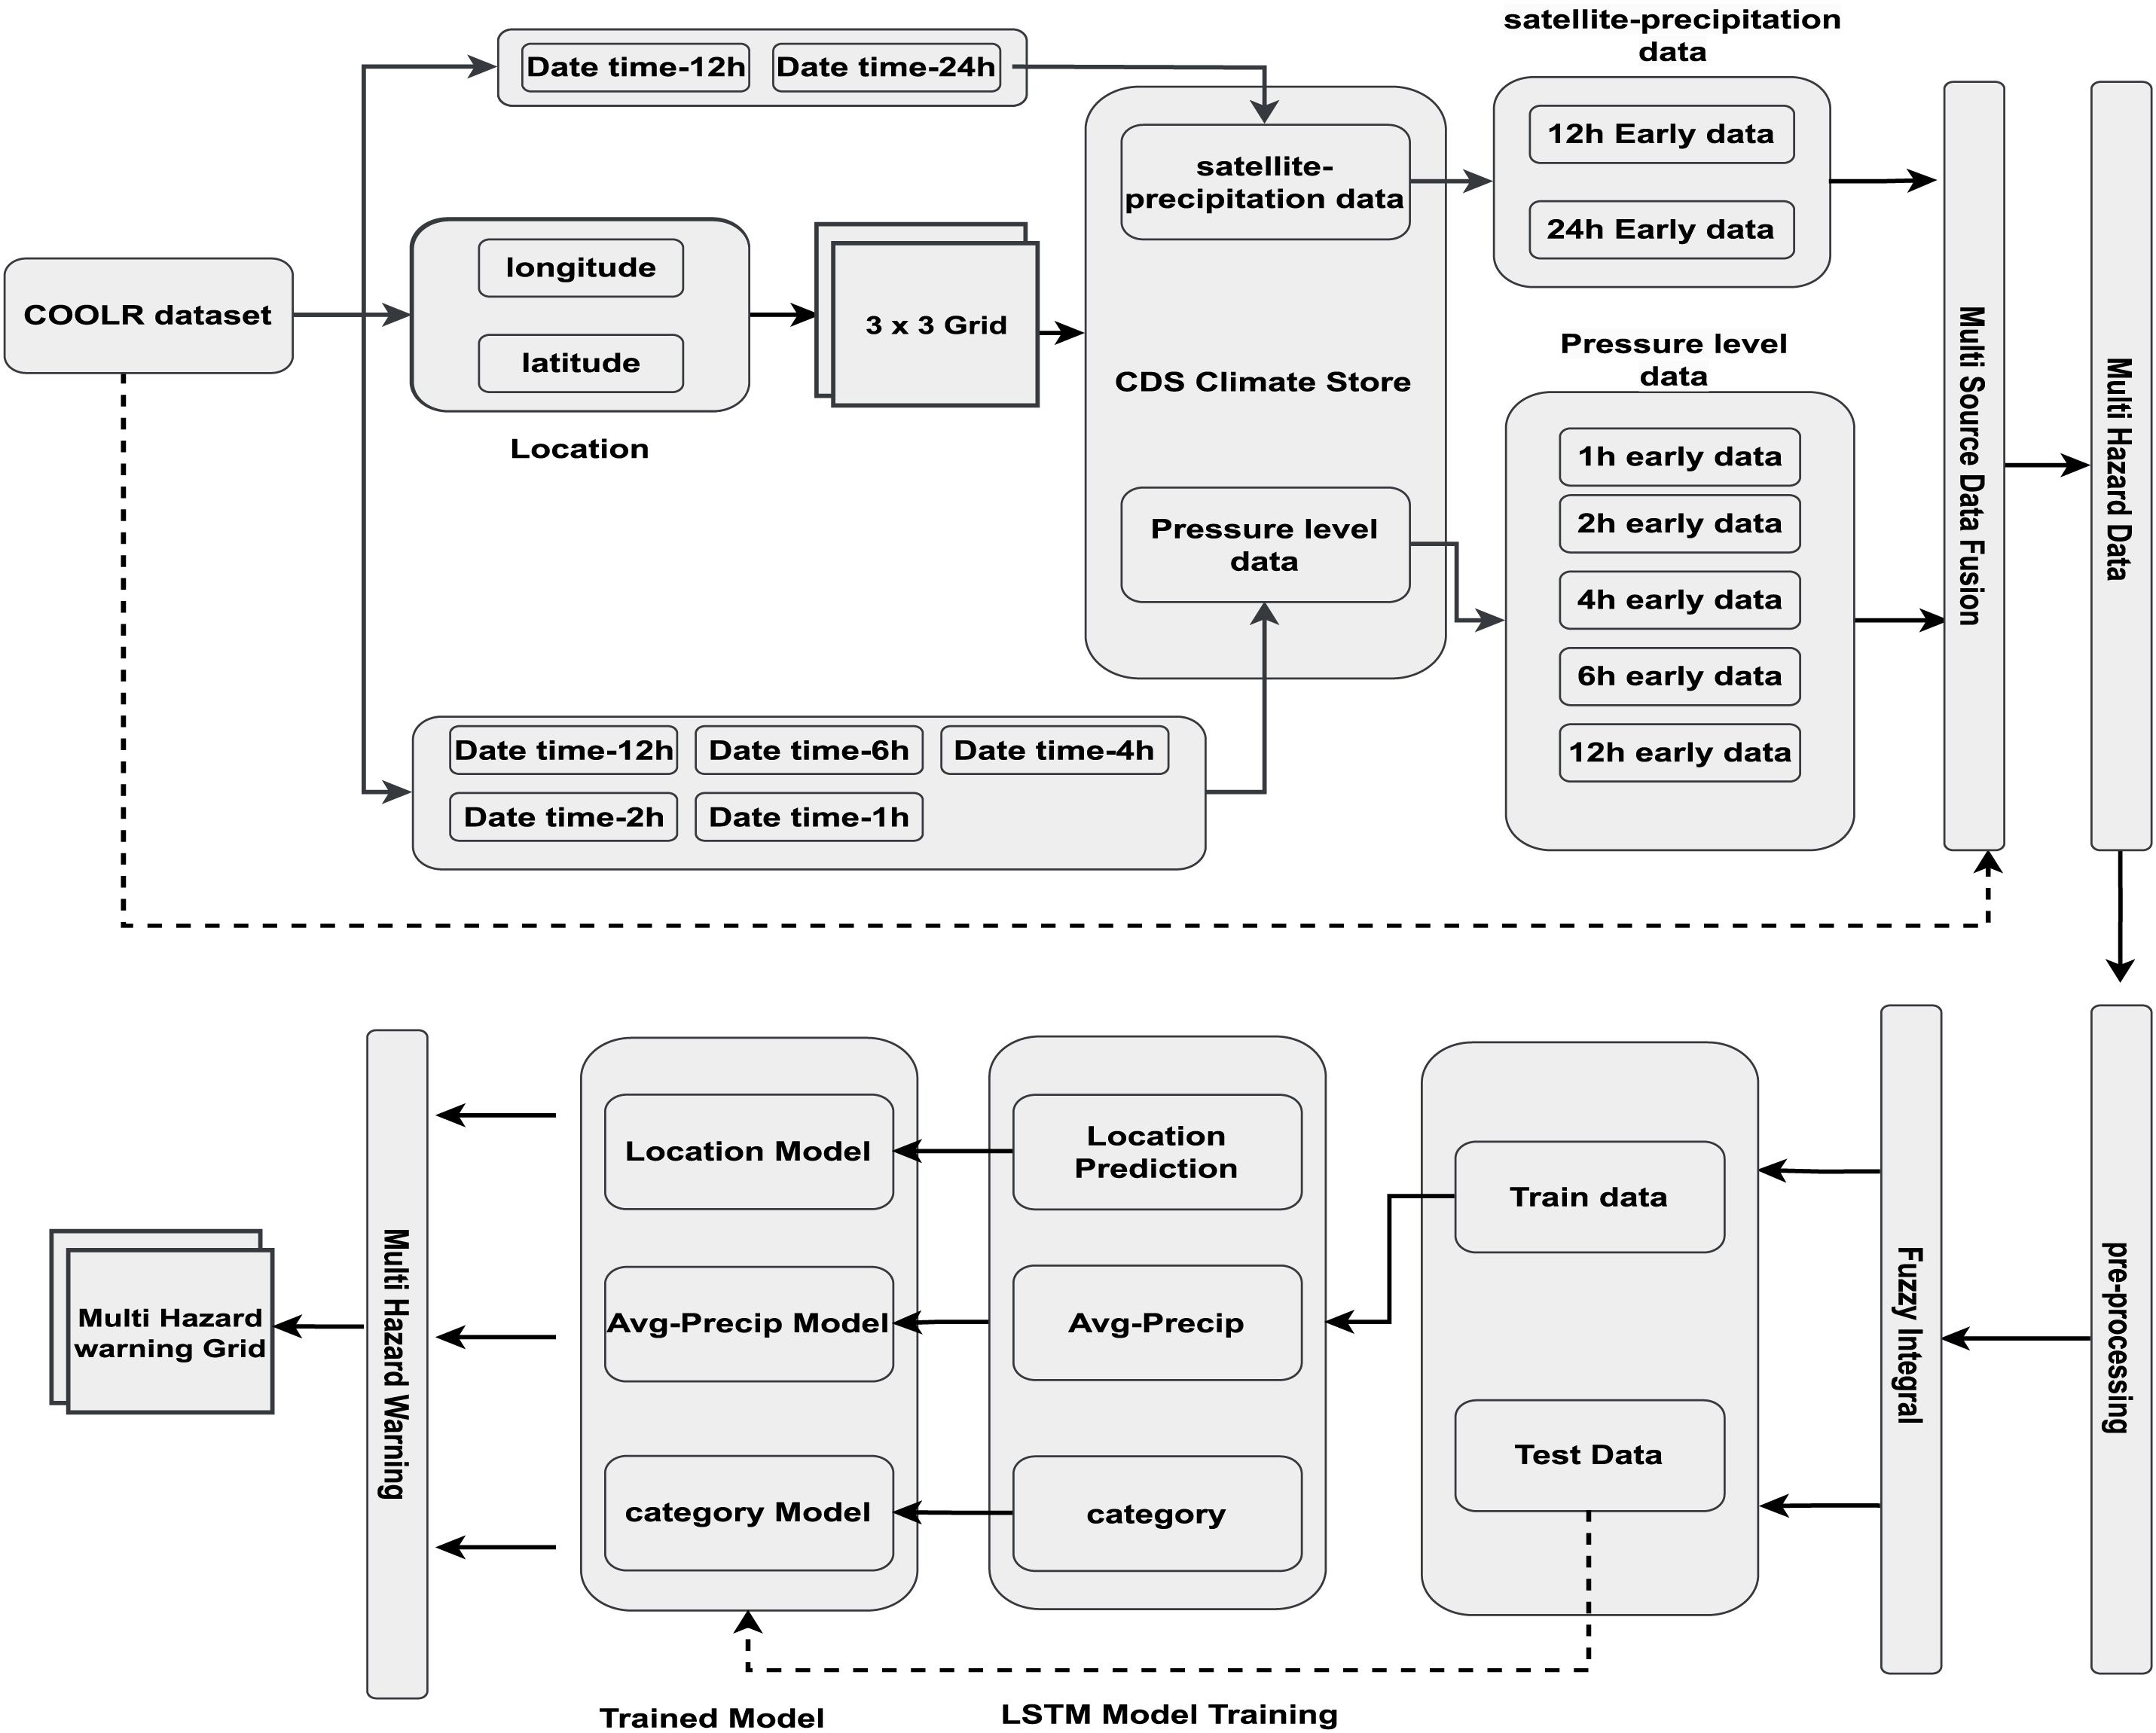
Figure 1: Overview of data extraction and predictive modeling workflow for multi-hazard warning
3.3 Data Fusion and Feature Importance Using Fuzzy Integral
The use of multiple datasets is especially important for an efficient analysis of multi-hazard risk assessment. In this research, we use a data fusion approach based on a unique ID that is attached to each event:
•
•
•
Each dataset
where
where
The Choquet integral
Calculates the cumulative maximum of the sorted feature array. It is essential for the Choquet integral computation, which uses the maximum value at each step to scale the differences in feature values.
In the Predictive Modeling section of this study, we delve into the development and application of three distinct LSTM models, each tailored to predict specific aspects of multi-hazard scenarios: average precipitation, hazard category, and hazard location. The data is carefully split into training and testing sets so that we have a robust methodology for training and validating the model. As such, these models form the basis of a more complete multi-hazard warning system that issues exact, spatially explicit, actionable warnings through a 3 × 3 grid approach. Each model consists of 2 LSTM layers with 64 hidden units and a dropout rate of 0.5. The models are trained using the Adam optimizer with a learning rate of 0.001, a batch size of 64, and 200 epochs.
3.4.1 Integration into Multi-Hazard Warning Grid
Predictions from three specialized LSTM models (location
The predictions of
It is important to assess the performance of the predictive models as well as the multi-hazard warning system to determine their efficiency and credibility in practice. This section describes the methods and measures to calculate the accuracy, precision, and operational performance of the developed models under different environments and hazardous events.
In order to evaluate the effectiveness of the proposed methodology, we answer the questions presented earlier in this section. Individual models are studied in detail, and the integrated multi-hazard warning system is assessed in terms of performance.
4.1.1 Performance of Individual Predictive Model
To evaluate the performance of each individual model
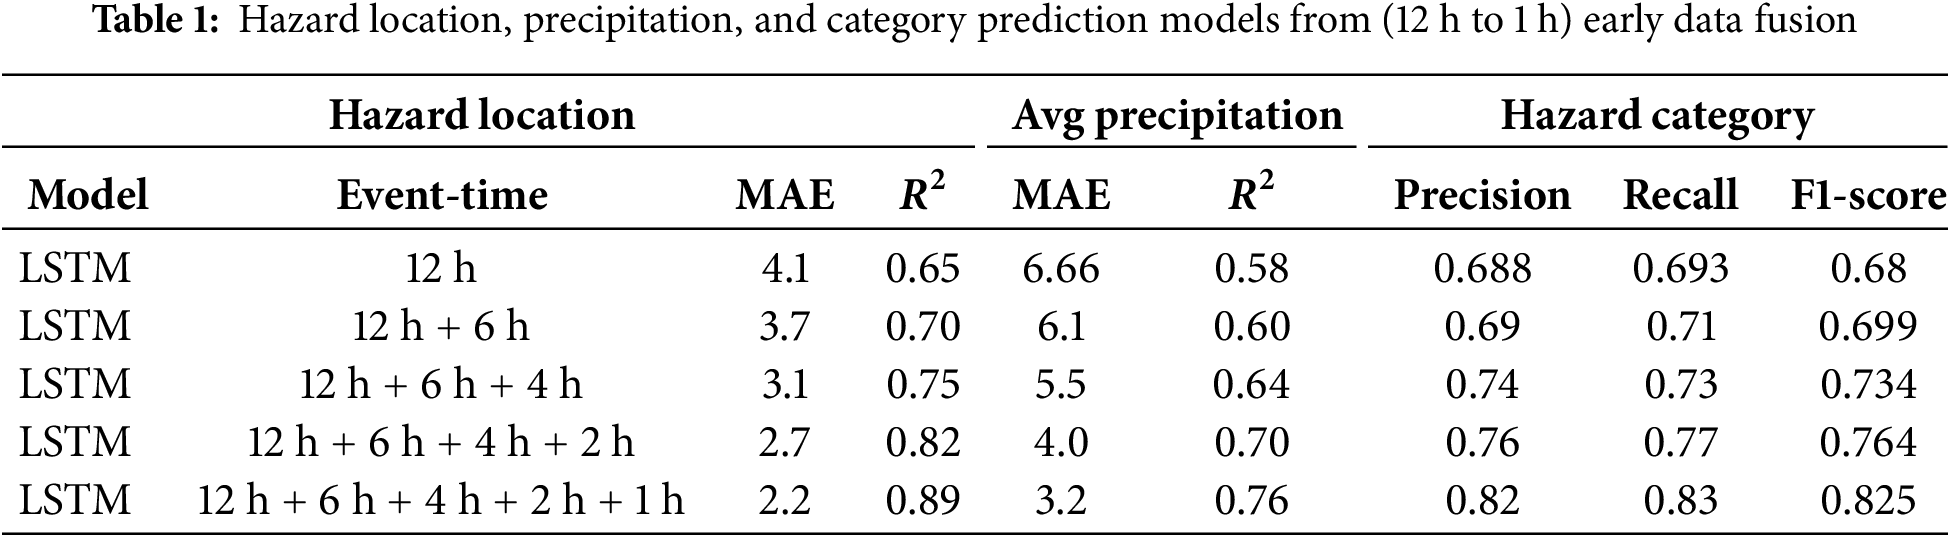
Table 1 column (Hazard location) shows the results of the performance of the LSTM model in estimating hazard locations at different intervals of time prior to the event. The “Event-time” labels such as “12 h + 6 h” represent the fusion of data collected at multiple distinct temporal intervals prior to the event. Increasing the granularity of the time intervals leads to major improvements in both Mean Absolute Error (MAE) and the coefficient of determination
Table 1 column (Avg Precipitation) shows how the LSTM model predicts average precipitation and how the MAE drops remarkably from 6.66 to 3.2 when temporal layers from 12 h before the event to 1 h before the event are added, and how the
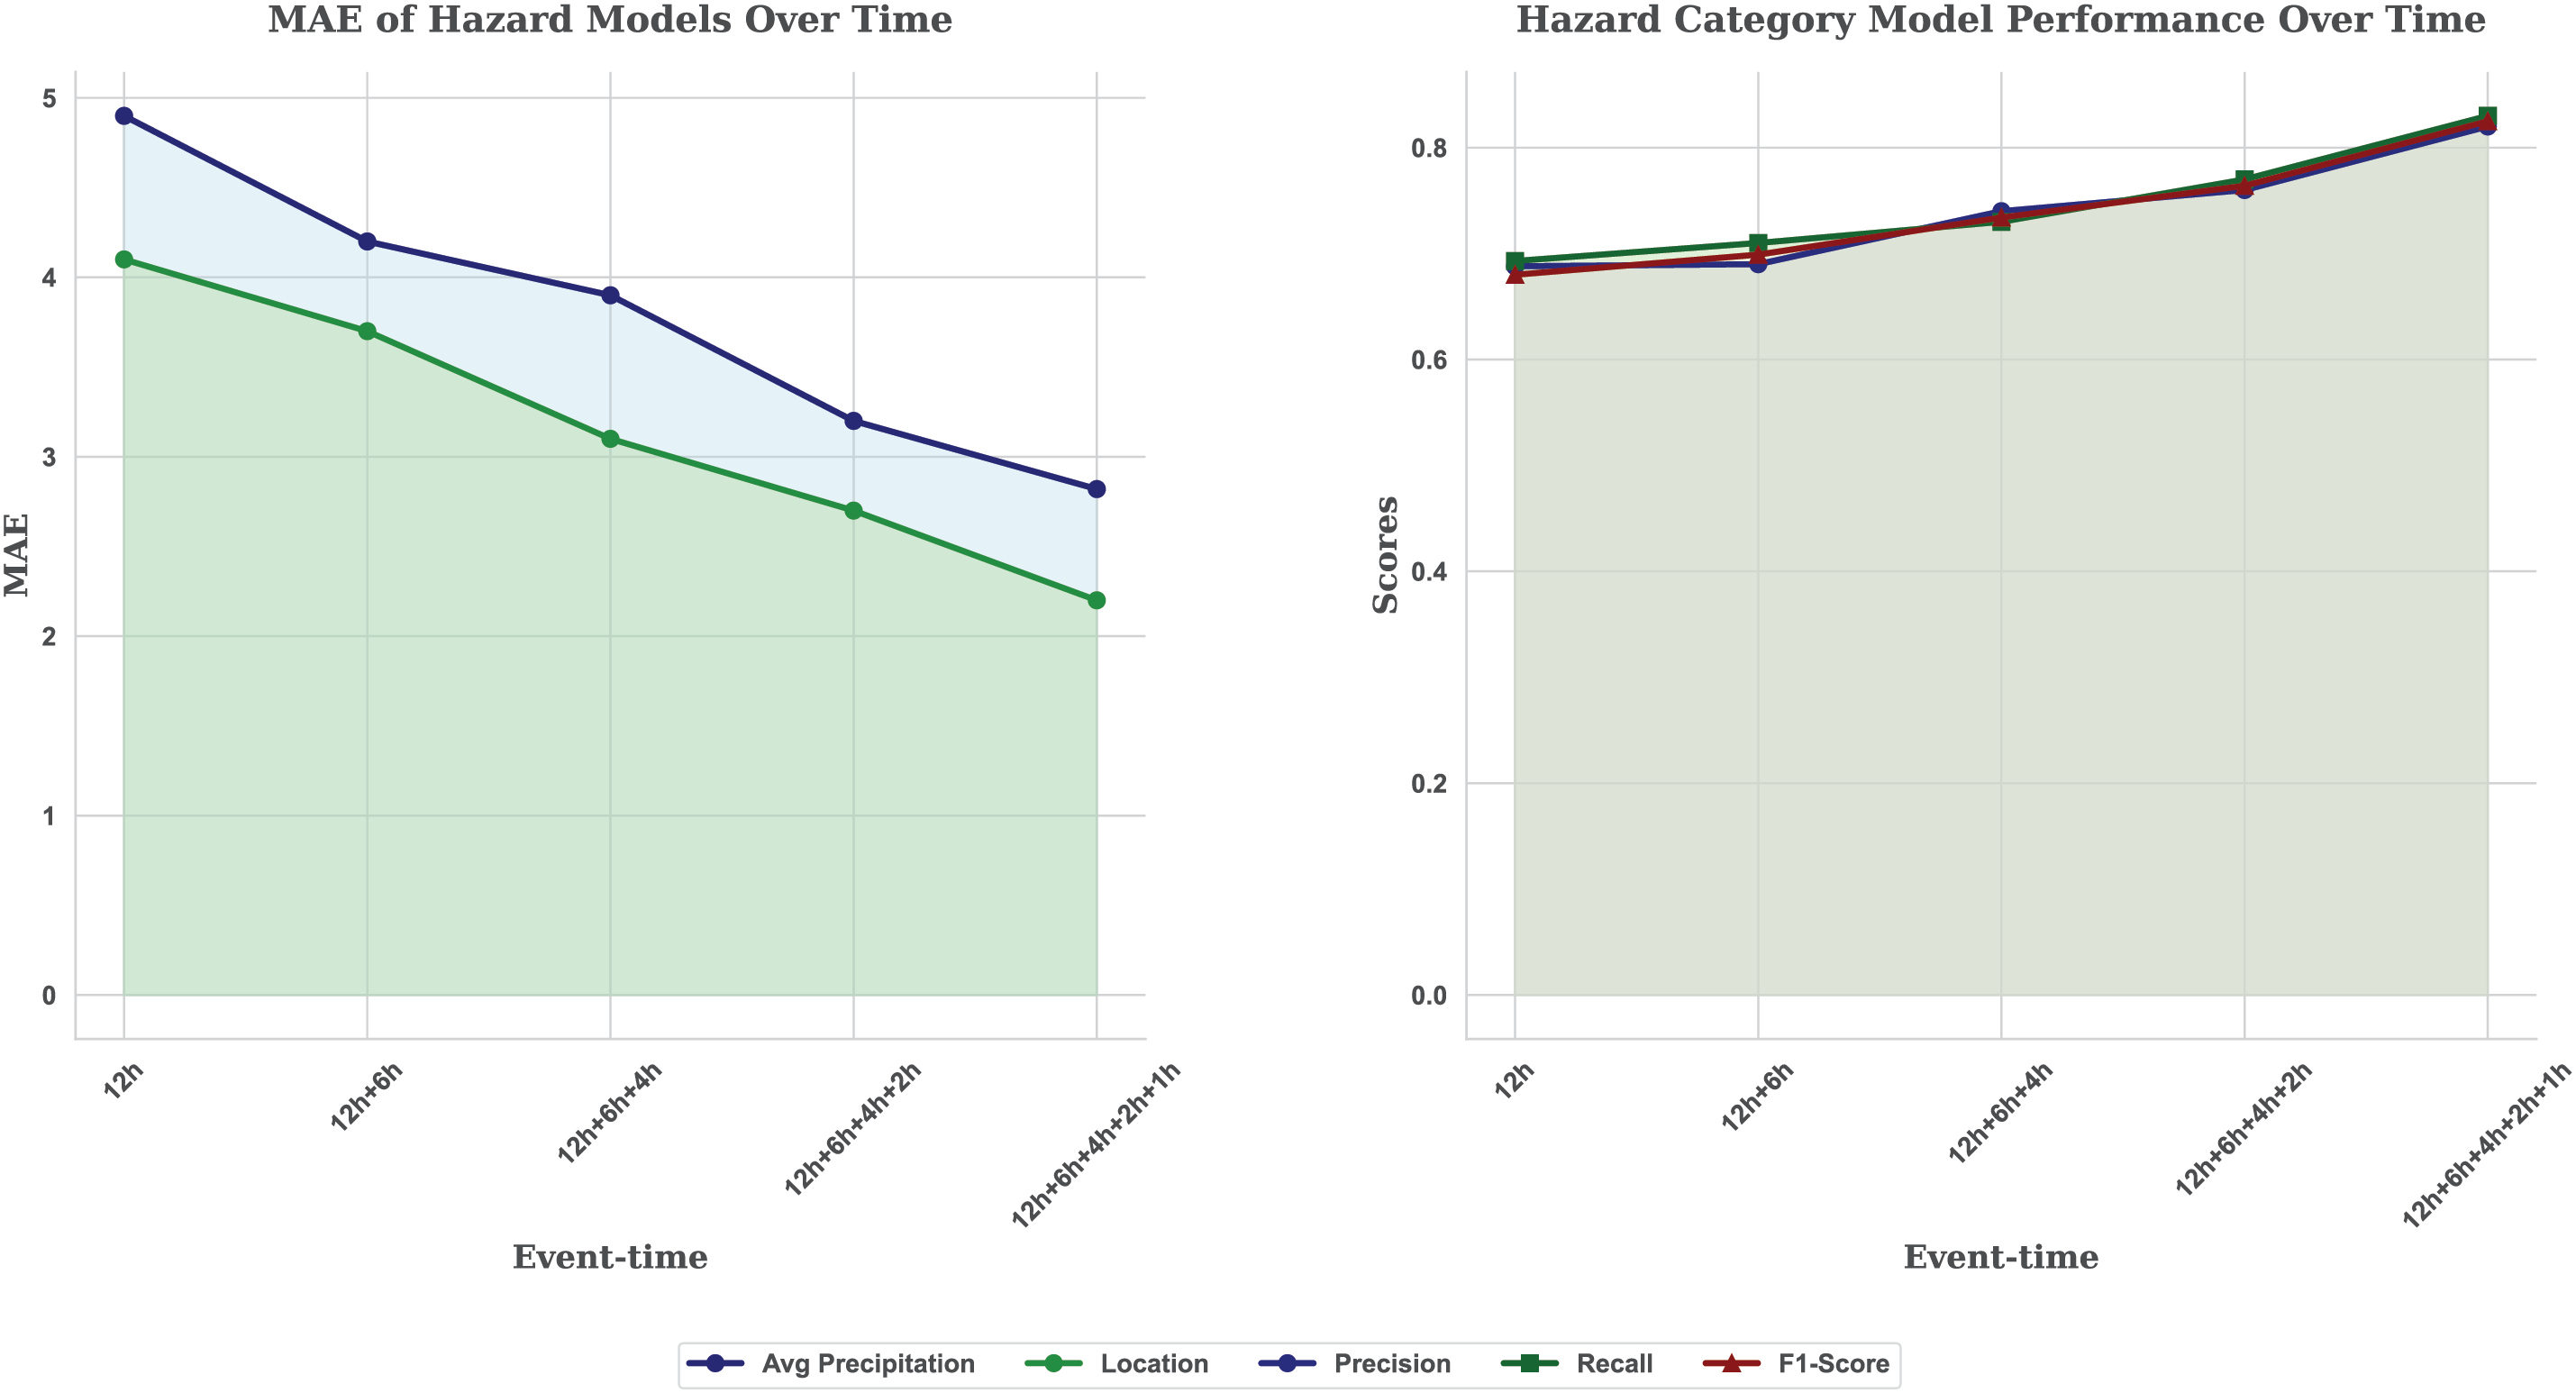
Figure 2: Comparative analysis for hazard location, average precipitation and hazard category prediction models over time
It can be observed from Table 1 column (Hazard Category) that there is a gradual increase in Precision, Recall, and F1-Score from a timestamp of 12 h before the event to the timestamp of 1 h prior to the event. The Precision and Recall of the model rose from around 0.69 to 0.83, and the F1-Score rose from 0.68 to 0.825, indicating a noticeable increase in both accuracy and the average of precision and recall values as event time distance is reduced as shown in Fig. 2.
4.1.2 Impact of the Fuzzy Integral
As shown in the results in Table 2, the application of fuzzy integral-based feature importance to the predictive model has a significant effect. Fuzzy integrals reduce the MAE of the Location model by 8.18% and improve
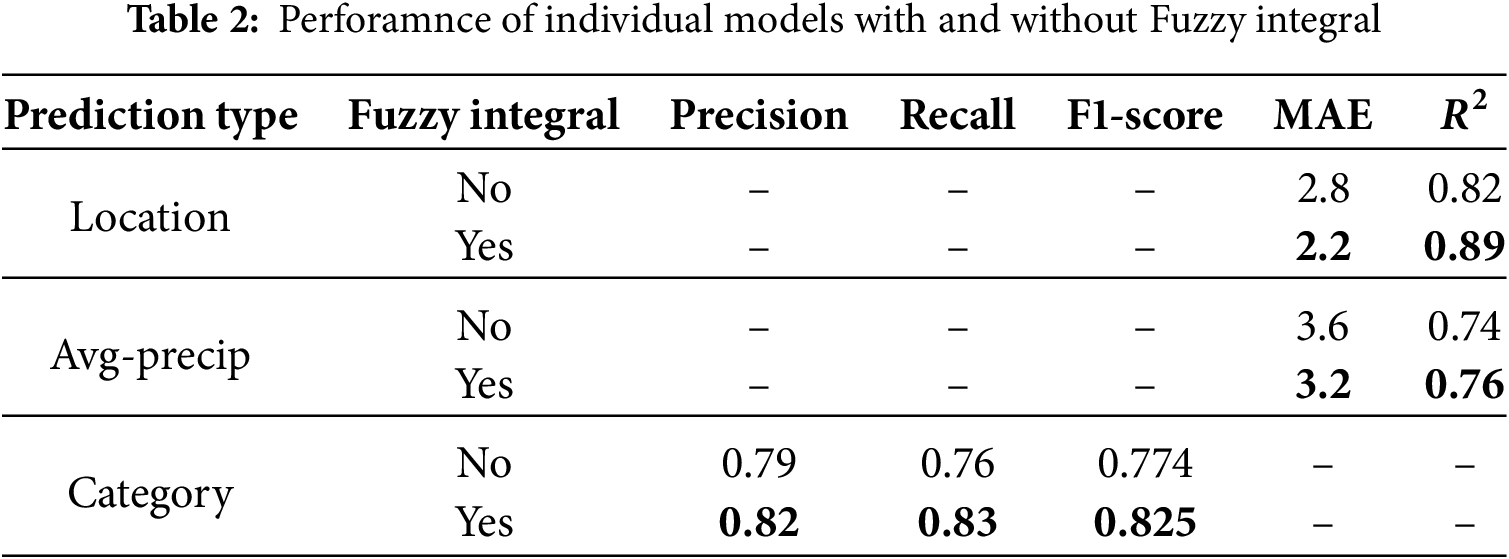
Improvements were observed across all classification metrics (Precision, Recall, and F1-Score) for the Category model, with an increase in the F1-Score from 0.774 to 0.825, representing a 6.37% improvement. These results demonstrate that fuzzy integral techniques are effective in improving model performance by prioritizing more important features, thereby enhancing the predictive capabilities of multi-hazard warning systems.
4.1.3 Performance of LSTM Model
Table 3 shows comparative performance analysis across different predictive models highlights LSTM’s superior capability, particularly in terms of prediction accuracy for multi-hazard scenarios. LSTM is the best model for location prediction, achieving an MAE of 2.2 and
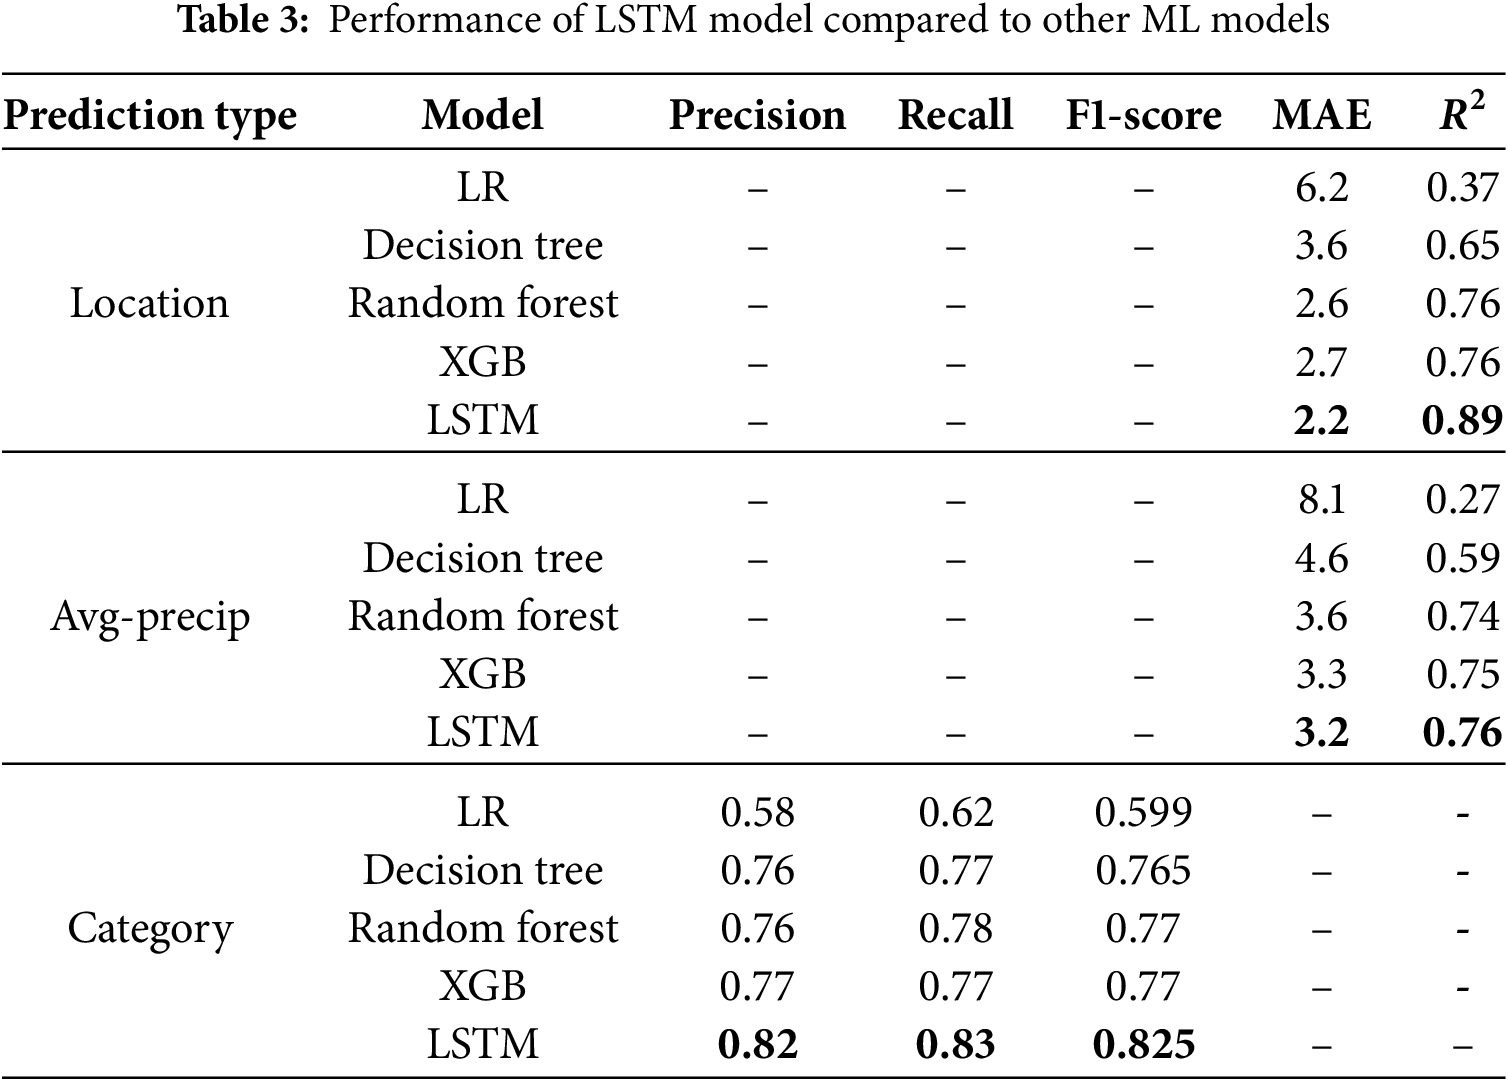
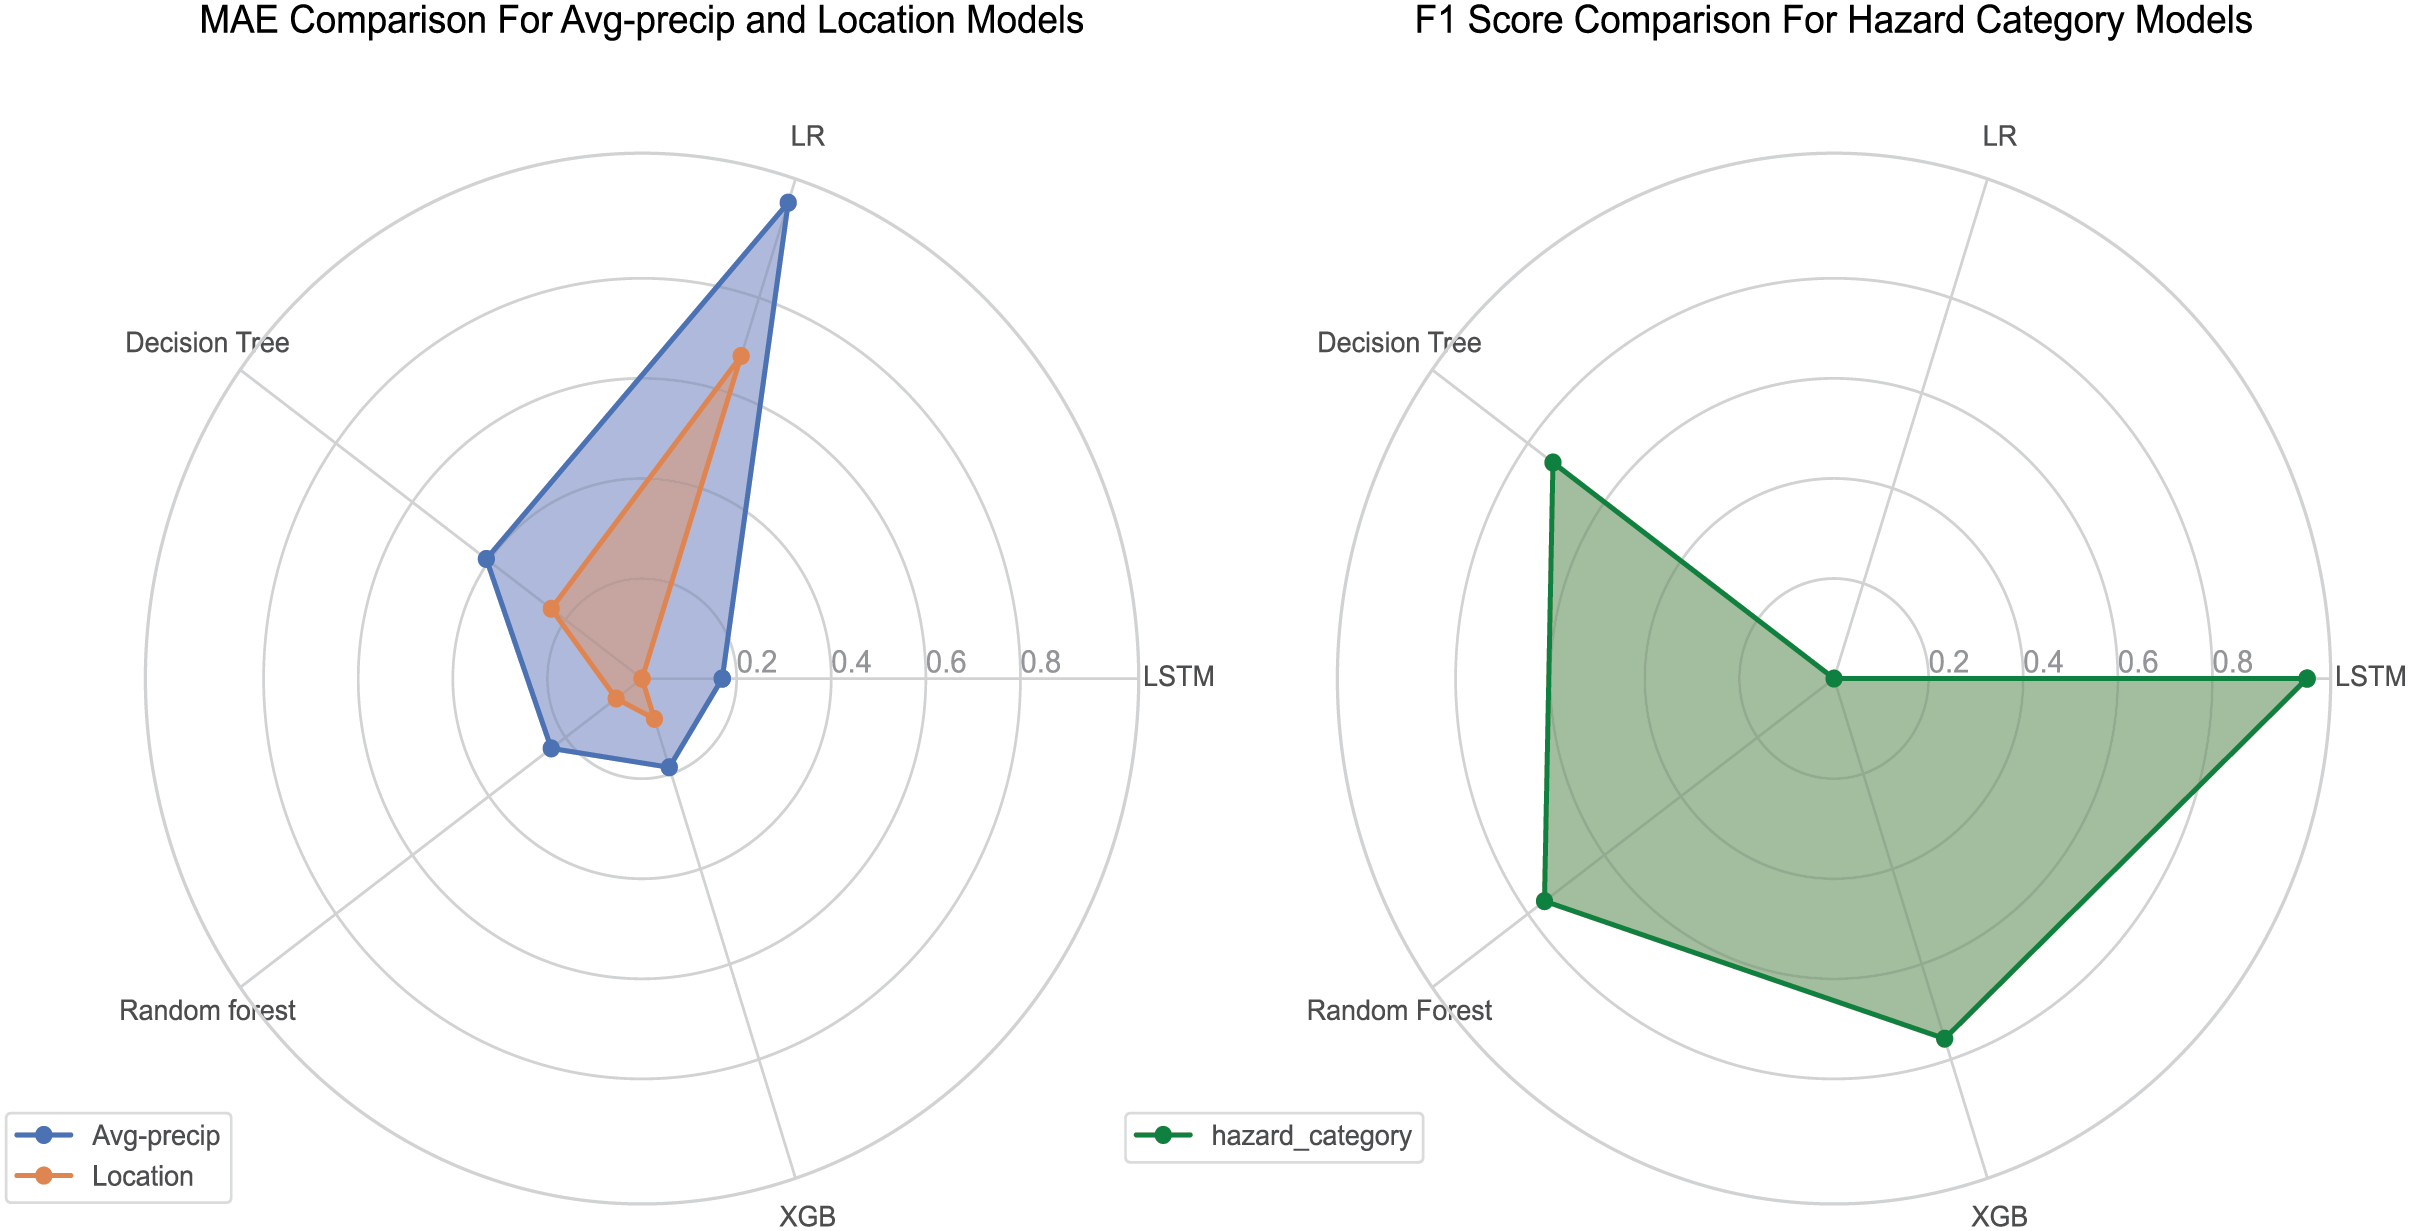
Figure 3: Radar charts comparing MAE and F1 score across ML models for location and average precipitation predictions
To evaluate the process of the multi-hazard warning using the individual models, a real-time example is used to describe the process. The performance of the individual models is analyzed based on the hazard id: 8133. This hazard occurred on OR 47, milepost 86.8, USA, at 12/7/2015 20:38, having actual latitude and longitude [45.5664, –123.10631], respectively. For this hazard event, first analyze the prediction of the
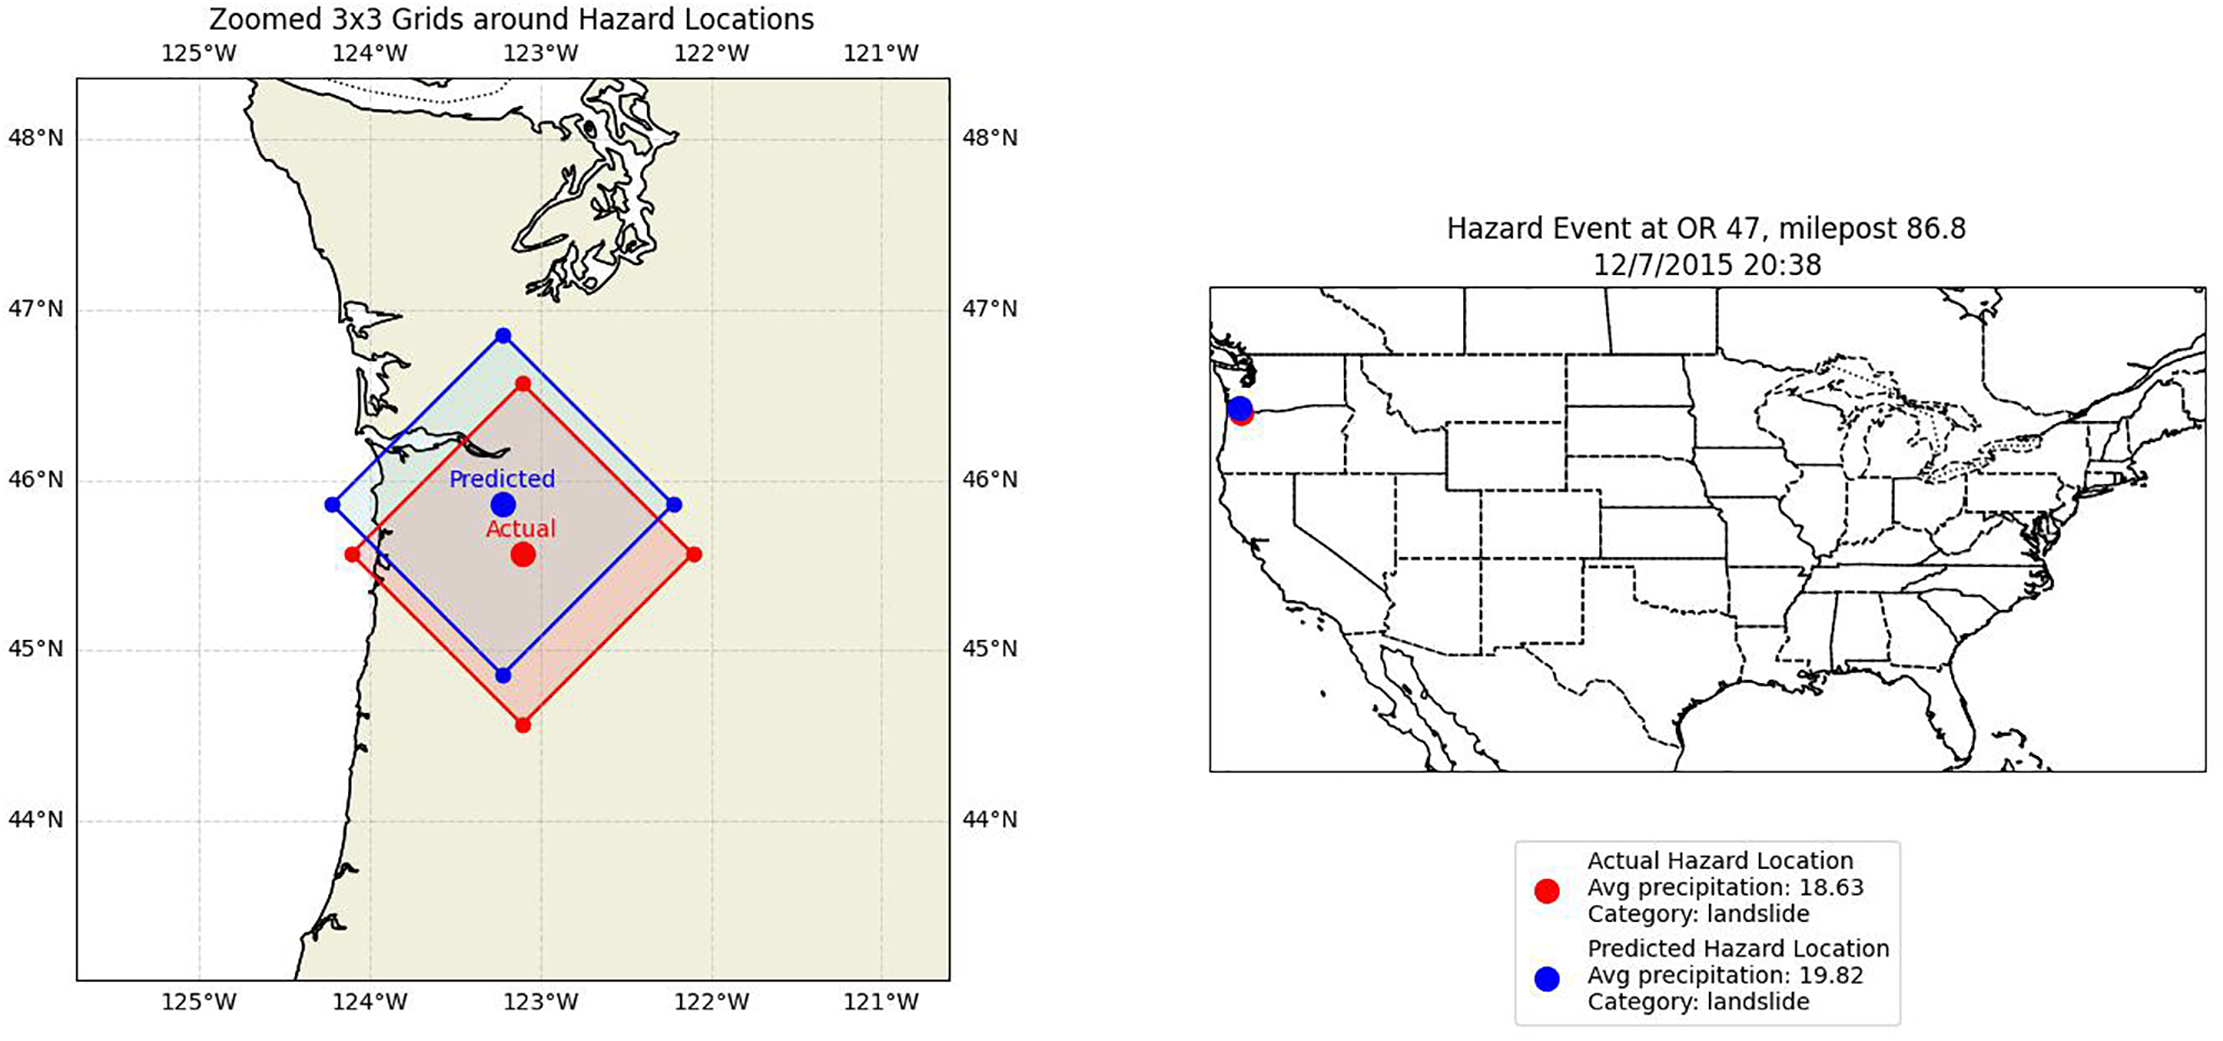
Figure 4: Comparison of actual and predicted event centers within a 3 × 3 hazard risk grid
The scientific strength of this work is the scientific rationality of the judicious combination of LSTM networks and the Choquet fuzzy integral in addressing the spatial and temporal complexity of multi-hazard prediction. The features of LSTM models make them especially well-suited to task of discovering time-variation across meteorological and hazard data that is not readily understood by traditional models. The fuzzy integral, in the meantime, allows to robustly fuse features covering both the importance of an individual feature and the interaction between them, which makes the representation of the data more subtle. Such synergy strengthens the overall generalization performance of the model in diverse lead times and hazard type rendering steady better performance and increased trustworthiness of early warning results.
This study proposed a novel multi-source data fusion framework incorporating fuzzy integrals and LSTM-based predictive models for short-term multi-hazard warnings, targeting landslide and extreme precipitation prediction. The proposed approach demonstrated strong predictive performance, achieving an MAE of 2.2 and an
Acknowledgement: The authors extend their appreciation to the Princess Nourah bint Abdulrahman University Researchers Supporting Project, Princess Nourah bint Abdulrahman University, Riyadh, Saudi Arabia. Authors are also thankful to Prince Sultan University, Riyadh Saudi Arabia for support of Article Processing Charges (APC) for this publication.
Funding Statement: The Princess Nourah bint Abdulrahman University Researchers Supporting Project number (PNURSP2025R513), Princess Nourah bint Abdulrahman University, Riyadh, Saudi Arabia.
Author Contributions: The research design, methodology development, data analysis and writing the manuscript were made by Syeda Zoupash Zahra, who was the first and the main author. Writing of the literature review and assisting in data interpretation was Najia Saher. Experimental validation and technical editing were done by Malik Muhammad Saad Missen. Data curation and formal analysis was made by Rab Nawaz Bashir and Salma Idris. The validation process of research was perform by Tahani Jaser Alahmadi and Muhammad Inshal Khan. All authors reviewed the results and approved the final version of the manuscript.
Availability of Data and Materials: The experimental code and extracted data for this study are available at the following GitHub repository: Multi-hazard project repository https://github.com/chkalim/multi_hazard (accessed on 21 July 2025).
Ethics Approval: Not applicable.
Conflicts of Interest: The authors declare no conflicts of interest to report regarding the present study.
References
1. Wang J, He Z, Weng W. A review of the research into the relations between hazards in multi-hazard risk analysis. Nat Hazards. 2020;104(3):2003–26. doi:10.1007/s11069-020-04259-3. [Google Scholar] [CrossRef]
2. Roy T, Matsagar V. Multi-hazard analysis and design of structures: status and research trends. Struct Infrastruc Eng. 2023;19(6):845–74. doi:10.1080/15732479.2021.1987481. [Google Scholar] [CrossRef]
3. Cox DR. The theory of stochastic processes. Abingdon, UK: Routledge; 2017. [Google Scholar]
4. Zou KH, Tuncali K, Silverman SG. Correlation and simple linear regression. Radiology. 2003;227(3):617–28. doi:10.1148/radiol.2273011499. [Google Scholar] [PubMed] [CrossRef]
5. Devia GK, Ganasri BP, Dwarakish GS. A review on hydrological models. Aquatic Procedia. 2015;4(3):1001–7. doi:10.1016/j.aqpro.2015.02.126. [Google Scholar] [CrossRef]
6. Tilloy A, Malamud BD, Winter H, Joly-Laugel A. A review of quantification methodologies for multi-hazard interrelationships. Earth-Sci Rev. 2019;196(3–4):102881. doi:10.1016/j.earscirev.2019.102881. [Google Scholar] [CrossRef]
7. Latif S, Mustafa F. Copula-based multivariate flood probability construction: a review. Arab J Geosci. 2020;13(3):132. doi:10.1007/s12517-020-5077-6. [Google Scholar] [CrossRef]
8. Owolabi TA, Sajjad M. A global outlook on multi-hazard risk analysis: a systematic and scientometric review. Int J Disaster Risk Reduct. 2023;92(278):103727. doi:10.1016/j.ijdrr.2023.103727. [Google Scholar] [CrossRef]
9. Mir AA, çelebi FV, Rafique M, Hussain L, Almasoud AS, Alajmi M, et al. An improved imputation method for accurate prediction of imputed dataset based radon time series. IEEE Access. 2022;10(2):20590–601. doi:10.1109/access.2022.3151892. [Google Scholar] [CrossRef]
10. Gorsevski PV, Gessler PE, Foltz RB, Elliot WJ. Spatial prediction of landslide hazard using logistic regression and ROC analysis. Trans GIS. 2006;10(3):395–415. doi:10.1111/j.1467-9671.2006.01004.x. [Google Scholar] [CrossRef]
11. Lan M, Shao Y, Zhu J, Lo S, Ng ST. A hybrid copula-fragility approach for investigating the impact of hazard dependence on a process facility’s failure. Process Safe Environm Protect. 2021;149(6183):1017–30. doi:10.1016/j.psep.2021.03.014. [Google Scholar] [CrossRef]
12. Ghizzoni T, Roth G, Rudari R. Multivariate skew-t approach to the design of accumulation risk scenarios for the flooding hazard. Adv Water Resourc. 2010;33(10):1243–55. doi:10.1016/j.advwatres.2010.08.003. [Google Scholar] [CrossRef]
13. Cramer GM, Ford RA, Hall RL. Estimation of toxic hazard—a decision tree approach. Food and Cosmetics Toxicology. 1976;16(3):255–76. doi:10.1016/s0015-6264(76)80522-6. [Google Scholar] [PubMed] [CrossRef]
14. Hong H, Pradhan B, Xu C, Tien Bui D. Spatial prediction of landslide hazard at the Yihuang area (China) using two-class kernel logistic regression, alternating decision tree and support vector machines. CATENA. 2015;133:266–81. doi:10.1016/j.catena.2015.05.019. [Google Scholar] [CrossRef]
15. Kappes MS, Keiler M, von Elverfeldt K, Glade T. Challenges of analyzing multi-hazard risk: a review. Nat Hazards. 2012;64(2):1925–58. doi:10.1007/s11069-012-0294-2. [Google Scholar] [CrossRef]
16. Nashwan MS, Shahid S, Chung ES, Ahmed K, Song YH. Development of climate-based index for hydrologic hazard susceptibility. Sustainability. 2018;10(7):2182. doi:10.3390/su10072182. [Google Scholar] [CrossRef]
17. Mujahid N, ARMFSAARK Muhammad Mujahid. Large language model in healthcare for the prediction of genetic variants from unstructured text medicine data using natural language processing. Comput Mater Continua. 2025;84(1):1883–99. doi:10.32604/cmc.2025.063560. [Google Scholar] [CrossRef]
18. Ahmad Z, Mahmood T, Alam T, Rehman A, Saba T. Enhancing time series forecasting with an optimized binary gravitational search algorithm for echo state networks. IEEE Access. 2023;11:79466–79. doi:10.1109/access.2023.3292543. [Google Scholar] [CrossRef]
19. Ma K, Wang L, Long L, Peng Y, He G. Discrete element analysis of structural characteristics of stepped reinforced soil retaining wall. Geomat Natural Hazards Risk. 2020;11(1):1447–65. doi:10.1080/19475705.2020.1797907. [Google Scholar] [CrossRef]
20. Ma K, Wang H, Liao Z, Peng Y, Wang K. Precursor of microseismic energy and stress evolution induced by rockburst in coal mining: a case study from Xiashijie, Shannxi, China. Geomech Geophys Geo-Energy Geo-Resour. 2022;8(5):134. doi:10.1007/s40948-022-00435-w. [Google Scholar] [CrossRef]
21. Ghorbanzadeh O, Shahabi H, Crivellari A, Homayouni S, Blaschke T, Ghamisi P. Landslide detection using deep learning and object-based image analysis. Landslides. 2022;19(4):929–39. doi:10.1007/s10346-021-01843-x. [Google Scholar] [CrossRef]
22. Azmoon B, Biniyaz A, Liu Z, Sun Y. Image-data-driven slope stability analysis for preventing landslides using deep learning. IEEE Access. 2021;9:150623–36. doi:10.1109/access.2021.3123501. [Google Scholar] [CrossRef]
23. Mohan A, Singh AK, Kumar B, Dwivedi R. Review on remote sensing methods for landslide detection using machine and deep learning. Trans Emerg Telecomm Technol. 2021;32(7):e3998. doi:10.1002/ett.3998. [Google Scholar] [CrossRef]
24. Ali SA, Parvin F, Vojteková J, Costache R, Linh NTT, Pham QB, et al. GIS-based landslide susceptibility modeling: a comparison between fuzzy multi-criteria and machine learning algorithms. Geosci Front. 2021;12(2):857–76. doi:10.1016/j.gsf.2020.09.004. [Google Scholar] [CrossRef]
25. Pourghasemi HR, Gayen A, Edalat M, Zarafshar M, Tiefenbacher JP. Is multi-hazard mapping effective in assessing natural hazards and integrated watershed management? Geosci Front. 2020;11(4):1203–17. doi:10.1016/j.gsf.2019.10.008. [Google Scholar] [CrossRef]
26. Pourghasemi HR, Kariminejad N, Amiri M, Edalat M, Zarafshar M, Blaschke T, et al. Assessing and mapping multi-hazard risk susceptibility using a machine learning technique. Sci Rep. 2020;10(3203):1–11. doi:10.1038/s41598-020-60191-3. [Google Scholar] [PubMed] [CrossRef]
27. Juang CS, Stanley TA, Kirschbaum DB. Using citizen science to expand the global map of landslides: introducing the Cooperative Open Online Landslide Repository (COOLR). PLoS One. 2019;14(7):e0218657. doi:10.1371/journal.pone.0218657. [Google Scholar] [PubMed] [CrossRef]
28. Precipitation monthly and daily gridded data from 1979 to present derived from satellite measurements; 2021 [Internet]. [cited 2024 Dec 30]. Available from: https://cds.climate.copernicus.eu/datasets/satellite-precipitation?tab=overview. [Google Scholar]
29. Hersbach H, Bell B, Berrisford P, Hirahara S, Horányi A, Muñoz-Sabater J, et al. The ERA5 global reanalysis. Quart Je Royal Meteorolog Soc. 2020;146(730):1999–2049. [Google Scholar]
30. Raoult B, Bergeron C, Alós AL, Thépaut JN, Dee D. Climate service develops user-friendly data store. ECMWF Newslett. 2017;151:22–7. [Google Scholar]
Cite This Article
 Copyright © 2025 The Author(s). Published by Tech Science Press.
This work is licensed under a Creative Commons Attribution 4.0 International License , which permits unrestricted use, distribution, and reproduction in any medium, provided the original work is properly cited.
 Downloads
 Citation Tools