
 Submit a Paper
 Propose a Special lssue
 Open Access
ARTICLE

Thermodynamics Calculation of Reaction Synthesis Pathways for Ag-Al2O3 Powder By First-Principles Calculations
1 Faculty of Material Science and Engineering, Kunming University of Science and Technology, Kunming, 650093, China
2 School of Physics and Photoelectronic Engineering, Ludong University, Yantai, 264025, China
* Corresponding Author: Jie Yu. Email:
(This article belongs to the Special Issue: Advances in Computational Materials Science: Focusing on Atomic-Scale Simulations and AI-Driven Innovations)
Computers, Materials & Continua 2025, 85(3), 4473-4489. https://doi.org/10.32604/cmc.2025.067722
Received 10 May 2025; Accepted 27 August 2025; Issue published 23 October 2025
 View Full Text
 Download PDF
Abstract
Ag/Al2O3 powders are highly effective catalytic materials utilized in the epoxidation of ethylene to produce ethylene oxide. One of the critical challenges in this catalytic process is the stability of nano-sized Ag particles, especially during high-temperature catalysis. However, this issue can be effectively addressed through in-situ reaction synthesis. To gain a deeper understanding of the underlying mechanisms, the phase transformation process and the thermodynamic mechanism of the oxidation reaction in the Ag/Al2O3 system have been investigated using first-principles thermodynamic calculations in conjunction with traditional thermodynamic data. These calculations, whose accuracy has been verified, provide valuable insights into the behavior of Ag and Al under different conditions. The results indicate that, during AgAl solid-solution oxidation, Ag-containing Al preferentially forms the stable intermediate phase Ag2Al instead of undergoing direct oxidation; this pathway becomes thermodynamically more favorable at higher Ag concentrations. With increasing temperature, Ag2Al is further oxidized to yield Ag and Al2O3. It is also found that above 237°C, Ag2O and AgAlO2 become unstable. The overall reaction pathway is solid solution→Ag2Al→Ag + Al2O3. This comprehensive study provides a robust theoretical calculation basis for the development and optimization of in-situ reaction-synthesized Ag/Al2O3 powder composite materials, which have significant potential for practical applications in catalysis.Keywords
Supplementary Material
Supplementary Material FileThe catalytic reaction for the epoxidation of ethylene to produce ethylene oxide (EO) is highly exothermic, with reaction temperatures reaching 200°C–300°C. If deep oxidation occurs, the heat released is ten times that of EO production. Nano-sized Ag, with its high specific surface energy, can significantly enhance the activity and selectivity in catalytic processes. However, maintaining its stability at such high reaction temperatures is challenging [1]. Industrially, catalysts used for the production of EO and propylene oxide (PO) (prepared by the direct oxidation of ethylene and propylene) have to typically produced by impregnating α-Al2O3 with Ag particles larger than 200 nm with the impregnation method [2]. In-situ reaction synthesis is an effective means of solving the problem of the combination of nano-phases with the matrix. The short diffusion path of the solute is the main theoretical basis for inhibiting the growth of nano-phases generated by in-situ reactions. However, in-situ reaction synthesis involves phase transformations, diffusion, volume expansion, and the interconversion of various phases within a solid-solid reaction system. These factors have always been the bottleneck in the development of in-situ reaction synthesis technology. In particular, during the reaction process, thermodynamic data handbooks are only used to provide thermodynamic data for certain specific substances with accurate stoichiometric ratios. Data for alloy solid solutions, intermediate phases with a certain range of solute concentrations, and some compounds are missing. No thermodynamic calculations can be carried out in the absence of accurate thermodynamic data. The thermodynamic stability of materials is used as a key indicator to evaluate their synthetic feasibility and potential for practical application. It is widely recognized that the Gibbs free energy change (ΔG), heat of formation, and enthalpy of formation (ΔHf) are used for quantitative evaluation. Specifically, according to the second law of thermodynamics, a negative ΔG indicates that a material can form spontaneously under specific conditions, and the larger its absolute value, the stronger the thermodynamic driving force for crystal formation. On the other hand, the energy stability of a compound relative to its constituent elements, as indicated by a negative ΔHf value, is further revealed, providing an important basis for predicting the material’s resistance to decomposition. In recent years, thermodynamic parameter analysis based on first-principles calculations has become a core means for designing new functional materials (such as MAX phases and intermetallic compounds). By quantifying energy differences, the high cost of traditional experimental screening is avoided and the development of high-performance materials is significantly accelerated [3]. For example, in the field of MAX phases and their derived materials, researchers have systematically calculated ΔG and ΔHf to reveal the structure–property relationship between composition and stability. Moreover, Yang et al. [4] found through density functional theory (DFT) calculations that the negative ΔG and ΔHf values of TM3AlC2 (TM = Ti, Zr, Hf) are highly consistent with their synthetic experimental data, confirming the intrinsic thermodynamic stability of these materials. It should be noted that conventional DFT calculations have certain limitations in dealing with long-range dispersion interactions. To more accurately describe the electronic structure and thermodynamic stability of materials, researchers have introduced van der Waals (vdW) dispersion corrections, such as vdW-DF or DFT-D [5]. These corrections consider long-range interactions like van der Waals forces, which can more precisely simulate the binding energies and thermodynamic properties of materials, thereby enhancing the reliability of the computational results. Similarly, Li et al. [6] and Chen et al. [7] respectively investigated the ΔHf of the TM5Si3C (TM = Ti, Cr, Y) and TM2Si2Ys (TM = Cr, Fe, Co, Ni) systems, revealing the regulatory mechanisms of transition metal electronic structure on the thermodynamic stability of silicocarbon compounds. Pan et al. [8] elucidated the influence of metal atom radius on the stability of layered carbides by comparing the formation enthalpy differences of M2AlC (M = Cr, Mo, W). Furthermore, Sun et al. [9] demonstrated through binding energy and ΔHf calculations that V/Nb doping can significantly enhance the high-temperature stability of TM5Si3B alloys. Poulou et al. [10] also verified the potential advantages of CaM2Al20 intermetallic compounds as lightweight structural materials through formation enthalpy analysis. Ma et al. [11] explored the origin of elastic anisotropy of silica particles by combining first principles calculations and molecular dynamics (MD) simulations, which can more accurately describe the electronic structure of materials and predict their mechanical behavior. Mortazavi et al. [12] explored the stability, mechanical properties, lattice thermal conductivity, piezoelectric and flexural-electric responses, as well as photocatalytic and electronic properties of single-layer MA2Z4 (M = Cr, Mo, W; A = Si, Ge; Z = N, P) via first-principles simulations. For the first time, they demonstrated that machine learning interatomic potentials trained on small supercells can be used to examine the flexoelectric and piezoelectric properties of complex structures.
Starting from the Ag-Al alloy phase diagram (Fig. S1) [13,14], this paper explores the transformation pathways of various phases of the alloy solid solution during external oxidation. With the reactants and products serving as the starting point, various possible reaction processes are established for thermodynamic studies. The reaction Gibbs free energy (ΔrG) calculations are used to determine or exclude the reactions of various phases with O under heating conditions, the interconversion between intermediate phases and elemental Ag, and the stability of phases, among other thermodynamic mechanisms of the reactions. This has important guiding significance for determining the reaction pathways in the preparation process of solid-phase reactions.
2 Model Construction and Calculation Method
During the reaction synthesis process for preparing nano-sized Ag/Al2O3 powder composite materials, the supersaturated Ag–Al solid solution reacts with external O2 to precipitate elemental Ag while simultaneously forming Al2O3. Given the involvement of O in the reaction, the formation of Ag–Al–O ternary phases and their stable existence temperature ranges, the existence and stability of Ag–Al intermediate phases, and the transformation relationships between binary and ternary phases are all encompassed in this process. Based on phase diagram analysis, the phases that may appear during the reaction include Ag, Ag2Al, AgAlO2, Ag2O, and Al2O3. Models for each of these phases were established, and their thermodynamic parameters were calculated. Evaluate the feasibility of the reaction by considering the Gibbs free energy and corresponding thermodynamic parameters.
2.1 Elementary Model Construction
The space group of Ag and Al is FM-3M. The lattice parameters of Ag [15] are: a = b = c = 0.40857 nm, α = β = γ = 90°; those of Al [16] are: a = b = c = 0.40495 nm, α = β = γ = 90° (obtained from the Materials Studio model structure library). The model structures are shown in Fig. 1.
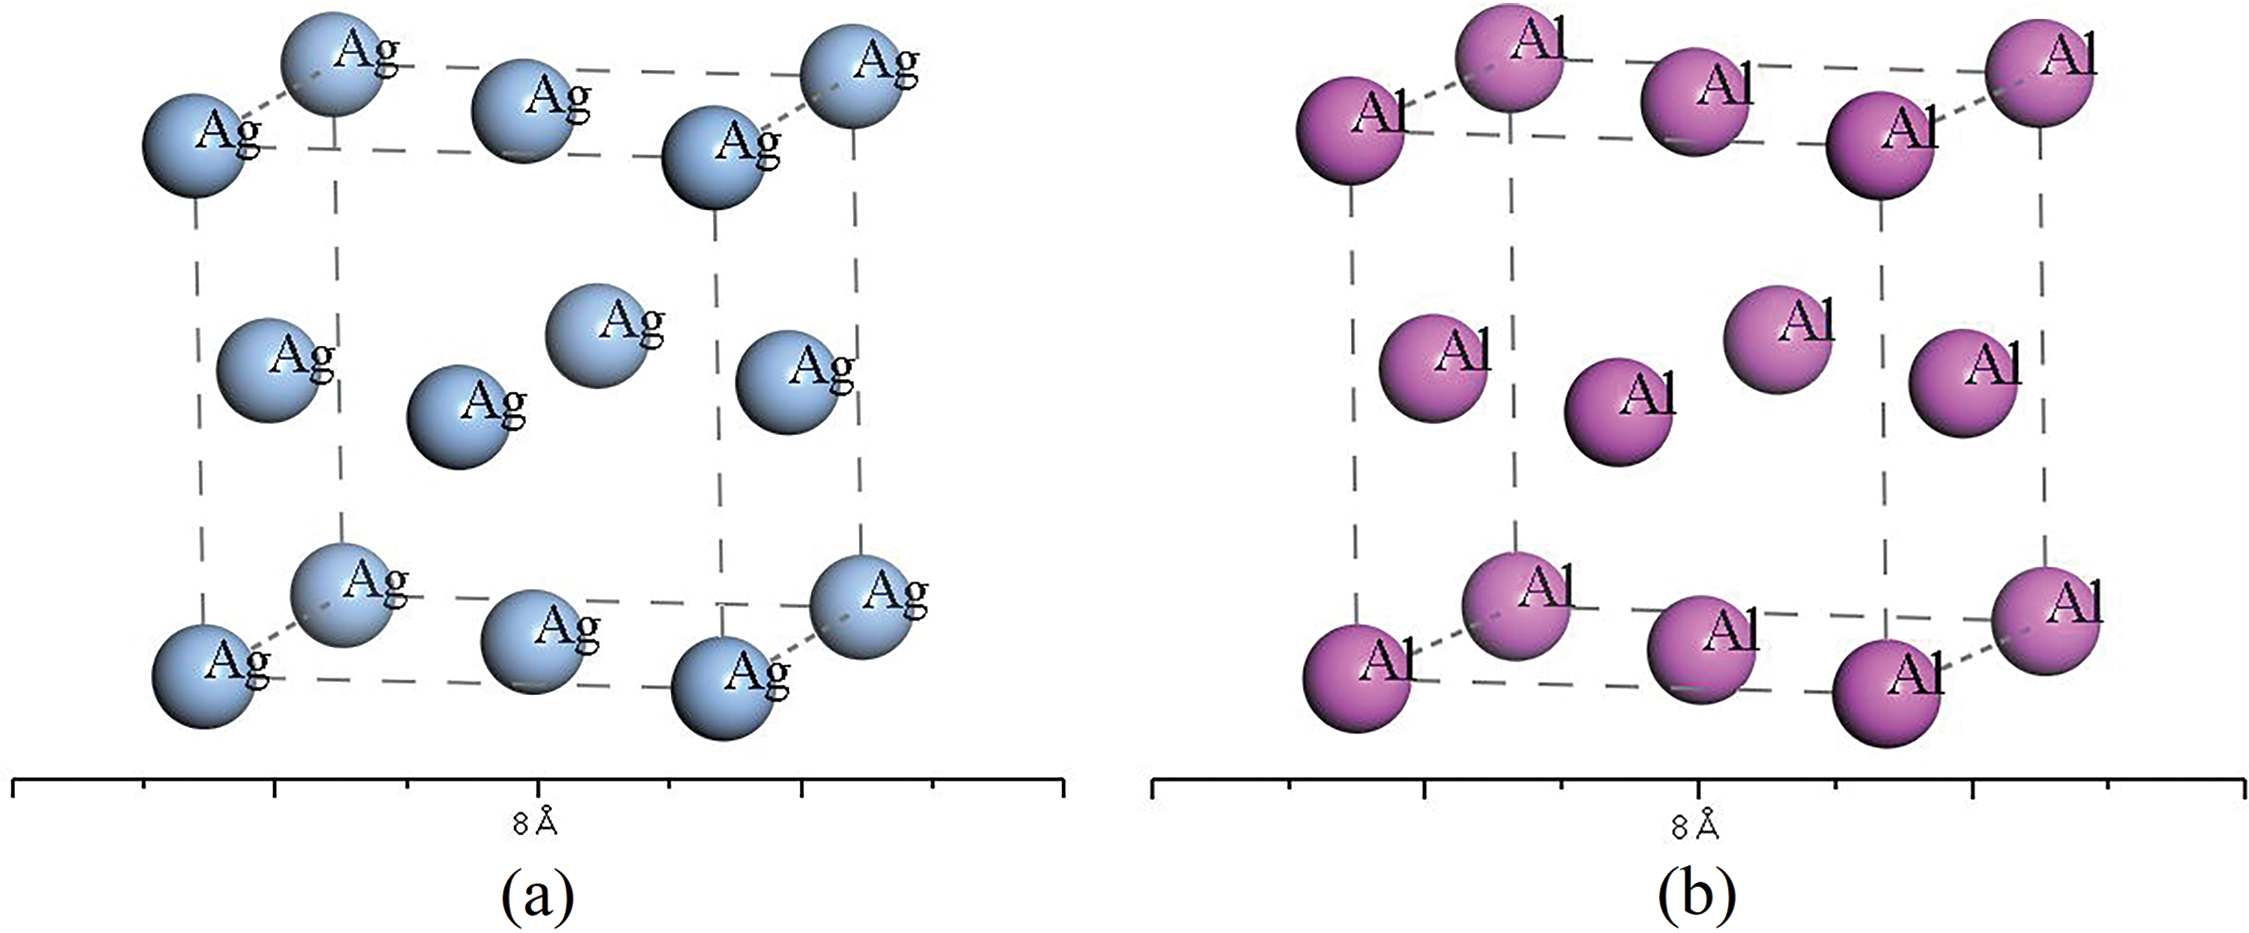
Figure 1: Crystal structure models (a) Ag, (b) Al
Ag2O crystallizes in the cubic system with a space group of PN3-MS. Its lattice parameters [17] are: a = b = c = 0.4720 nm, α = β = γ = 90°. The model is shown in Fig. 2a.
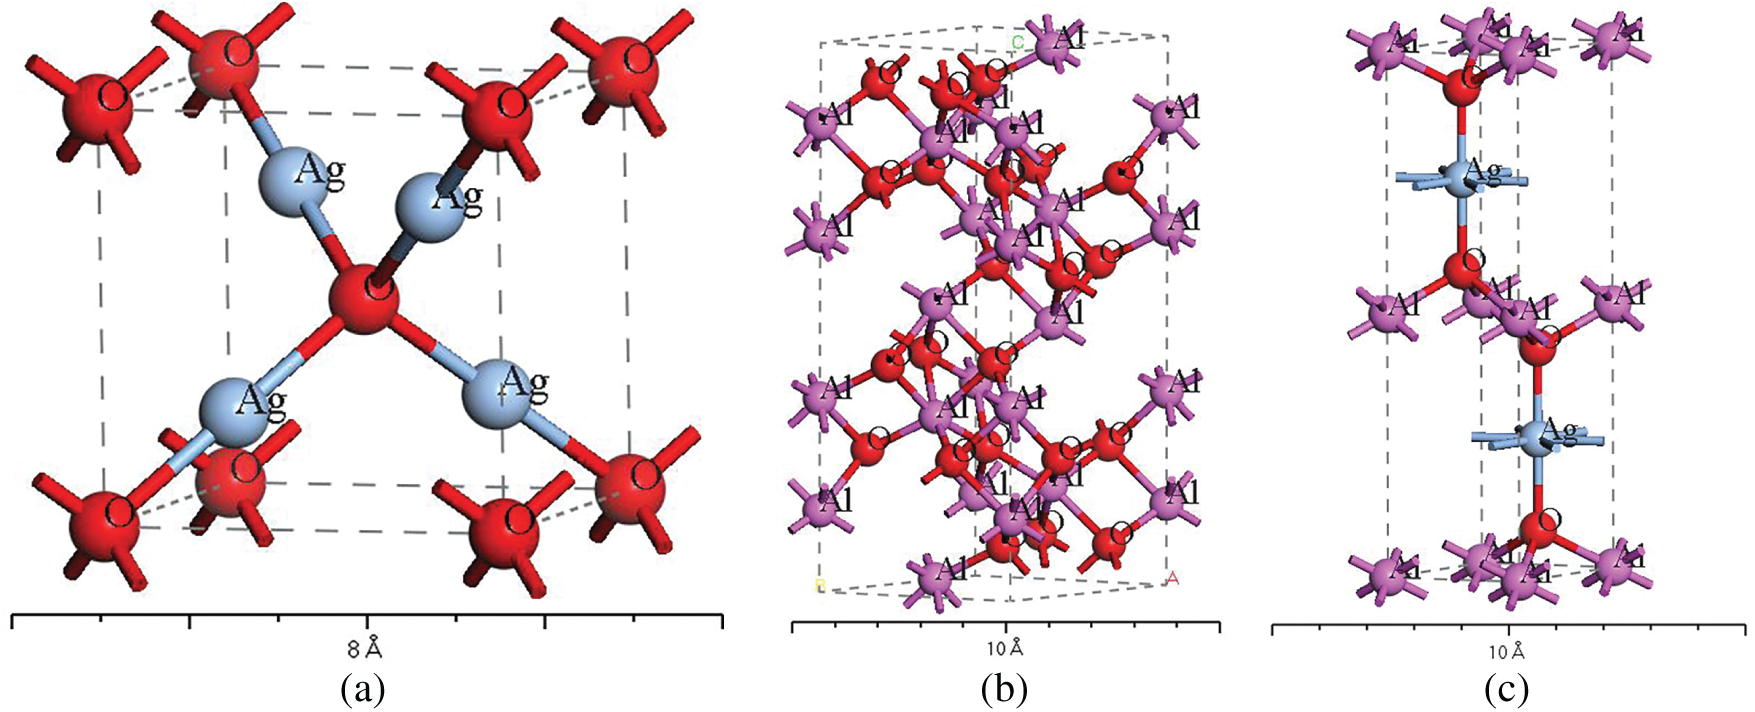
Figure 2: Crystal structure models (a) Ag2O, (b) Al2O3, (c) AgAlO2
Al2O3 exhibits multiple crystal structures. The thermodynamically stable structure, which is also the most common, is corundum [18], namely α-Al2O3. The corundum structure is the Al2O3 involved in this study. Its space group is R3-CH, and the lattice parameters [19] are: a = b = 0.4759 nm, c = 1.2991 nm, α = β = 90°, γ = 120°. The model structure is shown in Fig. 2b.
The common phase of the Ag-Al-O ternary system is AgAlO2. AgAlO2 exists in two structures, hexagonal and orthorhombic crystal structures. The orthorhombic structure differs significantly from the phase structure in the system of this study, and it is less likely to appear from an energetic perspective. Therefore, the hexagonal crystal structure is adopted. Its space group is P63/MMC, and the lattice parameters [20] are: a = b = 0.2896 nm, c = 1.2219 nm, α = β = 90°, γ = 120°. The atomic position coordinates are: Ag (0.3333, 0.6667, 0.2500), Al (0, 0, 0), O (0.3333, 0.6667, 0.0765). The model structure is shown in Fig. 2c.
Ag2Al has a hexagonal close-packed (hcp) crystal structure. J. P. Neumann [21] analyzed the atomic positions in the structure of Ag2Al using X-ray scattering techniques. Therefore, the Neumann model is adopted in this study, as shown in Fig. 3. The crystal structure of Ag2Al is hcp (space group P63/mmc), with lattice parameters [22] a = b = 0.28779 nm, c = 4.6255 nm, α = β = 90°, γ = 120°. The stacking sequence of layers is ABAB.
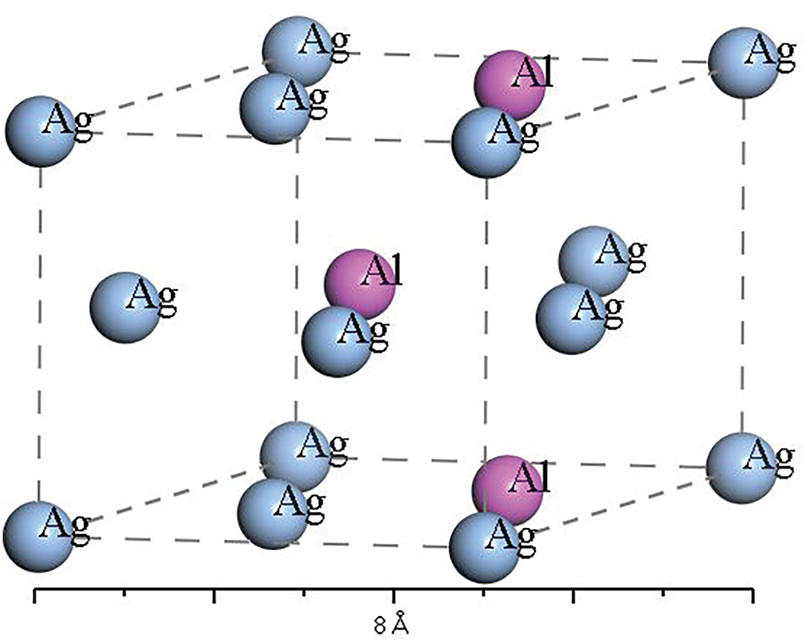
Figure 3: Ag2Al crystal structure
Due to the low solubility of Ag in Al, its solubility is approximately 2 at% when the temperature exceeds 350°C. Considering the number of atoms in the modeling process, the Ag content is set at 12.5 at%, 6.25 at%, 3.125 at%, and 2.083 at%, which correspond to the supersaturated and saturated regions in the phase diagram. Therefore, four solid solution models with different Ag contents are established using random substitution [23], namely 7Al-1Ag, 15Al-1Ag, 31Al-1Ag, and 47Al-1Ag. These models are shown in Fig. 4. The four established Al solid solution models containing Ag are listed as follows:

Figure 4: Al solid solution containing Ag atom structure model (a) 7Al-1Ag, (b) 15Al-1Ag, (c) 31Al-1Ag, (d) 47Al-1Ag
The computational precision was set to Ultra-fine, and the geometry optimization algorithm used was the BFGS algorithm. The convergence criteria for geometry optimization were as follows: the energy change per atom was no more than 5 × 10⁻² eV/atom, the maximum force was 0.01 eV/Å, the maximum stress was 0.02 GPa, and the atomic displacement change was no more than 5.0 × 10⁻⁴ Å. The exchange-correlation functional was chosen as the Perdew-Burke-Ernzerhof (PBE) functional within the Generalized Gradient Approximation (GGA). Norm-conserving pseudopotentials were used, with a plane-wave energy cutoff of 850.0 eV. The k-point spacing was set to 0.04 Å−1. The pseudopotentials were described in reciprocal space, and the SCF self-consistency cycle convergence precision was 5.0 × 10⁻⁷ eV/atom. According to the Ag-Al alloy phase diagram, phases such as Ag2Al and Ag-containing Al solid solutions do not exist above 1000 K. Therefore, when calculating thermodynamic properties, the upper temperature limit for the analysis of these materials was set at 1000 K.
3.1 Reliability Verification of Castep Calculation Results
The reliability of the simulation results was verified by comparing the calculated values with the curves obtained from the thermodynamic data handbook. As shown in Figs. 5 and 6, For Al2O3, the internal energy obtained from simulation has been proven to be lower than the enthalpy provided in the manual data, with a difference percentage of 1.4%, 2.3%, and 3.8% at 1200, 1600, and 2000 K, respectively. However, the simulated entropy has decreased compared to the reference entropy value, with a difference percentage of 1.9%, 3.2%, and 5.3% at 1200, 1600, and 2000 K, respectively. The Helmholtz free energy calculated through simulation has been determined to exceed the Gibbs free energy recorded in the standard thermodynamic manual, with a difference percentage of 0.7%, 0.96%, and 1.5% at 1200, 1600, and 2000 K, respectively; For Ag2O, the internal energy obtained from simulation is lower than the enthalpy provided in the manual data, with a difference percentage of 7.4%, 8.3%, and 10.2% at 300, 350, and 400 K, respectively. However, the simulated entropy has decreased compared to the reference entropy value, with a difference percentage of 0.45%, 0.87%, and 0.93% at 300, 350, and 400 K, respectively. The Helmholtz free energy calculated through simulation is determined to exceed the Gibbs free energy recorded in the standard thermodynamic manual, with a difference percentage of 8.9%, 9.7%, and 10.5% at 300, 350, and 400 K, respectively. These discrepancies arise because the thermodynamic data in the handbook are primarily based on experimental measurements, where the actual crystals contain several defects. Additionally, in the calculation of the phonon spectrum, the handbook uses the vibrational free energy, while CASTEP employs the quasi-harmonic approximation. The good agreement between the calculated results and the experimental values demonstrates that the data obtained from CASTEP are reliable and can be used as a basis for subsequent thermodynamic calculations.

Figure 5: Comparison of Al2O3 thermodynamic data between manual value and computer simulation (a) ΔU(or H)-Hf,298, T∙S, ΔG(or A)-Hf,298, (b) Cv(or p)

Figure 6: Comparison of Ag2O thermodynamic data between manual value and computer simulation (a) ΔU(or H)-Hf,298, T∙S, ΔG(or A)-Hf,298, (b) Cv(or p)
3.2 Calculation of Enthalpy of Formation of Each Phase and the Change of Enthalpy with Temperature
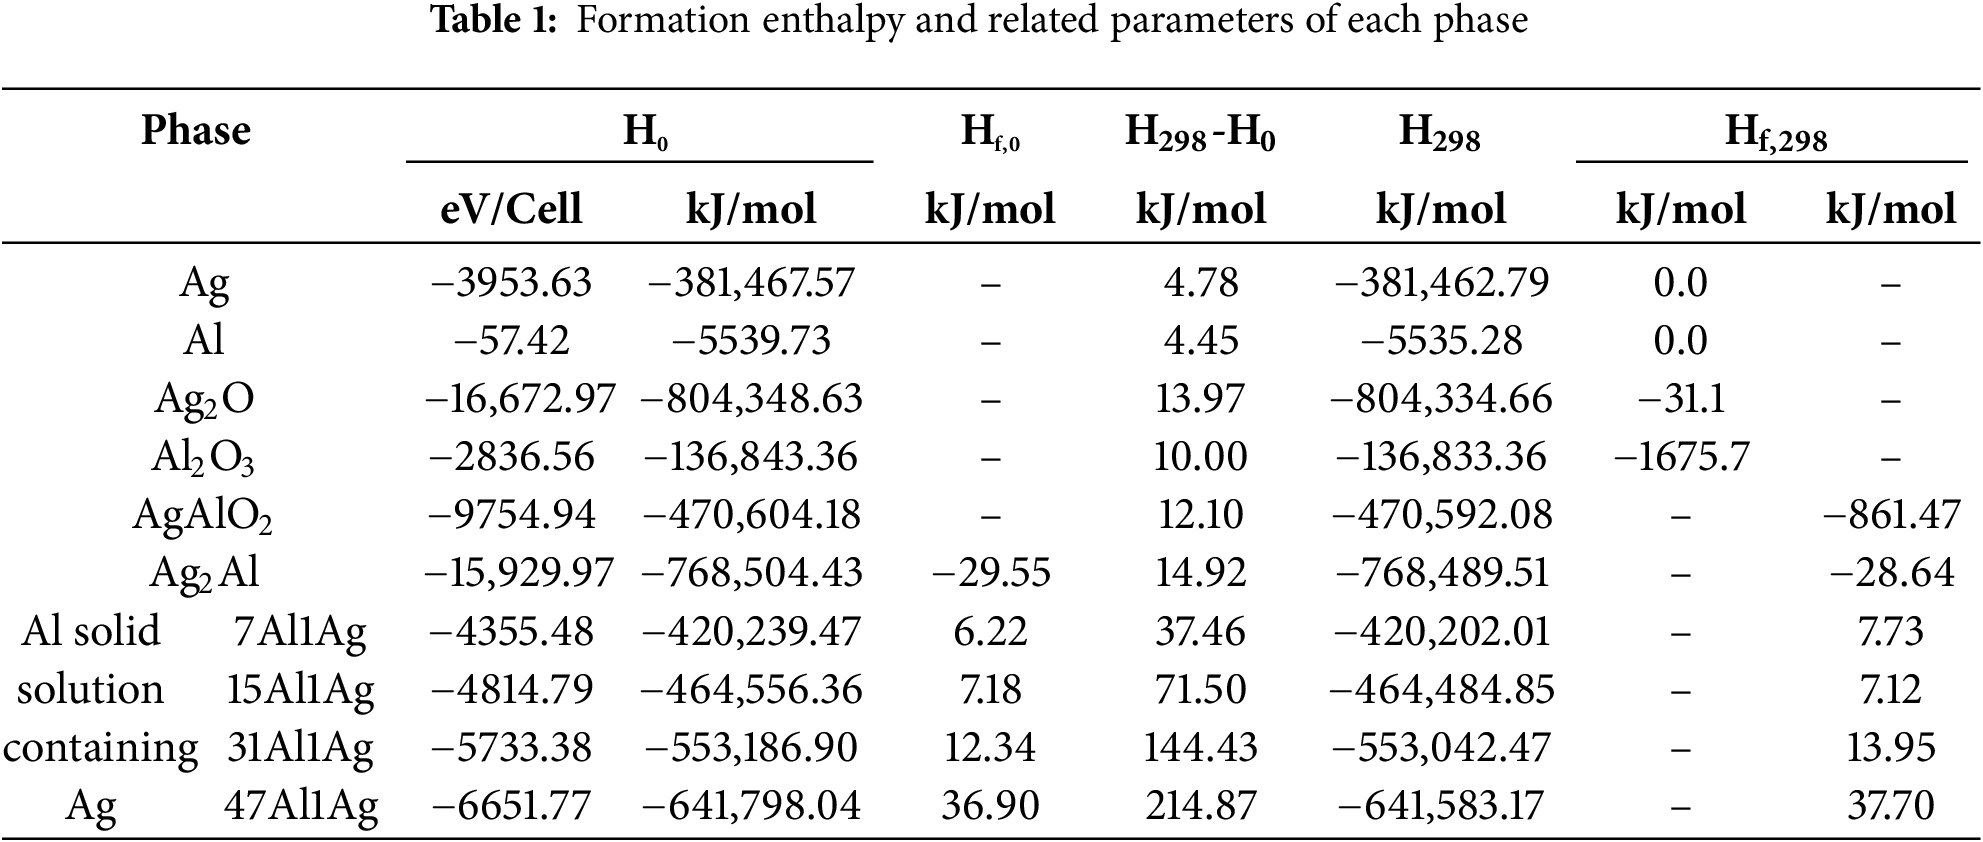
Table 1 lists the formation enthalpies and related computational parameters for each phase. The heat capacity integral terms and formation enthalpy data for the five common substances—Ag, Al, O2, Ag2O, and Al2O3—were obtained from the thermodynamic data handbook. The heat capacity integral terms and formation enthalpy data for Ag2Al, Ag-containing Al solid solutions, and AgAlO2 were obtained through CASTEP thermodynamic calculations. Since their formation reactions involve O2, and the absolute enthalpy values and heat capacity curves of gases cannot be calculated by the software, the formation enthalpy data for these reactions were obtained by adding and subtracting the other phases involved in the reaction process.
The enthalpy values of the relevant phases as a function of temperature are given in the form of curves, as shown in Fig. S2.
3.3 The Results of the Calculation of the Function of the Free Energy of Each Phase with Respect to Temperature
The Gibbs free energy of each substance as a function of temperature was obtained through thermodynamic calculations and plotted, as shown in Fig. S3a and Fig. S3b presents the Helmholtz free energy derived from existing thermodynamic data handbooks, while Fig. S3c to f was obtained directly from phonon spectrum calculations using CASTEP.
As shown in Fig. S3, direct comparison of the absolute energies between different substances is considered invalid due to the variation in atom numbers contained in each compound.However, valuable insights can be obtained through comparison of energies between similar substances.For solid solutions, as the Ag content decreases, the stability increases, which is consistent with expectations. To compare the stability of different substances through energy, the calculated energy must be normalized by the number of atoms n. Specifically. The average relative Helmholtz free energy (ΔAa, ΔGa) is defined as:
In terms of energy, the stability between the different phases in Fig. 7 is Al2O3 > AgAlO2 > Ag2O; Ag2Al > Ag-containing Al solid solution.

Figure 7: The change of average Gibbs and Helmholtz free energy (ΔGa,ΔAa) with temperature (a) Al2O3, Ag2O, AgAlO2, (b) Ag2Al, Ag soluted in Al
3.4 Calculation and Analysis of Free Energy of Reaction Formation
The feasibility of the reaction equations in the text is established through systematic evaluation of both the absolute values and algebraic signs of their corresponding thermodynamic driving forces, through which the reaction spontaneity is assessed and the preferential sequence is determined, thus enabling the transformation pathway to be conclusively identified. The calculation of reaction free energy (ΔGr orΔAr) is performed based on the relative free energies of the phases involved, according to the following formulas. The calculation process is shown in the Supporting Information (SI). The fitting results of the relative free energy functions of each phase as a function of temperature in reaction Fig. S3 of Table S1.
3.4.1 Conditions for Formation of Ag2O Reaction
The reaction Gibbs free energy of Eq. (3) as a function of temperature was computed using the approach described in the Supporting Information (SI), with the resulting data being fitted to the corresponding curve as demonstrated in Fig. 8. From Fig. 8, it is observed that when the temperature exceeds 472.8 K, the reaction Gibbs free energy is converted to positive values, suggesting that spontaneous progression of the reaction is prohibited. In other words, from a thermodynamic perspective, the decomposition temperature of Ag2O is 472.8 K, which is close to the value reported in the literature [17]. This suggests that the simulation results are relatively accurate. Therefore, reaction 3 does not exist at temperatures above 200°C.
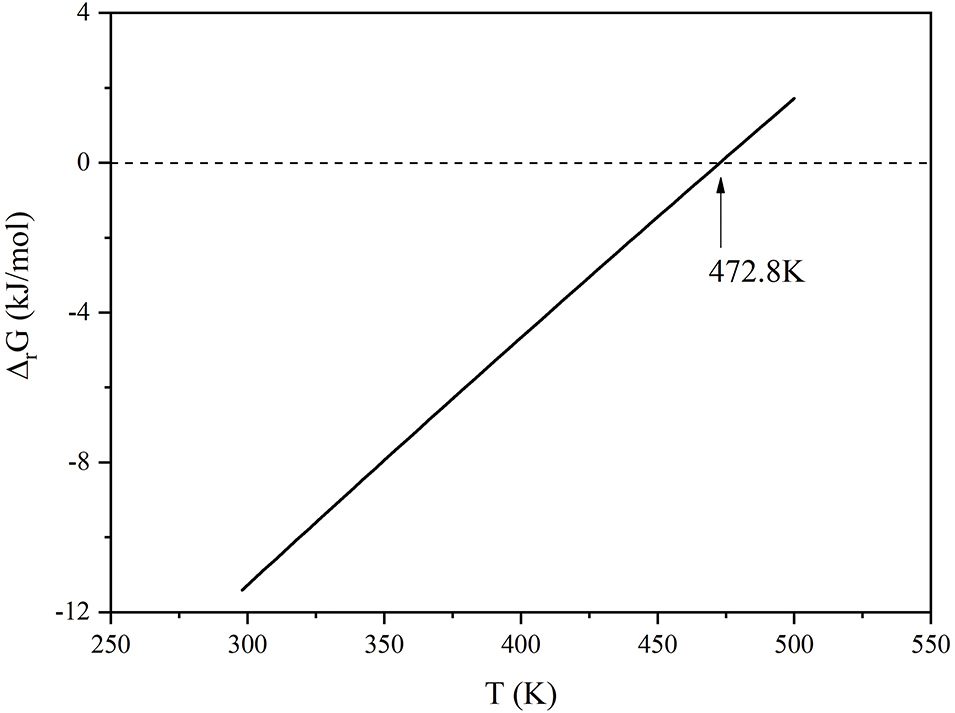
Figure 8: The change of Gibbs free energy (ΔrG) with temperature in the reaction 3
3.4.2 Formation Conditions of Ternary Phase AgAlO2 Thermodynamic Reaction
The Ag-Al-O system comprises a variety of phases, with the most common being the hexagonal structure of AgAlO2. Other ternary phases belong to lower crystallographic systems. Based on crystal transformation energies, the thermodynamic stability of these ternary phases is relatively low, making their formation less probable. Accordingly, this investigation focuses exclusively on assessing the thermodynamic feasibility of hexagonal AgAlO2 formation. Considering the oxidation of Ag, the oxidation of Al serves as the primary driving force in this reaction process, with the quantity of Al involved in the reaction being the basis for energy comparison. The specific possible reactions are the following reaction Eqs. (3) to (8), and the coefficient of Gibbs free energy with temperature variation in the reaction is shown in Table S2.
As evidenced in Fig. 9, when the temperature exceeds 500.07 K, the reaction Gibbs free energy of Reaction 4 becomes thermodynamically favorable compared to Reaction 5, suggesting a higher probability for Reaction 4 to proceed within this temperature regime. This trend is consistently observed in the comparison between Reactions 6 and 7, further confirming the thermodynamic preference for Reaction 6. Consequently, these energetic analyses demonstrate that AgAlO2 lacks thermodynamic stability under experimental conditions above 500.07 K.

Figure 9: The change of Gibbs free energy (ΔrG) functions withs of temperature in the reaction of 4 and 5
Through the combination of Reactions 3–7, we derive Reaction 8, whose temperature-dependent Gibbs free energy was subsequently calculated and plotted in Fig. 10. The thermodynamic analysis reveals that Reaction 8 becomes non-spontaneous (ΔG > 0) at temperatures exceeding 500.07 K, precluding the formation of AgAlO2 under these conditions.
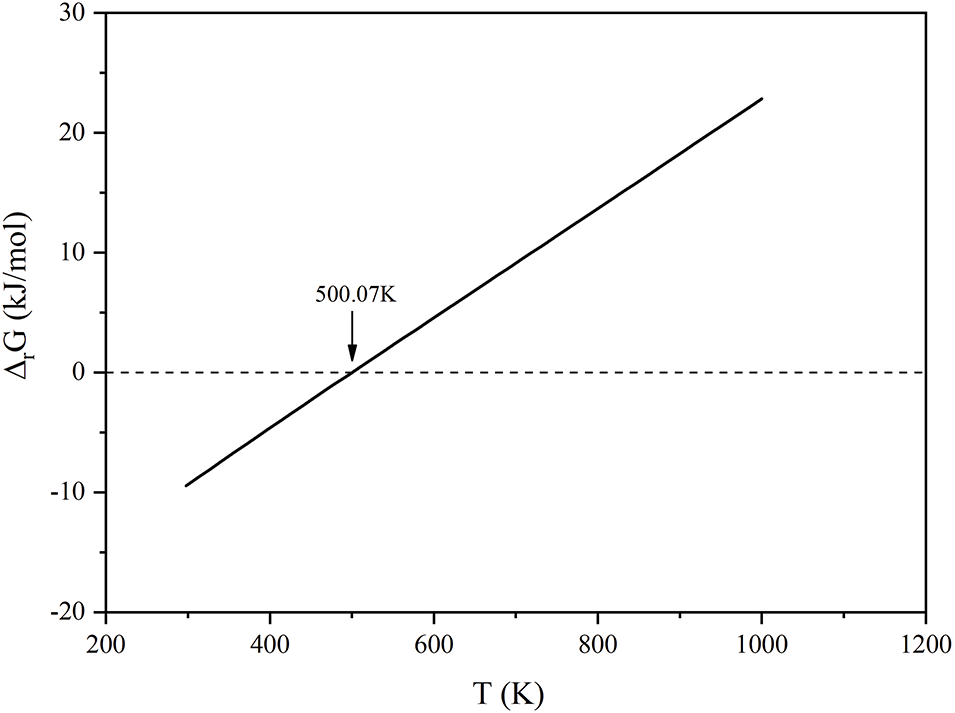
Figure 10: The reaction Gibbs free energy (ΔrG) with temperature in the reaction of 8
3.4.3 Oxidative Competition Order between Solid Solution and Ag2Al
Fig. 11 shows the Gibbs free energy functions of the two reactions. It can be seen that the reaction Gibbs free energy for the complete oxidation pathway of Ag2Al is significantly higher than the incomplete oxidation pathway of the Ag-containing Al solid solution (Ag-Al solid solution). This indicates that the Ag-containing Al solid solution is more likely to undergo the non-oxidation reaction, meaning that, theoretically, the oxidation reaction of the Ag-containing Al solid solution will occur before the oxidation of Ag2Al.

Figure 11: The change of Gibbs free energy (incomplete oxidation reaction in Al solid solution and complete oxidation reaction in Ag2Al) with temperature
3.4.4 Determination of Ag2Al Generated by Solid Solution Reaction
In metallic alloys, the Al-Ag solid solution may initially form Ag2Al intermetallic phases, followed by subsequent oxidation to yield Al2O3 through incomplete oxidation pathways. Alternatively, direct complete oxidation to Al2O3 may occur. This oxidation mechanism can be elucidated through thermodynamic analysis of the reaction Gibbs free energies. Using the formation of 1 mol Al2O3 as the reference standard, the reaction equations of various structural solid solutions with oxygen were balanced to obtain Eqs. (9) and (10). The Gibbs free energy of the reaction as a function of temperature is shown in Table S3.
As illustrated in Fig. 12, the four Ag-containing Al solid solutions exhibit nearly identical trends in their reaction Gibbs free energy profiles. Thermodynamic analysis reveals that the incomplete oxidation pathway (Eq. (9)), leading to Al2O3 formation via Ag2Al intermediate phase, demonstrates significantly lower Gibbs free energy compared to the direct complete oxidation of Al to Al2O3 (Eq. (10)). This energy preference demonstrates that the intermediate phase Ag2Al is more stable than the Ag-containing Al solid solution. The Ag-containing Al solid solution does not directly oxidize to form Ag and Al2O3, but first reacts to form the intermediate phase Ag2Al; Ag2Al then undergoes direct oxidation to form Ag and Al2O3. This process is closely related to the stability of the Ag2Al intermediate phase and the interfacial energy. The (0001) plane of Ag2Al and the (111) plane of Al have very similar atomic arrangements and lattice parameters, a match that can produce a phase interface with very low energy [24]. This low interfacial energy makes the formation of the Ag2Al phase easier with a lower energy barrier, meaning that when forming the Ag2Al phase, the system needs to overcome a smaller energy barrier. Therefore, it is easier for the Ag2Al phase to form within the Al solid solution. Notably, the energy gap between the complete (Eq. (10)) and incomplete (Eq. (9)) oxidation pathways diminishes progressively with decreasing Ag solid-solution concentration. This correlation suggests that supersaturated Ag conditions thermodynamically destabilize the complete oxidation reaction, as evidenced by the converging ΔG values at lower Ag contents.

Figure 12: The change of the reaction Gibbs free energy (ΔrG) with temperature for incomplete oxidation reaction and complete oxidation reaction in Al solid solutions containing Ag (a) 7Al1Ag, (b) 15Al1Ag, (c) 31Al1Ag, (d) 47Al1Ag
Taking the solid solution 7Al1Ag in Fig. 12a as an example, the energy reduction upon reaction is the greatest, indicating that the possibility of partial oxidation increases with the concentration of Ag, making it easier to react and form the intermediate phase Ag2Al. The final reaction is complete oxidation to form elemental Ag. As the amount of dissolved Ag decreases, as shown in Fig. 12b–d, the energy difference becomes less pronounced, meaning that the energy reduction for direct formation of Ag and for formation of the intermediate phase is nearly the same, and both reactions represented by Eqs. (9) and (10) are possible.
Fig. 12a demonstrates that the 7Al1Ag solid solution exhibits the most substantial energy reduction during oxidation, revealing a strong correlation between Ag concentration and preferential partial oxidation. This thermodynamic favorability promotes the formation of the intermediate Ag2Al phase through reaction pathway 9. Subsequent complete oxidation ultimately yields elemental Ag as the final product.
However, systematic analysis of Fig. 12b–d reveals that this energetic advantage diminishes with decreasing Ag solid-solution content. At lower Ag concentrations, the energy difference between the direct formation of Ag (Eq. (10)) and the intermediate pathway (Eq. (9)) becomes statistically insignificant, indicating comparable thermodynamic probabilities for both reaction mechanisms. This convergence suggests that the oxidation pathway becomes composition-dependent, with both reactions 9 and 10 becoming equally plausible below critical Ag concentrations.
Thus, the observed pattern is that in the Ag-containing Al solid solution, the higher the solubility of Ag, the more likely the oxidation reaction is to form the intermediate phase Ag2Al. In contrast, in regions with lower Ag concentrations, where the energy difference is smaller, complete oxidation reactions to precipitate elemental Ag are more favored. This indicates that during the oxidation heat treatment process, Ag-rich regions are the most favorable sites for the nucleation of Ag2Al. The more uniformly Ag is distributed within Al, that is, the lower the Ag concentration, the less favorable it is for the nucleation of Ag2Al and the more favorable for the precipitation of elemental Ag. Therefore, it is inferred that Ag2Al tends to aggregate around the precipitated Ag. During the subsequent adsorption process, O will be adsorbed, leading to the transformation Ag2Al → Ag. As shown in Fig. 13, with increasing Ag solubility concentration, the difference in Gibbs free energy between complete oxidation and partial oxidation reactions becomes larger. The rule is that the higher the solubility concentration, the greater the likelihood of incomplete oxidation. At higher temperatures, the difference between complete and incomplete oxidation is not significant, and both possibilities exist.
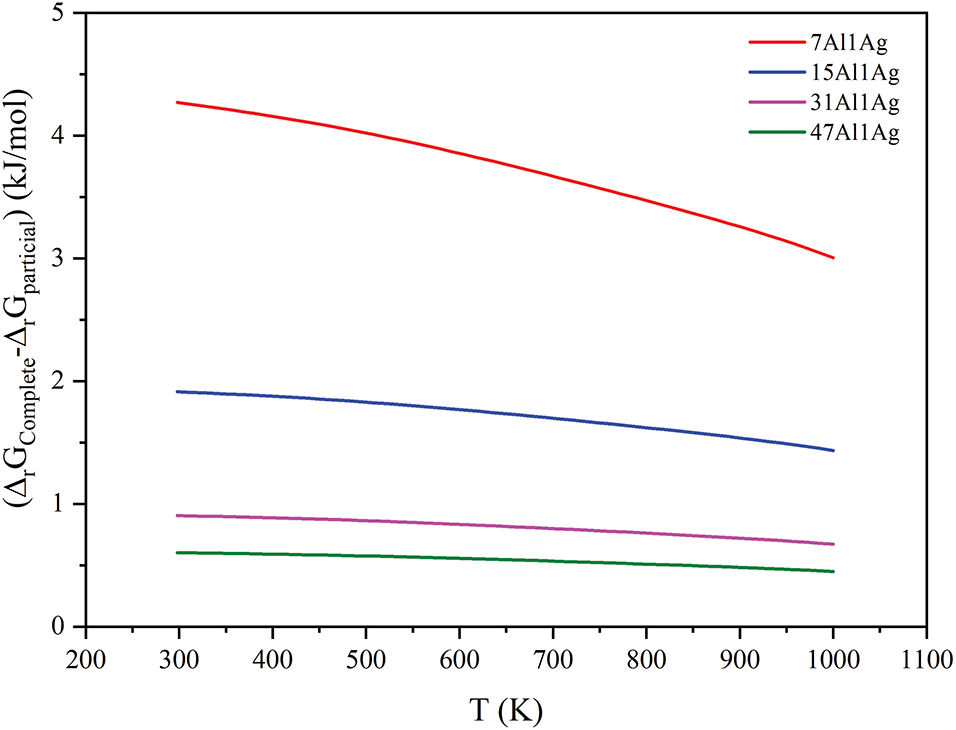
Figure 13: The change of Gibbs difference (ΔrGComplete-ΔrGIncomplete) with temperature Al solid solution containing Ag
At the same time, the ease with which oxygen dissolves in the alloy can reflect the ease of oxidation of the alloy to some extent. Table S4 presents the results of the binding energy and oxygen dissolution energy calculations for the oxygen dissolution models in Al and Ag2Al. For the pure Al oxygen dissolution model, the tetrahedral interstitial has a strong oxygen dissolution capacity, and the oxygen dissolution capacity is stronger as the oxygen concentration decreases, which is in line with general rules; for Ag2Al, the most expanded, most stable two Al opposite octahedral interstitial oxygen dissolution model has the best oxygen dissolution capacity, but its oxygen dissolution capacity is less than that of the tetrahedral interstitial oxygen dissolution model of pure Al with the same 4% oxygen concentration, and even less than that of the tetrahedral interstitial oxygen dissolution model of pure Al with a higher oxygen concentration. Therefore, it indicates that due to the strong oxygen dissolution capacity of pure Al, oxygen atoms are more likely to diffuse into the Al phase during the oxidation process, and even if the O concentration in the Al phase is higher than that in the Ag2Al phase, this diffusion will not stop, which fully explains that Al in the alloy will oxidize before Ag2Al. Thus, it is concluded that Ag dissolved in Al → Ag2Al → Ag. This pattern is determined from the perspective of the energy required for the solid solution to directly form various phases.
Based on the simulation results, samples were prepared with 3.125 at% Ag (equivalent to approximately 10 wt%). High-purity Al (99.99%, provided by Yunnan Aluminum Co., Ltd., Kunming, China) and Ag (99.95%, provided by Kunming Precious Metals Institute, Kunming, China) were vacuum melted to form a homogeneous alloy. The alloy was then atomized using a high-pressure gas atomization system equipped with a vacuum melting device, and the resulting Ag-Al alloy powder was sieved through 50 to 100 mesh screens.
The alloy powder was placed in an agate ball mill jar with a ball-to-powder weight ratio of 20:1 (a large-to-small ball ratio of 1:3, with large balls having a diameter of 3 mm and small balls having a diameter of 1 mm). The agate balls occupied 30% of the jar’s volume. To prevent severe oxidation of the powder during ball milling and to avoid welding of the alloy powder, a QM-ISP2 low-temperature ball mill was employed for powder refinement. The mill operated at a speed of 500 r/min, with alternating forward and reverse rotations every 30 min, for a total milling time of 15 h.
An YSL-65-1350 sintering furnace was utilized for the oxidation reaction synthesis. Oxygen was introduced into the furnace at a flow rate of 100 mL/min. In accordance with the simulation results, the in-situ oxidation reaction temperature was set to 400°C for 1 h (low-temperature reaction) and 600°C for 1 h (high-temperature reaction).
As shown in Fig. 14, the low-temperature oxidation process yielded the intermediate phase Ag2Al, which was gradually consumed with increasing reaction temperature, ultimately resulting in the formation of phase-pure Ag/Al2O3 powder composites. The morphological characteristics of the as-synthesized powders are presented in Fig. 15. During the experimental process, different oxidation reaction temperatures lead to the formation of various reaction phases. The emergence of Ag2Al indicates that there is an incomplete oxidation process at both low and high temperatures, implying the presence of an intermediate process. This intermediate process is often related to the enrichment of Ag, which is consistent with the discussions of Jug A and others [25], and also verifies the accuracy of the theoretical methods employed.

Figure 14: XRD of Ag/Al2O3 powders prepared at 400 and 600°C/1h

Figure 15: Morphology of Ag/Al2O3 powders prepared at 600°C/1h
(1) Calculation of Reaction Gibbs Free Energy (ΔrG) and Prediction of Reaction Feasibility.
The Gibbs free energy (ΔrG) of relevant reactions as a function of temperature was calculated using thermodynamic formulas, and the feasibility of the reactions was evaluated based on the reaction Gibbs free energy. The following predictions were made for possible reactions:
(1) The reaction Gibbs free energy patterns of the four Ag-containing Al solid solutions are essentially consistent. The reaction Gibbs free energy for forming the intermediate phase Ag2Al is lower than that for forming Ag, indicating that the formation of the intermediate phase Ag2Al from the Ag-containing Al solid solution is thermodynamically more favorable than direct oxidation to form Ag and Al2O3.
(2) The Ag-containing Al solid solution will oxidize before Ag2Al, and the higher the Ag concentration, the easier the oxidation process. For the solid solutions 7Al-1Ag (12.5 at%), 15Al-1Ag (6.25 at%), 31Al-1Ag (3.125 at%), and 47Al-1Ag (2.083 at%), the difference in reaction Gibbs free energy between complete and incomplete oxidation pathways decreases with increasing temperature, indicating that at higher temperatures, the likelihood of incomplete oxidation and complete oxidation becomes similar.
(3) Based on the calculated reaction Gibbs free energy results, the existing reaction processes were identified. The ternary phase AgAlO2 will not form at temperatures above 510.7 K, and the Ag2O phase will not exist at temperatures above 472.8 K. The reaction synthesis process should be conducted at temperatures above 510.7 K (237°C). At temperatures above 237°C, the following reactions are expected to occur:
4Al + 3O2→2Al2O3
AgxAly(solid solution) + O2→Ag2Al + Al2O3
4Ag2Al + 3O2→4Ag + 2Al2O3
AgxAly (solid solution) + O2→Ag + Al2O3
(2) Guidelines for Raw Material Preparation Based on Calculation Results.
The formulation principles for raw materials were determined through computational analysis. In Al-Ag solid solutions, increased Ag concentrations were observed to correspond with decreased reaction temperatures, rendering the formation of the intermediate Ag2Al phase more thermodynamically favorable compared to direct generation of Ag and Al2O3. To suppress the formation of the Ag2Al intermediate phase, the following experimental parameters were implemented: (i) a reduced Ag concentration of 3.125 at% was maintained in supersaturated alloy preparation, and (ii) an oxidation temperature of 600°C (below the solidus line) was employed. Through this methodology, elemental Ag was successfully obtained directly from the solid solution. For the practical application of catalyzing 200°C–300°C in the later stage, stability is of great significance. The validity of the computational methodology was conclusively demonstrated through experimental verification.
Acknowledgement: Not applicable.
Funding Statement: This work was sponsored by Major Science and Technology Project of the Yunnan Provincial Department of Science and Technology (202502AB080011), Yunnan Province Industrial High-Tech Project (202403AA080015), and Special Science and Technology Research Project of Yunnan Province for the South Asia and Southeast Asia Innovation Center (202403AP140006).
Author Contributions: The authors confirm contribution to the paper as follows: study conception and design: Yuanyuan Xiong, Jie Yu; data collection: Tong Wu, Lixin Sun; software, methodology: Mingyu Hu, Yuanyuan Xiong; analysis and interpretation of results: Lixin Sun, Tong Wu; draft manuscript preparation: Yuanyuan Xiong, Mingyu Hu. All authors reviewed the results and approved the final version of the manuscript.
Availability of Data and Materials: The datasets generated or analyzed during the current study are not publicly available due to privacy concerns of the participants, but are available from the corresponding author on reasonable request.
Ethics Approval: Not applicable.
Conflicts of Interest: The authors declare no conflicts of interest to report regarding the present study.
Supplementary Material: The supplementary material is available online at https://www.techscience.com/doi/10.32604/cmc.2025.067722/s1.
References
1. Bai BY, Qiao Q, Li JH, Hao JM. Progress in research on catalysts for catalytic oxidation of formaldehyde. Chin J Catal. 2016;37(1):102–22. (In Chinese). doi:10.1016/s1872-2067(15)61007-5. [Google Scholar] [CrossRef]
2. Jing X, Huang J, Wang H, Du M, Sun D, Li Q. Preparation of Ag/α-Al2O3 for ethylene epoxidation by an impregnation-bioreduction process with Cinnamomum camphora extract. Chem Eng J. 2016;284:149–57. doi:10.1016/j.cej.2015.08.082. [Google Scholar] [CrossRef]
3. Zhang X, Dong T, Ma H, Li D, Ying C, Liu C, et al. A first principles investigation on the influence of transition-metal elements on the structural, mechanical, and anisotropic properties of CaM2Al20 intermetallics. J Mol Graph Model. 2020;96:107509. doi:10.1016/j.jmgm.2019.107509. [Google Scholar] [PubMed] [CrossRef]
4. Yang A, Duan YH, Bao L, Peng M, Shen L. Elastic properties, tensile strength, damage tolerance, electronic and thermal properties of TM3AlC2 (Tm = Ti, Zr and Hf) max phases: a first-principles study. SSRN J. 2022. doi:10.2139/ssrn.4107128. [Google Scholar] [CrossRef]
5. Van Troeye B, Torrent M, Gonze X. Interatomic force constants including the DFT-D dispersion contribution. Phys Rev B. 2016;93(14):144304. doi:10.1103/physrevb.93.144304. [Google Scholar] [CrossRef]
6. Li Y, Duan Y, Peng M, Zheng S. Structural, elastic, and thermal properties of TM5Si3C (TM = Ti, Cr, Y) carbides from first-principles calculations. Vacuum. 2023;218(9):112616. doi:10.1016/j.vacuum.2023.112616. [Google Scholar] [CrossRef]
7. Chen X, Zhang X, Guo H, Wang F. Exploring the electronic, mechanical, anisotropic, and optical properties of ternary silicides TM2Si2Ys (TM = Cu, Ir, Os, Pt, Pd, Rh, Ru) from a first principles investigations. Int J Quantum Chem. 2022;122(16):e26922. doi:10.1002/qua.26922. [Google Scholar] [CrossRef]
8. Pan Y. W2AlC: a new layered MAX phase to adjust the balance between strength and ductility. Mater Today Chem. 2024;35:101915. doi:10.1016/j.mtchem.2024.101915. [Google Scholar] [CrossRef]
9. Sun Y, Yang A, Duan Y, Shen L, Peng M, Qi H. Electronic, elastic, and thermal properties, fracture toughness, and damage tolerance of TM5Si3B (TM = V and Nb) MAB phases. Int J Refract Met Hard Mater. 2022;103:105781. doi:10.1016/j.ijrmhm.2022.105781. [Google Scholar] [CrossRef]
10. Poulou A, Mellan TA, Finnis MW. Stability of Zr-Al-C and Ti-Al-C MAX phases: a theoretical study. Phys Rev Materials. 2021;5(3):033608. doi:10.1103/physrevmaterials.5.033608. [Google Scholar] [CrossRef]
11. Ma XY, Kang X, Cao JW. Origin of the elastic anisotropy of silica particles: insights from first-principles calculations and nanoindentation molecular dynamic simulations. Comput Geotech. 2023;159(6):105489. doi:10.1016/j.compgeo.2023.105489. [Google Scholar] [CrossRef]
12. Mortazavi B, Javvaji B, Shojaei F, Rabczuk T, Shapeev AV, Zhuang X. Exceptional piezoelectricity, high thermal conductivity and stiffness and promising photocatalysis in two-dimensional MoSi2N4 family confirmed by first-principles. Nano Energy. 2021;82:105716. doi:10.1016/j.nanoen.2020.105716. [Google Scholar] [CrossRef]
13. Ning Y, Zhou X. Metastable extension of solid solubility of alloying elements in silver. J Alloys Compd. 1992;182(1):131–44. doi:10.1016/0925-8388(92)90581-S. [Google Scholar] [CrossRef]
14. Ellner M, Kolatschek K, Predel B. On the partial atomic volume and the partial molar enthalpy of aluminium in some phases with Cu and Cu3Au structures. J Less Common Met. 1991;170(1):171–84. doi:10.1016/0022-5088(91)90062-9. [Google Scholar] [CrossRef]
15. Owen EA, Williams GI. A low-temperature X-ray camera. J Sci Instrum. 1954;31(2):49–54. doi:10.1088/0950-7671/31/2/305. [Google Scholar] [CrossRef]
16. Witt W. Absolute Präzisionsbestimmung von gitterkonstanten an germanium- und aluminium-einkristallen mit elektroneninterferenzen. Z Für Naturforschung A. 1967;22(1):92–5. doi:10.1515/zna-1967-0115. [Google Scholar] [CrossRef]
17. Kato A, Anju Y. Expansion of Ag2O lattice by annealing. J Am Ceram Soc. 1972;55(1):25–8. doi:10.1111/j.1151-2916.1972.tb13390.x. [Google Scholar] [CrossRef]
18. Levin I, Brandon D. Metastable alumina polymorphs: crystal structures and transition sequences. J Am Ceram Soc. 1998;81(8):1995–2012. doi:10.1111/j.1151-2916.1998.tb02581.x. [Google Scholar] [CrossRef]
19. Chierchia R, Böttcher T, Heinke H, Einfeldt S, Figge S, Hommel D. Microstructure of heteroepitaxial GaN revealed by X-ray diffraction. J Appl Phys. 2003;93(11):8918–25. doi:10.1063/1.1571217. [Google Scholar] [CrossRef]
20. Perdew JP, Zunger A. Self-interaction correction to density-functional approximations for many-electron systems. Phys Rev B. 1981;23(10):5048–79. doi:10.1103/physrevb.23.5048. [Google Scholar] [CrossRef]
21. Neumann JP. Determination of the ordering in the intermetallic compound Ag2Al. Acta Metall. 1966;14(4):505–11. doi:10.1016/0001-6160(66)90318-X. [Google Scholar] [CrossRef]
22. Yao Y, Zhou J, Xue F, Chen X. Interfacial structure and growth kinetics of intermetallic compounds between Sn-3.5Ag solder and Al substrate during solder process. J Alloys Compd. 2016;682:627–33. doi:10.1016/j.jallcom.2016.04.263. [Google Scholar] [CrossRef]
23. Zarkevich NA, Johnson DD, Smirnov AV. Structure and stability of hcp bulk and nano-precipitated Ag2Al. Acta Mater. 2002;50(9):2443–59. doi:10.1016/S1359-6454(02)00075-7. [Google Scholar] [CrossRef]
24. Hass G, Francombe MH, Vossen JL. Preface. In: Physics of thin films—advances in research and development. Amsterdam, The Netherland: Elsevier; 1982. p. ix–x. doi:10.1016/s0079-1970(13)70005-7. [Google Scholar] [CrossRef]
25. Jug A, Brunčko M, Rudolf R, Anžel I. Oxidation behaviour of microstructurally highly metastable Ag-La alloy. Materials. 2022;15(6):2295. doi:10.3390/ma15062295. [Google Scholar] [PubMed] [CrossRef]
Cite This Article
 Copyright © 2025 The Author(s). Published by Tech Science Press.
This work is licensed under a Creative Commons Attribution 4.0 International License , which permits unrestricted use, distribution, and reproduction in any medium, provided the original work is properly cited.
 Downloads
 Citation Tools