
 Submit a Paper
 Propose a Special lssue
 Open Access
ARTICLE

A Fog-Based Approach for Theft Detection and Zero-Day Attack Prevention in Smart Grid Systems
1 Departement of Computer Science, Princess Sumaya University for Technolog, Amman, 11941, Jordan
2 Computer Science Department, College of Computing and IT, Shaqra University, Shaqra, 11961, Saudi Arabia
* Corresponding Author: Amjad Aldweesh. Email:
# These authors contributed equally to this work
Computers, Materials & Continua 2025, 85(3), 4921-4941. https://doi.org/10.32604/cmc.2025.067818
Received 13 May 2025; Accepted 25 July 2025; Issue published 23 October 2025
 View Full Text
 Download PDF
Abstract
Smart grid systems are advancing electrical services, making them more compatible with Internet of Things (IoT) technologies. The deployment of smart grids is facing many difficulties, requiring immediate solutions to enhance their practicality. Data privacy and security are widely discussed, and many solutions are proposed in this area. Energy theft attacks by greedy customers are another difficulty demanding immediate solutions to decrease the economic losses caused by these attacks. The tremendous amount of data generated in smart grid systems is also considered a struggle in these systems, which is commonly solved via fog computing. This work proposes an energy-theft detection method for smart grid systems employed in a fog-based network infrastructure. This work also proposes and analyzes Zero-day energy theft attack detection through a multi-layered approach. The detection process occurs at fog nodes via five machine-learning classification models. The performance of the classifiers is measured, validated, and reported for all models at fog nodes, as well as the required training and testing time. Finally, the measured results are compared to when the detection process occurs at a central processing unit (cloud server) to investigate and compare the performance metrics’ goodness. The results show comparable accuracy, precision, recall, and F1-measure performance. Meanwhile, the measured execution time has decreased significantly in the case of the fog-based network infrastructure. The fog-based model achieved an accuracy and recall of 98%, F1 score of 99%, and reduced detection time up to around 85% compared to the cloud-based approach.Keywords
Energy theft is a common form of nontechnical loss in smart grid systems (SGSs) [1]. While these systems enhance electricity generation, transmission, and distribution [2], the presence of energy theft by malicious users questions the benefits of adopting SGSs [3]. Within SGSs, the smart metering infrastructure measures user electricity consumption, relaying this data to electricity service providers responsible for billing and analyzing demand to prevent blackouts and grid overload [4]. Energy theft disrupts this process, leading to financial losses for service providers and potential grid instability [5,6].
The global trend is towards Internet of Things (IoT)-based services, characterized by a network of interconnected devices and technologies that facilitate data transfer [7,8]. This shift makes outdated energy services less viable, paving the way for smart grid systems [9]. This transition aligns with advancements in artificial intelligence (AI) and machine learning (ML) technologies [10], which have been effectively employed to combat cybersecurity threats within IoT environments, including SGS applications [11–13].
In SGSs, smart meters are located in industrial, commercial, and residential areas to monitor real-time electricity usage via bidirectional communication [14]. The data collected is stored on cloud or fog nodes, which also manage load balancing and implement strategies against various cyber threats [14]. Given the multitude of connected devices, significant computational and memory resources are needed at the central cloud [15,16]. Fog computing addresses this challenge by allocating resources closer to data sources, reducing latency and bandwidth consumption while enhancing data privacy and overall system resilience against cyber threats [17,18].
A recent study in [19] proposed generating a dataset reflecting six theft techniques found in literature by manipulating data from the Open Energy Data Initiative (OEDI), which houses valuable energy research datasets from the U.S. This publicly accessible dataset, published on Mendeley Data, demonstrated strong detection capabilities for various attack types.
The study in [5] examines SGS strategies for detecting energy theft attacks and critiques existing research for not considering newer technologies. It underscores the challenges of processing the vast data generated and emphasizes the need for practical solutions. Our objective is to show how distributing data among fog servers can alleviate processing burdens while maintaining effective energy theft detection methodologies.
This research aims to enhance energy theft detection using fog nodes in SGSs, contrasting with cloud-based methods that require more resources. Detection servers will be positioned closer to smart meters to accelerate communication.
Additionally, zero-day attack detection is included, as these complex cyber threats exploit unknown vulnerabilities, making them hard to identify with conventional measures [20,21]. Existing cloud-based systems face latency and resource limitations. We propose a novel fog-based multi-layered detection approach to reduce detection times and improve zero-day attack identification. This is achieved by identifying uncommon patterns using advanced ML methodologies in a fog computing framework, which adds an essential security layer for the smart grid system. This work extends beyond training and testing ML models, focusing on their deployment in fog-based networks where fog computing is necessary and beneficial.
The main contribution of this work can be listed as follows:
• Proposing a fog-based energy theft detection system.
• Presenting a comparative analysis between energy theft detection systems in fog-based and cloud-based network infrastructure.
• Presenting and testing a multi-layered zero-day attack detection approach for energy theft attacks in smart grid systems in a fog-based network infrastructure.
This section presents recent works focusing on energy theft detection in smart grid systems (SGSs), along with the available knowledge and solutions in this area.
The work in [22] proposes a hardware-based solution by introducing an architectural design for smart meters that can mitigate security issues related to measured energy usage. This approach requires replacing older classical smart meters at the customer’s end with more advanced devices, which necessitates extensive infrastructure maintenance and incurs additional costs.
The study presented in [23] employs time series algorithms to generate a user usage dataset. This dataset is then trained to detect fraudulent behaviors. Although the proposed method is intended to operate in a fog-enabled smart grid environment, the operational benefits of fog nodes are not studied or discussed. The fog nodes act as a joint system to transmit data from smart meters to a central cloud center. Both the cloud center and fog nodes are considered honest but curious users; they comply with network protocols but may utilize the delivered data for unauthorized actions. In [24], K-means clustering is used to identify abnormal usage represented by outliers. The model was tested on semi-synthetic data, where anomaly behavior was induced by manipulating the usage patterns of regular users.
More advanced methods have frequently been proposed in the literature to enhance the energy theft detection process. In [25,26], the authors suggest utilizing ensemble machine learning models, such as XGBoost, to analyze user behavior generated by smart meters in order to detect energy theft cases. Work in [26] extends this by incorporating data preprocessing through feature engineering to enhance the theft detection process and reduce time requirements. In [27], a two-stage deep learning approach is proposed to recognize energy theft in SGSs. This method addresses imbalanced data using clustering techniques and convolutional neural networks (CNNs). The first stage aims to detect fraudulent behaviors, which are then passed to multiple CNNs to learn these patterns and improve the detection process.
An energy theft detection scheme that preserves privacy via the Paillier encryption algorithm was proposed in [28]. The authors utilize the encryption algorithm to safeguard users’ energy usage, with the encrypted data being fed into a CNN to detect theft cases. This approach was tested on a large, realistic dataset and achieved an accuracy of approximately 92%. The study in [29] suggests enhancing CNN detectability through regularization methods. They also investigate zero-day attack detection and suggest improvements via their proposed approach. The work in [29] focuses on security issues beyond energy theft attacks, including DDoS attacks.
Distributed systems have been discussed in the literature as a means to avoid bottlenecks and congestion seen in non-distributed systems [30]. In [31], energy theft detection using deep learning methods is advanced by employing federated learning techniques to identify energy theft cases in smart grid systems. The system consists of multiple distributed stations that collect energy usage data, which is used to train CNNs in real-time; the necessary parameters are then shared with a central control center. The work presented in [32] enhances zero-day attack detection using a federated learning approach. The authors utilize deep autoencoders for local training, integrating them into the detailed learning process. However, the authors note that smart meters typically have limited processing capabilities, which may hinder this approach. Additionally, the federated learning method is trained on unlabeled data from users, where the threat of theft may deviate from the detection process. To practically implement federated learning in distributed systems like SGSs, fog computing could significantly enhance these methods and improve usability. The application of federated learning for detecting zero-day attacks was proposed in [29], where local models are trained at edge servers, which subsequently share the necessary parameters with a central cloud server. This work focuses on detecting threats related to network operations, such as DDoS attacks, rather than energy theft.
In this work, we aim to leverage the lessons learned from these studies to enhance energy theft detection through the utilization of fog computing. Zero-day attacks will be addressed with a two-layered detection system, where initial classification occurs at the fog nodes, followed by a secondary classification process in a central server that aggregates data from all connected fog nodes.
Table 1 presents a consolidated view of recent studies handling electricity theft and zero-day attack detection within SGSs. Most of the existing studies utilize centralized machine learning models or cloud-based processing, which are accurate, yet suffer from scalability and latency issues. Works such as [21] and [26] report high accuracy and F1 scores; they either lack real-time applicability or depend on private or constrained datasets, limiting their generalizability. Works such as cite29 demonstrate potential for zero-day scenarios but exhibit high detection delays and limited performance for certain theft types.

Furthermore, federated and hybrid deep learning approaches [31,32] address data privacy and distribution challenges. However, they often lack practical deployment or real-time validation. In contrast, the current work leverages fog computing to enable distributed, low-latency detection while integrating zero-day attack scenarios into its threat model. Notably, it achieves high-performance metrics 98% accuracy, 99% F1-score and reduces detection latency by approximately 85% compared to cloud-only systems, highlighting its suitability for modern smart grid applications with real-time requirements.
This section presents the materials used throughout the work, the dataset, and the classification models. We also present the methodology followed to test the efficiency of fog-based SGS in energy theft detection applications. The methodology used in the zero-day attack detection process is also presented.
The used dataset in this work is shown in Fig. 1. The dataset was downloaded from Menedely data; the first column of the dataset contains a serial number for the data record. It starts from 0 and ends at 560,654; we removed this column throughout all the conducted experiments since it is common to remove ID columns and unrelated features to the data from the dataset before being used in ML and AI models to enhance the reliability of the generated results. Feature selection is a critical process that enhances the detection process [33].

Figure 1: The used dataset
The next ten columns include data about energy usage in a certain utility during the day. For example, the electricity, fan, or cooling usage is listed as a floating-point number. The 12th column is titled class; it indicates the type of user whose data is listed in that data tuple; there are 16 different users in the dataset. Finally, the last column, entitled “theft” includes six types of theft named “Theft1–Theft6”. Basic statistical analysis reveals an average electricity facility load of approximately 161.78 kW and a maximum recorded load of 1726.43 kW, while gas facility loads average 77.31 kW with a maximum of 4491.70 kW. No missing values were detected across the features.
In Table 2, we list the number of occurrences for each Theft type in the used dataset. The six theft types are described in [19]. Theft1 is a significant reduction in daily electricity consumption. The reduction is generated by multiplying the consumption by a random value between 0.1 and 0.8; there are 51,083 occurrences of this attack in the dataset. It is good to mention that our study dealt with this attack as a zero-day attack. In theft2, electricity consumption randomly drops to zero during a period of the day. Theft3 is identical to theft1, but each consumption value (each hour) is multiplied by a random number. In theft4, the consumption is replaced with a randomly generated fraction of the mean consumption. This fraction becomes 1 when it comes to theft5. Theft6 reverses the order of consumption during the day. The occurrences of each type are clarified in Table 2. So, the total number of all attacks in the dataset is 228,831.

3.2 Rationale for Selecting Theft1 as Zero-Day Attack
Theft1 was selected as the zero-day attack scenario because it introduces a systematic yet slight reduction in daily electricity consumption, generated by scaling normal usage with a random factor between 0.1 and 0.8. Unlike sharper or conspicuous attack types, this manipulation closely mimics stealthy, real-world fraud attempts designed to bypass standard detection systems. Theft1’s impact manifests as a smooth distributional shift, with altered consumption profiles often remaining within the normal operational range, thereby presenting a notable challenge for machine learning models to identify without prior exposure. This reflects the core challenge of zero-day attacks, where novel but statistically apparent behavior can bypass traditional, signature-based defenses [19]. By withholding all Theft1 samples during training, our methodology directly evaluates the resilience of the detection system to emerging, previously unseen attack strategies, offering a strict and practical benchmark for smart grid security.
3.3 The Used Classification Models
This section describes the ML models we used to classify fog and cloud nodes. Table 3 lists the used models and the key parameters used for each model

K-Nearest Neighbors (KNN) is an uncomplicated, non-parametric classification method. It assigns a class to a data point according to its k-nearest neighbors in the feature space; the assigned class is the major class among its k-neighbors. We used the KNeighborsClassifier with default parameters such that n_neighbors = 5 (number of used neighbors), algorithm = ‘auto’ (the used algorithm to find the nearest neighbors), and p = 2 (the power value for the Minkowski distance metric).
The Decision Tree classifier is famous in ML applications; it makes decisions using data features. It splits the data into subsets based on the most significant attribute, creating branches for all probable outputs. We utilized the DecisionTreeClassifier with default parameters, such that the criterion = ‘gini’ (the standard for splitting), splitter = ‘best’ (a technique employed to split at each node), and random_state = None (it is a random seed for reproducibility).
Bagging (Bootstrap Aggregating) is an ensemble approach that integrates the predictions of many base estimators made with subsets of the initial dataset to enhance the robustness and accuracy of the model. We employed the BaggingClassifier with base_estimator = DecisionTreeClassifier(), and random_state = 42 for reproducibility. The default parameters were used, including n_estimators = 10 (the number of base estimators), max_samples = 1.0 (the fraction of samples to use), and max_features = 1.0 (fraction of features to use).
3.3.4 Artificial Neural Network
The Artificial Neural Network (ANN) is a robust model enlightened by the human brain’s neural structure. It can capture complicated patterns and associations in data via its multi-layered architecture and nonlinearity. To ensure reproducibility, we utilized the MLPClassifier with random_state = 42. The default parameters were utilized, which include hidden_layer_sizes = (100,) (the size of the hidden layers), activation = ‘relu’ (the used activation function), solver = ‘adam’ (optimizer), alpha = 0.0001 (L2 regularization term), and learning_rate = ‘constant’ (learning rate schedule).
Each of these models has notable strengths, supplying a comprehensive approach to the classification experiments in this work. By utilizing a set of classifiers and selecting their parameters, we aim to leverage their benefits and improve the overall performance of the theft detection system. The study also investigates the robustness of the classification models as energy theft detection tools in fog-based systems.
As we mentioned earlier, this work aims mainly to evaluate the performance of edge computing via fog nodes in energy theft detection applications. The presented study also compares the results with the case when these applications are applied at cloud nodes or central nodes, in other words. In Fig. 2, we present the methodology we follow through our evaluation. The process starts with reading the dataset and applying the pre-processing steps mentioned in Fig. 1. After reading and preparing the dataset, the study goes through two separate steps. The left branch in Fig. 2 shows the classical approach where the classification process is applied at a cloud server site or a single central processing site. This approach requires high computational and memory sources and represents a single point for potential attacks or failures. We use all the classifiers described in Table 3.

Figure 2: This figure was edited, the numbers are added to clarify the process steps, the colors are used to indicate that two approaches are used. Theft detection approach in fog-based system
On the right side of Fig. 2, our proposed approach is listed. This approach divides the dataset into “n” equivalent parts, where “n” is the number of available fog nodes. At every fog node and after receiving the assigned data tuples, the classification process takes place. In this case, the required computation and memory are decreased compared to the first approach. Also, we eliminated the single point of failure problem.
To study and evaluate the performance of each fog node, we implemented our approach via Python code developed and tested with the Anaconda3 platform. All experiments are performed on an 11th-generation Intel dual-core i7 16 GHz each and 16 GB RAM. In our code, we simulate the performance of the central processing unit, i.e., the left branch, by running the classification models using all the data simultaneously. While to simulate the fog-based approach, the classification models for each split are run sequentially. The first split goes through the classification process, followed by the second split, and so on. Every classification result is validated through a 5-fold validation method in both branches. At last, the classification results of both studied approaches are compared and analyzed as we will show shortly in Section 4.
Although our results show clear advantages of a fog-based approach in simulations, we believe the current evaluation was accomplished solely within a simulated environment. This setup does not catch complexities inherent to real-world SGSs, such as network latency, node failures, data synchronization delays, and hardware heterogeneity. Future work should involve validation using real hardware deployments or testbeds to strengthen the conclusions’ generalizability and practical relevance; conducting tests in real operational scenarios will better assess the actual performance, resilience, and feasibility of deploying fog-based detection models in live smart grid infrastructures.
3.5 Zero-Day Attack Detection Approach
The “Theft1” attack is chosen as the targeted attack during the zero-day attack detection experiments. Hence, and as shown in Fig. 3 during the pre-processing step, “Theft1” is extracted into a separate data structure. While attacks “Theft2–Theft6” are grouped into a single class and labeled as an anomaly, meanwhile the normal data are labeled to present the normal behavior. It is clearly noticed here that the data is prepared for the binary classification process. This is done because the focus here is to distinguish theft behavior; the system should also be capable of detecting unseen thefts, i.e., “Theft1”. Through the analysis process, we also compare the classification and zero-day detection techniques when the data is split among “n” fog nodes versus when the data is processed at the central node. The classifiers are trained to distinguish normal from anomaly behavior. Then, the models’ capability to detect the “Theft1” attack is tested, although they are not trained on data that includes this attack.

Figure 3: This figure was edited, the numbers are added to clarify the process steps, the colors are used to indicate that two approaches are used. Zero-Day Attack Detection Approach
We use all the classifiers mentioned in Table 3 for classification.
3.6 The Multi-Layered Fog-Based Zero-Day Detection Algorithm
To fully utilize the capabilities of fog servers in SGSs, we propose Algorithm 1, which deploys binary classification models in the fog-based network, where these fog nodes are connected to a central cloud processing unit.
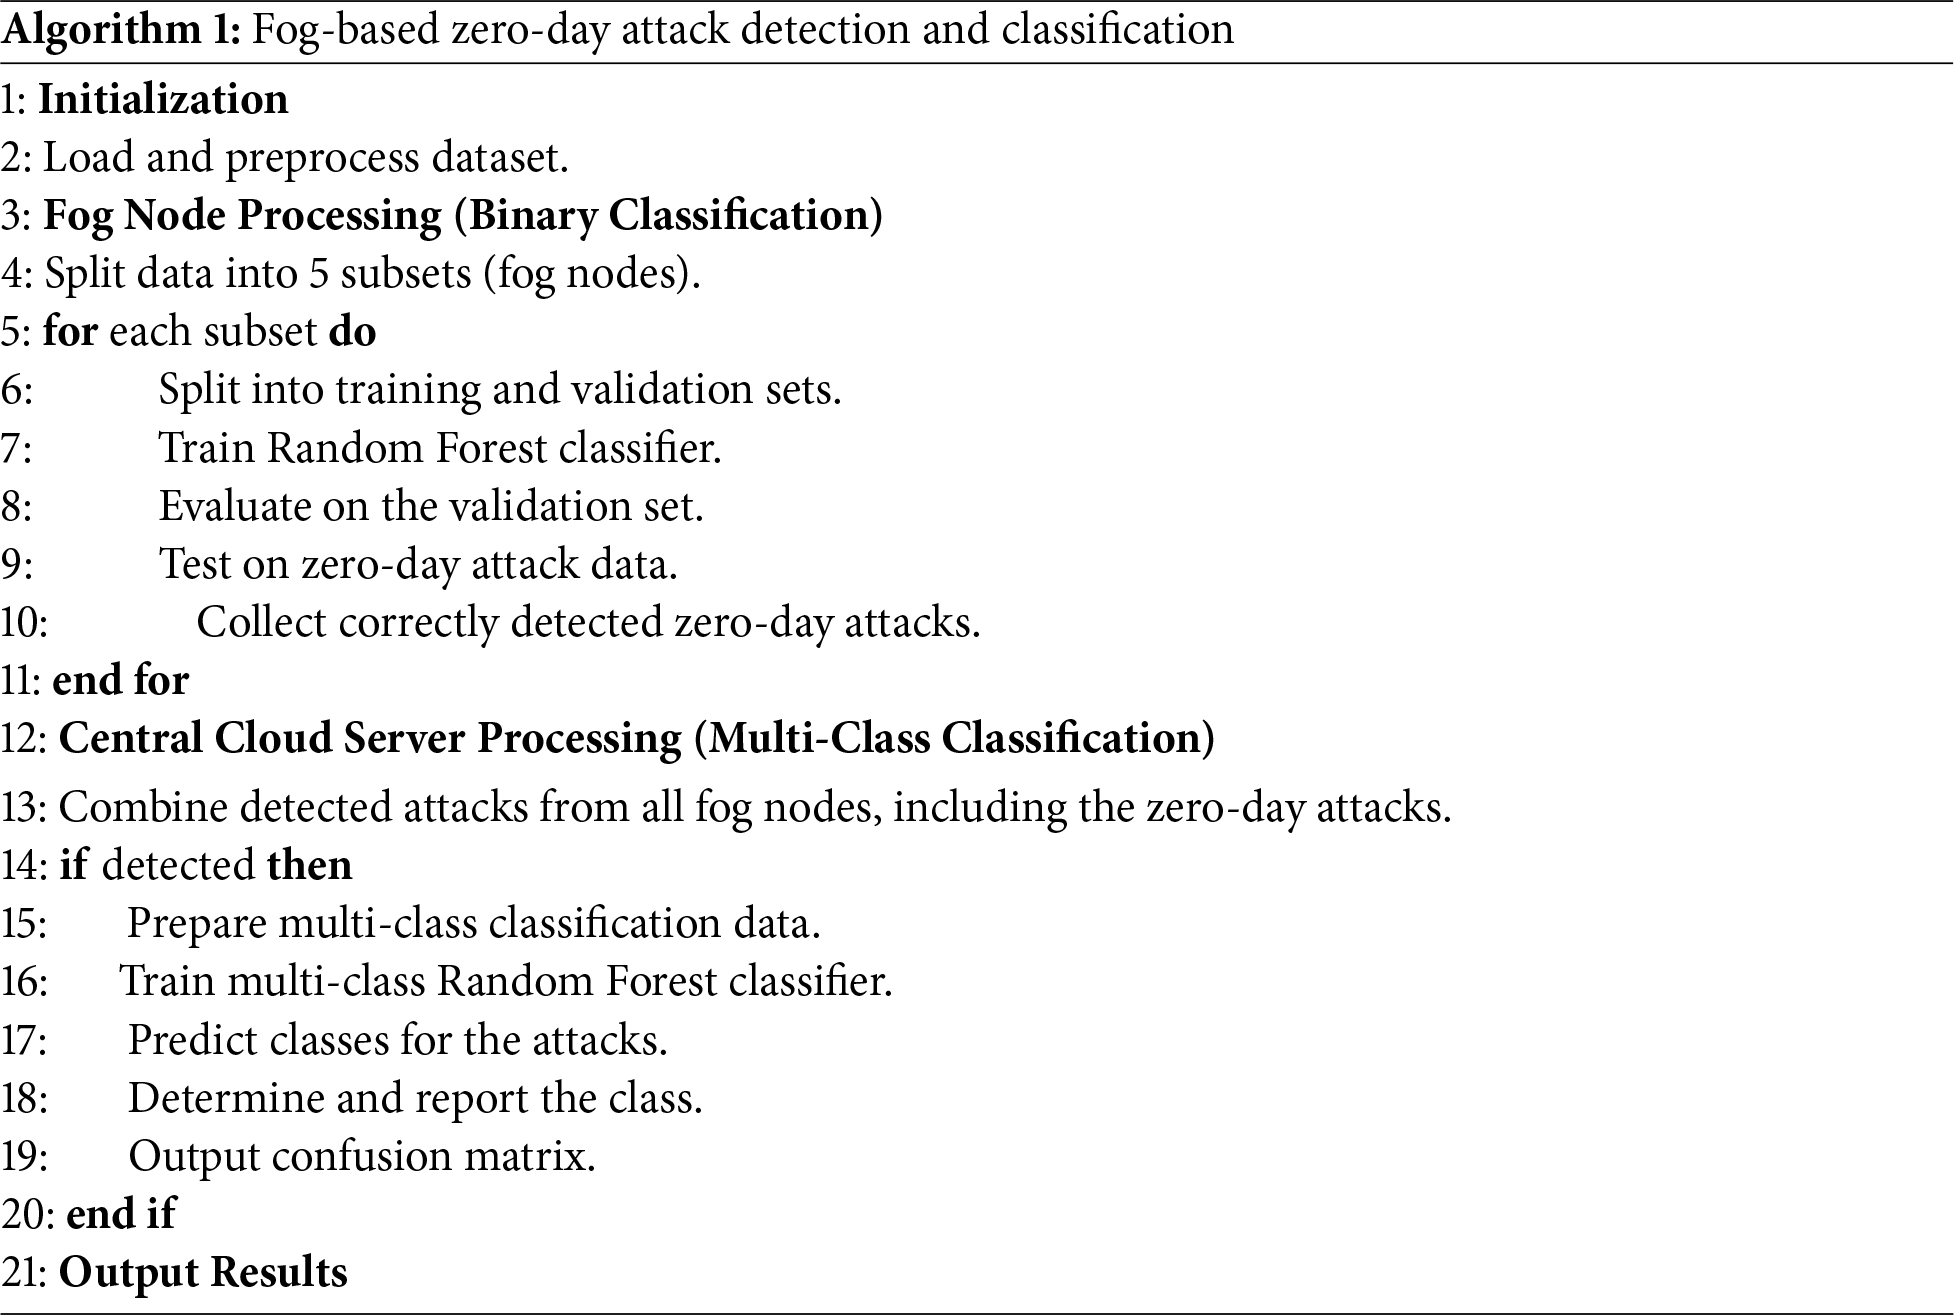
The binary classifier at fog nodes detects possible attack cases. The detected attacks are passed to a central cloud processing unit to classify the attacks into different energy theft attack types. The first layer aims to speed up the anomaly detection process, while the second central layer collects suspicious behaviors from fog nodes and classifies them into multiple classes. The cloud center should keep a log of suspicious behavior and should also update the classifiers with data about the newly detected behaviors. We propose this algorithm mainly to enhance zero-day attack detection.
We tested the algorithm on the zero-day attacks to evaluate the strength of the proposed algorithm. Every attack was dealt with as a zero-day attack, and the results were reported, as explained in the next section. The fog node models are binary classifiers trained with five theft attacks because the zero-day attack is used only during testing time. At the same time, the central cloud server is a multi-class classifier trained with five attacks, and it should recognize and classify the attacks collected from fog nodes.
We now discuss the mathematical representation of fog-based zero-day attack detection and classification.
Let the dataset be represented as:
where
The dataset is split into M subsets processed at fog nodes:
This step partitions the dataset among M fog nodes such that each subset is handled independently without overlap. Each fog node processes a distinct data portion to improve parallelization and efficiency.
Fog Node Processing (Binary Classification): Each fog node
where
The classifier
The training process minimizes the binary cross-entropy loss:
where
This equation defines the loss function used to train the binary classifier at each fog node. It penalizes incorrect classifications, ensuring that predicted attack probabilities
The classifier is tested on a zero-day attack subset
where
This equation captures the zero-day attack detection phase. Each fog node classifies its portion of the zero-day attack dataset, producing a set of correctly detected attacks.
Central Cloud Server Processing (Multi-Class Classification): After all fog nodes detect potential zero-day attacks, the central server aggregates the correctly classified attack instances:
This step consolidates the correctly classified zero-day attack instances from multiple fog nodes, forming a final dataset for further analysis.
A multi-class classification model F is trained:
where
This function models a classifier that assigns an attack sample to one of C predefined attack categories. Unlike binary classification, this step focuses on differentiating between various attack types.
The multi-class cross-entropy loss is:
where N′ is the number of attack samples in the final dataset. C is the number of attack classes.
The final classification result is:
This equation defines the output of the final classification stage, where each attack instance in the dataset is assigned a predicted label.
The confusion matrix M is computed as:
where
In this section, we introduce the performance measures used throughout the study. We emphasize the need for the execution time measurement. Then the results are listed and discussed for Algorithm 1.
The main goal of this system is to test the performance of different classification models in detecting energy theft in a smart grid system. The smart grid network infrastructure system is supposed to be fog-based. The fog nodes should operate as edge computers performing the classification process on the data generated by a subset of the smart meters connected in the smart grid system. Hence, the metrics used to evaluate the performance of these models are discussed in this section; the performance measures used should provide a comprehensive evaluation of the proposed fog-based detection system. We evaluate the models via accuracy, precision, recall, f1-measure, and execution time, as explained below.
Accuracy measures the general correctness of the model. It is the ratio of correctly predicted samples to the total samples in the dataset. Mathematically, it is described as:
where TP means the number of true positives, TN means the number of true negatives, FP is the number of false positives, and FN symbolizes the number of false negatives. Accuracy summarizes the model’s performance quickly, but more is needed for imbalanced datasets to describe the classifiers’ performance correctly.
Precision measures the model’s ability to identify positive instances correctly. It is described as the ratio of true positives to the sum of true positives and false positives:
High precision means a low false positive rate, indicating the model’s effectiveness at identifying true positive instances without misclassifying negative instances as positive.
Recall also described as sensitivity or true positive rate, estimates the model’s capacity to recognize all relevant samples. It is described as the ratio of true positives to the sum of true positives and false negatives:
High recall means the model correctly detects most positive samples with a low false negative rate.
The F1 measure, or F1 score, provides a unique metric combining false positives and negatives. The F1 measure is convenient for imbalanced datasets. It is defined as:
The execution time is directed to the model’s time to train on the dataset and construct predictions. It is an essential metric for estimating the model’s efficiency, specifically in real-time applications such as smart grid systems where timely detection of energy theft is necessary. In our work, we measure execution time in seconds. We use a 5-fold validation method with tested models; hence, the execution time over the five folds is averaged and reported. We are aware that the execution time can vary according to the device used and many other aspects, but it is fair to calculate the execution time when we compare two approaches that are run on the same PC. The aim of calculating the execution time is to show the difference between the two approaches, cloud-based vs. fog-based, rather than showing the execution time itself. However, execution times can vary significantly depending on hardware configurations. These configurations include processor type, memory capacity, and parallelization capabilities. Furthermore, in real-world fog environments, conditions such as network latency, node failures, and data synchronization delays might affect the system performance.
Finally, combining the performance measures mentioned comprehensively evaluates the machine learning models used in this study. Accuracy shows an overview of the models’ performance. Meanwhile, precision and recall indicate the models’ capability to identify positive instances correctly. The F1 measure presents a more comprehensive evaluation metric. Execution-time measures reveal the model’s usefulness for real-time applications. All time measures are done using the “timeit” library; the “default_time” model is imported and used in the Python code used through the simulation process.
Smart grid systems are considered an essential component of the IoT. IoT generates enormous amounts of data; to data science, this can be viewed simultaneously as good and bad. Large amounts of data need high transmission, storage, and processing demands. Meanwhile, they are used to build considerable conclusions. This case applies perfectly to our proposed work since the original dataset is huge, and the system is generating a tremendous amount of data over time; fog computing is perfectly suitable for processing this data when the dataset is split between “n” fog nodes, assuming that the area where the data is generated is divided into “n” sub-areas, every fog node receives sufficient amount of data that is enough to build reliable conclusions. To prove or disprove our thesis, we split the data between five nodes and compared the classifiers’ performance with the case where the data are not divided but processed at one cloud center.
In Fig. 4, we present the performance measures of the classifier. Fog bars are related to the case when the data is divided between five fog nodes, while the cloud bars represent the results when cloud/central computing is applied. Fig. 4 represents the results of the multiclass classification for the six theft attacks and the normal class (a total of seven classes). Since this work compares the fog-based and cloud-based approaches, we show the average classification results for the seven classes. In Fig. 4a, the F1-score results are shown for the average F1-measure results for the seven classes, validated and averaged, b, c, and d show the recall, precision, and accuracy respectively, all measured as described in the F1-Measure case.
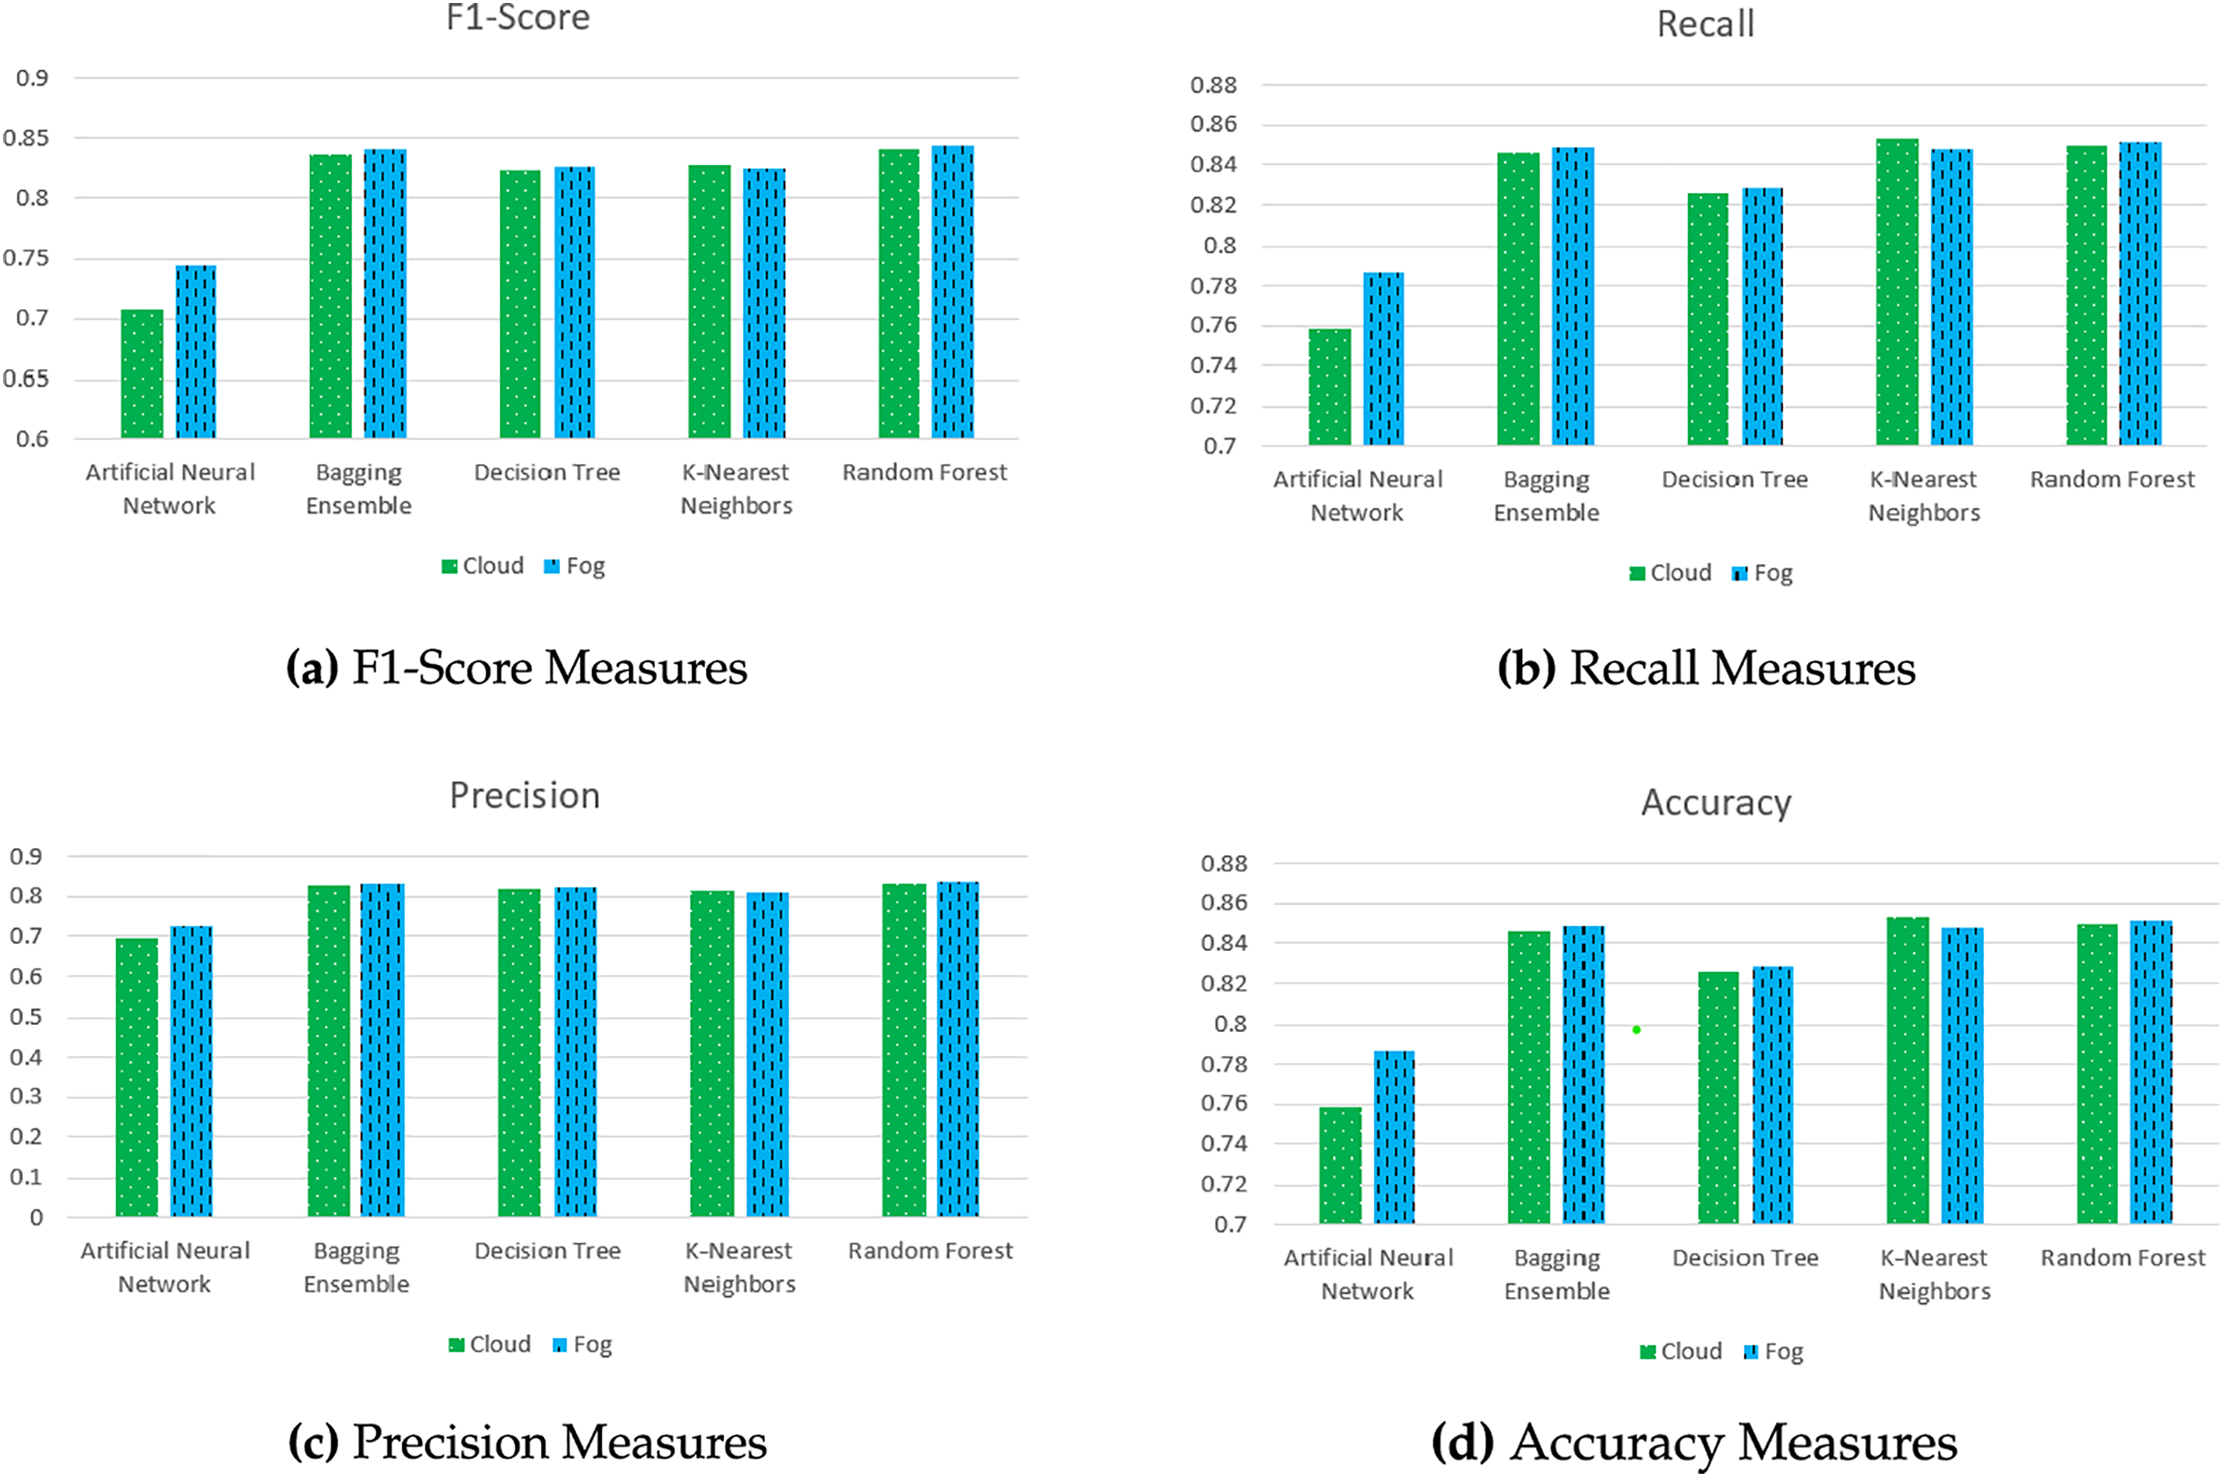
Figure 4: Performance comparison of models
It is obviously clear that the performance in both cases shown in Fig. 4 is close. There is a slight difference in the performance of the ANN model; fog nodes provided better results with this classifier. In general, the four classifiers listed in Fig. 4 have close results as well; this is because the classifiers are robust and reliable. Also, they received sufficient data quality and quantity even when the data was divided between the five fog nodes. It is obviously clear that the performance in both cases shown in Fig. 4 is close. There is a slight difference in the performance of the ANN model; fog nodes provided better results with this classifier. In general, the four classifiers listed in Fig. 4 have close results as well; this is because the classifiers are robust and reliable. Also, they received sufficient data quality and quantity even when the data was divided between the five fog nodes.
The classifiers demonstrate similar performance in Fig. 4. However, the choice of approach or classifier for real-time applications in resource-limited settings depends on several factors, including the time required to train and test the model. In this study, we investigate the execution times of each model in fog-based and cloud-based approaches. Table 4 lists the average times for both methods, calculated using a 5-fold validation process and averaged across five fog nodes. Results reveal significant variances in training and testing times, with cloud-based models taking considerably longer than those in fog nodes.
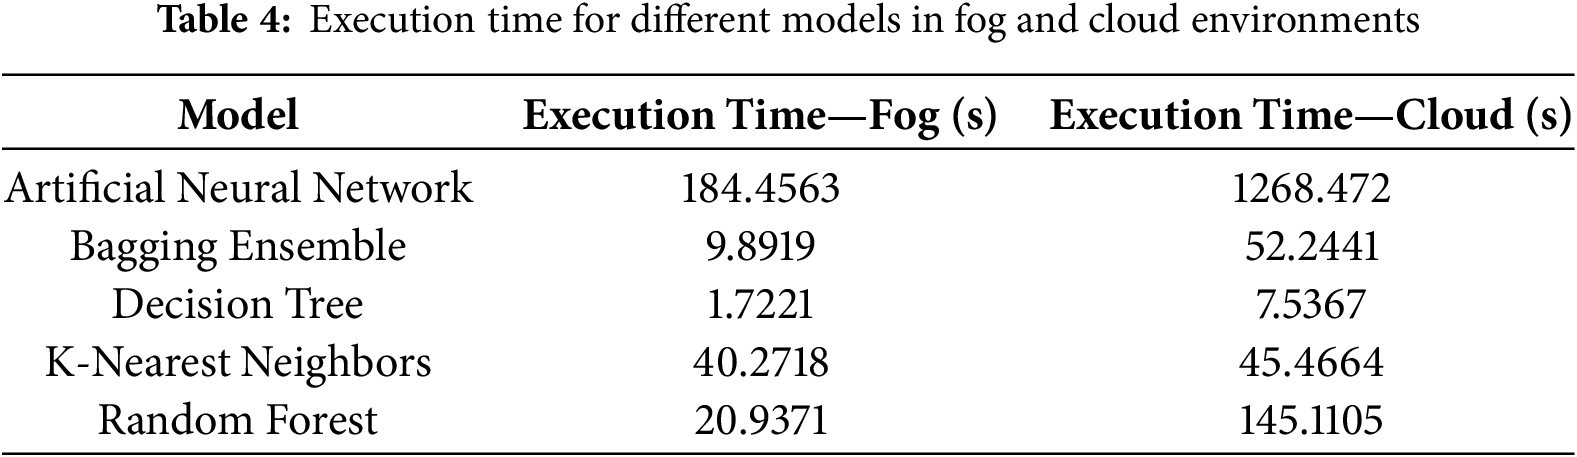
The Artificial Neural Network (ANN) shows the longest execution times—184.46 s in the fog and 1268.47 s in the cloud. This delay is due to the model’s complexity, requiring extensive computational resources for training and inference. While ANNs effectively model complex patterns, their use in time-sensitive applications should be approached cautiously. The results suggest that fog computing enhances the performance of ANNs while reducing resource demands.
The Bagging Ensemble model requires less time, at 9.89 s in the fog and 52.24 s in the cloud, while the Random Forest model executes in 20.94 s in the fog and 145.11 s in the cloud. This indicates that ensemble models like Bagging and Random Forest are suitable for both environments, making fog a practical choice for real-time applications where speed is crucial.
The Decision Tree model has the shortest execution times: 1.72 s in the fog and 7.54 s in the cloud. The K-Nearest Neighbors (KNN) algorithm shows medium execution times of 40.27 and 45.47 s, respectively.
Notably, the standard deviation of performance measures across fog nodes, shown in Fig. 4, did not exceed 0.0045, indicating relatively consistent data subsets.
To evaluate the scalability of our fog-based detection architecture, we extended experiments to configurations with 1 (cloud), 5, 10, and 20 fog nodes. Results in Table 5 demonstrate that increasing the number of fog nodes significantly reduces average execution time. For example, the execution time for the Random Forest model dropped from 145.1 s (cloud) to 20.9 s (5 nodes), 10.3 s (10 nodes), and just 4.2 s (20 nodes). Similar speedups were observed for Bagging Ensemble, Decision Tree, and ANN models.

While execution time improved markedly, some models experienced drops in detection metrics like F1-score and precision with more fog nodes, particularly the ANN model, which reflects reduced training data per node. However, tree-based ensemble models like Random Forest and Bagging maintained high performance in distributed settings.
In practice, the impact of data partitioning on performance is expected to be less severe, as fog nodes accumulate large data volumes over time. Performance degradation for minority classes may be mitigated through techniques like SMOTE, cost-sensitive learning, or model aggregation.
In summary, these results demonstrate the effectiveness of our fog-based approach for real-time, scalable smart grid security, offering flexible trade-offs between latency and detection performance.
Our work deals with the Zero-day attack detection problem as a binary classification problem. The models are trained to distinguish anomalies from normal behavior. The models are trained with attacks Theft (2–6) for the anomaly data, which should be distinguished from normal behavior. After training and testing the classifiers at the cloud center in the cloud-based scenario and at the fog-based scenario in the fog-based scenario, the models’ capability to detect Theft1 attack.
Fig. 5 presents a comparative analysis of the ML models regarding their Zero-Day F1-Score, Recall, Precision, and Accuracy in Fog and Cloud environments. The figure clarifies the models’ capabilities in effectively recognizing previously unknown attacks (Zero-Day attacks) in various scenarios.
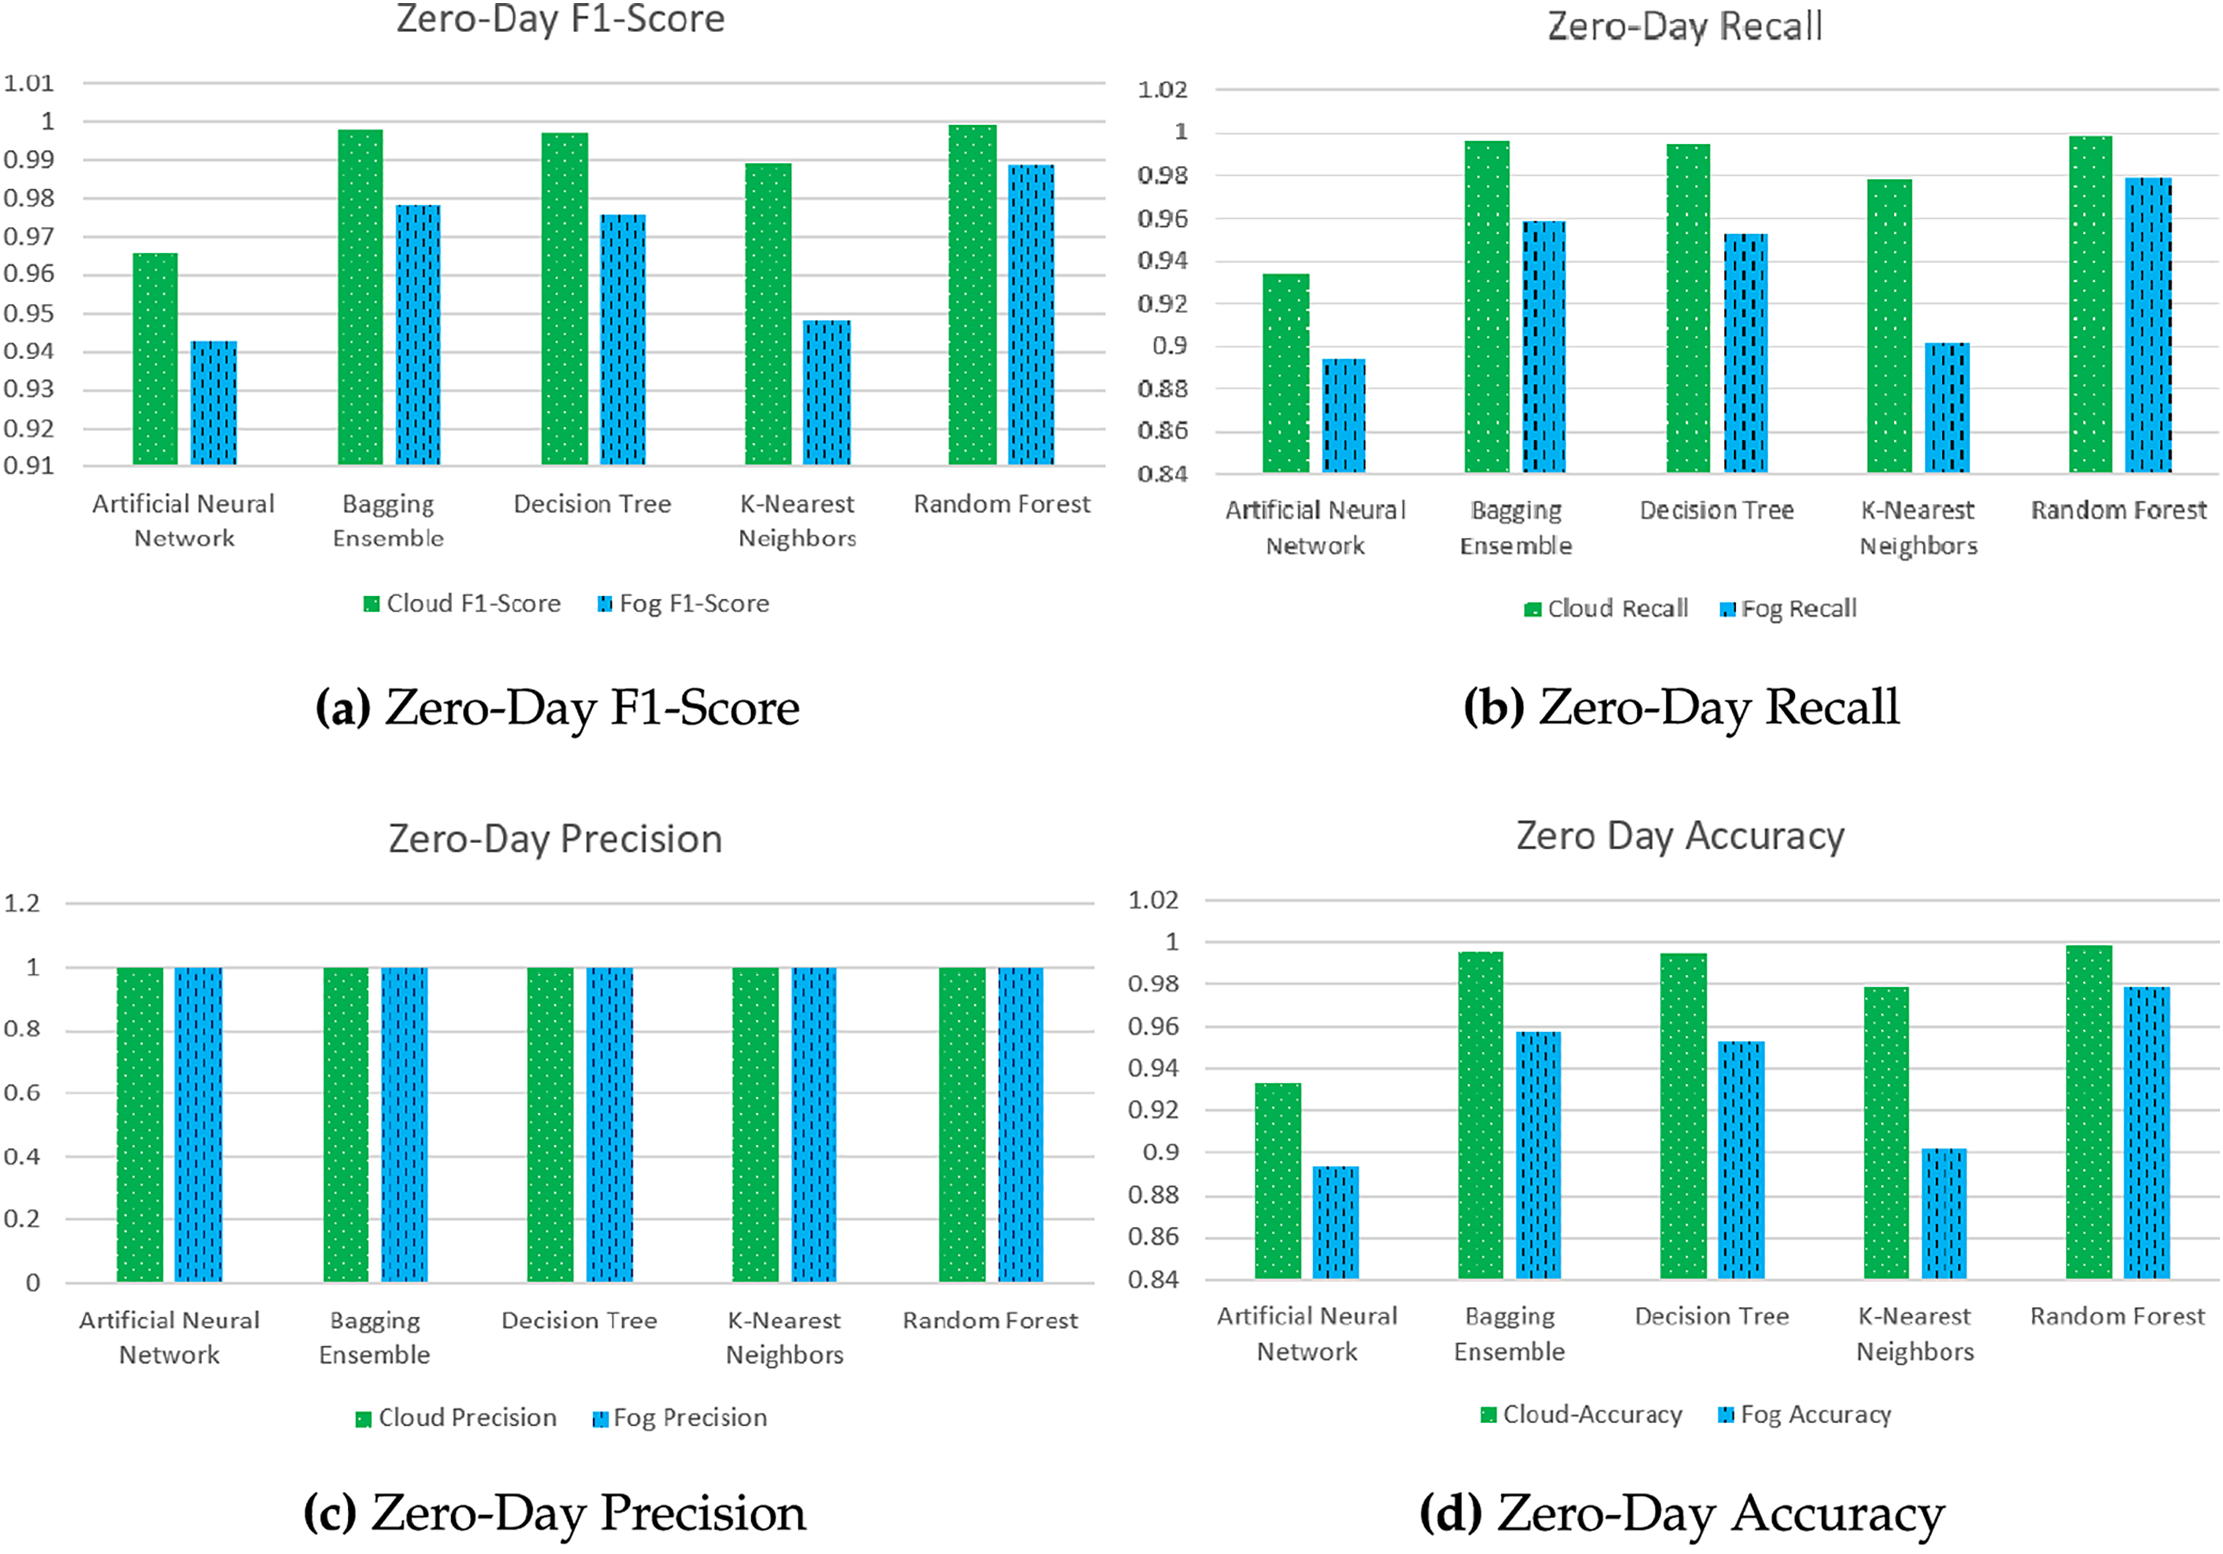
Figure 5: Zero-day attacks detection comparison for different models in cloud and fog environments
The F1-Score (Fig. 5a), which combines precision and recall, is high across all models, indicating a robust Zero-Day attack detection process. The ANN and Random Forest F1-Scores are almost perfect in both environments, emphasizing practical abilities in handling unseen attack patterns. A slight variation between Cloud and Fog environments is negligible.
The comparative analysis of Zero-Day performance metrics in Fig. 5 shows the performance of the ML models in detecting Zero-Day attacks in cloud and fog-based smart grid systems. Generally, the ANN and Random Forest models achieve high scores, which are measured in many metrics. Also, the results show that the Bagging Ensemble and KNN demonstrate robust performance. Decision Trees show a higher rate of false positives than other models. Fog computing can achieve a performance that matches that of cloud computing. Fog computing offers the advantages of decreased latency and improved data privacy. This makes fog computing feasible for real-time Zero-Day attack detection in smart grid systems.
To further evaluate model performance under class imbalance, we report the average ROC-AUC for each classifier in the five-node fog deployment, as shown in Table 6. All models achieved strong discrimination, with Random Forest and Bagging Ensemble outperforming others (ROC-AUC = 0.927 and 0.917, respectively), further validating their robustness for imbalanced smart grid attack detection.

Techniques such as SMOTE are normally used when class imbalance severely affects model performance. However, the models showed robust performance using standard training procedures, with consistently high F1 scores. This indicates a reasonable balance between precision and recall despite the imbalance. Nonetheless, further improvements may be possible by integrating oversampling, undersampling, or cost-sensitive approaches to enhance the detection of underrepresented theft types.
4.5 The Multi-Layered Fog-Based Zero-Day Detection
The presented work suggests a two-layered zero-day attack detection approach. We focus here on detecting energy theft attacks. The two-layered system comprises a fog layer that connects to a subarea inside the SGS area and a centralized cloud center. The first layer should perform a binary classification process to detect abnormal behaviors. The detected abnormal behaviors in the first layer are passed to the next layer, where a multi-class classification occurs.
The proposed multi-layered system, presented in Algorithm 1, is tested and verified via a zero-day attack detection scenario. Table 7 shows the experimental results using Algorithm 1. The experiment was repeated six times every time one of the six theft attacks was dealt with as a zero-day attack; meanwhile, the binary and multi-class classification systems were trained for the remaining five attacks. The first column in Table 7 represents the identity of the zero-day attack. The following four measures are for the binary classifiers used in the fog nodes when trained and tested with the five other attacks. The shown results are for the testing results averaged for five fog nodes used during the experiments. After training and testing the binary classifiers, the model’s ability to detect the anomaly behavior of a zero-day attack is evaluated. Columns 6-10 in Table 7 show the performance measures of the binary classifiers for the zero-day attack. The detected zero-day attacks are then passed to the following layer. The cloud central nodes are trained with all the other attacks to classify the detected zero-day attacks from the fog node into one of the five attacks. In Table 7, we show the majority of every zero-day attack to which classes are classified and the percentage of the attacks classified into that class. For example, in the first row, when the Theft1 attack is dealt with as the zero-day attack, 87.39% of the attacks were classified in the Attack3 class in the central cloud center.

From Table 7, it is evident that training the binary classifiers to distinguish between normal and malicious behaviors enhances their ability to detect unseen malicious behaviors, as reflected in the performance metrics for most theft types.
In examining the Zero-Day Majority Class and Percentage columns, the second layer of the multi-layered system effectively classifies detected anomalies into learned attack categories. Notably, Theft2 is classified solely as Theft3, indicating that the features of Theft2 closely resemble those of Theft3. Additionally, many Theft6 attacks are categorized as Normal, with a 68.77% majority percentage, suggesting that the model perceives these instances as less severe or misclassified due to feature similarity.
A closer look at the classification results reveals that Theft6 was frequently misclassified as normal behavior. This is mainly due to Theft6’s characteristic of reversing consumption readings, which maintains statistical properties similar to normal patterns. This similarity complicates the model’s ability to distinguish between the two.
Moreover, the current feature set may not adequately capture sequence-based anomalies, instead focusing on aggregate or hourly metrics without considering the temporal order. Future research should integrate sequence-aware features—such as temporal correlations and autocorrelation coefficients—and consider time-series models like LSTM or GRU networks to detect subtle temporal shifts effectively.
We estimated the potential impact of bandwidth usage and network latency on real-time detection, assessing communication overhead between fog nodes and the cloud. In our strategy, fog nodes transmit only detection alerts and summary information. Assuming each alert is around 512 bytes and each node generates up to five alerts per second at peak, the average bandwidth per node is
We analyzed common network latency scenarios: a local-area network (LAN) with round-trip latency under 20 ms and a wide-area network (WAN) with latency up to 100 ms. In our multi-layered architecture, alerts are processed locally, with only aggregated anomalies needing synchronization with the cloud. Thus, network latency’s impact on real-time detection is minimal in LAN settings (adding less than 20 ms per synchronization). In WAN environments, detection delays may reach up to 100 ms per event, still acceptable for most smart grid applications, which typically have decision cycles in seconds. Overall, the analysis shows that the communication overhead of the fog-based architecture is negligible, and the impact of network latency on detection timeliness is minimal for practical deployment.
In summary, the experimental results confirm the efficacy of the proposed multi-layered fog-based zero-day detection system. The high-performance metrics across various theft types in both classification layers highlight the approach’s robustness and reliability in real-world smart grid systems. This system not only enhances the detection of known attacks but also significantly improves zero-day attack detection, thereby strengthening the security infrastructure of non-classical SGSs against evolving cyber threats.
In this work, a fog-based approach for energy theft detection is proposed. Also, zero-day attack prevention in fog-based smart grid systems is developed and analyzed. To simulate the fog-based approach, the used dataset is divided among multiple fog nodes, simulating the delivery of the generated energy reading to multiple fog nodes. To prove the effectiveness of the fog-based approach, it is compared to the case when all the data is processed at a central cloud center. The results of the work show comparable results between fog-based and cloud-based scenarios. This study successfully demonstrated that the fog-based approach significantly outperformed cloud-based methods by reducing detection latency by 85% while maintaining accuracy at 98% ranges, as highlighted in the abstract. Meanwhile, the proposed zero-day attack prevention method is a binary classification problem, where the classifiers are trained with certain attacks, and then they are tested to detect unseen attacks. The Zero-day attack prevention shows satisfying and close-to-perfect results. In the future, we wish to study the role of the number of fog nodes in similar problems, especially for smart grid systems. Future work will also explore federated learning in fog environments to handle privacy concerns, integrate real-time anomaly detection, and improve the detection capabilities of subtle zero-day attacks. Federated learning (FL) has emerged as a promising privacy-preserving, distributed training paradigm for smart grid security.. Its effective deployment requires addressing unique challenges in communication efficiency, aggregation strategies, and real-time detection performance. As detailed by Alshehri et al. [32], FL typically achieves detection accuracy comparable to centralized learning, but may incur additional detection latency due to iterative communication and model synchronization.
Acknowledgement: Authors would like to thank the Deanship of Scientific Research at Shaqra University for supporting this research.
Funding Statement: The authors received no specific funding for this study.
Author Contributions: Remah Younisse: Conceptualization, Methodology, Surveying, Writing—Original Draft. Mouhammd AlKasassbeh: Conceptualization, Methodology, Formal Analysis, Supervision. Amjad Aldweesh: Conceptualization, Methodology, Formal Analysis, Proofreading. All authors reviewed the results and approved the final version of the manuscript.
Availability of Data and Materials: There are not datasets used in this work.
Ethics Approval: Not applicable.
Conflicts of Interest: The authors declare no conflicts of interest to report regarding the present study.
References
1. Lepolesa LJ, Achari S, Cheng L. Electricity theft detection in smart grids based on deep neural network. IEEE Access. 2022;10(1):39638–55. doi:10.1109/access.2022.3166146. [Google Scholar] [CrossRef]
2. Eltamaly AM. A novel energy storage and demand side management for entire green smart grid system for NEOM city in Saudi Arabia. Energy Storage. 2024;6(1):e515. doi:10.1002/est2.515. [Google Scholar] [CrossRef]
3. Ahir RK, Chakraborty B. Pattern-based and context-aware electricity theft detection in smart grid. Sustain Energy Grids Netw. 2022;32:100833. doi:10.1016/j.segan.2022.100833. [Google Scholar] [CrossRef]
4. Rao CK, Sahoo SK, Yanine FF. Demand side energy management algorithms integrated with the IoT framework in the PV smart grid system. In: Advanced frequency regulation strategies in renewable-dominated power systems. Amsterdam, The Netherlands: Elsevier; 2024. p. 255–77 doi:10.1016/b978-0-323-95054-1.00007-x. [Google Scholar] [CrossRef]
5. Althobaiti A, Jindal A, Marnerides AK, Roedig U. Energy theft in smart grids: a survey on data-driven attack strategies and detection methods. IEEE Access. 2021;9:159291–312. doi:10.1109/access.2021.3131220. [Google Scholar] [CrossRef]
6. Younisse R, AlKasassbeh M. Evaluating deep learning for detecting data integrity attacks in energy smart grids. In: 2025 International Conference on New Trends in Computing Sciences (ICTCS); 2025 Apr 16–18; Amman, Jordan. p. 368–72. [Google Scholar]
7. Khang A, Abdullayev V, Hahanov V, Shah V. Advanced IoT technologies and applications in the industry 4.0 digital economy. Boca Raton, FL, USA: CRC Press; 2024. [Google Scholar]
8. Younes MB, Boukerche A. SCOOL: a secure traffic congestion control protocol for VANETs. In: 2015 IEEE Wireless Communications and Networking Conference (WCNC); 2015 Mar 9–12; New Orleans, LA, USA. p. 1960–5. [Google Scholar]
9. Al-Ali A, Gupta R, Zualkernan I, Das SK. Role of IoT technologies in big data management systems: a review and smart grid case study. Pervasive Mob Comput. 2024;100(5):101905. doi:10.1016/j.pmcj.2024.101905. [Google Scholar] [CrossRef]
10. Ahmad AYB, William P, Uike D, Murgai A, Bajaj K, Deepak A, et al. Framework for sustainable energy management using smart grid panels integrated with machine learning and iot based approach. Int J Intell Syst Appl Eng. 2024;12(2s):581–90. [Google Scholar]
11. Babar M, Tariq MU, Jan MA. Secure and resilient demand side management engine using machine learning for IoT-enabled smart grid. Sustain Cities Soc. 2020;62:102370. doi:10.1016/j.scs.2020.102370. [Google Scholar] [CrossRef]
12. Ahmad T, Madonski R, Zhang D, Huang C, Mujeeb A. Data-driven probabilistic machine learning in sustainable smart energy/smart energy systems: key developments, challenges, and future research opportunities in the context of smart grid paradigm. Renew Sustain Energ Rev. 2022;160(1):112128. doi:10.1016/j.rser.2022.112128. [Google Scholar] [CrossRef]
13. Alqarqaz M, Bani Younes M, Qaddoura R. An object classification approach for autonomous vehicles using machine learning techniques. World Electr Veh J. 2023;14(2):41. doi:10.3390/wevj14020041. [Google Scholar] [CrossRef]
14. Fettermann DC, Borriello A, Pellegrini A, Cavalcante CG, Rose JM, Burke PF. Getting smarter about household energy: the who and what of demand for smart meters. Build Res Inf. 2021;49(1):100–12. [Google Scholar]
15. Kotsiopoulos T, Sarigiannidis P, Ioannidis D, Tzovaras D. Machine learning and deep learning in smart manufacturing: the smart grid paradigm. Comput Sci Rev. 2021;40(1):100341. doi:10.1016/j.cosrev.2020.100341. [Google Scholar] [CrossRef]
16. Ahmad S, Maorya RK, Kumar A, Kumar S. A review paper on: power theft prevention and detection techniques. In: Smart engineering technology and management. New Delhi, India: Bharti Publications; 2024. p. 313–530. [Google Scholar]
17. Akram J, Tahir A, Munawar HS, Akram A, Kouzani AZ, Mahmud MP. Cloud-and fog-integrated smart grid model for efficient resource utilisation. Sensors. 2021;21(23):7846. doi:10.3390/s21237846. [Google Scholar] [PubMed] [CrossRef]
18. Zhao S, Li F, Li H, Lu R, Ren S, Bao H, et al. Smart and practical privacy-preserving data aggregation for fog-based smart grids. IEEE Trans Inf Forens Secur. 2020;16:521–36. doi:10.1109/tifs.2020.3014487. [Google Scholar] [CrossRef]
19. Zidi S, Mihoub A, Qaisar SM, Krichen M, Al-Haija QA. Theft detection dataset for benchmarking and machine learning based classification in a smart grid environment. J King Saud Univ-Comput Inf Sci. 2023;35(1):13–25. doi:10.1016/j.jksuci.2022.05.007. [Google Scholar] [CrossRef]
20. Guo Y. A review of machine learning-based zero-day attack detection: challenges and future directions. Comput Commun. 2023;198(10):175–85. doi:10.1016/j.comcom.2022.11.001. [Google Scholar] [PubMed] [CrossRef]
21. Hindy H, Atkinson R, Tachtatzis C, Colin JN, Bayne E, Bellekens X. Utilising deep learning techniques for effective zero-day attack detection. Electronics. 2020;9(10):1684. doi:10.3390/electronics9101684. [Google Scholar] [CrossRef]
22. Hseiki H, El-Hajj A, Ajra Y, Hija F, Haidar A. A secure and resilient smart energy meter. IEEE Access. 2024;12:3114–25. doi:10.1109/access.2023.3349091. [Google Scholar] [CrossRef]
23. Khan HM, Jabeen F, Khan A, Badawi SA, Maple C, Jeon G. Hybrid non-technical-loss detection in fog-enabled smart grids. Sustain Energy Technol Assess. 2024;65(12):103775. doi:10.1016/j.seta.2024.103775. [Google Scholar] [CrossRef]
24. Park CH, Kim T. Energy theft detection in advanced metering infrastructure based on anomaly pattern detection. Energies. 2020;13(15):3832. doi:10.3390/en13153832. [Google Scholar] [CrossRef]
25. Haq EU, Pei C, Zhang R, Jianjun H, Ahmad F. Electricity-theft detection for smart grid security using smart meter data: a deep-CNN based approach. Energy Rep. 2023;9(2):634–43. doi:10.1016/j.egyr.2022.11.072. [Google Scholar] [CrossRef]
26. Punmiya R, Choe S. Energy theft detection using gradient boosting theft detector with feature engineering-based preprocessing. IEEE Trans Smart Grid. 2019;10(2):2326–9. doi:10.1109/tsg.2019.2892595. [Google Scholar] [CrossRef]
27. Emadaleslami M, Haghifam MR, Zangiabadi M. A two stage approach to electricity theft detection in AMI using deep learning. Int J Electr Power Energy Syst. 2023;150:109088. [Google Scholar]
28. Yao D, Wen M, Liang X, Fu Z, Zhang K, Yang B. Energy theft detection with energy privacy preservation in the smart grid. IEEE Internet Things J. 2019;6(5):7659–69. doi:10.1109/jiot.2019.2903312. [Google Scholar] [CrossRef]
29. Hairab BI, Elsayed MS, Jurcut AD, Azer MA. Anomaly detection based on CNN and regularization techniques against zero-day attacks in IoT networks. IEEE Access. 2022;10(11):98427–40. doi:10.1109/access.2022.3206367. [Google Scholar] [CrossRef]
30. Younes MB, Alonso GR, Boukerche A. A distributed infrastructure-based congestion avoidance protocol for Vehicular Ad Hoc Networks. In: 2012 IEEE Global Communications Conference (GLOBECOM); 2012 Dec 3–7; Anaheim, CA, USA. p. 73–8. [Google Scholar]
31. Wen M, Xie R, Lu K, Wang L, Zhang K. Feddetect: a novel privacy-preserving federated learning framework for energy theft detection in smart grid. IEEE Internet Things J. 2021;9(8):6069–80. doi:10.1109/jiot.2021.3110784. [Google Scholar] [CrossRef]
32. Alshehri A, Badr MM, Baza M, Alshahrani H. Deep anomaly detection framework utilizing federated learning for electricity theft zero-day cyberattacks. Sensors. 2024;24(10):3236. doi:10.3390/s24103236. [Google Scholar] [PubMed] [CrossRef]
33. Al-Sawwa J, Almseidin M, Alkasassbeh M, Alemerien K, Younisse R. Spark-based multi-verse optimizer as wrapper features selection algorithm for phishing attack challenge. Clust Comput. 2024;27(5):5799–814. doi:10.1007/s10586-024-04272-2. [Google Scholar] [CrossRef]
Cite This Article
 Copyright © 2025 The Author(s). Published by Tech Science Press.
This work is licensed under a Creative Commons Attribution 4.0 International License , which permits unrestricted use, distribution, and reproduction in any medium, provided the original work is properly cited.
 Downloads
 Citation Tools