
 Submit a Paper
 Propose a Special lssue
 Open Access
ARTICLE

RPMS-DSAUnet: A Segmentation Model for the Pancreas in Abdominal CT Images
School of Science, Zhejiang Sci-Tech University, Hangzhou, 310018, China
* Corresponding Author: Xu Li. Email:
Computers, Materials & Continua 2025, 85(3), 5847-5865. https://doi.org/10.32604/cmc.2025.067986
Received 18 May 2025; Accepted 25 July 2025; Issue published 23 October 2025
 View Full Text
 Download PDF
Abstract
Automatic pancreas segmentation in CT scans is crucial for various medical applications including early disease detection, treatment planning and therapeutic evaluation. However, the pancreas’s small size, irregular morphology, and low contrast with surrounding tissues make accurate pancreas segmentation still a challenging task. To address these challenges, we propose a novel RPMS-DSAUnet for accurate automatic pancreas segmentation in abdominal CT images. First, a Residual Pyramid Squeeze Attention module enabling hierarchical multi-resolution feature extraction with dynamic feature weighting and selective feature reinforcement capabilities is integrated into the backbone network, enhancing pancreatic feature extraction and improving localization accuracy. Second, a Multi-Scale Feature Extraction module is embedded into the network to expand the receptive field while preserving feature map resolution, mitigate feature degradation caused by network depth, and maintain awareness of pancreatic anatomical structures. Third, a Dimensional Squeeze Attention module is designed to reduce interference from adjacent organs and highlight useful pancreatic features through spatial-channel interaction, thereby enhancing sensitivity to small targets. Finally, a hybrid loss function combining Dice loss and Focal loss is employed to alleviate class imbalance issues. Extensive evaluation on two public datasets (NIH and MSD) shows that the proposed RPMS-DSAUnet achieves Dice Similarity Coefficients of 85.51% and 80.91%, with corresponding Intersection over Union (IoU) scores of 74.93% and 67.94% on each dataset, respectively. Experimental results demonstrate superior performance of the proposed model over baseline methods and state-of-the-art approaches, validating its effectiveness for CT-based pancreas segmentation.Keywords
Pancreatic cancer is a common type of pancreatic tumor. In 2020, approximately 496,000 new cases of pancreatic cancer were diagnosed worldwide, with 466,000 deaths, reflecting a mortality rate as high as 94%. In China, 120,000 new cases and an equal number of deaths were reported that year, with the annual death-to-incidence ratio approaching 1:1 and a five-year survival rate of merely 5%–10% [1]. According to the 2024 National Cancer Center report, pancreatic cancer ranks among the top five causes of cancer-related deaths in China, accounting for 120,000 fatalities annually, with male mortality rates significantly higher than those of females (notably rising trends in prostate, colorectal, and pancreatic cancer mortality) [2]. Accurate automatic organ segmentation is a prerequisite for quantitative assessment and computer-aided diagnosis. Currently, automated detection and segmentation methods for organs such as the kidney, liver, and heart have achieved a high level of accuracy, with Dice Similarity Coefficients exceeding 90% [3]. However, segmentation of the pancreas, considered one of the most challenging tasks in abdominal organ segmentation, remains difficult due to the variability and complexity of pancreatic regions in CT images [4].
Many traditional methods including thresholding [5], edge-detection [6], clustering [7], and active contour models [8] were proposed to address the demand for efficient and accurate segmentation of target organs in medical images. However, when applied to pancreatic segmentation, these traditional methods perform poorly. More critically, traditional methods heavily rely on manual operations, lack self-learning and adaptation capabilities, and struggle to effectively deal with the interference of artifacts and air shadows, resulting in low-quality segmentation results.
Deep learning has revolutionized medical image segmentation by overcoming traditional methodological limitations. Modern architectures achieve high-precision organ delineation through automated feature extraction and adaptive learning, significantly reducing manual intervention while ensuring computational efficiency. This progress has catalyzed the development of specialized models for various anatomical structures, with performance benchmarks continually advancing across clinical imaging modalities. Despite these advancements, the aforementioned medical image segmentation models face challenges in pancreas segmentation.
• The morphological variability and fuzzy boundaries of the pancreas in CT scans make the extraction of morphological features ineffective.
• The pancreas occupies a minimal proportion of the image. As network depth increases, semantic and spatial information loss occurs, resulting in degraded feature map resolution.
• Severe foreground-background class imbalance biases models toward background prediction. Such imbalance suppresses the semantic representation of the small pancreatic target. Consequently, spatial misalignment arises between reconstructed decoder feature maps and ground truth annotations. This misalignment ultimately leads to suboptimal segmentation performance.
In this paper, a novel RPMS-DSAUnet is proposed for the accuracy segmentation of pancreas. The model consists of the Residual Pyramid Squeeze Attention module, the Multi-Scale Feature Extraction module and the Dimensional Squeeze Attention module. This method demonstrated superior performance on the NIH and MSD datasets. The main contribution of this paper are:
• A Residual Pyramid Squeeze Attention (RPSA) module that employs hierarchical multi-resolution feature extraction using four-scale convolutional kernels (3
• A Multi-Scale Feature Extraction (MS) module is introduced to expand convolution receptive fields while preserving feature map resolution. By integrating multi-scale semantic contexts, it can mitigate network depth-induced feature degradation.
• The decoder implements a Dimensional Squeeze Attention (DSA) module combining spatial compression to suppress irrelevant background regions and channel-wise recalibration to prioritize pancreatic features. This dual mechanism effectively addresses class imbalance by reducing interference from adjacent organs and enhancing small target sensitivity.
To handle foreground-background imbalance and the pancreas’ minimal spatial presence, we use a hybrid loss function combining Focal loss and Dice loss to train the proposed network. Experimental validation demonstrates this loss formulation effectively suppresses irrelevant regions while enhancing focus on target areas, achieving optimal network performance through balanced optimization of class-specific segmentation metrics.
The remainder of this paper is organized as follows: Section 2 reviews related work. Section 3 details the network architecture and module functionalities. Section 4 presents experimental results and comparative analyses with state-of-the-art methods. Section 5 concludes the study with key findings and future research directions.
2.1 Classic U-Net Architecture and Its Variants
The U-Net architecture [9] establishes a foundational framework for medical image segmentation. Its encoder-decoder structure with symmetric skip connections achieves precise boundary localization through multi-resolution feature fusion. However, the symmetric design restricts dynamic interactions across resolutions, leading to inadequate performance when segmenting highly variable pancreatic morphology. To address specific limitations, multiple variants have been proposed.
AttnU-Net [10] introduces spatial attention gates to suppress irrelevant adjacent organs (e.g., liver and spleen), significantly improving pancreatic boundary segmentation. Limited by its local receptive field, it struggles to capture long-range dependencies (e.g., morphological correlations between the pancreatic head and tail). Res-UNet [11] alleviates gradient vanishing via residual connections [12], while UNet++ [13] enhances network flexibility through nested dense skip connections. Nevertheless, both architectures remain constrained by the locality of convolutional operations, lacking global context modeling capabilities (e.g., spatial relationships between the pancreas and surrounding vessels). The nnU-Net framework [14] addresses cross-dataset generalization via automated preprocessing and architecture adaptation. However, its heavy reliance on full supervision limits performance in clinical settings with scarce annotations. Zhang et al. [15] propose a pancreatic segmentation method using lightweight Deep Convolutional Neural Networks (DCNN) modules and spatial prior propagation. By decoupling the complex small-target segmentation task through a twin-network architecture, the approach significantly reduces learning difficulty. Although the current methods can achieve resonable segmentation results, they usually underutilizen 3D spatial neighborhood information, leading to suboptimal accuracy in complex scenarios (e.g., abrupt morphological changes or low-contrast regions).
2.2 Transformer-Based Architectures and Global Context Modeling
Recent studies integrate Transformers to capture global dependencies, overcoming the locality constraints of convolutions. TransUNet [16] and UNETR [17] leverage Transformer self-attention mechanisms [18] to model global context, enhancing robustness to pancreatic morphological variations. However, the quadratic computational complexity of self-attention reduces efficiency in high-resolution. PIS-Unet [19] achieves local-global feature synergy through axial multi-layer perceptrons (MLPs), supporting multi-modal segmentation (e.g., CT-MRI fusion). TCU-Net [20] optimizes segmentation boundaries for peripancreatic vessels (e.g., mesenteric arteries/veins) via cross-scale modules. Despite these advances, few-shot generalization requires improvement, and remain highly sensitive to alignment errors in multi-modal inputs. To address data-hungry training and convergence difficulties in Transformer backbones, the nnTransfer framework [21] innovatively introduces a self-supervised generative model for automated 3D segmentation and quantification of pancreatic fat infiltration. This model autonomously captures shared anatomical representations, focusing on peripancreatic texture features and fat infiltration patterns. It accelerates convergence through parameter transfer initialization of segmentation network weights. DA-TransUNet [22] balances accuracy and efficiency via dual-attention mechanisms combined with Transformers, excelling in small-target structures (e.g., pancreas and polyps). However, segmentation insufficiency persists in low-contrast scenarios (e.g., fat-infiltrated pancreatic edges) or morphologically variant organs (e.g., atrophic pancreatitis). Hybrid architectures like DTU-Net [23] integrate DenseASPP for multi-scale feature extraction with Transformer attention, yet high model complexity hinders clinical deployment. Other studies incorporate anatomical priors. Zhang et al. [24] combine multi-atlas registration with 3D deformation constraints, though cross-institution stability requires further optimization.
This paper proposes an end-to-end semantic segmentation model named RPMS-DSAUnet, which is an acronym derived from the names of the three added modules. As shown in Fig. 1, our model processes 256
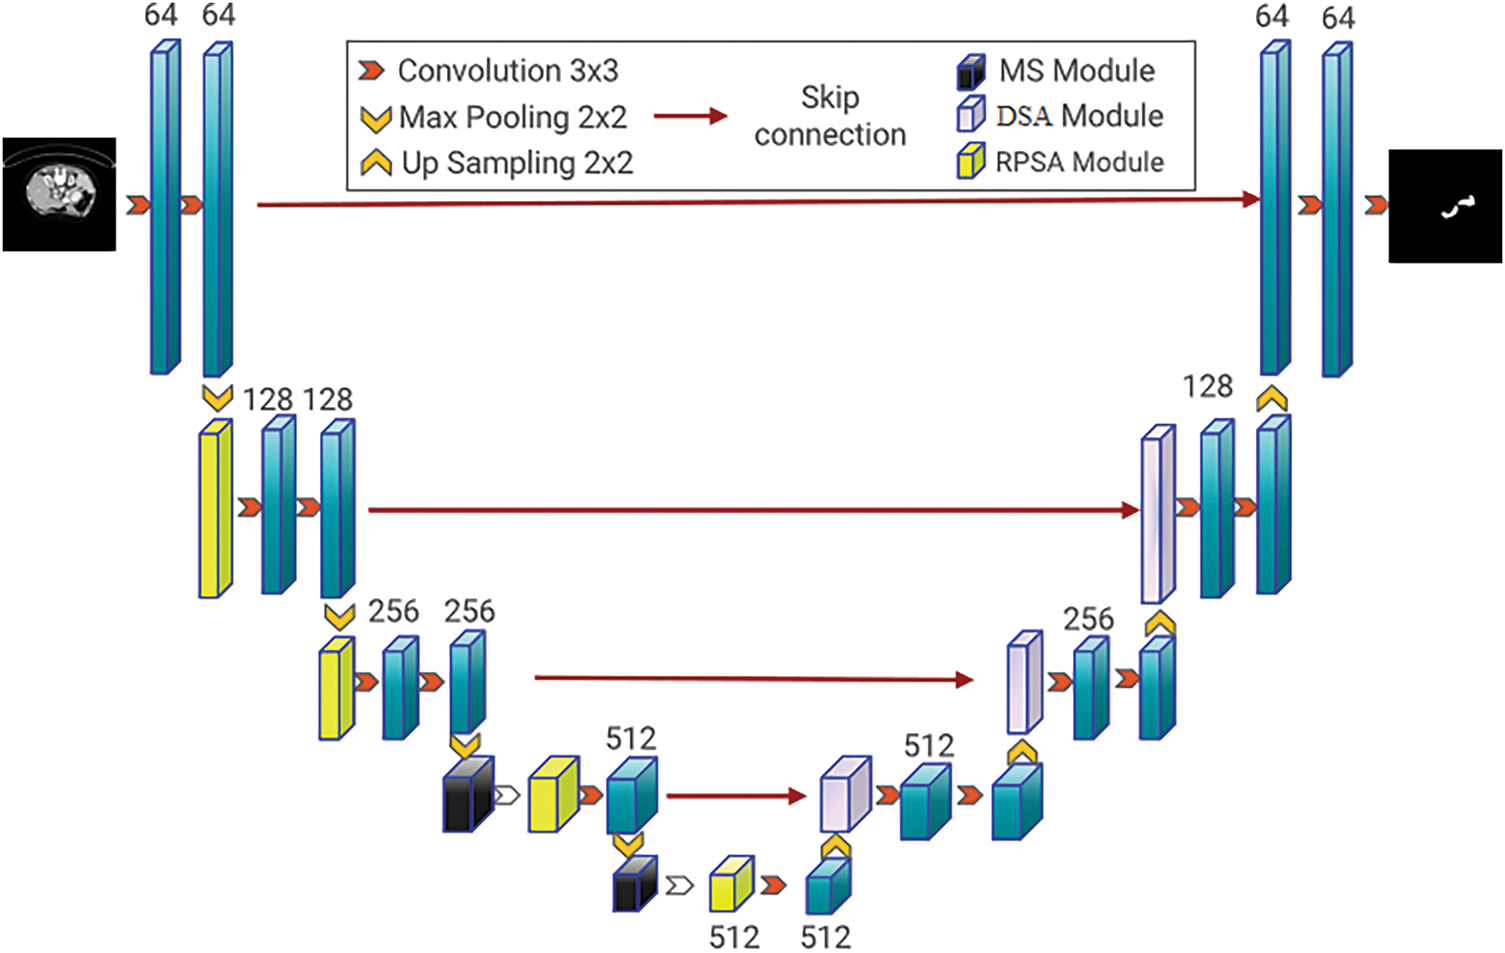
Figure 1: RPMS-DSAUnet network structure diagram
3.2 Residual Pyramid Squeeze Attention
Effective feature extraction is the foundation of precise segmentation algorithms. However, the small size, morphological variability and blurry boundaries of the pancreas make this task difficult. To obtain more complete feature information at the encoder stage, inspired by the Pyramid Squeeze Attention (PSA) module proposed [25], this paper introduces the Residual Pyramid Squeeze Attention (RPSA) module, as illustrated in Fig. 2.
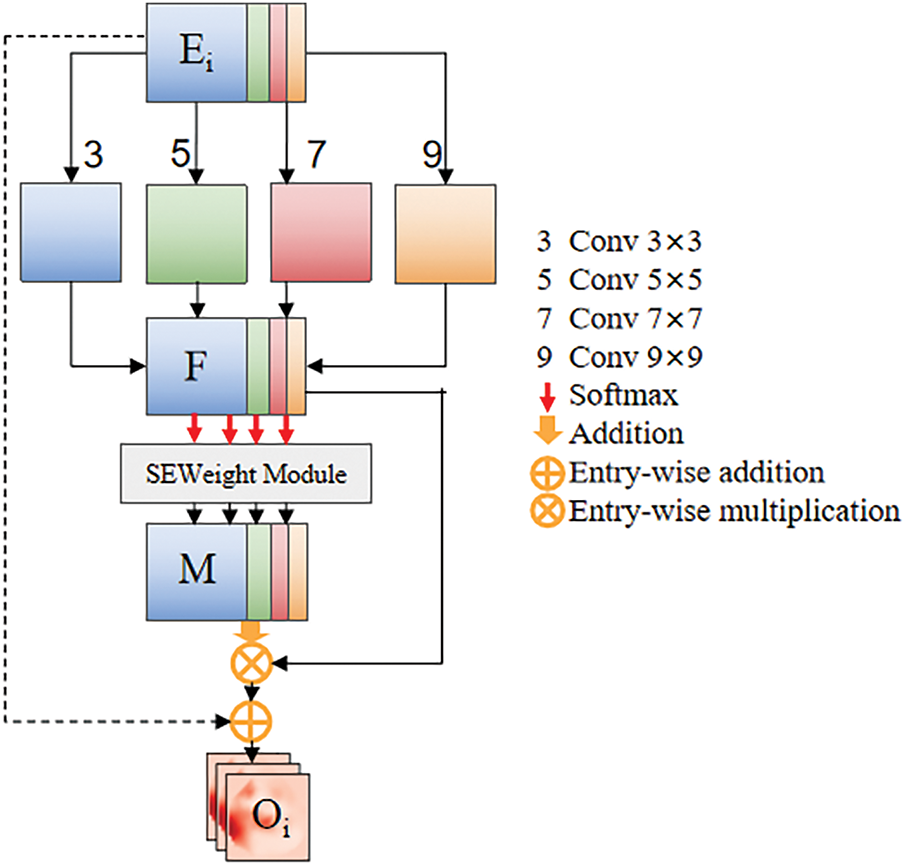
Figure 2: Residual pyramid squeeze attention module
To address the issues of anatomical distortion caused by excessive background suppression during channel-wise weighting in the original PSA module and the loss of high-frequency details due to progressive downsampling in deep networks, this study constructs a cross-layer feature compensation mechanism by introducing residual identity mapping. This design achieves dynamic fusion of multi-scale local details (e.g., pancreatic duct edge gradients) and global semantics (e.g., pancreatic morphological distribution). The proposed RPSA module forces the learning of residual attention mappings, which can effectively reduce gradient decay and suppress high-frequency information loss. Additionally, this module simultaneously extracts channel attention and spatial attention from feature maps while maintaining high efficiency and cost-effectiveness.
Specially, the input feature map
For each divided channel feature map, we employ four convolutional kernel sizes tailored to pancreatic anatomical characteristics, enabling multi-scale spatial information extraction: 1) Small 3
here
Then, the multi-scale feature maps are concatenated to obtain the feature map F. The formula for calculating F is given in Eq. (3):
After extracting multi-scale features, it is necessary to extract channel attention weights for the feature maps
• Squeeze:
• Excitation:
• Reweight:
Here,
The entire calculation process for the multi-scale channel attention weight vector W can be formulated by Eq. (7):
where
In order to achieve information interaction, softmax is further utilized to set weights for the channel attention information.
Finally, to prevent the module from losing its original spatial structure during the learning process, a residual structure is added on the existing basis, resulting in a feature map
Next, the feature map
here
3.3 Extraction of Multi-Scale Semantic Information
The RPSA module can achieve multi-scale feature extraction through channel grouping, but it lacks the ability to capture spatial multi-scale information. Therefore, network deepening may lead to spatial information loss. To compensate for the shortcomings of the RPSA module and extract richer spatial semantic information, the Multi-Scale (MS) module is designed as shown in Fig. 3. This module acquires multi-scale information based on pancreatic distribution characteristics in medical images, followed by feature fusion to enhance channel-wise feature representation. The proposed design effectively mitigates valid information loss caused by network depth, enabling deep encoders to extract more critical pancreatic region features. Initially, a
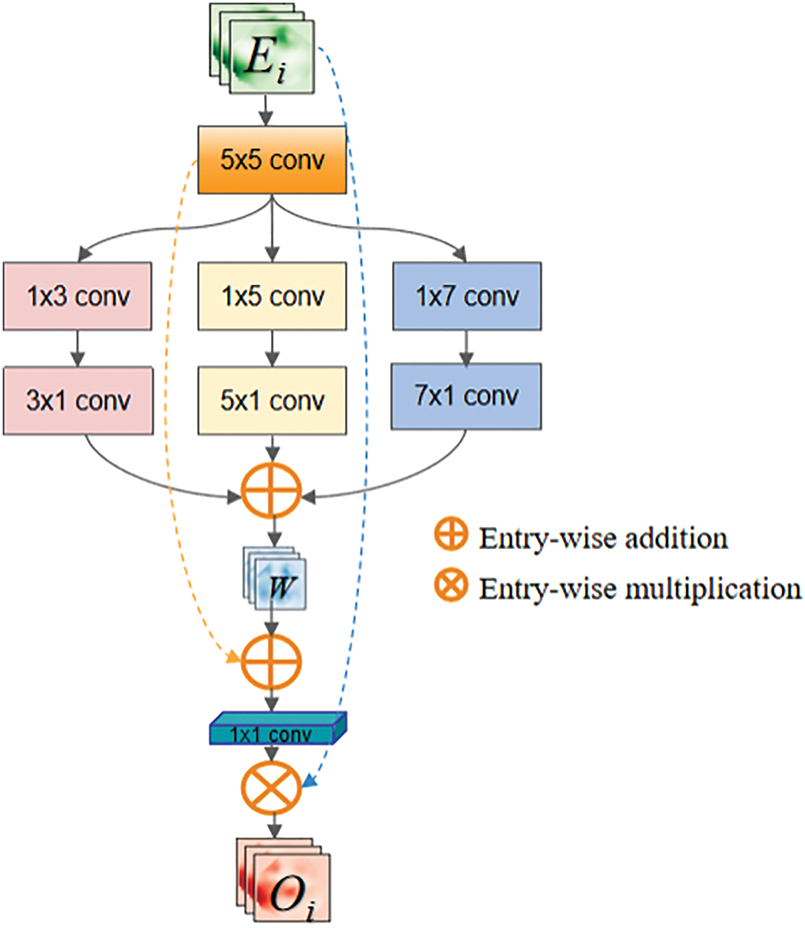
Figure 3: Multi-scale feature extraction module
The multi-scale depthwise separable convolutions can capture information of different scales and orientations in the image. The extracted features
Multiply W and
3.4 Multi-Dimensional Squeeze Attention Module
The input of the DSA module consists of two parts: the feature map extracted by the encoder and the upsampled feature map from the decoder.
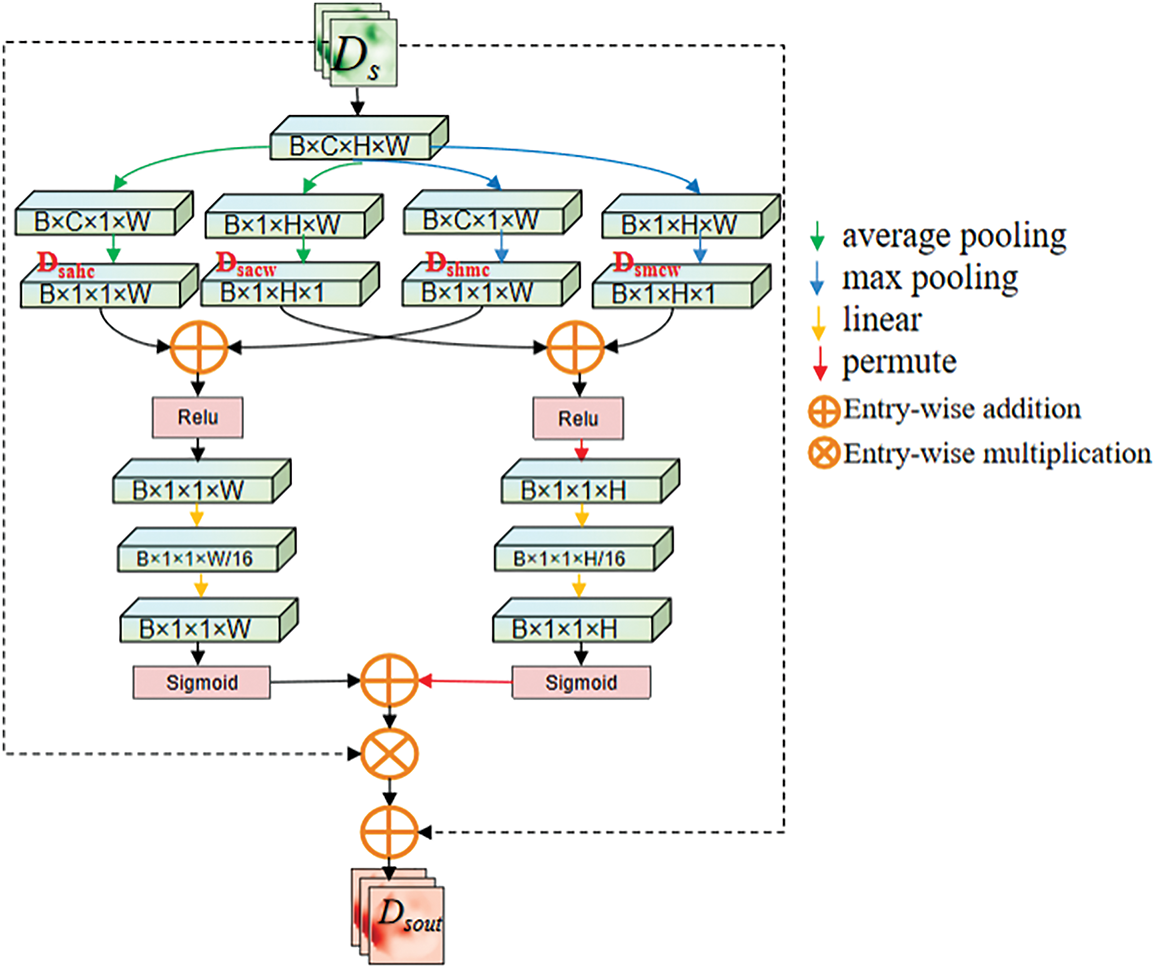
Figure 4: Spatial compression module
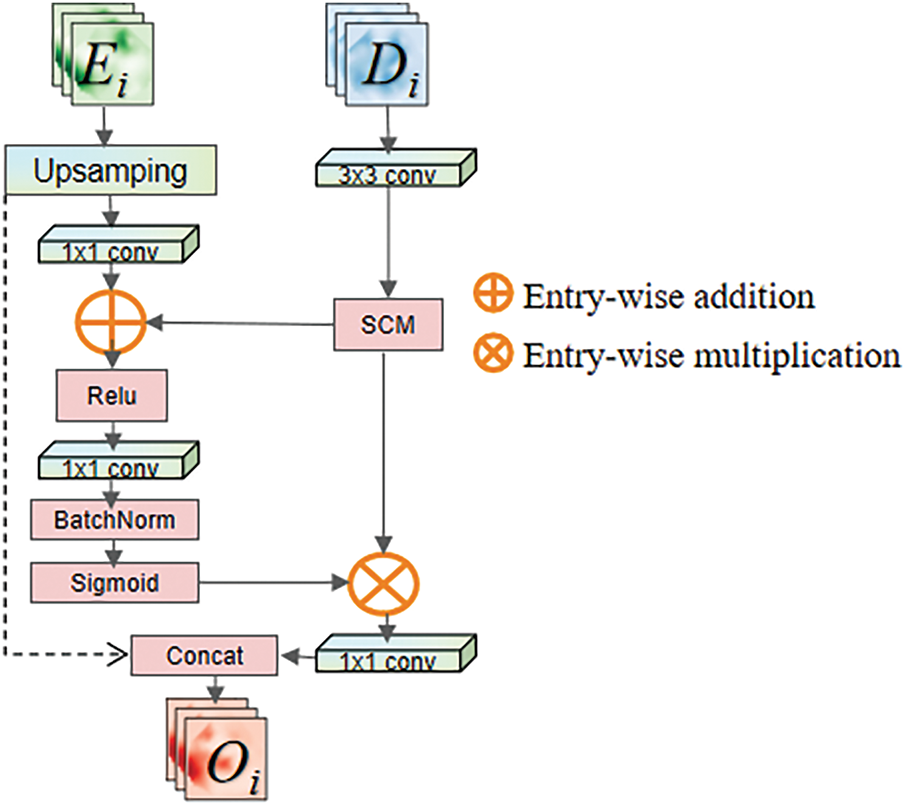
Figure 5: Multi-dimensional squeeze attention module
After inputting the feature map
Here
The feature map
To aggregate information between different layers of the network using soft attention while mitigating the gradient vanishing issue during model training, a residual structure is applied in this module. Firstly, the feature map F undergoes channel reshaping through a
In this equation, the
To make the network focus more on the pancreas area and exclude the influence of surrounding organs, it is necessary to eliminate redundant information and extract relationships between adjacent channel pixel. To address this issue, this paper proposes the Spatial Compression Module (SCM), which is inspired by the Squeeze-and-Excitation (SE) module proposed by Hu et al. [26]. The Spatial Compression Module (SCM) processes the input feature map
1. Height-compressed branch (
2. Channel-compressed branch (
After being squeezed, the feature map outputs a channel feature vector and a spatial feature vector with a global receptive field. Then, as described in Fig. 4, information aggregation is performed on the output feature map
The calculation of
Subsequently, the fully connected layers are used to reshape the channel and spatial information separately, mapping important information into a new space. Using two fully connected layers with a dimensionality reduction followed by an expansion helps to reduce computational complexity. During the processing of
• Spatial downscaling (reducing H and C dimensions)
• Global context capture (integrating cross-organ topology).
It can effectively suppress interference from adjacent organs (e.g., duodenum, spleen) and enhance pancreatic boundary localization. This design leverages joint optimization of spatial-channel redundancy reduction, which is critical for segmenting small, low-contrast anatomical targets (e.g., the pancreas) in medical images.
In our experiments, we used the sum of Focal loss [27] and Dice loss [28] as the final loss function. The expression of Focal loss is shown as follows:
and the Dice loss, which is effective for categories imbalance, can be define as:
so the loss function consists of the following:
We evaluate the performance of the proposed network on two public datasets: 1) 80 abdominal contrast-enhanced CT scans from the National Institutes of Health (NIH) Clinical Center pancreas segmentation dataset [29], which is the most widely used publicly dataset for the pancreas segmentation task. The CT images and label images in the original data were converted to PNG format. The CT image slices have a thickness of 1.5 to 2.5 mm and were acquired using Philips and Siemens Multidetector CT (MDCT) scanners, saved in DICOM format (.dcm). The label images in this dataset are divided into background and pancreatic regions. The pancreas was manually segmented slice-by-slice by a medical student and then reviewed and revised by an experienced radiologist. The label images are saved in NifTi format (.nii). The CT images have a resolution of 512
The network in this chapter utilizes PyTorch and is trained in an end-to-end manner on an NVIDIA A6000 GPU with CUDA 12.4 support. The network optimizer is SGD with the optimizer momentum set to 0.99 and (weight-decay = 3e–4) to suppress overfitting. The batch size for training is set to 2, and the initial learning rate is set to 0.005. The learning rate is updated according to “ExponentialLR”, which can be expressed by Formula (32).
where
To assess the performance of pancreas segmentation, this paper uses the Dice Similarity Coefficients(Dice), Intersection over Union (IoU), and Precision (Pr) to quantitatively evaluate the segmentation results. The values of both Dice and IoU range from [0, 1], where a value of 0 indicates a completely failed segmentation, and a value of 1 indicates a perfect segmentation. Their calculation formulas are shown in (33)–(35).
4.4 Experimental Results and Analysis
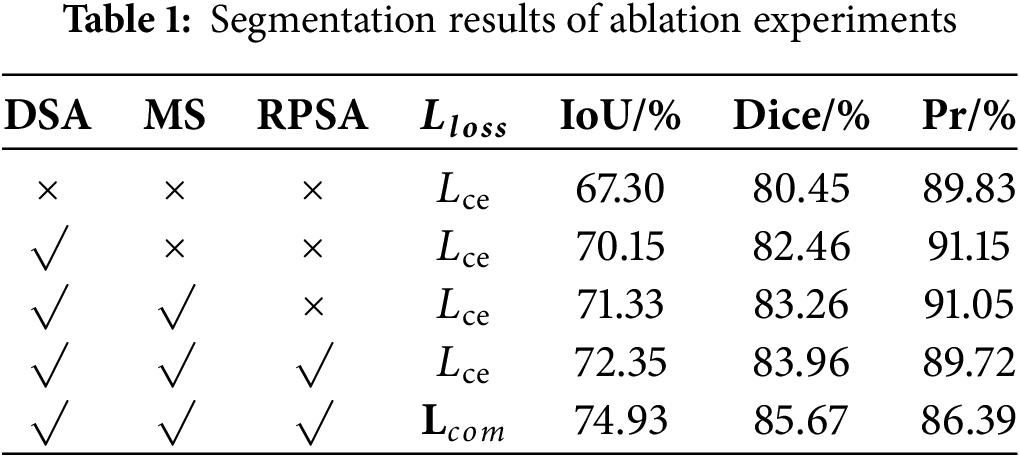
4.4.1 Ablation Experiments and Results Analysis
To validate the effectiveness of each added module in the model, we conduct the following experiments. Based on the original backbone network, the DSA module, MS module, and RPSA module were sequentially integrated, using the loss function tailored for pancreas segmentation. The experimental results are presented in Table 1. After adding the relevant modules to the U-shaped backbone network, the final Dice and IoU improved by 5.22% and 7.63%, respectively. According to the definitions of the Dice and IoU, the overlap between the prediction results and the ground truth increased, and the similarity between the two sets improved, resulting in optimized segmentation performance. The experimental results indicate that the proposed model can clearly locate the pancreas and effectively identify its boundary structures.
The Loss curve of the model presented in this paper is shown in Fig. 6. Fig. 6 demonstrates that the convergence speed and convergence results of the model in this paper are both relatively excellent.
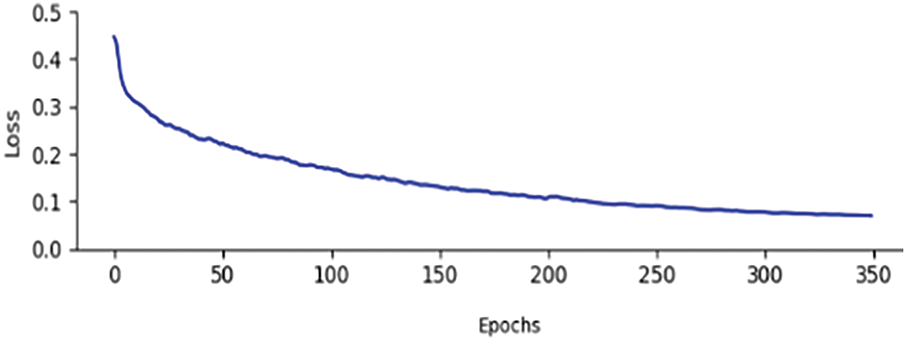
Figure 6: Training curve of the proposed model
Experimental observations indicated that Dice and IoU metric enhancements were accompanied by marginal precision declines. This phenomenon originated from the original U-shaped backbone network progressively misclassifying background regions as segmentation targets, thereby inflating baseline precision measurements. Furthermore, mathematical formulations were derived to establish the inverse correlation between Dice/IoU increments and pixel accuracy (Pr) decrements. The complete derivation process was formalized in Eqs. (36)–(38).
As shown in the aforementioned formula, GT represents the groundtruth, and PD represents the prediction result. Since the total number of pixels in the groundtruth remains unchanged, when the positive impact of the increase in True Positives (TP) on the Dice outweighs the negative impact of the decrease in Precision on Dice, the value of Dice will also increase accordingly. Therefore, the improvement in the Dice and the decrease in pixel accuracy (Pr) are not contradictory. This further demonstrates that with the improvement of the network model, the model performance has been enhanced, avoiding predicting more background as the segmentation target.
Fig. 7 displays the segmentation results of the ablation experiments. From it, we can observe that after adding the DSA module, some erroneous segmentation foregrounds are suppressed. By further incorporating the MS module, the model can learn more accurate pancreatic structures. Finally, by incorporating the RPSA module, the model not only improves its ability to extract boundary information but also focuses on the overall shape features of the pancreas. Additionally, employing the
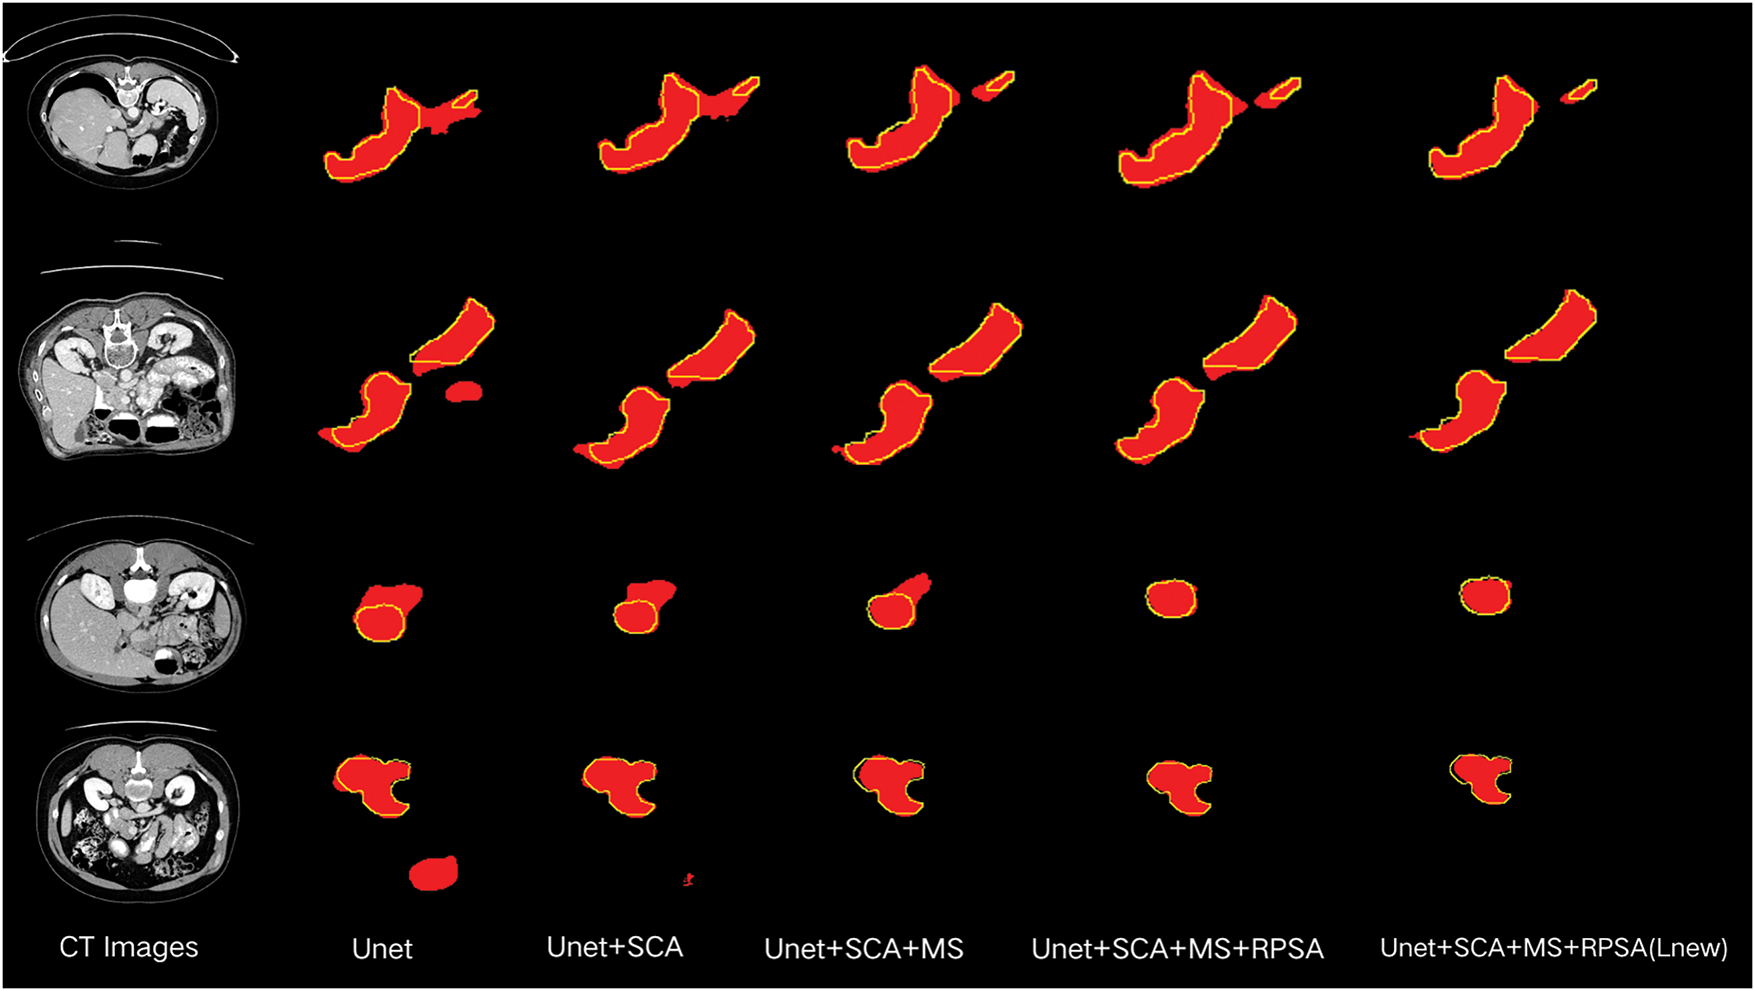
Figure 7: Diagram of ablation experiment results. The red patches represent the segmentation results of the model, and the yellow lines outline the groundtruth
4.4.2 Experimental Results on NIH dataset
To further validate the effectiveness of the proposed model, comparative experiments were conducted with current mainstream models on the NIH dataset. These models include U-Net [9], AttnU-Net [10], RefineNet [11], U-Net++ [13], UNETR [17], TransUnet [16] and DA-TransUnet [22]. Table 2 presents the Dice and IoU obtained by the above-mentioned models.
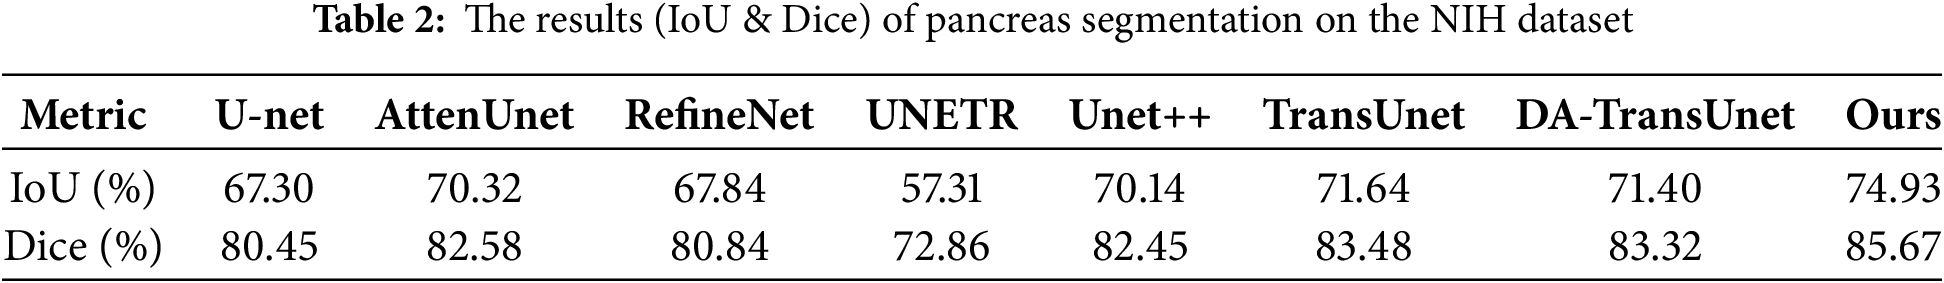
The experimental results presented in Table 2 demonstrate that the IoU and Dice obtained by the proposed model are higher than those of the aforementioned classic network models. This indicates that the segmentation results produced by our network have a higher degree of overlap with the groundtruth labels than the compared models, showing that the proposed model for the pancreas is effective.
In Fig. 8, comparisons reveal the qualitative segmentation results of the proposed model and compared models. From Fig. 8, it can be observed that the proposed model performs better in challenging scenarios where local and overall structures are ambiguous. When U-Net is used for pancreas segmentation, its single-scale convolutional kernels and simple skip connections result in less accurate segmentation and poorer structure representation. AttenU-Net, which introduces an attention mechanism based on U-Net, can further extract information and pay more attention to the pancreas region. ReFineNet effectively combines features at different scales through long residual connections and multi-resolution fusion to generate high-resolution semantic feature maps. However, redundancy information may lead to misclassification. UNETR employs pure Transformers as encoder to learn sequential representations and capture global multi-scale information, but may lose local details in pancreas segmentation tasks. UNet++ adopts the structure of U-Net and incorporates DenseNet’s [32] dense connections. This dense connection approach preserves and reconstructs both global and local information. Generally, UNet++ can recognize the overall structure of the pancreas, but may also introduce redundant information. DA-TransUNet still struggles with edge segmentation in low-contrast scenarios (e.g., fat-infiltrated pancreatic boundaries) and morphologically variant organs (e.g., atrophic pancreatitis). This failure stems from its limited adaptive feature extraction, which compromises boundary delineation. However, in more complex cases, it may face issues of under-segmentation or over-segmentation.
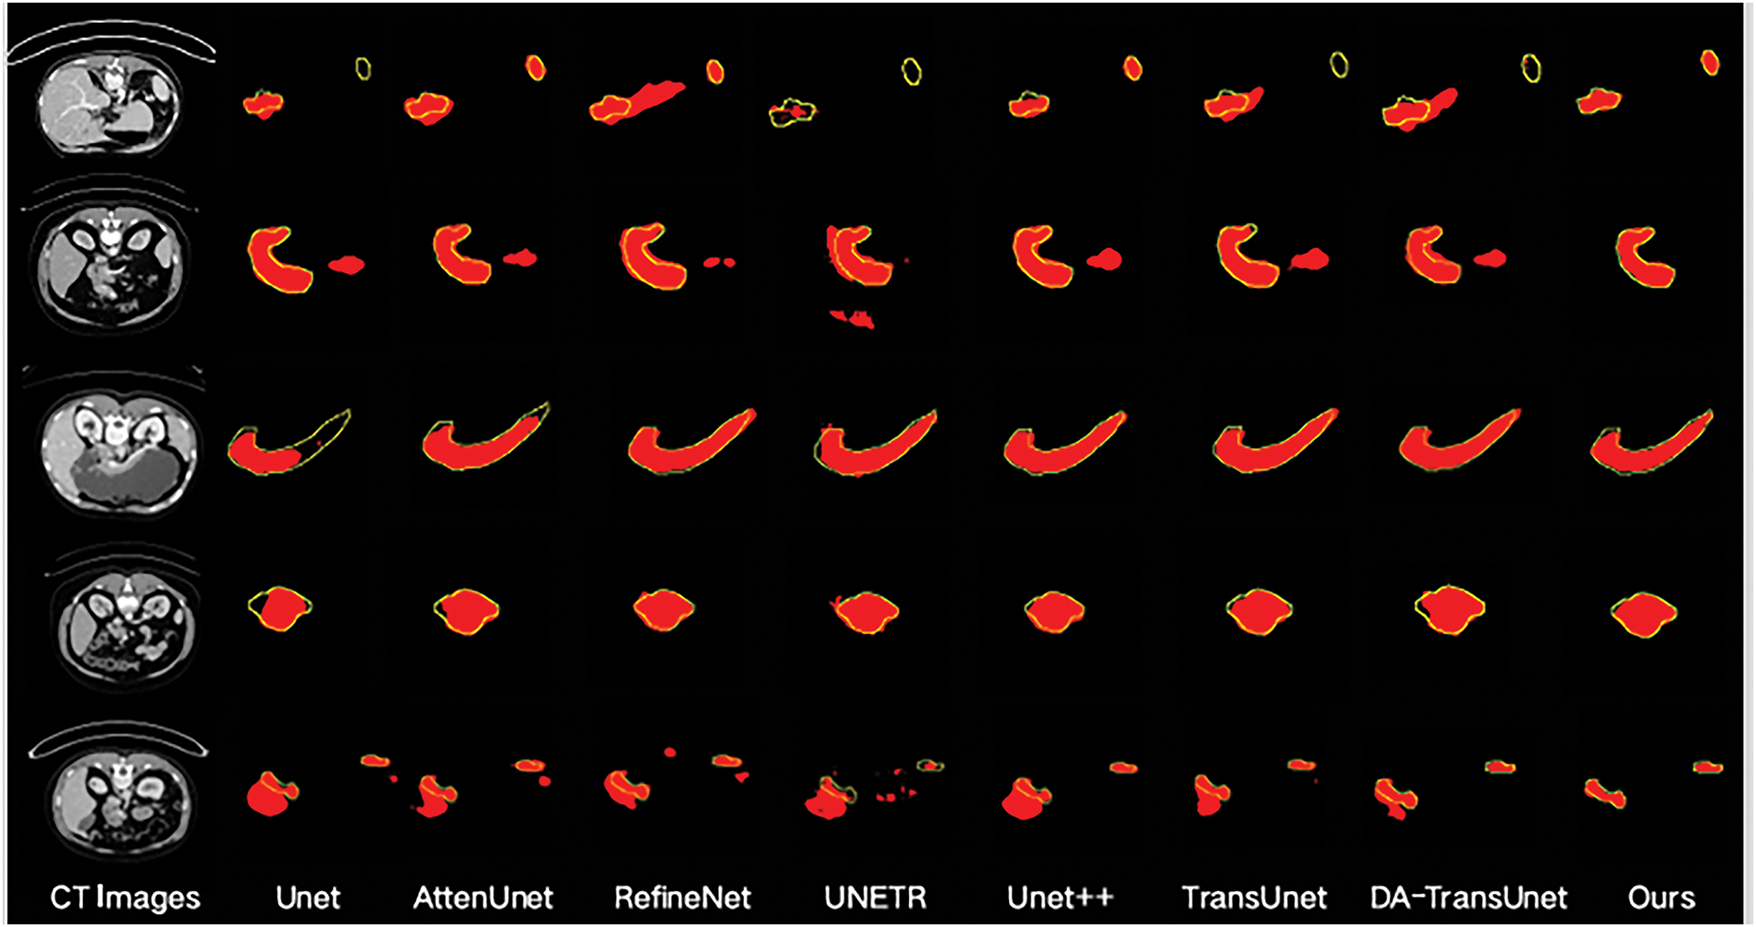
Figure 8: Segmentation results of different models. The red patches represent the segmentation results of the model, and the yellow lines outline the groundtruth
Compared to the other networks, the proposed model exhibits superior segmentation performance. The DSA module effectively combines information from the encoder and decoder, screening feature information in both spatial and channel dimensions to better restore the feature map. Furthermore, the MS module enlarges the network’s receptive field. This allows it to focus on the overall structure of the pancreas, preventing inadequate segmentation. At the same time, the MS module integrates features of different scales, enriching the features that enter the decoder. Finally, the RPSA module not only extracts useful information from the encoder part but also strengthens the pancreas feature information and suppresses redundant information, making the model pay more attention to the pancreas area.
4.4.3 Experimental Results on MSD Dataset
Table 3 shows the comparison of the proposed network with the seven aforementioned models.
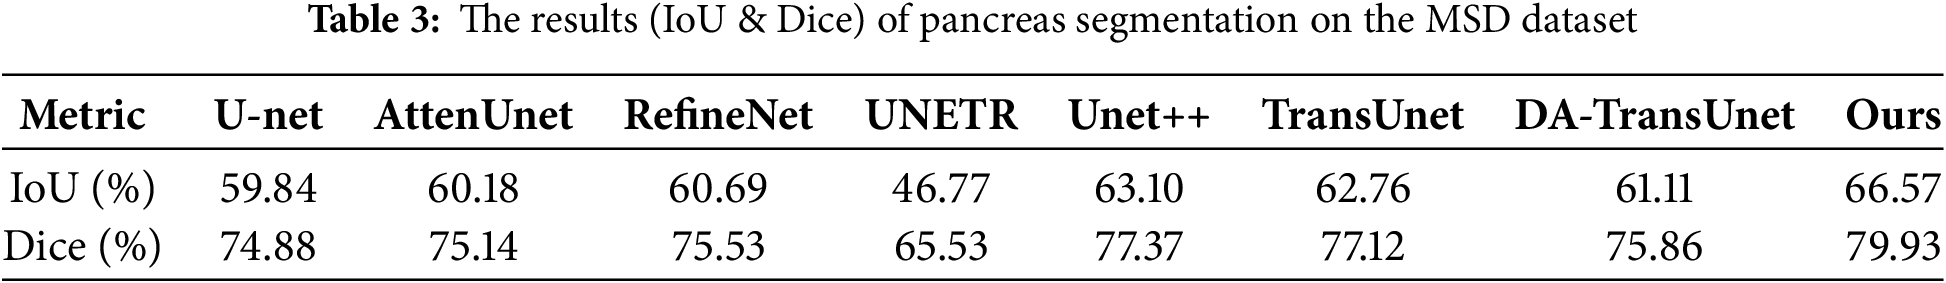
As shown in Table 3, the proposed network achieves a Dice scores of 66.57% and an IoU scores of 79.93% on the MSD dataset, demonstrating significant advantages compared to state-of-the-art methods.
Fig. 9 exhibits the qualitative segmentation results of the proposed model and compared models on the MSD dataset, which reflects our network’s ability to achieve accurate segmentation of the pancreas across different datasets.
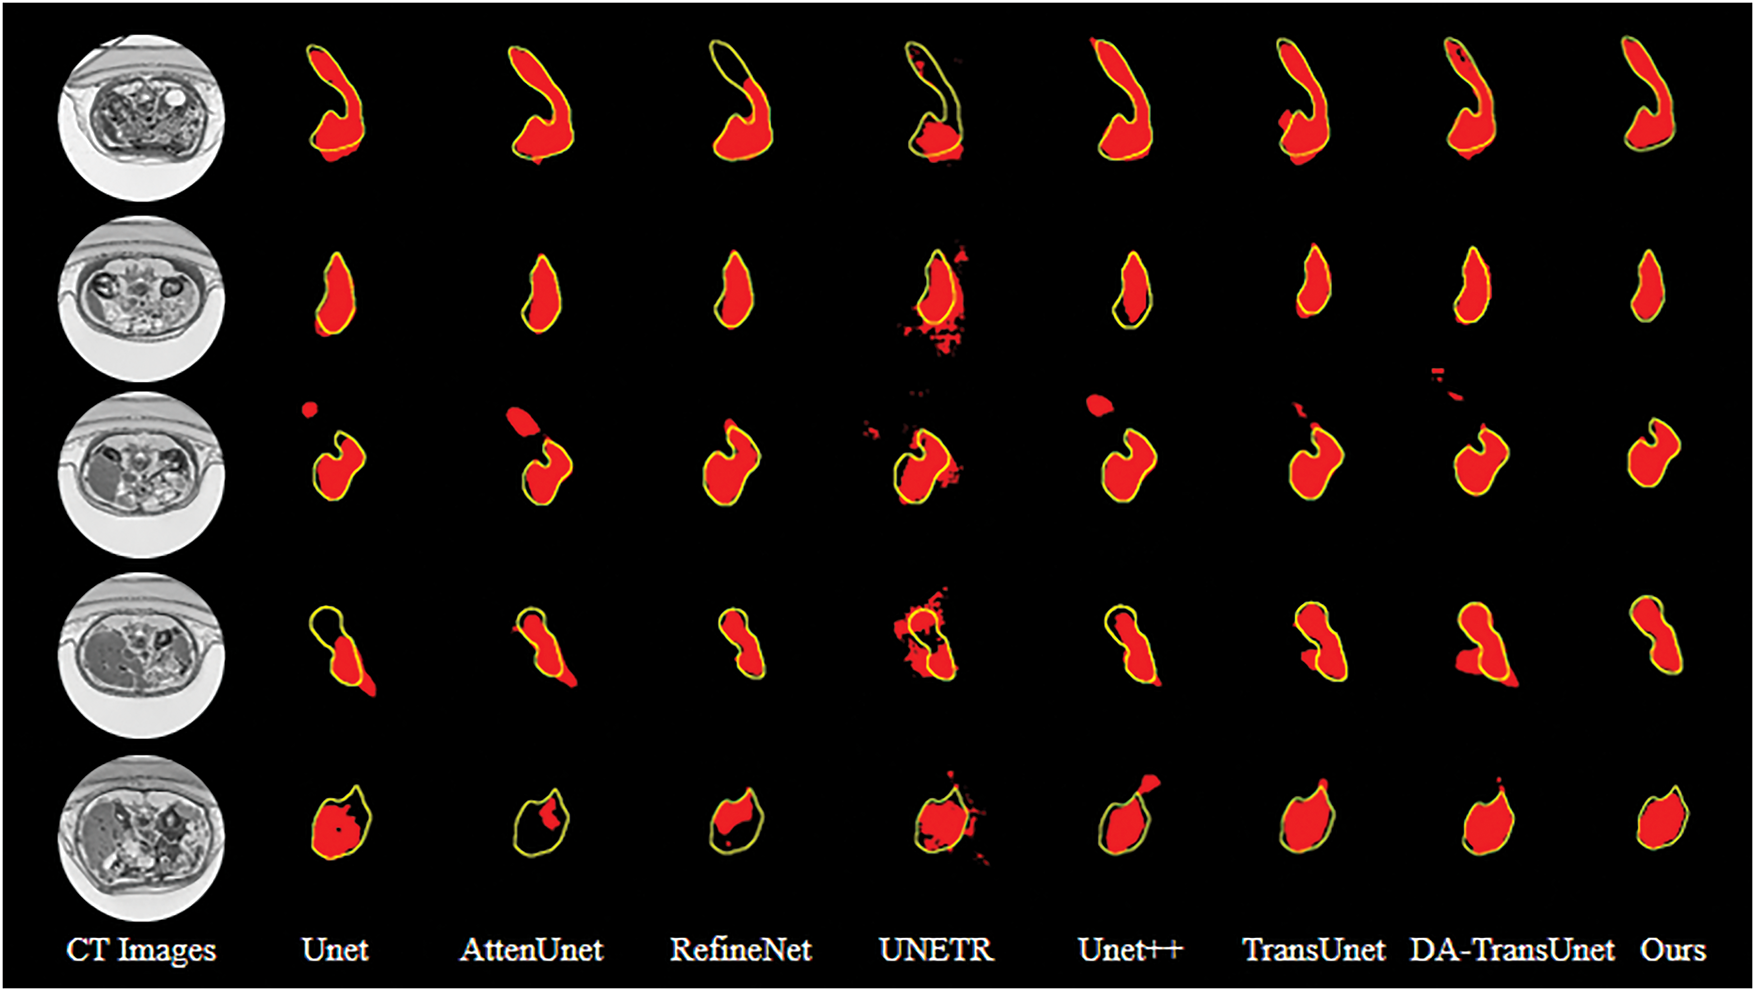
Figure 9: Segmentation results of different models. The red patches represent the segmentation results of the model, and the yellow lines outline the groundtruth
Pancreas segmentation in abdominal CT images faces significant challenges due to the organ’s morphological variability, blurred boundaries, semantic information loss from its small anatomical footprint, and severe foreground-background class imbalance. To systematically address these limitations, we propose the RPMS-DSAUnet. The approach has three pivotal strengths: firstly, the RPSA module extracts critical feature information to enhance target identification accuracy; secondly, the MS module expands the convolutional kernels’ receptive field while integrating multi-scale semantic information to mitigate feature map degradation caused by network depth; finally, the DSA module combines spatial dimension reduction with global context capture through spatial squeeze operations and channel attention mechanisms, effectively suppressing irrelevant regions while highlighting critical areas for feature map restoration.
In summary, the combination of these modules establishes a cohesive framework that solves boundary ambiguity through adaptive spatial weighting, preserves fine-grained details via multi-scale context aggregation, and optimizes feature alignment using cross-dimensional attention. The proposed RPMS-DSAUnet delivers a robust solution for precise pancreatic segmentation in abdominal CT imaging, demonstrating superior capability in handling anatomical variability and class imbalance.
Our future work will focus on: (1) Optimizing computational efficiency of the DSA module for real-time clinical deployment; (2) Extending validation to multi-center datasets to enhance model generalizability.
Acknowledgement: Not applicable.
Funding Statement: This research was supported by the National Natural and Science Foundation of China under Grant No. 12301662, and Zhejiang Provincial Natural Science Foundation of China under Grant No. LQ21F030019.
Author Contributions: Study conception and design: Tiren Huang, Chong Luo, Xu Li; Data collection: Xu Li; Analysis and interpretation of results: Tiren Huang, Xu Li; Draft manuscript preparation: Chong Luo, Xu Li. All authors reviewed the results and approved the final version of the manuscript.
Availability of Data and Materials: The NIH dataset is openly available in the Cancer Imaging Archive (TCIA) at https://www.cancerimagingarchive.net/collection/pancreas-ct/ (accessed on 24 July 2025). The MSD dataset is available from http://medicaldecathlon.com/ (accessed on 24 July 2025).
Ethics Approval: Not applicable.
Conflicts of Interest: The authors declare no conflicts of interest to report regarding the present study.
References
1. Sung H, Ferlay J, Siegel RL. Global cancer statistics 2020: GLOBOCAN estimates of incidence and mortality worldwide for 36 cancers in 185 countries. CA A Cancer J Clin. 2021;71(3):209–49. doi:10.3322/caac.21660. [Google Scholar] [PubMed] [CrossRef]
2. Han B, Zheng R, Zeng H, Wang S, Sun K, Chen R, et al. Cancer incidence and mortality in China, 2022. J Natl Cancer Cent. 2024;4(1):47–53. doi:10.1016/j.jncc.2024.01.006. [Google Scholar] [PubMed] [CrossRef]
3. Zhou SK, Greenspan H, Davatzikos C, Duncan JS, van Ginneken B, Madabhushi A, et al. A review of deep learning in medical imaging: imaging traits, technology trends, case studies with progress highlights, and future promises. Proc IEEE Inst Electr Electron Eng. 2021;109(5):820–38. doi:10.1109/JPROC.2021.3054390. [Google Scholar] [PubMed] [CrossRef]
4. Huang M, Huang C, Yuan J. Fixed-point deformable U-Net for pancreas CT segmentation. In: Proceedings of the Third International Symposium on Image Computing and Digital Medicine; 2019 Aug 24–26; Xi’an, China. p. 283–7. doi:10.1145/3364836.3364894. [Google Scholar] [CrossRef]
5. Wang C, Yang J, Lv H. Otsu multi-threshold image segmentation algorithm based on improved particle swarm optimization. In: 2019 IEEE 2nd International Conference on Information Communication and Signal Processing (ICICSP); 2019 Sep 28–30; Weihai, China. p. 440–3. doi:10.1109/ICICSP48821.2019.8958573. [Google Scholar] [CrossRef]
6. Kozegar E, Soryani M, Behnam H. Mass segmentation in automated 3-D breast ultrasound using adaptive region growing and supervised edge-based deformable model. IEEE Trans Med Imaging. 2018;37(4):918–28. doi:10.1109/TMI.2017.2787685. [Google Scholar] [PubMed] [CrossRef]
7. Ng HP, Ong SH, Foong KWC, Goh PS, Nowinski WL. Medical image segmentation using K-means clustering and improved watershed algorithm. In: IEEE Southwest Symposium on Image Analysis and Interpretation; 2006 Mar 26–28; Denver, CO, USA. p. 61–5. doi:10.1109/ssiai.2006.1633722. [Google Scholar] [CrossRef]
8. Kim J, Çetin M, Willsky AS. Nonparametric shape priors for active contour-based image segmentation. Signal Process. 2007;87(12):3021–44. doi:10.1016/j.sigpro.2007.05.026. [Google Scholar] [CrossRef]
9. Ronneberger O, Fischer P, Brox T. U-Net: convolutional networks for biomedical image segmentation. Med Image Comput Comput-Assist Interv. 2015;9351:234–41. [Google Scholar]
10. Oktay O, Schlemper J, Folgoc LL, Lee M, Heinrich M, Misawa K, et al. Attention U-Net: learning where to look for the pancreas. arXiv:1804.03999. 2018. [Google Scholar]
11. Diakogiannis FI, Waldner F, Caccetta P, Wu C. ResUNet-a: a deep learning framework for semantic segmentation of remotely sensed data. ISPRS J Photogramm Remote Sens. 2020;162:94–114. doi:10.1016/j.isprsjprs.2020.01.013. [Google Scholar] [CrossRef]
12. He K, Zhang X, Ren S, Sun J. Deep residual learning for image recognition. In: 2016 IEEE Conference on Computer Vision and Pattern Recognition (CVPR); 2016 Jun 27–30; Las Vegas, NV, USA. p. 770–8. [Google Scholar]
13. Zhou Z, Siddiquee MMR, Tajbakhsh N. UNet++: redesigning skip connections to exploit multiscale features in image segmentation. IEEE Trans Med Imaging. 2020;39(6):1856–67. doi:10.1109/tmi.2019.2959609. [Google Scholar] [PubMed] [CrossRef]
14. Isensee F, Jaeger PF, Kohl SAA, Petersen J, Maier-Hein KH. nnU-Net: a self-configuring method for deep learning-based biomedical image segmentation. Nat Methods. 2020;18(2):203–11. doi:10.1038/s41592-020-01008-z. [Google Scholar] [PubMed] [CrossRef]
15. Zhang D, Zhang J, Zhang Q, Han J, Han J. Automatic pancreas segmentation based on lightweight DCNN modules and spatial prior propagation. Pattern Recognit. 2020;114(6):107762. doi:10.1016/j.patcog.2020.107762. [Google Scholar] [CrossRef]
16. Chen J, Lu Y, Yu Q, Luo X, Adeli E, Wang Y, et al. TransUNet: transformers make strong encoders for medical image segmentation. arXiv:2102.04306. 2021. [Google Scholar]
17. Hatamizadeh A, Yang D, Tang Y, Nath V, Myronenko A, Landman B, et al. UNETR: transformers for 3D medical image segmentation. In: 2022 IEEE/CVF Winter Conference on Applications of Computer Vision (WACV); 2022 Jan 3–8; Waikoloa, HI, USA. p. 1748–58. [Google Scholar]
18. Vaswani A, Shazeer N, Parmar N, Uszkoreit J, Jones L, Gomez AN, et al. Attention is all you need. In: Advances in neural information processing systems (NeurIPS). Red Hook, NY, USA: Curran Associates Inc.; 2017. p. 5998–6008. [Google Scholar]
19. Zhang C, Wang J. PIS-Net: efficient medical image segmentation network with multivariate downsampling for point-of-care. Entropy. 2024;26(4):284. doi:10.3390/e26040284. [Google Scholar] [PubMed] [CrossRef]
20. Shi Z, Li Y, Zou H. TCU-Net: transformer embedded in convolutional U-shaped network for retinal vessel segmentation. Sensors. 2023;23(10):4897. doi:10.3390/s23104897. [Google Scholar] [PubMed] [CrossRef]
21. Zhang G, Zhan Q, Gao Q, Mao K, Yang P, Gao Y, et al. Automated pancreatic segmentation and fat fraction evaluation based on a self-supervised transfer learning network. Comput Biol Med. 2024;170(Suppl 1):107989. doi:10.1016/j.compbiomed.2024.107989. [Google Scholar] [PubMed] [CrossRef]
22. Sun G, Pan Y, Kong W, Xu Z, Ma J, Racharak T, et al. DA-TransUNet: integrating spatial and channel dual attention with transformer U-net for medical image segmentation. Front Bioeng Biotechnol. 2024;12:1398237. doi:10.3389/fbioe.2024.1398237. [Google Scholar] [PubMed] [CrossRef]
23. Fei C, Luo J. DTUnet: a transformer-based UNet combined with DenseASPP module for pancreas segmentation. In: 2022 15th International Congress on Image and Signal Processing, BioMedical Engineering and Informatics (CISP–BMEI); 2022 Nov 5–7; Beijing, China. p. 1–7. doi:10.1109/CISP-BMEI56279.2022.9980137. [Google Scholar] [CrossRef]
24. Zhang Y, Wu J, Liu Y, Chen Y, Chen W, Wu EX, et al. A deep learning framework for pancreas segmentation with multi-atlas registration and 3D level-set. Med Image Anal. 2021;68(2):101884. doi:10.1016/j.media.2020.101884. [Google Scholar] [PubMed] [CrossRef]
25. Zhang H, Zu K, Lu J, Zou Y, Meng D. EPSANet: an efficient pyramid split attention block on convolutional neural network. arXiv:2105.14447. 2021. [Google Scholar]
26. Hu J, Shen L, Sun G. Squeeze-and-excitation networks. In: 2018 IEEE/CVF Conference on Computer Vision and Pattern Recognition; 2018 Jun 18–23; Salt Lake City, UT, USA. p. 7132–41. doi:10.1109/CVPR.2018.00745. [Google Scholar] [CrossRef]
27. Lin TY, Goyal P, Girshick R, He K, Dollár P. Focal loss for dense object detection. In: 2017 IEEE International Conference on Computer Vision (ICCV); 2017 Oct 22–29; Venice, Italy. p. 2999–3007. doi:10.1109/ICCV.2017.324. [Google Scholar] [CrossRef]
28. Milletari F, Navab N, Ahmadi SA. V-Net: fully convolutional neural networks for volumetric medical image segmentation. In: 2016 Fourth International Conference on 3D Vision (3DV); 2016 Oct 25–28; Stanford, CA, USA. p. 565–71. doi:10.1109/3DV.2016.79. [Google Scholar] [CrossRef]
29. Roth HR, Lu L, Farag A, Shin HC, Liu J, Turkbey E, et al. DeepOrgan: multi-level deep convolutional networks for automated pancreas segmentation. arXiv:1506.06448. 2015. [Google Scholar]
30. Simpson AL, Antonelli M, Bakas S, Bilello M, Farahani K, van Ginneken B, et al. A large annotated medical image dataset for the development and evaluation of segmentation algorithms. arXiv:1902.09063. 2019. [Google Scholar]
31. Li J, Lin X, Che H, Li H, Qian X. Pancreas segmentation with probabilistic map guided bi-directional recurrent UNet. Phys Med Biol. 2021;66(11):115010. doi:10.1088/1361–6560/abfce3. [Google Scholar] [PubMed] [CrossRef]
32. Huang G, Liu Z, Van Der Maaten L, Weinberger KQ. Densely connected convolutional networks. In: 2017 IEEE Conference on Computer Vision and Pattern Recognition (CVPR); 2017 Jul 21–26; Honolulu, HI, USA. p. 2261–9. doi:10.1109/CVPR.2017.243. [Google Scholar] [CrossRef]
Cite This Article
 Copyright © 2025 The Author(s). Published by Tech Science Press.
This work is licensed under a Creative Commons Attribution 4.0 International License , which permits unrestricted use, distribution, and reproduction in any medium, provided the original work is properly cited.
 Downloads
 Citation Tools