
 Submit a Paper
 Propose a Special lssue
 Open Access
ARTICLE

Enhanced Multimodal Sentiment Analysis via Integrated Spatial Position Encoding and Fusion Embedding
1 School of Cyber Security and Information Law, Chongqing University of Posts and Telecommunications, Chongqing, 400065, China
2 School of Communication and Information Engineering, Chongqing University of Posts and Telecommunications, Chongqing, 400065, China
3 Jiangxi Provincial Key Laboratory of Electronic Data Control and Forensics (Jiangxi Police College), Nanchang, 330100, China
4 Key Laboratory of Intelligent Control and Optimization for Industrial Equipment of Ministry of Education, Dalian University of Technology, Dalian, 116024, China
* Corresponding Author: Chenquan Gan. Email:
Computers, Materials & Continua 2025, 85(3), 5399-5421. https://doi.org/10.32604/cmc.2025.068126
Received 21 May 2025; Accepted 26 August 2025; Issue published 23 October 2025
 View Full Text
 Download PDF
Abstract
Multimodal sentiment analysis aims to understand emotions from text, speech, and video data. However, current methods often overlook the dominant role of text and suffer from feature loss during integration. Given the varying importance of each modality across different contexts, a central and pressing challenge in multimodal sentiment analysis lies in maximizing the use of rich intra-modal features while minimizing information loss during the fusion process. In response to these critical limitations, we propose a novel framework that integrates spatial position encoding and fusion embedding modules to address these issues. In our model, text is treated as the core modality, while speech and video features are selectively incorporated through a unique position-aware fusion process. The spatial position encoding strategy preserves the internal structural information of speech and visual modalities, enabling the model to capture localized intra-modal dependencies that are often overlooked. This design enhances the richness and discriminative power of the fused representation, enabling more accurate and context-aware sentiment prediction. Finally, we conduct comprehensive evaluations on two widely recognized standard datasets in the field—CMU-MOSI and CMU-MOSEI to validate the performance of the proposed model. The experimental results demonstrate that our model exhibits good performance and effectiveness for sentiment analysis tasks.Keywords
With the increasing prevalence of social media, individuals are progressively inclined to utilize diverse forms of data to articulate their ideological perspectives and emotional sentiments on these platforms. Early sentiment analysis was limited to mining and analyzing emotional tendencies and stances related to specific subjects using single-modal data, such as text [1]. This approach overlooks the rich emotional information contained in various modalities, such as voice and video, complicating the accurate analysis of emotional tendencies in many contexts. Consequently, the scope of multimodal sentiment analysis encompasses a wide range of information domains, including text, audio, and video [2]. The field has gained attention due to its capacity to process complex data [3]. Moreover, its ability to extract authentic emotions and opinions from multimodal data facilitates applications in practical areas, such as social recommendation [4], trust management [5], and mental health [6].
Multimodal data encompasses an extensive and complex range of information dimensions. Taking text as an example, simple phrases such as “I didn’t expect you at this time” may imply anger in an isolated text, while “You’re a genius” directly conveys surprise, and “Why did you come to me again?” may imply dissatisfaction or disgust. However, when we introduce non-textual cues such as speech and video as auxiliary analysis tools, the boundaries of these emotional interpretations become blurred and enriched. For example, the first phrase, with a cheerful tone and a video background of hugs, may transform into joy at the visit of an intimate friend. If a self-deprecating or regretful expression accompanies the second phrase, it may express self-blame for the wrong behavior rather than pure praise. In the scene where the other person appears with a smiling face, the third phrase is likely to be transformed into an unexpected joy at the visit of the person you admire. As shown in Fig. 1, this example of multimodal sentiment analysis vividly demonstrates the power of the comprehensive study. In [7], the combination of the three modal data achieves 80.58% and 79.63% accuracy, respectively, which far exceeds the accuracy of unimodal. As a result, integrating textual, speech, and video modal information can enhance the performance of sentiment analysis tasks.
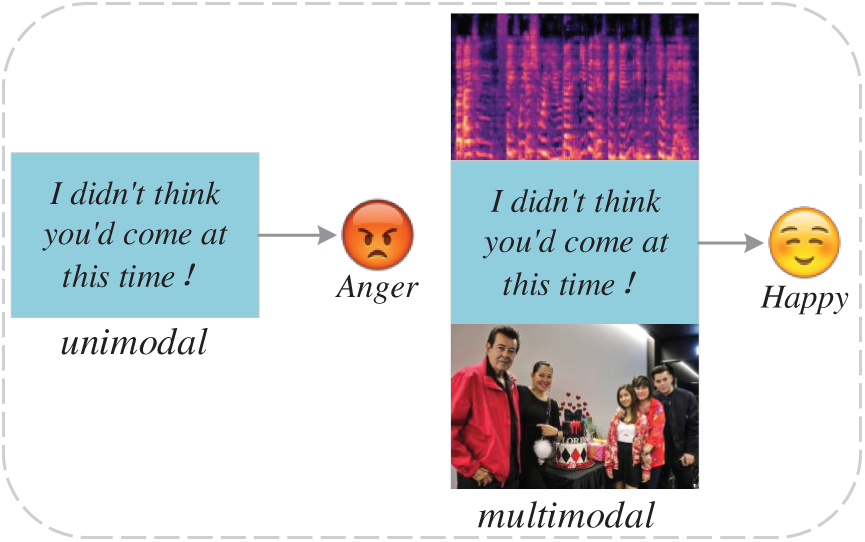
Figure 1: An example of unimodal and multimodal results
The multimodal fusion strategy can be refined into two mainstream branches: model-independent [8] and model-based [9]. Under the model-independent fusion framework, the strategy is further divided into early fusion and late fusion. Early fusion focuses on the feature level, capturing the interaction information in the initial stage by integrating the vectors of various modalities. And late-stage fusion focuses on the decision-making level, comprehensively considering the preliminary judgment results of each modality. Among them, LMF (Latent Multimodal Fusion) [10] is a typical example, which excels in mining hidden connections between low-level features. Although such methods can address most fusion challenges, excessive reliance on low-level features may limit their ability to explore complex relationships between data in depth.
In contrast, model-based methods, especially the multimodal fusion strategy combining machine learning and deep learning, aim to reveal deeper levels of interdependence and synergy between modalities. For example, Long Short Term Memory (LSTM) [11] demonstrates powerful temporal modeling capabilities in multimodal sentiment analysis by introducing a time dimension. The introduction of the Transformer framework [12] provides an efficient and flexible architecture for integrating multiple single-modal information. Recently, attention mechanisms have emerged as a key solution to long-term dependency issues in sequence modeling [13]. It enhances the model’s ability to capture important information by dynamically adjusting weight allocation. However, the limitation of methods such as cross transformers is that they often assume equal contributions from all modalities and fail to fully consider the unique value of key modalities such as text, resulting in performance bottlenecks [14]. To overcome this limitation, gate control mechanisms have emerged, which dynamically adjust the weight ratios of different modalities in the fusion process, achieving more refined control. But this advantage is also accompanied by a increase in computing resource demand [15].
Given the varying importance of different modalities, how to skillfully integrate multimodal data and maximize the utilization of extracted rich features has become the core challenge in improving the accuracy of sentiment analysis. Unfortunately, there are still shortcomings in the current fusion strategy, especially the phenomenon of feature loss. To overcome this bottleneck, we design a new multimodal sentiment analysis framework. This framework seamlessly integrates information from three modalities: text, speech, and video. Through a carefully optimized fusion mechanism, it aims to utilize the extracted features more comprehensively and can improve sentiment analysis accuracy in our experiments. Our model captures the core features of each modality, reducing information loss during the fusion process and helping to better preserve key information. It is particularly worth mentioning that, in response to the common problem of feature loss in speech and video modalities, we introduce a spatial position encoding strategy. However, most existing approaches treat speech and video features as simple sequences, neglecting their inherent internal structure. For example, speech features commonly adopt time–frequency representations (e.g., spectrograms), which naturally form a two-dimensional grid. Flattening these into one-dimensional sequences discards frequency-locality information critical for sentiment cues such as pitch variation or energy concentration. Similarly, video frames possess spatial layouts that are essential for interpreting expressions. To address this, we propose spatial position encoding to preserve these structural properties, thereby mitigating feature loss during fusion.
The main contributions can be summarized as follows:
1) We develop a multimodal sentiment analysis model that combines fusion embedding and spatial position encoding. This model uses text as the core modality and integrates it with speech and video, ensuring the ultimate preservation of key features in each modality.
2) By implementing spatial position encoding strategies for speech and video, we reduce the loss of spatial information in the network processing of these two modalities, thereby promoting the efficient utilization of internal features of the modalities.
3) To verify the performance of the model, we conduct comprehensive tests on the standard datasets CMU-MOSI and CMU-MOSEI, and the experimental results demonstrate the performance and effectiveness of the model in the field of sentiment analysis.
Currently, the mainstream methods in the field of unimodal sentiment analysis cover text sentiment parsing based on lexicon and machine learning techniques, image sentiment recognition using convolutional neural network (CNN) and VGG model [16], and speech sentiment analysis based on support vector machine (SVM) [17]. However, with the ever-changing advancement of Internet technology and the increasingly rich and diverse data forms, single-modal sentiment analysis methods are not capable of capturing and integrating the complex inter-modal correlation information, which tends to limit the comprehensiveness and accuracy of the analysis results [18]. Further, in the face of complex and changing contextual environments, unimodal analyses also reveal computational inefficiencies and poor adaptability.
In view of this, multimodal sentiment analysis, which integrates multiple data modalities, has emerged as a new trend in the field of sentiment intelligence. Zadeh et al. [19] pioneered the introduction of tensor fusion networks (TFNs), which enable seamless integration of information from unimodal to bimodal and even trimodal. However, with the cumulative expansion of the matrix product during computation, the dimensionality of the feature vectors climbs dramatically, placing a heavy burden on model training. Deeply inspired by TFNs, the work innovatively introduced a low-rank weighting strategy, which cuts down the model parameters and drastically improves the computational efficiency. Wang et al. [20] proposed a multimodal sentiment analysis model that combines BERT-BiLSTM for text feature extraction and CNN with CBAM attention for reducing redundant information and enhancing cross-modal correlations. Setiadi et al. [21] proposed a BiGRU-BiDAF hybrid model for aspect-based sentiment analysis on e-commerce reviews, but the model is still incompetent in capturing long-term dependent information in the face of sequences of extreme lengths. Wang et al. [22] applied multi-level attention to adaptively fuse text and image modalities, improving sentiment representation learning. Xiao et al. [23] enhanced sentiment fusion by integrating attention mechanisms with graph convolutional networks, while Lin et al. [24] constructed unimodal and multimodal graphs to capture hierarchical relationships across modalities. Although these graph-based approaches have advanced the modeling of inter- and intra-modal relations, they primarily emphasize semantic interactions and contrastive structures among features, without explicitly accounting for modality-specific spatial or positional information.
In recent years, the field of natural language processing (NLP) has witnessed progress in addressing long-term dependency issues through Transformer models, particularly those employing self-attention mechanisms. Kim and Park [25] introduced a single-stream Transformer that alleviates the loss of modal characteristics during fusion and improves information integration. However, it assumes equal contributions from all modalities and lacks explicit structural modeling for non-text modalities. Recent vision-language pre-training (VLP) models, such as VL-BERT [26] and LXMERT [27], demonstrated strong visual-text alignment through unified or dual-encoder frameworks, while Zhang et al. [28] integrated BERT with ResNet50 for multimodal sentiment tasks. Although effective in mitigating inter-modal gaps, these approaches flatten or pool feature maps, which discards local dependencies in video frames and frequency–time structures in speech. Other strategies, such as Chandrasekaran et al. [29] combining LSTM with XGBoost, Cai et al. [30] employing multi-task fusion with attention, and PEST [31] for video sentiment analysis, aim to enhance cross-modal interaction but still treat non-text features as sequences without preserving internal spatial layouts. Similarly, Rahmani et al. [32] and Wang et al. [33] focus on cognitive cues and hierarchical fusion but neglect explicit positional encoding for modality-specific structures. Sun et al. [34] use a Transformer-based cross-modal interaction but largely overlook spatial information preservation. While these works strengthen semantic alignment and inter-modal correlation, they generally lack mechanisms to model spatial or structural properties of video and speech. This limitation may lead to feature loss during fusion.
Despite the advancements in previous studies, many existing models either overlook the structural spatial features of non-text modalities or treat all modalities as equally important. As a result, challenges persist in preserving critical modality-specific features and effectively utilizing positional information during the fusion process. The primary distinction between our proposed approach and existing work is that we regard the text modality as fundamental, processing it after integrating speech and video modalities. Before fusion, we encode the spatial positions of the speech and video modalities to ensure comprehensive utilization of their internal structures, such as time–frequency patterns in speech and spatial layouts in video. This enables the model to retain modality-specific characteristics that are often lost in flattened or sequence-based processing. By combining spatial position encoding with a fusion embedding mechanism, our method ensures comprehensive utilization of modality-specific features, ultimately leading to more accurate and robust sentiment analysis outcomes.
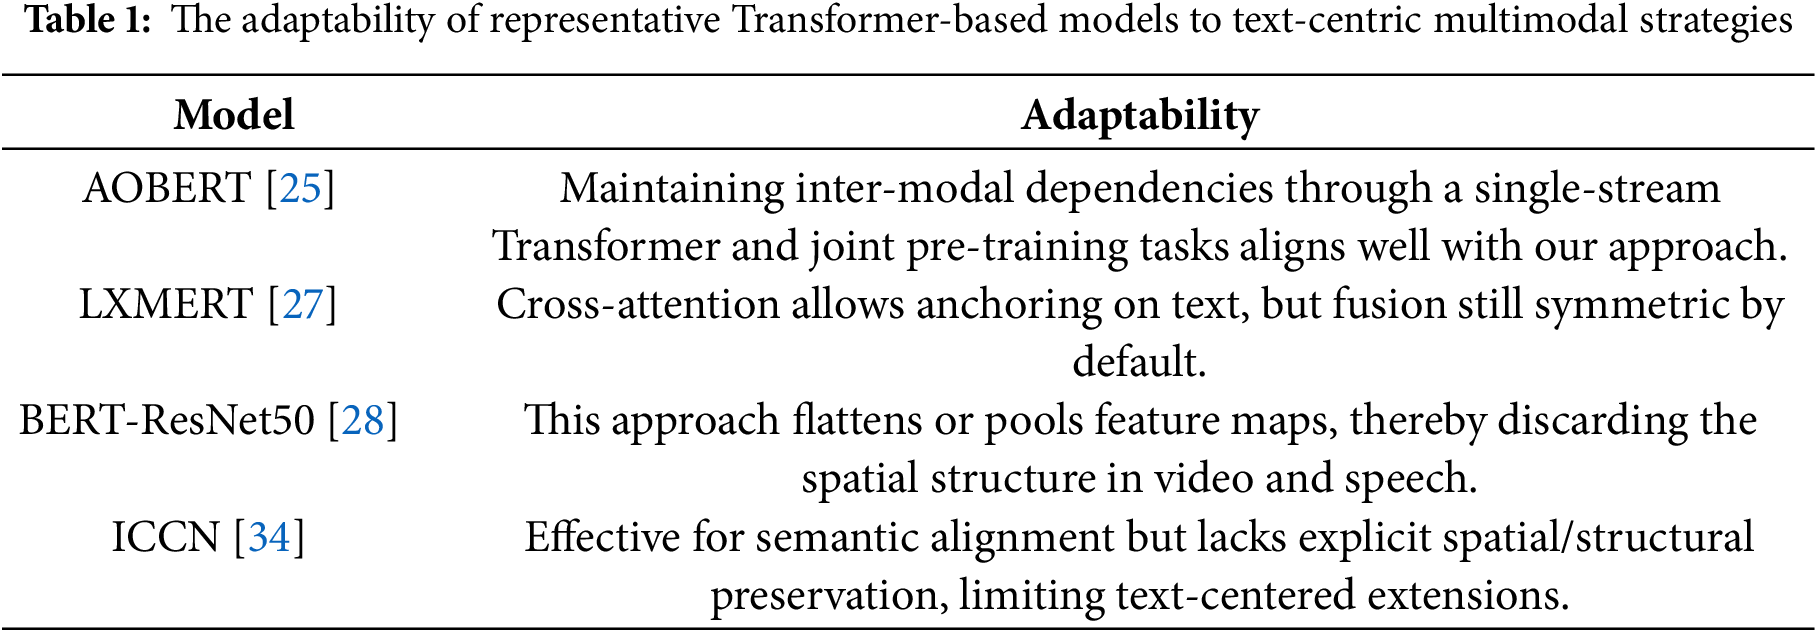
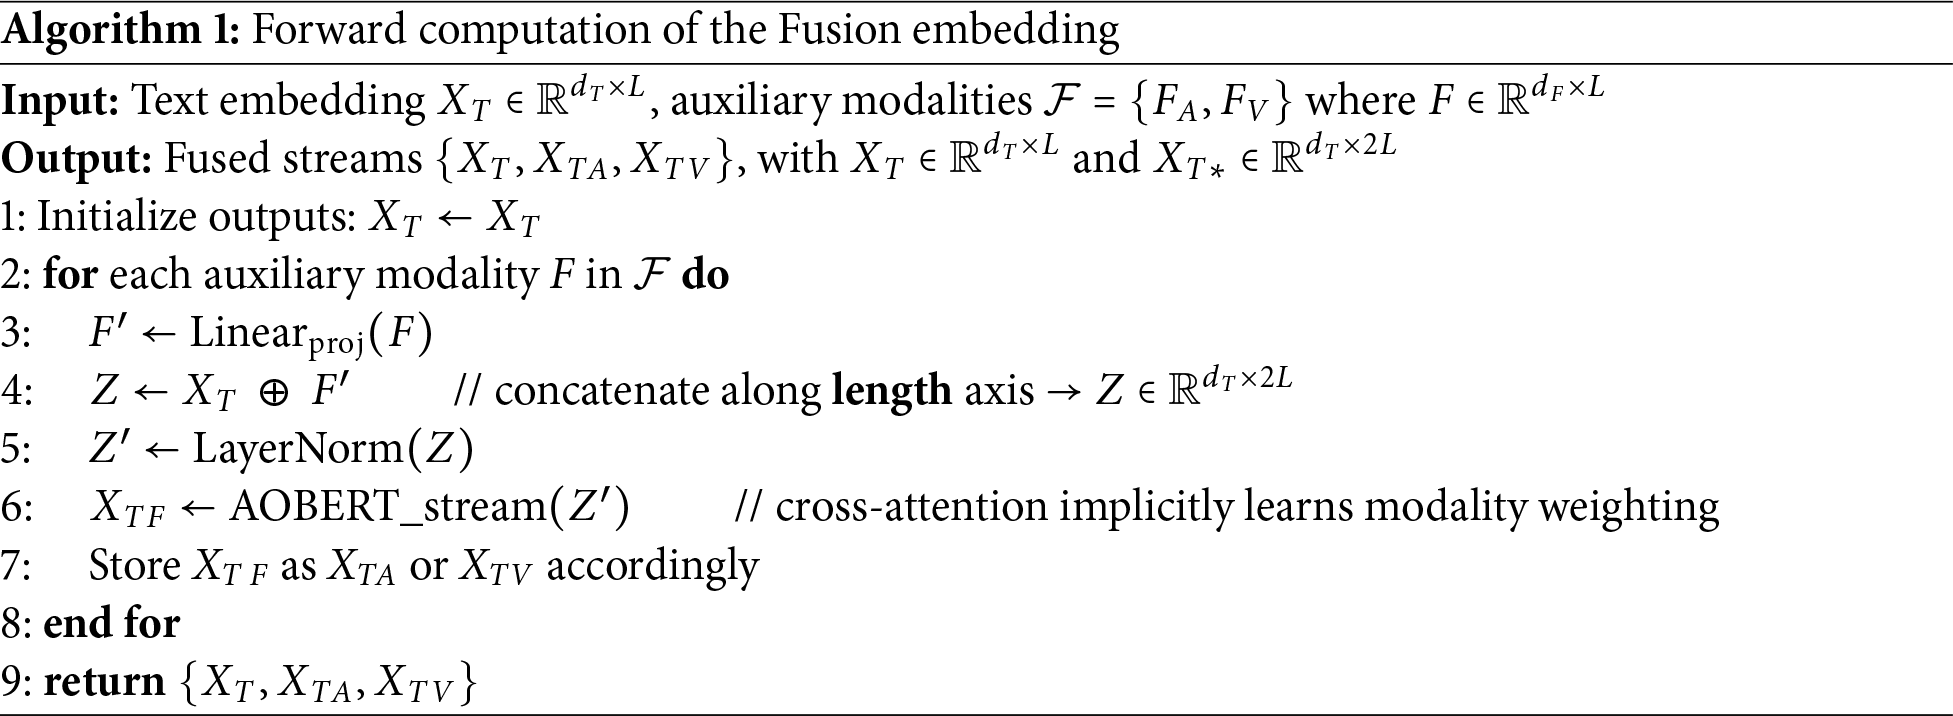
The proposed method can be categorized into three components, as illustrated in Fig. 2. The first component is spatial position encoding, which encodes both the speech and video modalities before fusion embedding and subsequently generates their outputs. The second component is the fusion embedding module, which takes the outputs from the spatial position encoding as input and processes them through a fusion gate before sending the result to AOBERT [25] for processing the text, speech, and video modalities. We chose AOBERT over other Transformer-based models because it preserves inter-modal dependencies through a single-stream Transformer and joint pre-training tasks. This aligns well with our approach’s focus on text and leveraging context-aware fusion to enhance cross-modal structural information. The comparison with other Transformer-based models is shown in the Table 1. The final component is the sentiment classification module.
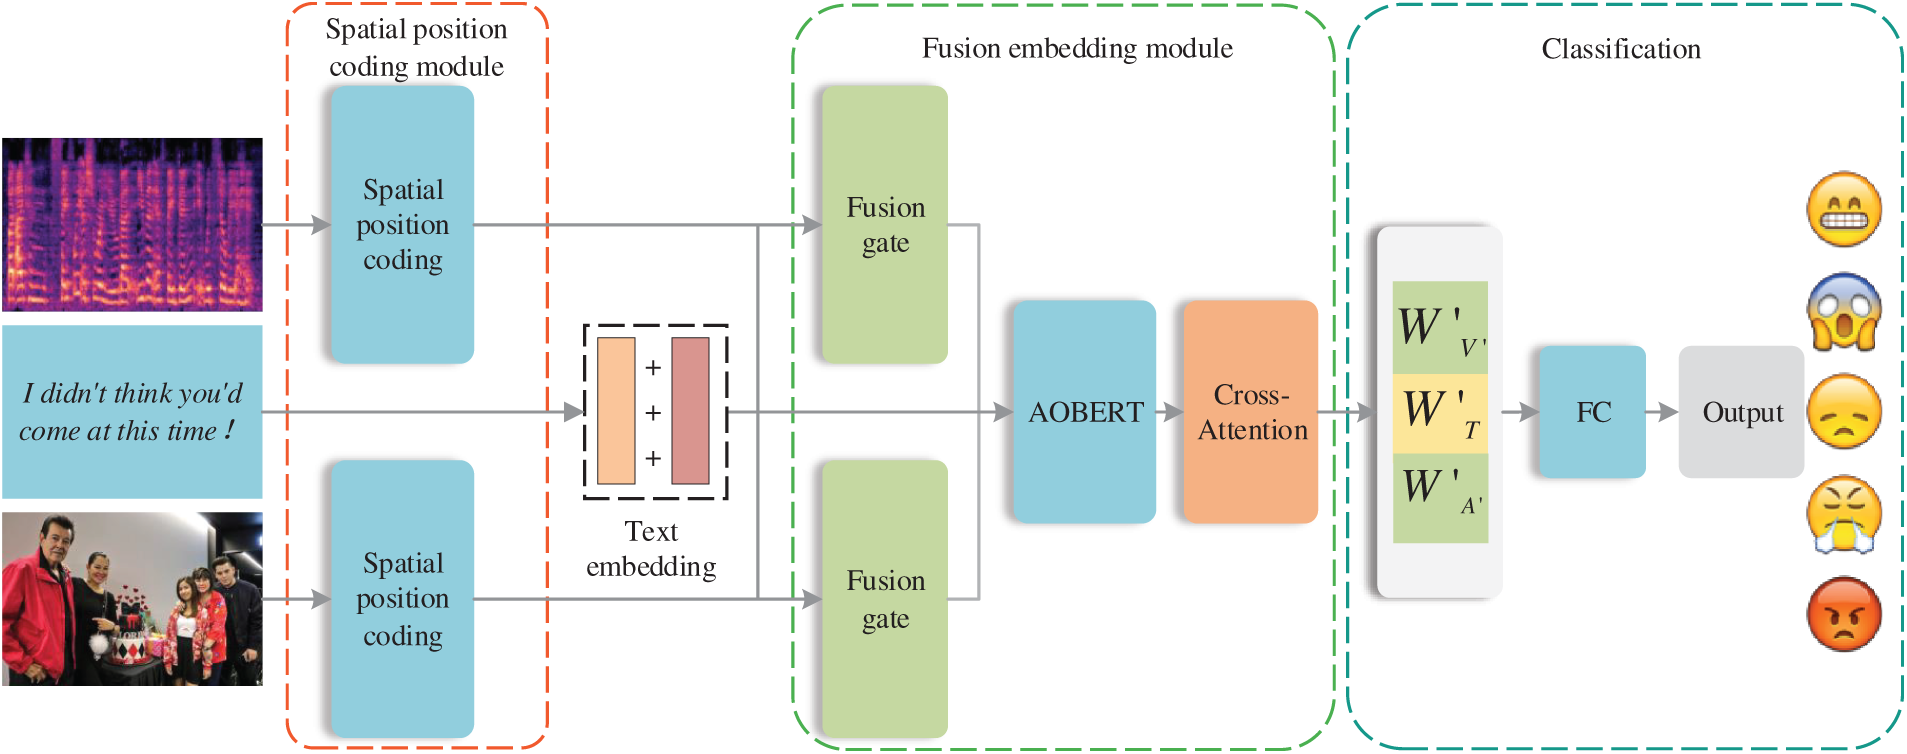
Figure 2: Overall framework
In this study, the three input modalities, text, speech, and video, are defined as:
Due to the complexity of multimodal data structures, speech and video modalities are prone to information loss during encoding. To preserve their intrinsic spatial and temporal characteristics, we introduce a 2D spatial position encoding scheme. Unlike the standard 1D positional encodings used in NLP tasks or fixed 2D encodings in vision models, our method applies row-wise and column-wise sinusoidal encodings to the feature matrices of each modality, explicitly preserving frequency-time relations in speech and spatial layouts in video. Inspired by the sinusoidal positional encoding in the Transformer model [13], we extend it to encode two independent axes—row and column—denoted as
where
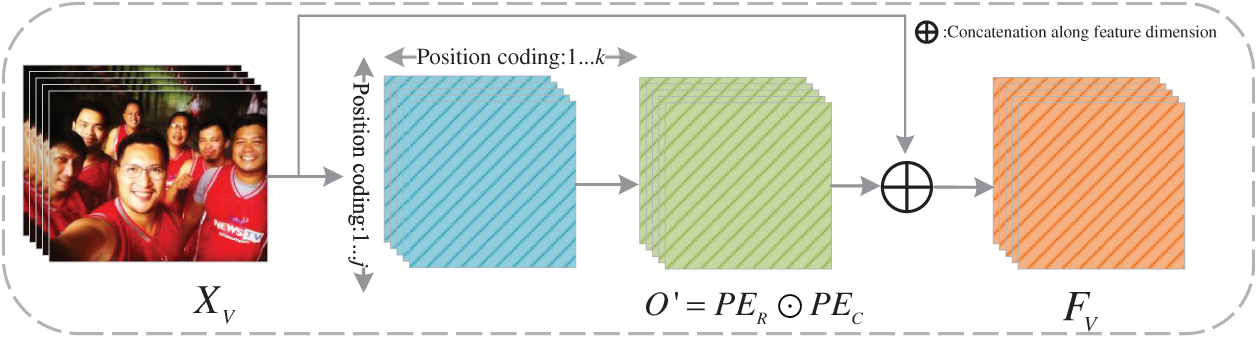
Figure 3: Spatial position encoding
Before applying the encoding, we define the row and column position embedding vectors as R and C, which represent positional information along the frequency/height and time/width axes, respectively. To ensure the completeness of the positional information, we adhere to a specific correspondence rule: odd positions correspond to odd positional information, while even positions correspond to even positional information. After spatial position encoding, the row position vectors, column position vectors, and the encoded matrix are O′ defined as described in Eqs. (3) and (4).
After spatial positional encoding, we combine the encoded features with the original data via a weighted summation to retain key information while minimizing feature loss. To balance their contributions, we introduce a weight parameter
where O and
The fusion embedding module aims to address the limitations of traditional fusion strategies, such as tensor-based methods that suffer from dimensionality explosion and attention-based fusion methods that assume equal modality contributions. Our design integrates textual embeddings with a lightweight Fusion Gate, which performs dimension alignment and adaptive feature integration in a computationally efficient manner.
The textual embedding component consists of token encoding and positional encoding. Token encoding converts individual words from the text
After fusion through the Fusion Gate, the resulting representations (A′ and V′) are combined with the text stream to form three inputs. To further model deep contextual interactions across modalities, we employ an adapted AOBERT as the backbone for multimodal reasoning. Unlike the original single-stream design, AOBERT in our framework processes three streams—text, text-audio, and text-video—enabling hierarchical refinement while keeping text as the core modality. This architecture enables our proposed Spatial Position Encoding and Fusion Embedding to be naturally integrated into the model, while AOBERT’s layer-by-layer fusion strategy provides a flexible structure for dynamic cross-modal interactions. Cross-attention layers are leveraged for fine-grained integration, and the Pooler layer, followed by a fully connected layer with tanh activation, produces task-specific sentiment representations. The overall interaction flow is illustrated in Fig. 4.
where T represents a text modality, F denotes an speech modality or a video modality,
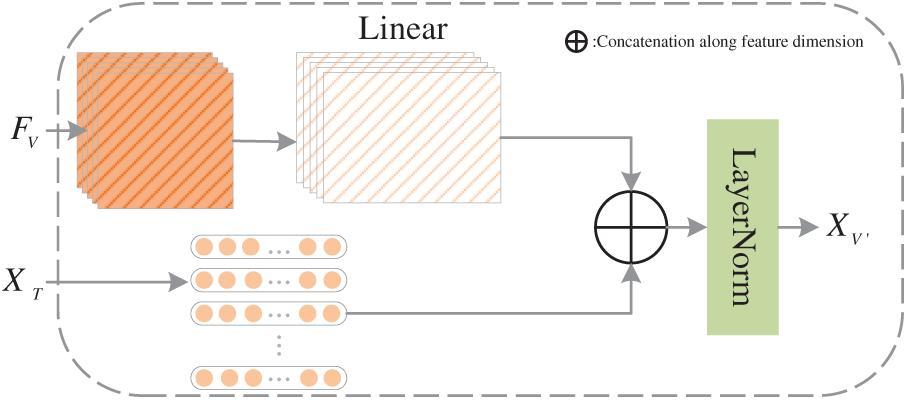
Figure 4: Fusion gate
Due to the distinct processing methods employed for these modalities, their dimensions differ. We establish the text modality as the baseline, enabling the sizes of the other two modalities to adjust accordingly to align with the text modality’s dimensions. The specific procedure is as follows: F is projected through the linear layer in Eq. (6) to connect with the textual modality A. Subsequently, T and F are combined based on the sequence length operation outlined in Eq. (7).
To mitigate the scale discrepancies between modalities and enhance model stability, we implement a LayerNorm layer with a regularized dimension of
To achieve meaningful fusion performance, we introduce a cross-attention mechanism to process
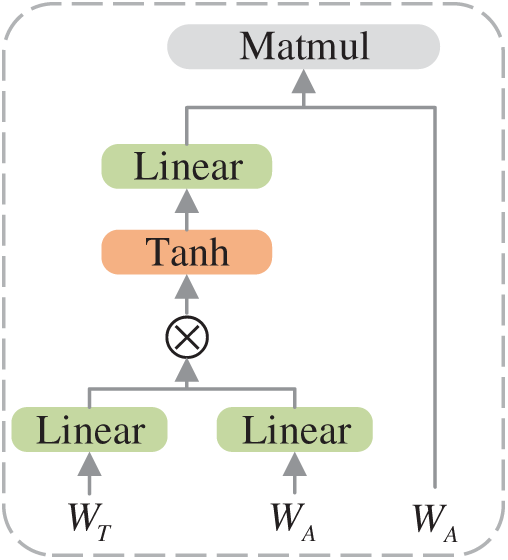
Figure 5: Self-attention layer in a classifier
The fusion loss
In this section, we conduct a series of experimental evaluations to assess the efficacy of our novel model and benchmark its performance against alternative models across the two datasets under evaluation. All experimental codes are available on GitHub1 .
We conduct our experiments utilizing two publicly available datasets, CMU-MOSI [35] and CMU-MOSEI [36], each of which is comprehensively outlined in the following.
CMU-MOSI: A comprehensive multimodal corpus of emotional intensity, curated and structured by Zadeh et al. [35], draws upon YouTube content where speakers articulate their perspectives on film themes. This extensive resource encompasses a diverse sample of 2199 video clips featuring English monologues from individuals of various ethnic backgrounds. The emotional intensity of each video within this corpus spans a range from −3 to +3. The dataset has been split into training, validation, and testing sets with respective sample counts of 1284, 229, and 686, as illustrated in Table 2. This partitioning enables us to train the model, validate its performance, and evaluate its generalization ability.
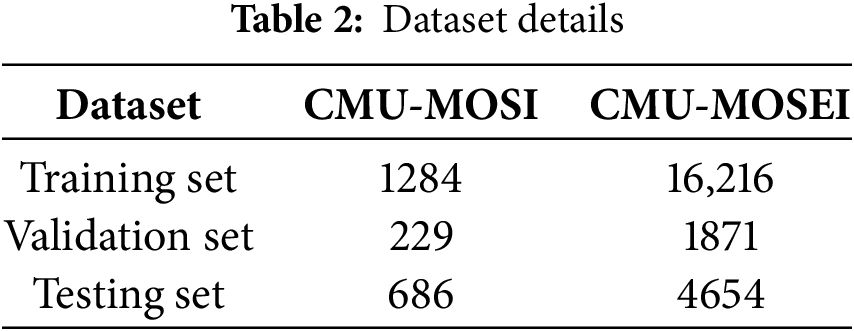
CMU-MOSEI is an extension of the CMU-MOSEI dataset by Zadeh et al. [36]. It consists of 23,453 annotated video clips. This corpus contains both affective and emotional labels. Emotion intensity is annotated using the same method as CMU-MOSI. The dataset encompasses a comprehensive spectrum of emotions, spanning from negative to positive across seven distinct categories. The intensity of these emotions is quantitatively represented on a scale ranging from −3 to +3. The dataset classification is detailed in Table 2.
We process the CMU-MOSI and CMU-MOSEI sentiment datasets using the CMU-Multi-modal Data SDK [37] toolkit.
Text feature extraction: In previous studies, GloVe word embeddings [38] were utilized as textual modal features for each marker. Currently, the most advanced research findings have been achieved by employing pre-trained BERT as a feature extractor for textual discourse.
Video feature extraction: Both CMU-MOSI and CMU-MOSEI leveraged the Facet tool to characterize facial attributes, employing the Facial Action Coding System (FACS) methodology for extracting fundamental and intricate emotional nuances present within each video frame. The dimensions of the video features extracted by the toolkit are 47 and 35, respectively.
Speech feature extraction: The speech features in the dataset were partially processed using the COVAREP [39] algorithm, a dedicated speech signal processing algorithm designed to derive low-level speech attributes. This processing resulted in 74-dimensional speech feature vectors.
For all experiments, we randomly split each dataset into training, validation, and test sets from the same source with identical distributions. A fixed random seed was used to ensure that the same data partition was consistently applied to all models under comparison, thereby eliminating the influence of sampling variability. Furthermore, to reduce the impact of stochastic factors such as parameter initialization and optimizer dynamics, we repeated each experiment five times and report the average performance across runs.
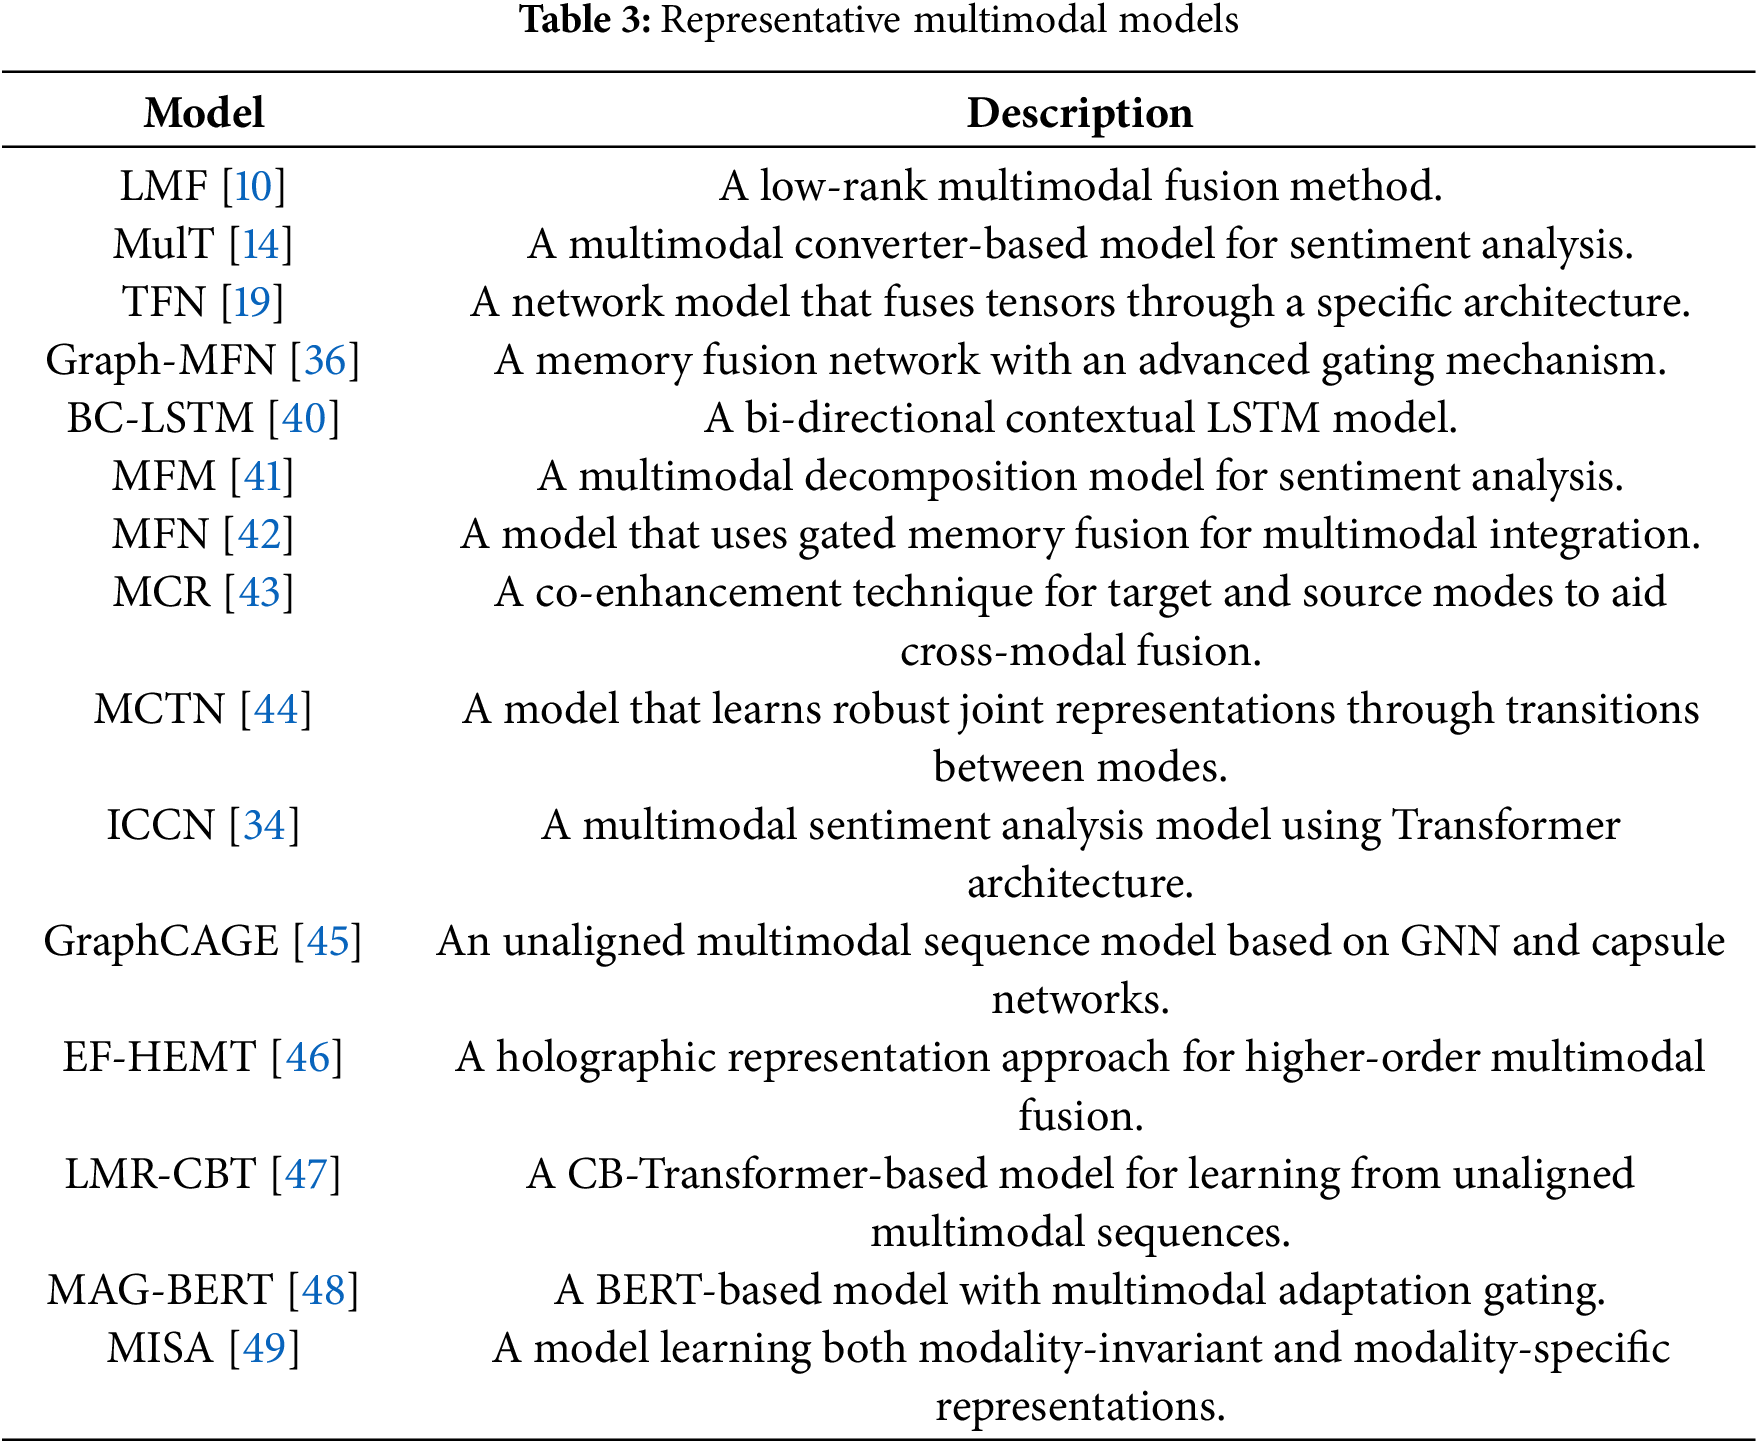
We select a series of models for comparative analysis that include metrics for evaluating sentiment analysis, aiming to demonstrate their excellent performance and advantages in addressing multimodal sentiment analysis through rigorous experiments. These models tackle challenges in multimodal sentiment analysis from different perspectives: they address the forgetting problem using long-term and short-term memory networks [37,40–42], facilitate multimodal data fusion utilizing tensor fusion [10,19], and enhance the interaction between multimodal information by employing transformers [14,43]. The models used for comparison are summarized in Table 3. All models are tested on the same dataset, ensuring the fairness and comparability of the experimental results.
4.3 Evaluation Metrics and Parameter Settings
Sentiment analysis is fundamentally regarded as a regression task that aims to predict the strength or polarity of emotional tendencies. Consequently, we select Mean Absolute Error (MAE) as one of the primary performance indicators, supplemented by the correlation coefficient (Corr) to assess the strength of the linear relationship between predicted and actual values. However, it is important to note that sentiment analysis often manifests as a classification task, wherein the emotional tendency of a text is classified as positive, negative, or neutral. Accordingly, we also incorporate Accuracy for Binary Classification (Acc), which directly measures the correctness of classification results, and combine it with the F1 Score (F1), the harmonic mean of Precision and Recall, to provide a comprehensive evaluation of classification performance, as defined in Eqs. (12) and (13).
where True Positive (TP), True Negative (TN), False Positive (FP), and False Negative (FN) include correct positive predictions, correct negative predictions, incorrect negative predictions, and incorrect positive predictions, respectively. These categories collectively serve as essential metrics for assessing the classification accuracy and performance of the model.
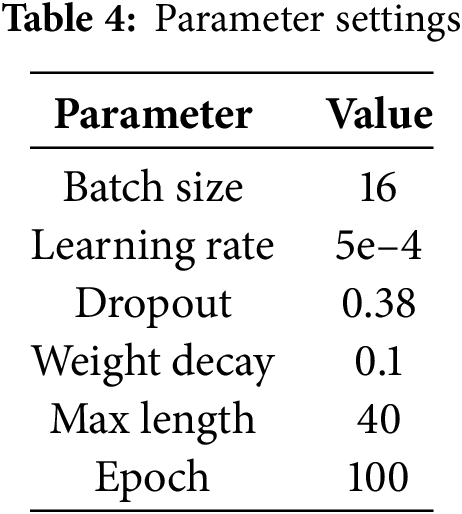
In this research, we utilize a server equipped with 24 GB of NVIDIA RTX 3090 graphics processing unit (GPU), employing Python 3.8 as the programming language and PyTorch 1.10 as the deep learning framework. For our experiments, we leverage the pre-trained BERT base uncased model to extract the word embedding matrix. During backpropagation, we employ the AdamW optimizer, which incorporates a linear learning rate warm-up strategy. The learning rate is set to 5e-4, with a weight decay of 0.1 and a dropout rate of 0.38. The training regimen involves a batch size of 16 and a total of 100 iterations. For the MOSI and MOSEI datasets, the input length is fixed at 40 tokens. The optimal experimental parameter settings we obtained are shown in Table 4.
4.4.1 Comparison on CMU-MOSI Dataset
The results on the CMU-MOSI dataset are shown in Table 5. Our model achieves competitive performance, outperforming several representative baselines such as MFN [42], MCTN [44], and BC-LSTM [40] across accuracy, F1-score, and correlation metrics. This demonstrates the effectiveness of our structured fusion strategy and spatial position encoding in preserving modality-specific features.
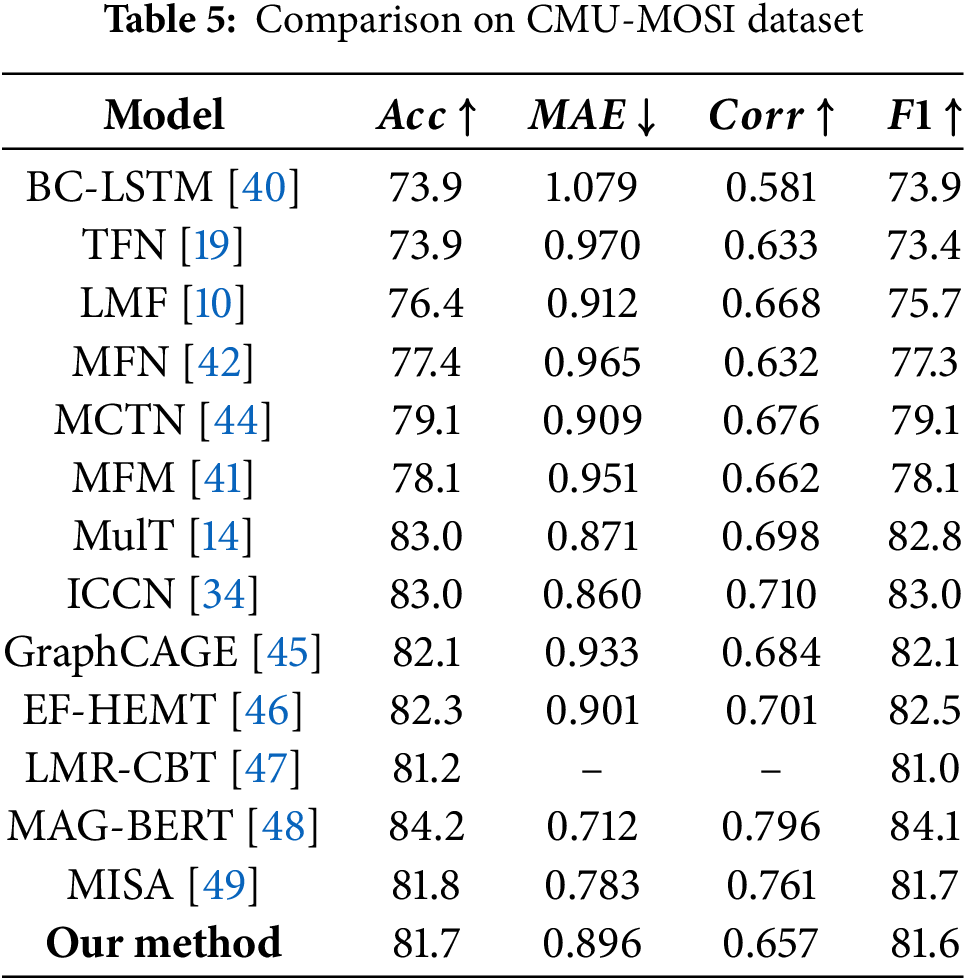
While recent transformer-based models like MAG-BERT [48] and MulT [14] achieve higher accuracy, they rely on large-scale pre-trained models or complex temporal alignment mechanisms. Our approach, in contrast, focuses on spatial modeling and modular fusion, offering better interpretability and structural flexibility. It is worth noting that MISA [49] also performs well by learning modality-invariant and modality-specific representations. Compared to it, our model maintains competitive classification results with a simpler and more modular design.
Although our model does not surpass the state-of-the-art ICCN model according to evaluation metrics, we attribute this limitation primarily to the constrained size of the MOSI dataset, which restricts our model’s ability to fully leverage its potential during training. Overall, data augmentation addresses the challenge of inadequate training data by artificially increasing the dataset’s size and diversity. While various strategies exist for augmenting unimodal data, there is currently a lack of tailored techniques specifically designed to tackle the complexities of multimodal data.
Fig. 6 shows the confusion matrix results of the model on the CMU-MOSI dataset. It can be observed from this matrix that the model performs well in the prediction of most samples and is capable of accurately identifying and predicting their correct categories. However, it should also be noted that there are still a small number of samples whose prediction results have deviated and failed to be classified correctly. Fig. 7 presents the visualization diagram of the model after dimensionality reduction processing. It can be intuitively seen in this figure that samples belonging to the same category can cluster well together in the feature space, demonstrating the effectiveness of the model in classification tasks. However, at the same time, there is also a situation where the two types of samples are difficult to completely separate in the feature space. This might be due to the relatively small number of samples in the dataset, resulting in the model failing to fully learn the subtle differences between various categories during the training process.
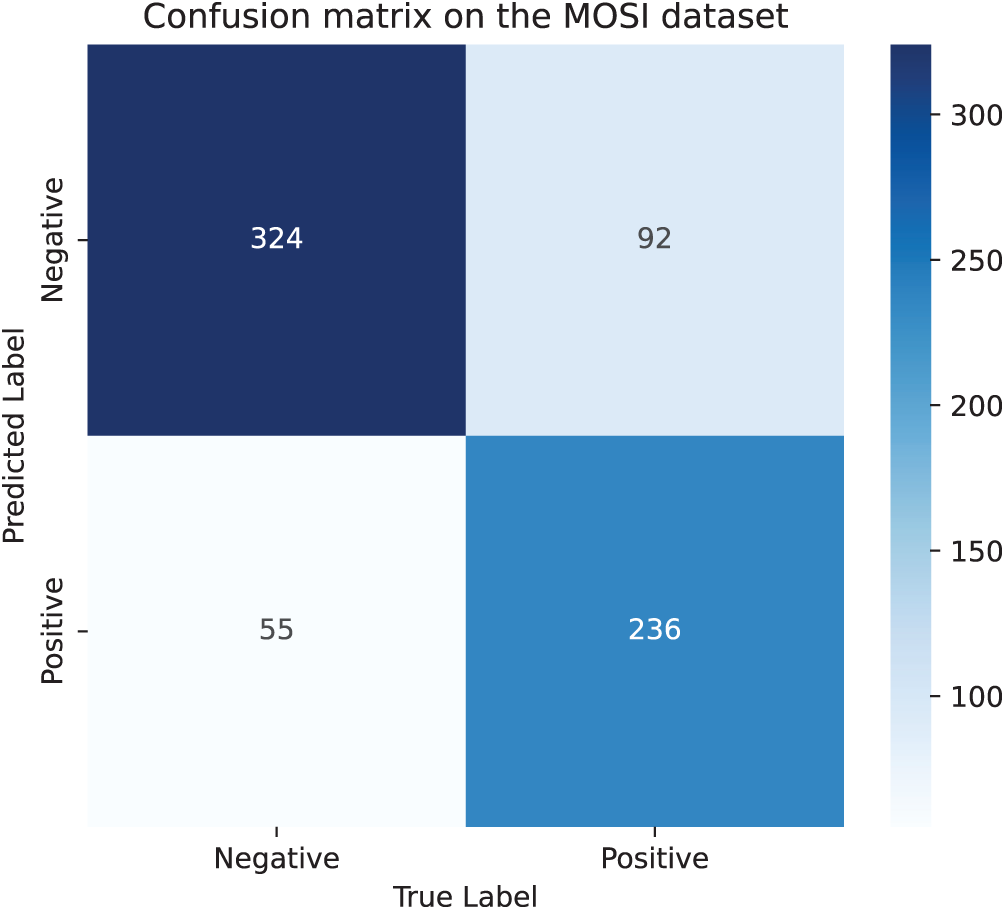
Figure 6: Confusion matrix on the CMU-MOSI dataset
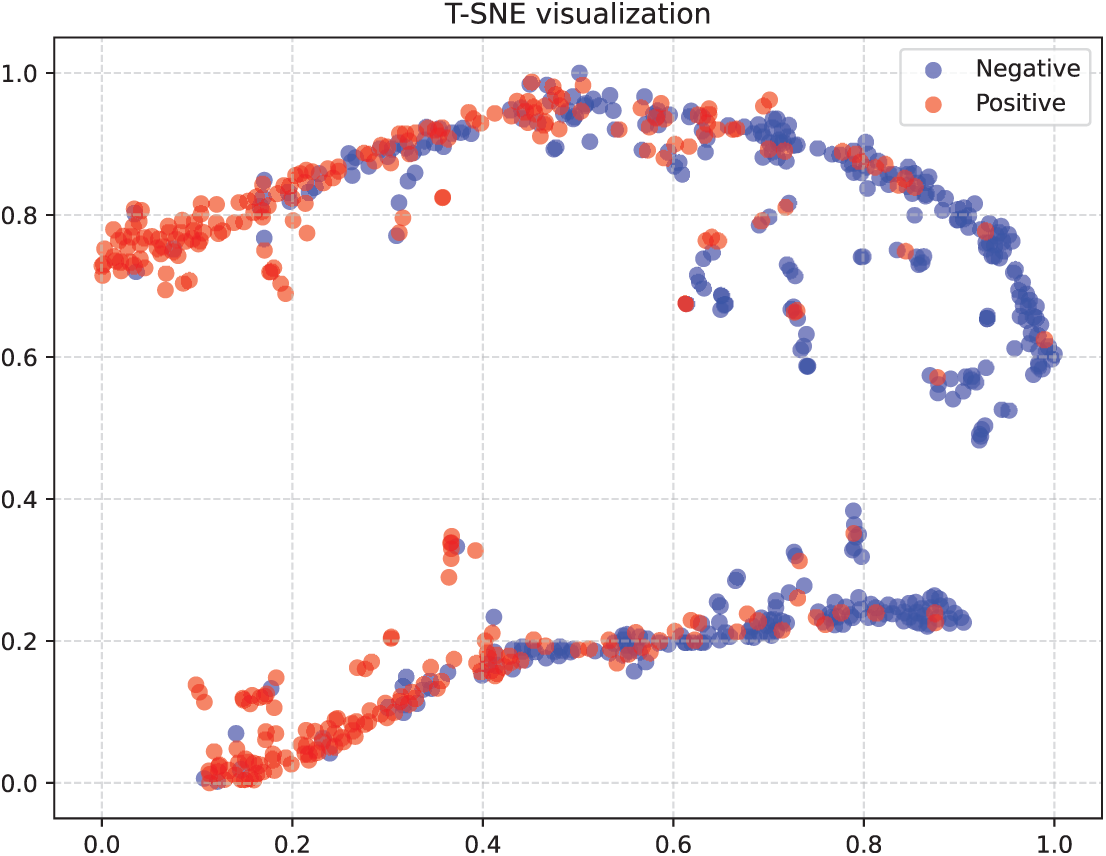
Figure 7: Visualization results on the CMU-MOSI dataset. The
4.4.2 Comparison on CMU-MOSEI Dataset
The results of sentiment analysis performed on the CMU-MOSEI dataset are depicted in Table 6. The proposed model shows improved performance, yielding observable improvements across various classification and regression metrics. When compared to existing models, our model exhibits comparable or superior performance, particularly excelling in
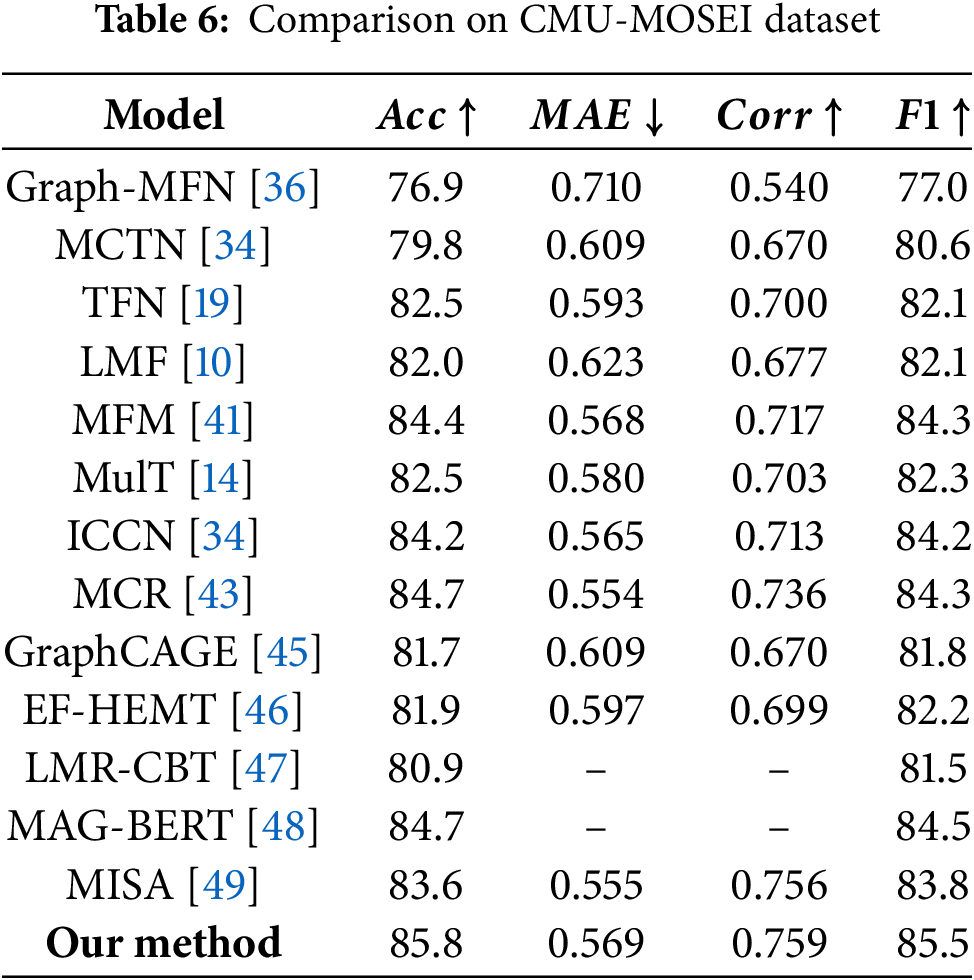
As shown in Table 6, our model achieves the best overall performance on the CMU-MOSEI dataset, outperforming recent methods including MAG-BERT [48] and MISA [49]. While MAG-BERT leverages large-scale pre-trained transformers with modality adaptation gates to enhance language representations, it increases model complexity and training cost. MISA employs a dual-branch strategy to disentangle modality-invariant and modality-specific features. In comparison to these and earlier fusion techniques such as Tensor Fusion Network (TFN) [19] and Low-rank Multimodal Fusion (LMF) [10], our framework explicitly integrates spatial modeling, contributing to superior accuracy, correlation, and F1 scores. Other competitive models like the Multimodal Factorization Machine (MFM) [41] and Multimodal Contextual Reinforcement (MCR) [43] enhance multimodal interactions; MFM adeptly decomposes features into discriminative and modality-specific components, and MCR creatively integrates novel target-modal reinforcement mechanisms to robustly enhance representations and capture complex interactions. Despite these sophisticated strategies, our approach consistently surpasses them, validating the advantages of our modular design and delivering better performance with a more compact and interpretable architecture.
In contrast, our model achieves enhancements by optimizing the fusion process and encoding the spatial positions of speech and video modalities. This optimization allows for more accurate data fusion from various modalities and utilizes spatial position information to enhance performance. The proposed architecture introduces additional computation primarily in the fusion gate and positional encoding stages, but the increase remains moderate compared to tensor-based methods, ensuring practical feasibility. However, despite these improvements, the model may still face limitations in certain conditions due to its underlying assumptions. Specifically, performance may degrade under severe modality asynchrony or extremely noisy audio/video inputs, as the positional encoding assumes relatively stable structural patterns.
Notably, the comparative models, including TFN, MFN, MFM, and ICCN, demonstrated improved performance on the MOSEI dataset relative to the CMU-MOSI dataset. This enhancement can be attributed to the richer and more diverse data samples in MOSEI, which enabled these models to undergo a more comprehensive training process and realize their full potential. This observation highlights the crucial importance of increasing dataset size to improve model performance and underscores the impact of data richness on refining model capabilities.
Fig. 8 shows the confusion matrix results on the CMU-MOSEI dataset. It can be seen that the model can predict the correct categories of most samples, but there are still a small number of samples with incorrect predictions. Compared with the results of the CMU-MOSI dataset, the prediction accuracy rate has been improved. Fig. 9 is the visualization diagram of the model after dimensionality reduction. From the figure, it can be intuitively observed that samples of the same category can be closely clustered together to form a distinct cluster structure, and at the same time, the discrimination between samples of different categories is also very significant. Compared with the visualization results on the CMU-MOSI dataset, the model performs better on the CMU-MOSEI dataset, which further confirms the generalization ability of the model on different datasets. However, it is worth noting that although the overall performance of the model is excellent, there are still some samples that are difficult to clearly distinguish in the visualization graph, thereby affecting the performance of the model.
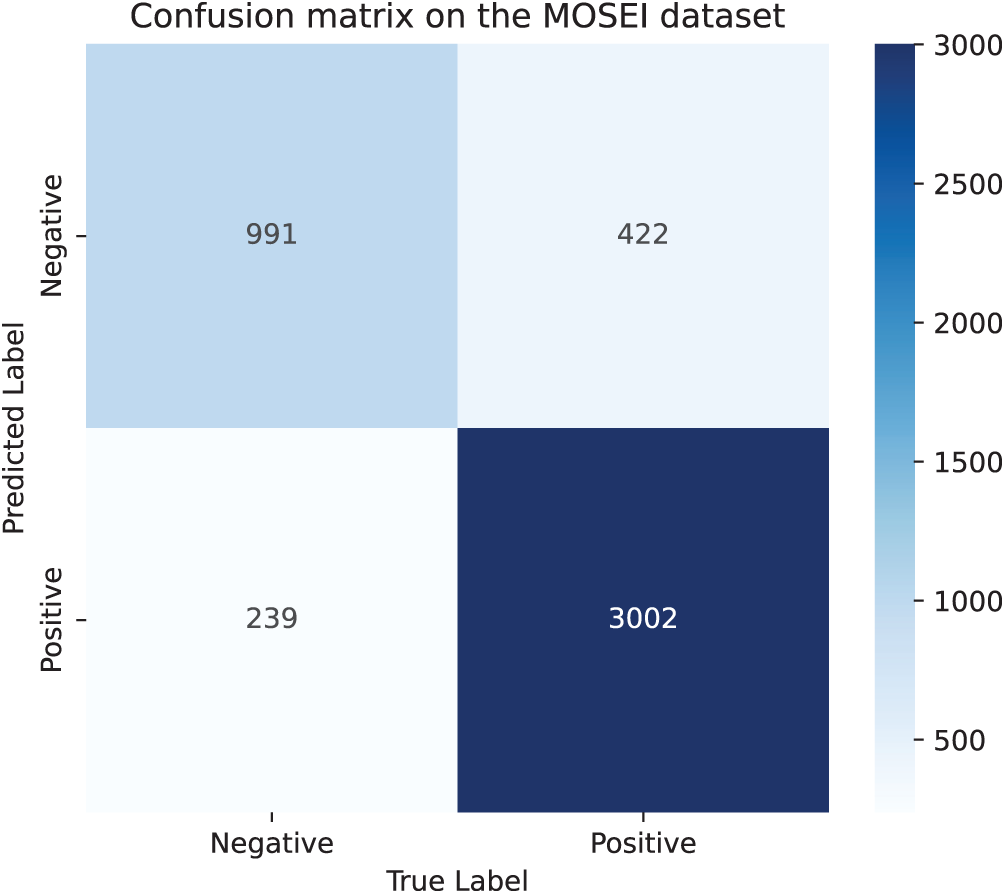
Figure 8: Confusion matrix on the CMU-MOSEI dataset
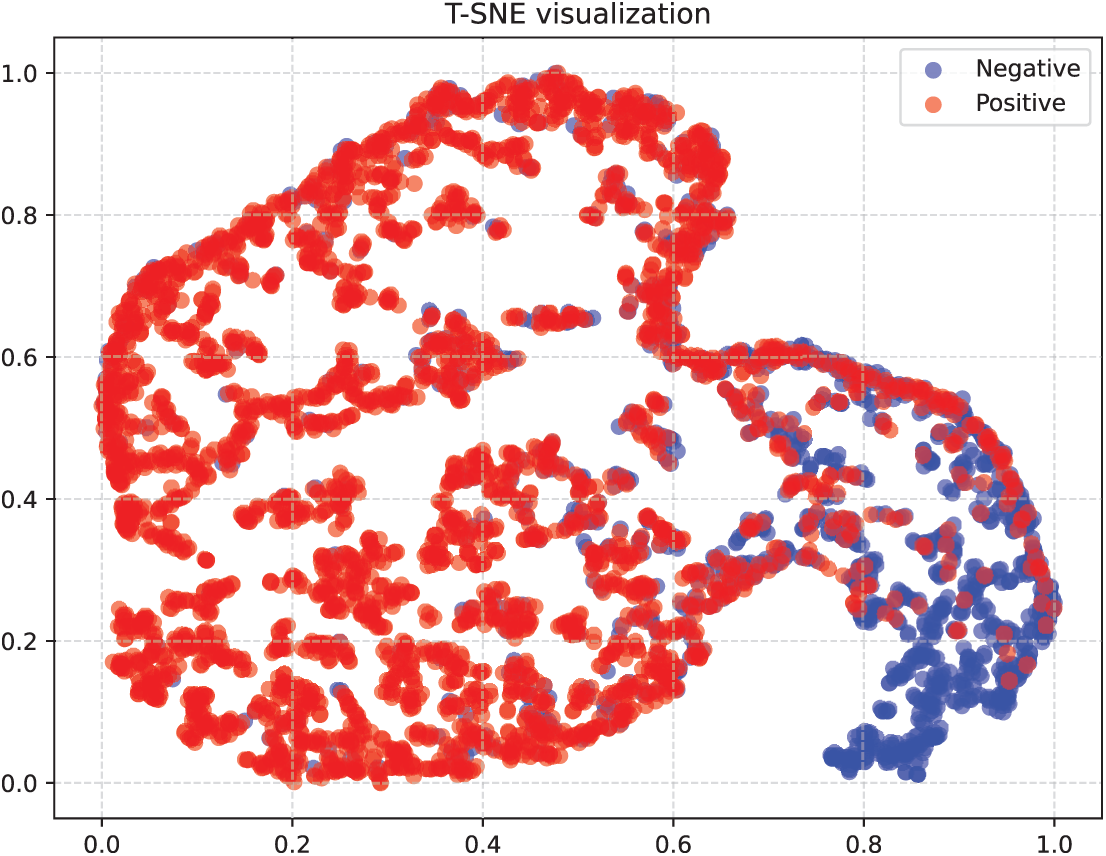
Figure 9: Visualization results on the CMU-MOSEI dataset. The
In this section, we conduct a comprehensive series of ablation studies to investigate the specific contributions of the spatial position encoding component, with the results summarized in Table 7.
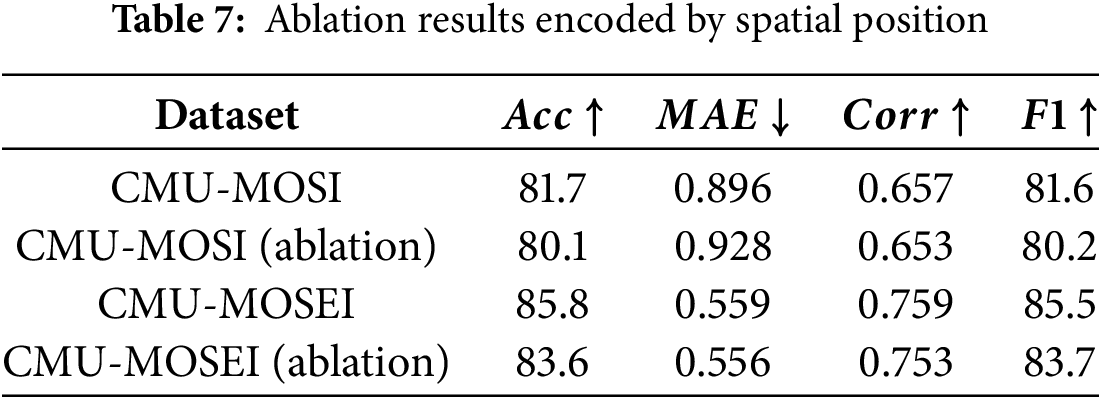
Experimental results from the CMU-MOSI dataset indicate that the unablated model achieves improvements of 1.6% and 1.4% in Acc and F1 metrics, respectively, compared to the ablated model. This level of improvement signifies a notable enhancement in model performance. Additionally, the unablated model demonstrates a reduction in mean absolute error (MAE) and an enhancement in correlation (Corr) metrics relative to the ablated model, providing further evidence of optimization in several performance aspects. This substantial performance enhancement is primarily attributed to our proposed spatial position encoding module. By encoding speech and video modalities, the model minimizes the loss of unique features from each modality, allowing it to retain and utilize critical information more effectively. Simultaneously, it optimizes the use of internal features of each modality, making the model more adept at handling complex multimodal data. Collectively, these advantages lead to improvements in overall model performance, particularly in Acc and F1 metrics, further validating the effectiveness and sophistication of the spatial position encoding module.
Similarly, the fully trained model evaluated on the CMU-MOSEI dataset outperforms the ablated model, underscoring the importance of the spatial position encoding module. The unablated model achieves improvements of 2.2% and 1.8% in Acc and F1 metrics, respectively, providing additional evidence of the model’s validity. Moreover, the unablated model exhibits notable gains in the
We also conducted ablation experiments of the fusion embedded module to verify the effectiveness of the module. The experimental results on the two data sets are shown in Table 8. The experimental results on the CMU-MOSI dataset show that compared with the ablation model, the non-ablation model achieves a increase of 2.1% in Acc metric and 1.9% in F1 metric, respectively, which indicates that the model performance has been improved. At the same time, the MAE metric decreased and the Corr metric increased in the non-ablation model compared with the model with the fusion embedded module. The performance improvement of the model is mainly due to the fusion embedded module proposed by us. By integrating text as the basic mode with audio and video modes, the key features of each mode can be retained to the greatest extent, thus improving the overall performance of the model, which further verifies the effectiveness of the fusion embedded module.
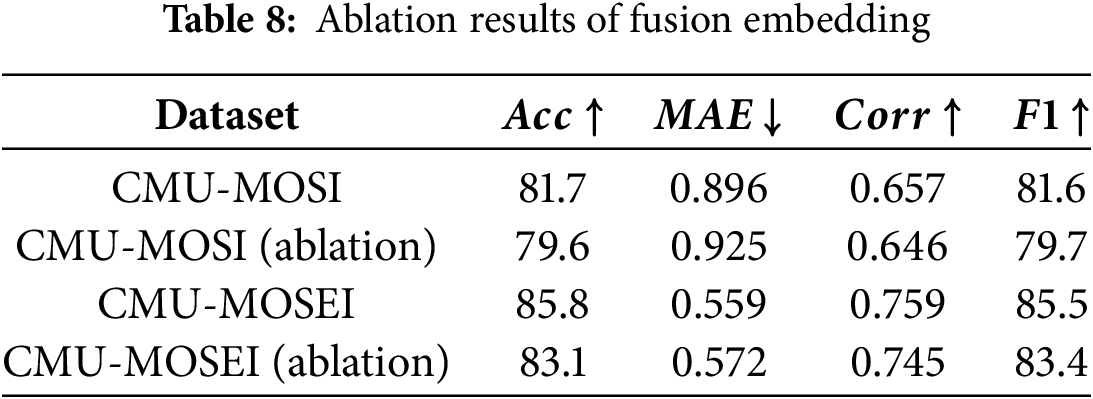
Similarly, on the CMU-MOSEI dataset, the non-ablated model achieved a improvement of 2.7% in the Acc metric and 2.1% in the F1 metric compared with the ablated model, which further verified the importance of the proposed module in improving the overall performance of the model. At the same time, MAE metric decreased and Corr metric increased slightly, which further verified the advantage of the model in capturing the correlation between data. In summary, the experimental results on the two datasets consistently verify that our proposed fusion embedded module can improve the overall performance of the model.
Although both components show similar performance drops in isolation, the fusion embedding has a more direct impact on cross-modal integration. The spatial position encoding acts as a supporting module, and its effectiveness depends on whether the fusion mechanism can leverage the encoded structural cues. Without proper fusion, spatial features may not be fully utilized. This highlights the complementary nature of the two modules.
In the spatial position encoding module, we aim to maximize the utility of modal feature information by integrating it with the original information. This strategy enhances the features encoded by spatial position while preserving the original data, thus enriching the overall feature representation. However, given the potential discrepancies between the information processed by the spatial position encoding module and the original data, a straightforward addition may not represent the optimal fusion method. To achieve more precise control over the contributions from the two sources, we introduce a weighting parameter
Table 9 presents the experimental results for the CMU-MOSI dataset. Our findings indicate that the model’s accuracy (Acc), mean absolute error (MAE), and F1 metrics reached their optimal levels when the weighting parameter
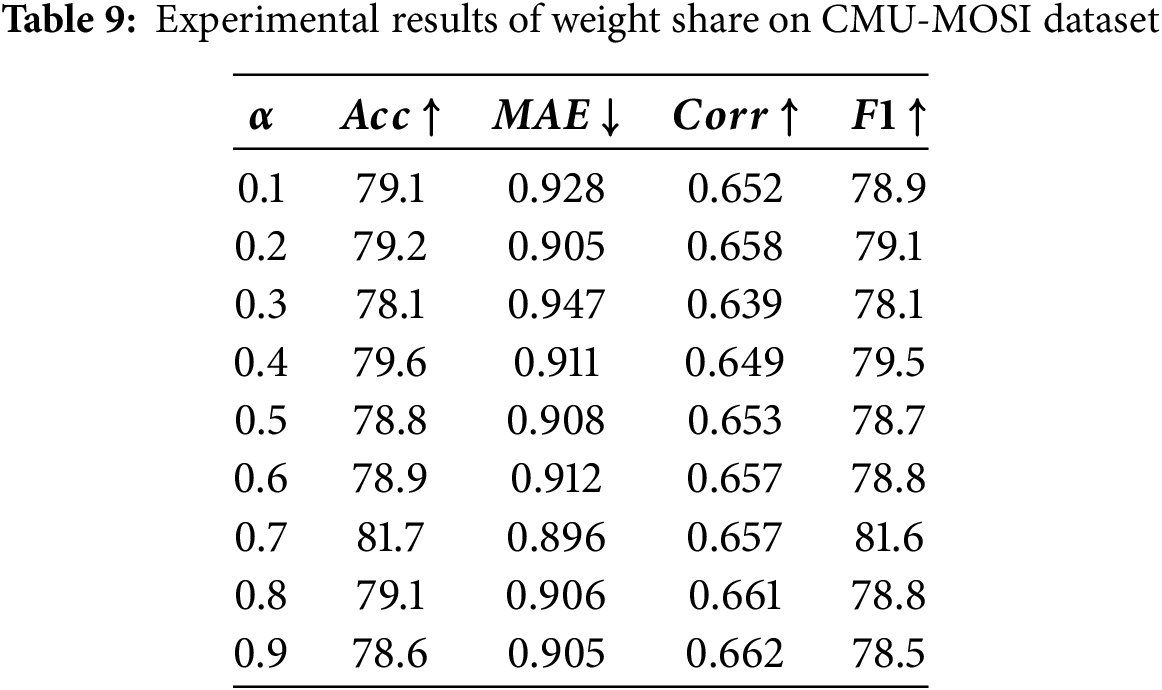
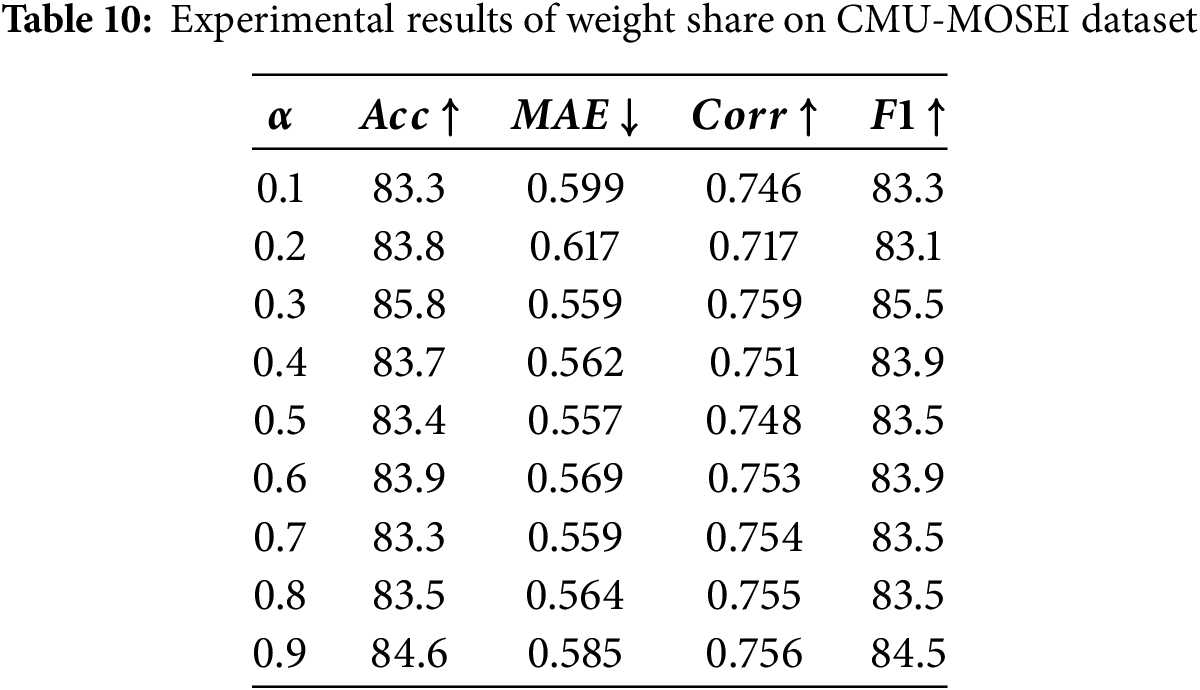
Table 10 presents the experimental results on the CMU-MOSEI dataset. Through detailed analysis, we found that the model achieves optimal performance across all evaluation metrics—except for the MAE—when the weighting parameter
Tables 6 and 7 demonstrate that removing either the spatial position encoding or the fusion embedding consistently degrades performance across accuracy, F1, correlation, and MAE. The benefits arise not simply from added parameters. Spatial position encoding preserves the intrinsic 2D organization of audio (time-frequency patterns) and video (facial regions), reducing information loss and providing a structural prior that dampens frame-level noise. The fusion embedding module performs lightweight dimensional and scale alignment while anchoring integration on the text stream, preventing auxiliary modalities with high variance from overwhelming linguistic semantics and stabilizing subsequent attention. Their effects are complementary: spatial encoding provides structure, while fusion embedding enables effective integration. Similar degradation when each module is removed separately indicates neither subsumes the other.
Tables 8 and 9 further reveal that the weighting coefficient
To further illustrate the limitations of the proposed model, we analyze a representative misclassified case from the CMU-MOSEI dataset, shown in Fig. 10. The text in this sample reads: “But, if you’re interested in owning this, you can find it on amazon dot com.”
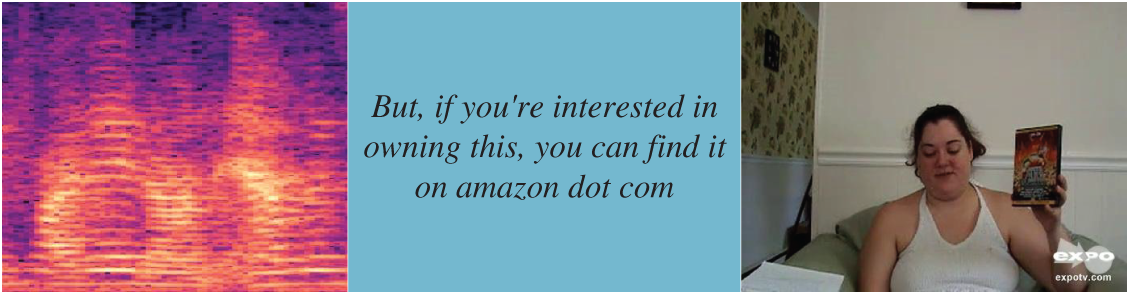
Figure 10: Misclassification cases (example from the CMU-MOSEI dataset)
The ground-truth sentiment label for this utterance is negative, yet the model incorrectly classified it as positive. This error can be primarily attributed to the dominance of text-based semantic cues in the fused representation. Specifically, the sentence contains superficially positive lexical items such as “interested” and “owning”, which are typically associated with favorable attitudes. In the absence of explicit negative sentiment words or strong negation patterns, the textual stream presents a semantic bias toward positivity.
Although our model integrates speech and visual modalities, in this case the prosodic and facial cues conveying disinterest or sarcasm were relatively subtle. The spatial position encoding mechanism preserved structural features from these modalities, but the fusion process may have assigned insufficient weight to them due to the stronger polarity signal inferred from the text. When auxiliary modalities carry low-intensity emotional cues, the model’s decision boundary may still be disproportionately influenced by lexical sentiment priors from the text.
In this paper, we proposed a multimodal sentiment analysis model that integrates fusion embedding and spatial position encoding. The model treats text as the primary modality and combines it with speech and video in a structured manner, preserving key modality-specific features. By applying spatial position encoding to speech and video, we mitigate spatial information loss and enhance feature utilization. Experiments on CMU-MOSI and CMU-MOSEI demonstrate the model performance, and ablation studies verify the contribution of each component.
In addition, our current experiments rely on benchmark datasets (CMU-MOSI and CMU-MOSEI) that provide relatively well-segmented and temporally synchronized text, audio, and video streams. However, real-world deployments often face modality asynchrony arising from heterogeneous sampling rates, imperfect speaker segmentation, frame dropping, network latency, and gradual drift between transcription timestamps and acoustic/visual signals. Such misalignment may weaken cross-modal attention and partially offset the benefits of spatial position encoding when temporal correspondence is ambiguous. Similarly, practical scenarios introduce diverse noise sources: background speech and music, reverberation, sensor or compression artifacts, facial occlusion, pose changes, tracking loss, and transcription or ASR errors. These factors can inject high-variance perturbations into time–frequency patterns or facial dynamics, potentially amplifying spurious correlations.
In future work, we will explore multi-task learning schemes, such as combining sentiment classification with intensity prediction, to further enhance model generalization. We also plan to investigate assigning primary modality roles dynamically, as well as integrating cross-modal attention mechanisms to adaptively weigh each modality. Moreover, we aim to incorporate interpretability techniques (e.g., Grad-CAM, attention visualization) to analyze the decision process, and address challenges related to temporal asynchrony in multimodal data. We also plan to perform fine-grained ablation studies on the fusion module by separately evaluating the effects of linear projection, layer normalization, and gating operations. To broaden applicability, we will also extend our spatial encoding strategy to non-grid modalities such as raw text via learnable or adaptive position encoding methods. Finally, we plan to include statistical tests and clustering metrics to strengthen the reliability of model evaluations.
We hope this modular framework serves as a foundation for future research in structured and interpretable multimodal fusion, facilitating progress in tasks beyond sentiment analysis.
Acknowledgement: Not applicable.
Funding Statement: This work was supported by the Collaborative Tackling Project of the Yangtze River Delta Sci-Tech Innovation Community (Nos. 2024CSJGG01503, 2024CSJGG01500), Guangxi Key Research and Development Program (No. AB24010317), and Jiangxi Provincial Key Laboratory of Electronic Data Control and Forensics (Jiangxi Police College) (No. 2025JXJYKFJJ002).
Author Contributions: The authors confirm contribution to the paper as follows: Chenquan Gan: Conceptualization, Validation, Writing—original draft, Writing—review & editing; Xu Liu, Yu Tang: Methodology, Writing—original draft, Formal analysis; Xianrong Yu, Qingyi Zhu, Deepak Kumar Jain: Supervision. All authors reviewed the results and approved the final version of the manuscript.
Availability of Data and Materials: All datasets used in this study are publicly available, and all referenced methods are from peer-reviewed, accessible publications.
Ethics Approval: Not applicable.
Conflicts of Interest: The authors declare no conflicts of interest to report regarding the present study.
1https://github.com/WahPr/SPEFE (accessed on 25 August 2025)
References
1. Mao Y, Liu Q, Zhang Y. Sentiment analysis methods, applications, and challenges: a systematic literature review. J King Saud Univ Comput Inf Sci. 2024;36(4):102048. doi:10.1016/j.jksuci.2024.102048. [Google Scholar] [CrossRef]
2. Li Z, Guo Q, Pan Y, Ding W, Yu J, Zhang Y, et al. Multi-level correlation mining framework with self-supervised label generation for multimodal sentiment analysis. Inf Fusion. 2023;99(6):101891. doi:10.1016/j.inffus.2023.101891. [Google Scholar] [CrossRef]
3. Zhao S, Jia G, Yang J, Ding G, Keutzer K. Emotion recognition from multiple modalities: fundamentals and methodologies. IEEE Signal Process Mag. 2021;38(6):59–73. doi:10.1109/MSP.2021.3106895. [Google Scholar] [CrossRef]
4. Guo Z, Yu K, Li Y, Srivastava G, Lin JC. Deep learning-embedded social Internet of Things for ambiguity-aware social recommendations. IEEE Trans Netw Sci Eng. 2022;9(3):1067–81. doi:10.1109/TNSE.2021.3049262. [Google Scholar] [CrossRef]
5. Chandrasekaran G, Nguyen TN, Hemanth DJ. Multimodal sentimental analysis for social media applications: a comprehensive review. Wires Data Min Knowl Discov. 2021;11(5):e1415. doi:10.1002/widm.1415. [Google Scholar] [CrossRef]
6. Lai S, Hu X, Xu H, Ren Z, Liu Z. Multimodal sentiment analysis: a survey. Displays. 2023;80(2):102563. doi:10.1016/j.displa.2023.102563. [Google Scholar] [CrossRef]
7. Ghosal D, Akhtar MS, Chauhan D, Poria S, Ekbal A, Bhattacharyya P. Contextual inter-modal attention for multi-modal sentiment analysis. In: Proceedings of the 2018 Conference on Empirical Methods in Natural Language Processing. Brussels, Belgium. Stroudsburg, PA, USA: ACL; 2018. p. 3454–66. doi:10.18653/v1/d18-1382. [Google Scholar] [CrossRef]
8. Baltrusaitis T, Ahuja C, Morency LP. Multimodal machine learning: a survey and taxonomy. IEEE Trans Pattern Anal Mach Intell. 2019;41(2):423–43. doi:10.1109/TPAMI.2018.2798607. [Google Scholar] [PubMed] [CrossRef]
9. Gandhi A, Adhvaryu K, Poria S, Cambria E, Hussain A. Multimodal sentiment analysis: a systematic review of history, datasets, multimodal fusion methods, applications, challenges and future directions. Inf Fusion. 2023;91(3):424–44. doi:10.1016/j.inffus.2022.09.025. [Google Scholar] [CrossRef]
10. Liu Z, Shen Y, Lakshminarasimhan VB, Liang PP, Zadeh A, Morency LP. Efficient low-rank multimodal fusion with modality-specific factors. arXiv:1806.00064. 2018. [Google Scholar]
11. Wllmer M, Kaiser M, Eyben F, Schuller B, Rigoll G. LSTM-Modeling of continuous emotions in an audiovisual affect recognition framework. Image Vis Comput. 2013;31(2):153–63. doi:10.1016/j.imavis.2012.03.001. [Google Scholar] [CrossRef]
12. Mai S, Sun Y, Zeng Y, Hu H. Excavating multimodal correlation for representation learning. Inf Fusion. 2023;91(2):542–55. doi:10.1016/j.inffus.2022.11.003. [Google Scholar] [CrossRef]
13. Vaswani A, Shazeer N, Parmar N, Uszkoreit J, Jones L, Gomez AN, et al. Attention is all you need. In: Advances in neural information processing systems. Long Beach, CA, USA: Curran Associates Inc.; 2017. 30 p. [Google Scholar]
14. Tsai YH, Bai S, Liang PP, Kolter JZ, Morency LP, Salakhutdinov R. Multimodal transformer for unaligned multimodal language sequences. In: Proceedings of the 57th Annual Meeting of the Association for Computational Linguistics; 2019 Jul 28–Aug 2; Florence, Italy. Stroudsburg, PA, USA: ACL; 2019. p. 6558–69. doi:10.18653/v1/p19-1656. [Google Scholar] [PubMed] [CrossRef]
15. Kumar A, Vepa J. Gated mechanism for attention based multi modal sentiment analysis. In: ICASSP 2020—2020 IEEE International Conference on Acoustics, Speech and Signal Processing (ICASSP); 2020 May 4–8; Barcelona, Spain: IEEE; 2020. p. 4477–81. doi:10.1109/ICASSP40776.2020.9053012. [Google Scholar] [CrossRef]
16. Yang X, Feng S, Wang D, Zhang Y. Image-text multimodal emotion classification via multi-view attentional network. IEEE Trans Multimed. 2021;23:4014–26. doi:10.1109/TMM.2020.3035277. [Google Scholar] [CrossRef]
17. Swain M, Routray A, Kabisatpathy P. Databases, features and classifiers for speech emotion recognition: a review. Int J Speech Technol. 2018;21(1):93–120. doi:10.1007/s10772-018-9491-z. [Google Scholar] [CrossRef]
18. Wang J, Mou L, Ma L, Huang T, Gao W. AMSA: adaptive multimodal learning for sentiment analysis. ACM Trans Multimed Comput Commun Appl. 2023;19(3s):1–21. doi:10.1145/3572915. [Google Scholar] [CrossRef]
19. Zadeh A, Chen M, Poria S, Cambria E, Morency LP. Tensor fusion network for multimodal sentiment analysis. arXiv:1707.07250. 2017. [Google Scholar]
20. Wang H, Li X, Ren Z, Yang D, Ma C. Exploring multimodal sentiment analysis via CBAM attention and double-layer BiLSTM architecture. arXiv:2303.14708. 2023. [Google Scholar]
21. Setiadi DRIM, Warto W, Muslikh AR, Nugroho K, Safriandono AN. Aspect-based sentiment analysis on E-commerce reviews using BiGRU and bi-directional attention flow. J Comput Theor Appl. 2025;2(4):470–80. doi:10.62411/jcta.12376. [Google Scholar] [CrossRef]
22. Wang H, Ren C, Yu Z. Multimodal sentiment analysis based on multiple attention. Eng Appl Artif Intell. 2025;140(2):109731. doi:10.1016/j.engappai.2024.109731. [Google Scholar] [CrossRef]
23. Xiao L, Wu X, Wu W, Yang J, He L. Multi-channel attentive graph convolutional network with sentiment fusion for multimodal sentiment analysis. In: ICASSP 2022—2022 IEEE International Conference on Acoustics, Speech and Signal Processing (ICASSP); 2022 May 23–27; Singapore: IEEE; 2022. p. 4578–82. doi:10.1109/ICASSP43922.2022.9747542. [Google Scholar] [CrossRef]
24. Lin Z, Liang B, Long Y, Dang YX, Yang M, Zhang M, et al. Modeling intra-and inter-modal relations: hierarchical graph contrastive learning for multimodal sentiment analysis. In: Proceedings of the 29th International Conference on Computational Linguistics; 2022 Oct 12–17; Gyeongju, Republic of Korea: Association for Computational Linguistics; 2022. p. 7124–35. [Google Scholar]
25. Kim K, Park S. AOBERT: all-modalities-in-One BERT for multimodal sentiment analysis. Inf Fusion. 2023;92(6):37–45. doi:10.1016/j.inffus.2022.11.022. [Google Scholar] [CrossRef]
26. Su W, Zhu X, Cao Y, Li B, Lu L, Wei F, et al. VL-BERT: pre-training of generic visual-linguistic representations. arXiv:1908.08530. 2019. [Google Scholar]
27. Tan H, Bansal M. LXMERT: learning cross-modality encoder representations from transformers. arXiv:1908.07490. 2019. [Google Scholar]
28. Zhang S, He Y, Li L, Dou Y. Multimodal sentiment analysis with BERT-ResNet50. In: Second International Conference on Algorithms, Microchips, and Network Applications (AMNA 2023); 2023 Jan 13–15; Zhengzhou, China: SPIE; 2023. 47 p. doi:10.1117/12.2679113. [Google Scholar] [CrossRef]
29. Chandrasekaran G, Dhanasekaran S, Moorthy C, Arul Oli A. Multimodal sentiment analysis leveraging the strength of deep neural networks enhanced by the XGBoost classifier. Comput Methods Biomech Biomed Engin. 2025;28(6):777–99. doi:10.1080/10255842.2024.2313066. [Google Scholar] [PubMed] [CrossRef]
30. Cai Y, Li X, Zhang Y, Li J, Zhu F, Rao L. Multimodal sentiment analysis based on multi-layer feature fusion and multi-task learning. Sci Rep. 2025;15(1):2126. doi:10.1038/s41598-025-85859-6. [Google Scholar] [PubMed] [CrossRef]
31. Gan C, Tang Y, Fu X, Zhu Q, Jain DK, Garca S. Video multimodal sentiment analysis using cross-modal feature translation and dynamical propagation. Knowl Based Syst. 2024;299(01):111982. doi:10.1016/j.knosys.2024.111982. [Google Scholar] [CrossRef]
32. Rahmani S, Hosseini S, Zall R, Kangavari MR, Kamran S, Hua W. Transfer-based adaptive tree for multimodal sentiment analysis based on user latent aspects. Knowl Based Syst. 2023;261(4):110219. doi:10.1016/j.knosys.2022.110219. [Google Scholar] [CrossRef]
33. Wang L, Peng J, Zheng C, Zhao T, Zhu L. A cross modal hierarchical fusion multimodal sentiment analysis method based on multi-task learning. Inf Process Manag. 2024;61(3):103675. doi:10.1016/j.ipm.2024.103675. [Google Scholar] [CrossRef]
34. Sun Z, Sarma P, Sethares W, Liang Y. Learning relationships between text, audio, and video via deep canonical correlation for multimodal language analysis. Proc AAAI Conf Artif Intell. 2020;34(5):8992–9. doi:10.1609/aaai.v34i05.6431. [Google Scholar] [CrossRef]
35. Zadeh A, Zellers R, Pincus E, Morency LP. MOSI: multimodal corpus of sentiment intensity and subjectivity analysis in online opinion videos. arXiv:1606.06259. 2016. [Google Scholar]
36. Bagher Zadeh A, Liang PP, Poria S, Cambria E, Morency LP. Multimodal language analysis in the wild: CMU-MOSEI dataset and interpretable dynamic fusion graph. In: Proceedings of the 56th Annual Meeting of the Association for Computational Linguistics (Volume 1: Long Papers); 2018 Jul 15–20; Melbourne, Australia. Stroudsburg, PA, USA: ACL; 2018. p. 2236–46. doi:10.18653/v1/p18-1208. [Google Scholar] [CrossRef]
37. Zadeh A, Liang PP, Poria S, Vij P, Cambria E, Morency LP. Multi-attention recurrent network for human communication comprehension. Proc AAAI Conf Artif Intell. 2018;32(1). doi:10.1609/aaai.v32i1.12024. [Google Scholar] [CrossRef]
38. Pennington J, Socher R, Manning C. Glove: global vectors for word representation. In: Proceedings of the 2014 Conference on Empirical Methods in Natural Language Processing (EMNLP); 2014 Oct 25–29; Doha, Qatar. Stroudsburg, PA, USA: ACL; 2014. p. 1532–43. doi:10.3115/v1/d14-1162. [Google Scholar] [CrossRef]
39. Degottex G, Kane J, Drugman T, Raitio T, Scherer S. COVAREP—collaborative voice analysis repository for speech technologies. In: 2014 IEEE International Conference on Acoustics, Speech and Signal Processing (ICASSP); 2014 May 4–9; Florence, Italy: IEEE; 2014. p. 960–4. doi:10.1109/icassp.2014.6853739. [Google Scholar] [CrossRef]
40. Poria S, Cambria E, Hazarika D, Majumder N, Zadeh A, Morency LP. Context-dependent sentiment analysis in user-generated videos. In: Proceedings of the 55th Annual Meeting of the Association forComputational Linguistics (Volume 1: Long Papers); 2017 Jul 30–Aug 4; Vancouver, BC, Canada. Stroudsburg, PA, USA: ACL; 2017. p. 873–83. doi:10.18653/v1/p17-1081. [Google Scholar] [CrossRef]
41. Tsai YH, Liang PP, Zadeh A, Morency LP, Salakhutdinov R. Learning factorized multimodal representations. arXiv:1806.06176. 2018. [Google Scholar]
42. Zadeh A, Liang PP, Mazumder N, Poria S, Cambria E, Morency LP. Memory fusion network for multi-view sequential learning. Proc AAAI Conf Artif Intell. 2018;32(1). doi:10.1609/aaai.v32i1.12021. [Google Scholar] [CrossRef]
43. Yang D, Liu Y, Huang C, Li M, Zhao X, Wang Y, et al. Target and source modality co-reinforcement for emotion understanding from asynchronous multimodal sequences. Knowl Based Syst. 2023;265(6):110370. doi:10.1016/j.knosys.2023.110370. [Google Scholar] [CrossRef]
44. Pham H, Liang PP, Manzini T, Morency LP, Pczos B. Found in translation: learning robust joint representations by cyclic translations between modalities. Proc AAAI Conf Artif Intell. 2019;33(1):6892–9. doi:10.1609/aaai.v33i01.33016892. [Google Scholar] [CrossRef]
45. Wu J, Mai S, Hu H. Graph capsule aggregation for unaligned multimodal sequences. In: Proceedings of the 2021 International Conference on Multimodal Interaction; 2021 Oct 18–22; Montral, QC, Canada: ACM; 2021. p. 521–9. doi:10.1145/3462244.3479931. [Google Scholar] [CrossRef]
46. Ma Y, Ma B. Multimodal sentiment analysis on unaligned sequences via holographic embedding. In: ICASSP 2022—2022 IEEE International Conference on Acoustics, Speech and Signal Processing (ICASSP); 2022 May 23–27; Singapore: IEEE; 2022. p. 8547–51. doi:10.1109/ICASSP43922.2022.9747646. [Google Scholar] [CrossRef]
47. Fu Z, Liu F, Xu Q, Fu X, Qi J. LMR-CBT: learning modality-fused representations with CB-Transformer for multimodal emotion recognition from unaligned multimodal sequences. Front Comput Sci. 2023;18(4):184314. doi:10.1007/s11704-023-2444-y. [Google Scholar] [CrossRef]
48. Rahman W, Hasan MK, Lee S, Zadeh A, Mao C, Morency LP, et al. Integrating multimodal information in large pretrained transformers. In: Proceedings of the 58th Annual Meeting of the Association for Computational Linguistics; 2020 Jul 6–8; Online. p. 2359–69. doi:10.18653/v1/2020.acl-main.214. [Google Scholar] [PubMed] [CrossRef]
49. Hazarika D, Zimmermann R, Poria S. MISA: modality-invariant and-specific representations for multimodal sentiment analysis. In: Proceedings of the 28th ACM International Conference on Multimedia; 2020 Oct 12–16; Seattle, WA, USA: ACM; 2020. p. 1122–31. doi:10.1145/3394171.3413678. [Google Scholar] [CrossRef]
Cite This Article
 Copyright © 2025 The Author(s). Published by Tech Science Press.
This work is licensed under a Creative Commons Attribution 4.0 International License , which permits unrestricted use, distribution, and reproduction in any medium, provided the original work is properly cited.
 Downloads
 Citation Tools