
 Submit a Paper
 Propose a Special lssue
 Open Access
ARTICLE

Reducing UI Complexity Using Use Case Analysis in Adaptive Interfaces
1 Department of Industrial Engineering, School of Business Administration, Northeastern University, Shenyang, 110167, China
2 AI Department, Quince, Austin, TX 78717, USA
3 School of Industrial Engineering, Purdue University, West Lafayette, IN 47907, USA
* Corresponding Authors: Qing-Xing Qu. Email: ; Le Zhang. Email:
Computers, Materials & Continua 2025, 85(3), 4607-4627. https://doi.org/10.32604/cmc.2025.069245
Received 18 June 2025; Accepted 25 August 2025; Issue published 23 October 2025
 View Full Text
 Download PDF
Abstract
This study aims to validate the Object-Oriented User Interface Customization (OOUIC) framework by employing Use Case Analysis (UCA) to facilitate the development of adaptive User Interfaces (UIs). The OOUIC framework advocates for User-Centered Design (UCD) methodologies, including UCA, to systematically identify intricate user requirements and construct adaptive UIs tailored to diverse user needs. To operationalize this approach, thirty users of Product Lifecycle Management (PLM) systems were interviewed across six distinct use cases. Interview transcripts were subjected to deductive content analysis to classify UI objects systematically. Subsequently, adaptive UIs were developed for each use case, and their complexity was quantitatively compared against the original system UIs. The results demonstrated a significant reduction in complexity across all adaptive UIs (Mean Difference, MD = 0.11, t(5) = 8.26, p < 0.001), confirming their superior efficiency. The findings validate the OOUIC framework, demonstrating that UCD effectively captures complex requirements for adaptive UI development, while adaptive UIs mitigate interface complexity through object reduction and optimized layout design. Furthermore, UCA and deductive content analysis serve as robust methodologies for object categorization in adaptive UI design. Beyond eliminating redundant elements and prioritizing object grouping, designers can further reduce complexity by adjusting object dimensions and window sizing. This study underscores the efficacy of UCA in developing adaptive UIs and streamlining complex interfaces. Ultimately, UCD proves instrumental in gathering intricate requirements, while adaptive UIs enhance usability by minimizing object clutter and refining spatial organization.Keywords
Complex Information Systems (CIS) have been widely adopted across various domains, enabling organizations to efficiently manage extensive and intricate datasets [1–3]. As noted by Susarla et al. (2023), a CIS integrates multiple applications to support diverse users in handling complex information within sophisticated operational environments [4]. Despite their robust functionality, CIS platforms present significant usability challenges. First, the steep learning curve associated with mastering these systems demands considerable time investment—for instance, training engineers to proficiently operate Computer-Aided Design (CAD) applications can be highly resource-intensive [5]. Given that CIS often encompasses a suite of interconnected applications (e.g., Product Lifecycle Management (PLM) systems incorporating Product Data Management (PDM), CAD, Computer-Aided Engineering (CAE), and Computer-Aided Manufacturing (CAM) modules), acquiring proficiency across these tools further escalates training costs and cognitive load [6]. Second, the inherent complexity of CIS user interfaces (UIs)—often cluttered with excessive interactive objects—leads to critical usability issues, including operational inefficiencies, decision-making errors, and prolonged task completion times [7,8]. Streamlining these UIs has been shown to enhance user comprehension and task performance, thereby mitigating these challenges [9,10].
Interface customization has emerged as an effective approach to mitigate complexity in modern user interfaces [11]. Within this paradigm, adaptive user interface development represents a systematic customization methodology that optimizes UI elements to enhance task completion efficiency [12]. However, the heterogeneous user populations characteristic of CIS present significant challenges in requirements elicitation for adaptive UI development [13,14]. User-Centered Design (UCD) methodologies address these challenges through a structured process of user identification, requirements gathering, and subsequent UI adaptation [15–17]. Notably, Use Case Analysis (UCA), as a core UCD technique, enables systematic goal decomposition and requirements categorization through role-specific scenario analysis [18–20]. This approach effectively reduces requirements complexity by employing a focused, role-centric methodology that isolates and addresses individual user needs in discrete analytical phases.
Zhang et al. (2020) introduced the Object-Oriented User Interface Customization (OOUIC) framework, which advocates for employing UCD principles to develop adaptive user interfaces and mitigate UI complexity [10]. To empirically validate the OOUIC framework’s effectiveness, the present study implements UCA to engineer adaptive UIs for two distinct PLM systems, subsequently conducting a comparative analysis of interface complexity metrics between the adapted and original UI implementations.
Prior research has established alignment, grouping, size, density, and balance as five fundamental metrics for quantitative assessment of interface complexity [21,22]. These metrics have demonstrated robust applicability across diverse interface paradigms, including web-based platforms and graphical user interfaces (GUIs). To empirically validate the efficacy of UCA in developing simplified adaptive UIs, the present study employs these five complexity metrics for comparative evaluation between the original and adapted interface implementations. The central research question guiding this investigation is:
Can the adaptive UIs developed by UCA have less interface complexity than the original UIs of PLM systems?
This study begins with a comprehensive literature review examining current research in adaptive user interfaces and UCD methodologies. Subsequently, we present our methodological framework for adaptive UI development and interface complexity quantification. Following the methodological exposition, we report comparative findings between the adapted and original interface implementations. Finally, based on empirical evidence derived from our experimental results, we propose evidence-based design guidelines for optimizing adaptive UI development.
Interface customization represents a sophisticated approach to user interface personalization, modifying both layout and interaction modalities to accommodate individual user requirements while permitting direct user modifications [23–25]. This paradigm encompasses two distinct implementation strategies: adaptable interfaces, which enable explicit user-driven customization to address specific needs [26–28], and adaptive interfaces that automatically adjust to user characteristics. In Complex Information System (CIS) environments with numerous users, designer-implemented per-user customization becomes impractical, making adaptable interfaces theoretically advantageous by distributing customization tasks to end-users. However, empirical studies reveal significant user reluctance toward adaptable solutions due to the cognitive overhead associated with manual customization, particularly in complex interface environments [29]. Conversely, research indicates substantially higher user acceptance rates for pre-tailored adaptive interfaces [30], establishing them as the preferred approach for CIS implementations [24].
Adaptive user interfaces are generated through either designer intervention or artificial intelligence algorithms, which analyze user behavior patterns and preferences to automatically tailor interface configurations for specific user roles and tasks [31]. From a user experience perspective, this adaptation process occurs implicitly—users simply provide initial requirements to designers or generate behavioral data for Artificial Intelligence (AI) systems, while the system handles the actual customization. This passive involvement significantly reduces user effort compared to manual customization, resulting in substantially higher adoption rates and user satisfaction [32].
Adaptive user interfaces have demonstrated significant versatility across multiple domains, including dynamic data visualization, cross-platform device compatibility, and culturally sensitive interface personalization [33]. Seminal work by Gajos et al. (2010) introduced an automated adaptive UI framework capable of dynamically adjusting to diverse devices, task requirements, user preferences, and accessibility needs, while facilitating seamless integration across multiple systems [34]. Their system employed intelligent algorithms to optimize interface configurations and assist designers in the customization process, significantly enhancing development efficiency—an approach now widely adopted in contemporary applications. Further advancing this paradigm, Akiki et al. (2014) identified three key enhancement strategies: (1) incorporating end-user customization capabilities, (2) preserving designer-specified interface constraints, and (3) developing specialized tooling to support user-driven adaptations [35]. Collectively, these studies establish adaptive UIs as robust solutions for ensuring operational efficiency, enhanced usability, and broad applicability across diverse use cases. Nevertheless, substantial implementation challenges persist in real-world deployments [36].
CIS serve diverse user roles with heterogeneous requirements [1,5], presenting significant design challenges in both requirements elicitation and adaptive interface development [2,4]. While AI leverages machine learning to rapidly predict user preferences at scale, its effectiveness remains constrained by algorithmic accuracy limitations [36]. Traditional requirements gathering and analysis processes remain resource-intensive, necessitating systematic methodologies to improve efficiency. UCD offers a structured framework for role-based user segmentation and targeted adaptive UI development [37], significantly streamlining the customization process for multi-user environments [38]. This approach enables designers to efficiently address the variability in user needs while maintaining development scalability.
User-Centered Design (UCD) constitutes a human-centric design philosophy that prioritizes end-user needs throughout the development lifecycle, emphasizing both functional utility and usability optimization [15,37,39]. This methodology mandates three core practitioner responsibilities: (1) systematic user identification, (2) active user engagement in design processes, and (3) user-driven solution development. UCD offers robust analytical tools—including affinity diagramming, persona development, and scenario mapping—to facilitate rigorous user segmentation based on role-specific behavioral patterns and objectives [40]. For requirements elicitation, UCD incorporates qualitative techniques such as focus groups, contextual inquiry, and Use Case Analysis (UCA), enabling comprehensive data collection from targeted user samples [41]. The framework further provides evidence-based design heuristics to translate user requirements into optimized interface solutions [42], complemented by iterative usability testing protocols that identify and remediate interaction deficiencies throughout the development cycle [43].
Empirical research has demonstrated the efficacy of UCD methodologies in both developing adaptive interfaces and conducting comprehensive usability evaluations. Johnson et al. (2005) established a systematic ten-phase framework for UI redesign, specifically addressing interfaces developed without UCD considerations [44]. Their findings empirically validated that UCD-guided redesigns significantly enhance four critical dimensions of user experience: satisfaction, perceived usefulness, information quality, and interface quality. These UCD principles maintain relevance throughout the entire Complex Information System (CIS) development lifecycle as quality assurance mechanisms. Van Velsen et al. (2008) further substantiated UCD’s pivotal role in evaluating and refining adaptive interfaces [45], proposing a multimodal assessment framework incorporating: (1) questionnaire-based usability metrics, (2) interview-derived user intentions, (3) behavioral analytics from system logs, (4) focus group-generated behavioral rationales, (5) cognitive feedback via think-aloud protocols, and (6) expert-led accessibility audits.
Use Case Analysis (UCA) serves as an effective methodology for requirements elicitation in complex environments by systematically categorizing users based on their roles and objectives, thereby enhancing efficiency in both requirements gathering and adaptive UI design. A use case comprises a structured set of scenarios that delineate interactions between an actor (either a user or an external system) and the target system to accomplish a defined goal. The Object-Oriented User Interface Customization (OOUIC) framework advocates for the application of UCD principles to facilitate adaptive user interface development and complexity reduction. This study empirically validates the OOUIC framework through a systematic implementation of UCA to engineer adaptive UIs for six distinct use cases across two Product Lifecycle Management (PLM) systems. A comparative evaluation was conducted to quantitatively assess interface complexity metrics between the newly developed adaptive UIs and the systems’ original interface implementations.
2.3 Object-Oriented User Interface Customization Framework
Zhang et al. (2020) introduced the Object-Oriented User Interface Customization (OOUIC) framework as a comprehensive methodology for implementing systematic customization in Complex Information Systems (CIS) [10]. The framework advocates for employing User-Centered Design (UCD) principles to both identify intricate user requirements and subsequently transform these requirements into optimized adaptive user interfaces. As depicted in Fig. 1, the OOUIC framework comprises four distinct architectural layers that collectively facilitate this customization process.
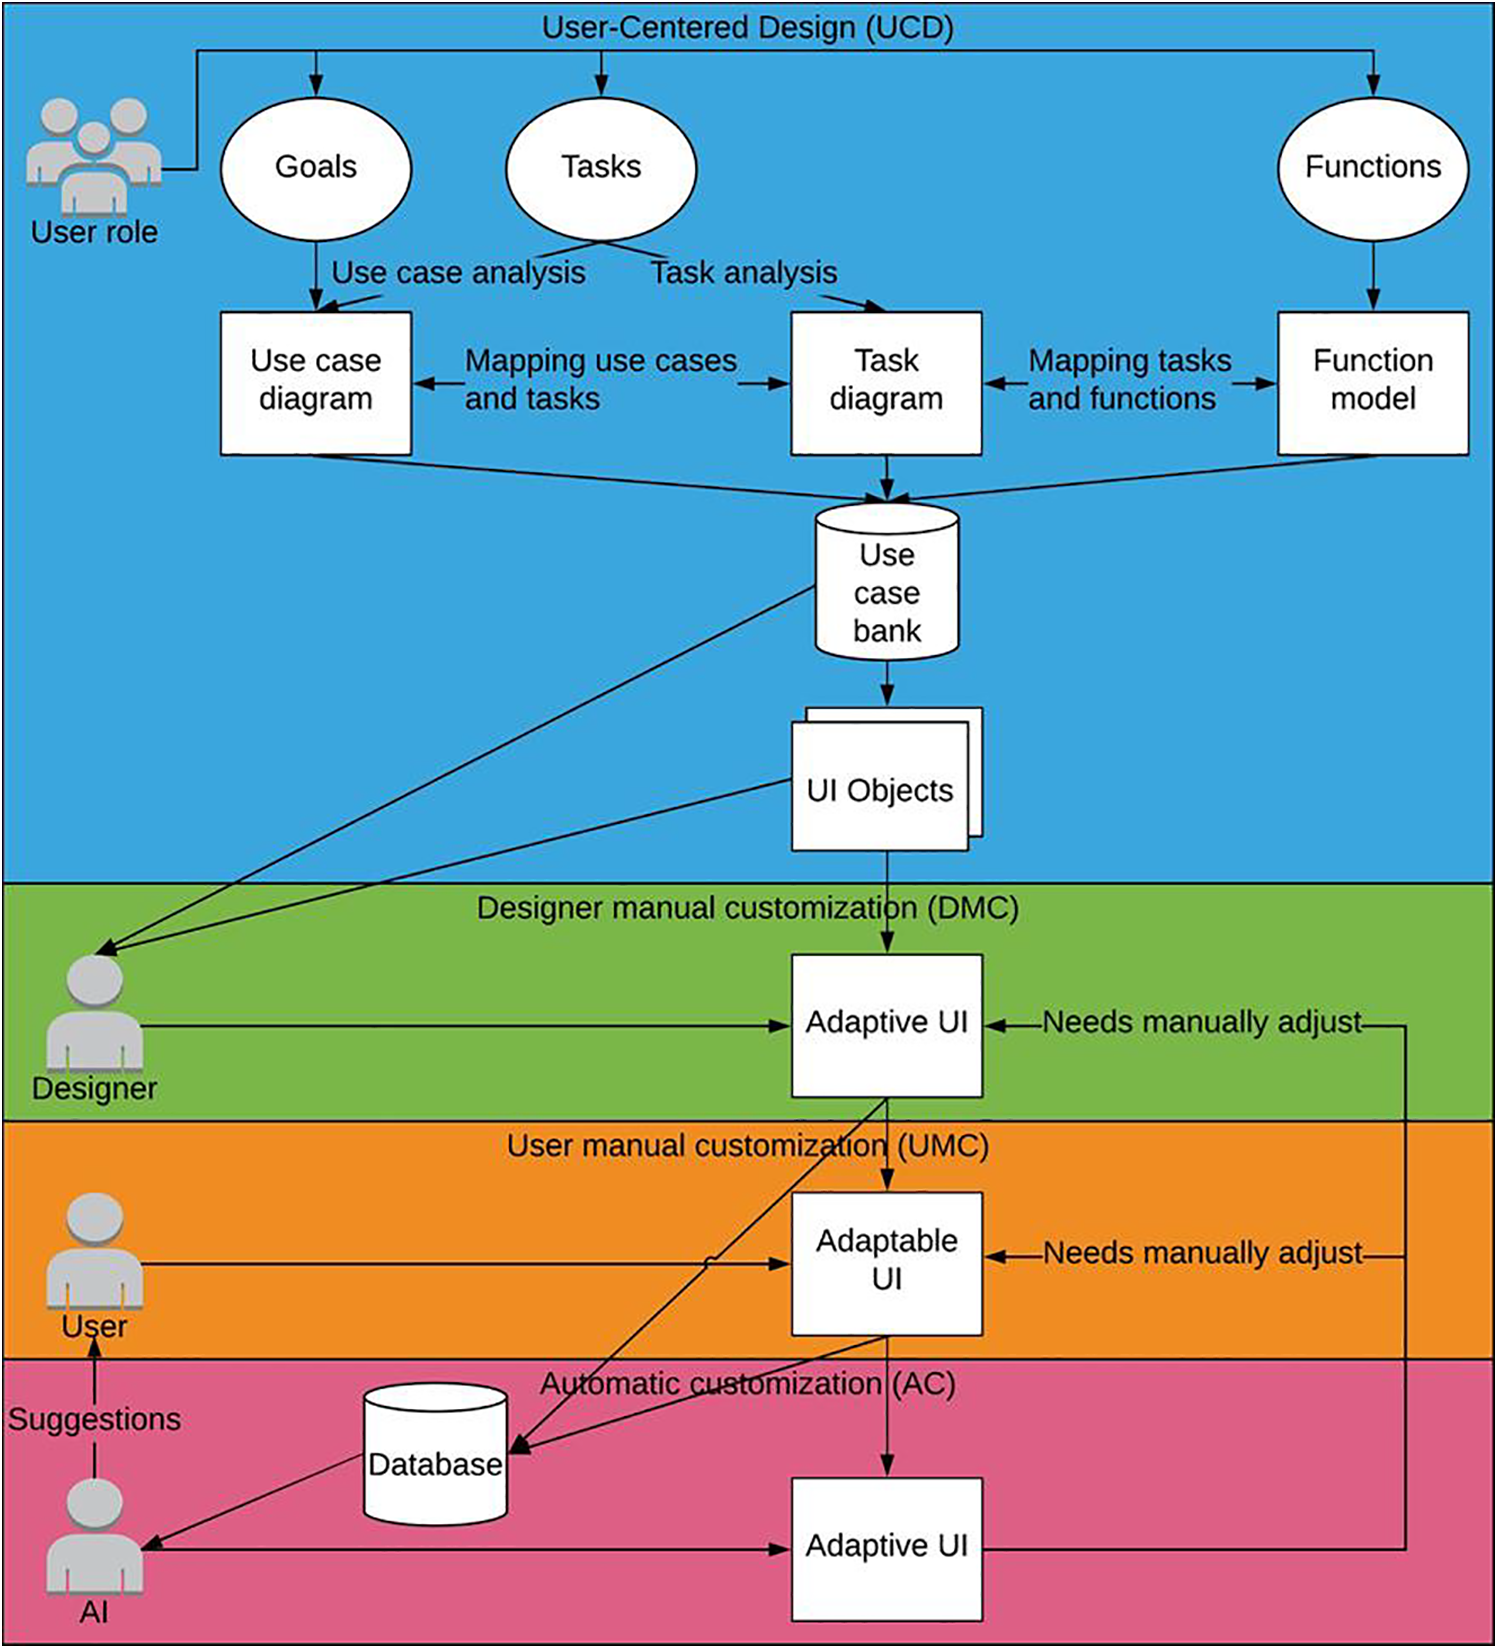
Figure 1: Object-oriented user interface customization framework
The OOUIC framework’s architecture comprises four interconnected layers. The foundational User-Centered Design (UCD) layer employs established UCD methodologies to systematically gather and analyze user requirements. These outputs feed into the Designer Manual Customization (DMC) layer, where interface specifications are transformed into simplified adaptive UIs through structured design processes. The subsequent User Manual Customization (UMC) layer enables end-users to further personalize these pre-adapted interfaces, with all modifications and customization patterns being systematically recorded. These data streams inform the Automatic Customization (AC) layer, where machine learning algorithms analyze historical patterns to: (1) generate intelligent customization recommendations, (2) automate UI adaptations for new software deployments, and (3) optimize the framework through continuous learning. This creates a closed-loop system where AC layer outputs are recursively evaluated in the DMC layer, while simultaneously enhancing UMC layer personalization through predictive suggestions. The iterative architecture ensures dynamic adaptation to evolving user needs, task requirements, and software environments through continuous data exchange between all layers.
The Automatic Customization (AC) layer of the Object-Oriented User Interface Customization (OOUIC) framework holds significant potential for intelligent UI adaptation by leveraging machine learning to analyze historical user interaction patterns and generate predictive customization recommendations. While the current study focuses on the User-Centered Design (UCD) and Designer Manual Customization (DMC) layers, future work on the AC layer will explore implementing algorithms such as reinforcement learning for real-time UI adjustments based on user behavior and deep learning models (e.g., recurrent neural networks) to predict optimal interface configurations for specific user roles. Preliminary steps have included collecting user interaction logs from the evaluated PLM systems to establish a dataset for training such models, with plans to integrate these into a closed-loop system that refines UI adaptations dynamically based on continuous user feedback.
This study was conducted in full compliance with the American Psychological Association’s Ethical Principles and received formal approval from the Institutional Review Board (IRB) (ID: 1602017215) at Purdue university. Data collection involved thirty semi-structured interviews with professionals from two U.S.-based industrial organizations (coded as Company A and Company B to maintain confidentiality). Each organization nominated fifteen qualified participants who were provided with detailed recruitment materials, including information sheets outlining study objectives and participant rights. All participants provided voluntary informed consent, with explicit assurance that their employment status would remain unaffected by participation decisions. As demonstrated in Table 1, participants possessed substantial work experience (M = 8.2 years, SD = 3.1) and PLM system proficiency (M = 5.4 years, SD = 2.3), ensuring they possessed the necessary domain expertise to comprehensively describe relevant use cases. The participant group (n = 30) consisted of design engineers from two U.S.-based industrial organizations, with an age range of 28–52 years (M = 35.6, SD = 6.2), comprising 70% male (n = 21) and 30% female (n = 9) participants.

Prior to data collection, the research team conducted preliminary site visits at both organizations to gather system specifications and operational context regarding their PLM implementations. The participant pool consisted exclusively of design engineers demonstrating daily system engagement, from which three high-frequency workflows were identified as representative use cases: (1) Advanced Search—involving targeted retrieval of specific component records from the product database; (2) Part Creation—encompassing the generation of new digital component specifications; and (3) Workflow Assignment—pertaining to the distribution of development tasks across team members. These core functionalities were selected based on their frequency of use and critical role in the engineers’ daily operations.
Structured interviews were conducted to elicit detailed insights regarding the three target use cases. The interview protocol comprised three distinct sections: (1) a demographic assessment consisting of seven questions probing participants’ professional experience and PLM system proficiency; (2) a role-specific inquiry featuring seven questions examining their system responsibilities and task workflows; and (3) a scenario-based evaluation presenting visual stimuli (system screenshots) to guide participants through step-by-step descriptions of each use case execution. To facilitate accurate object identification while maintaining confidentiality, all interface elements were anonymized using rectangular masking and alphanumeric coding, with Systems A and B representing the respective proprietary PLM implementations (see Figs. 2 and 3 for coded representations). This standardized approach ensured cross-system comparability while protecting sensitive organizational information.
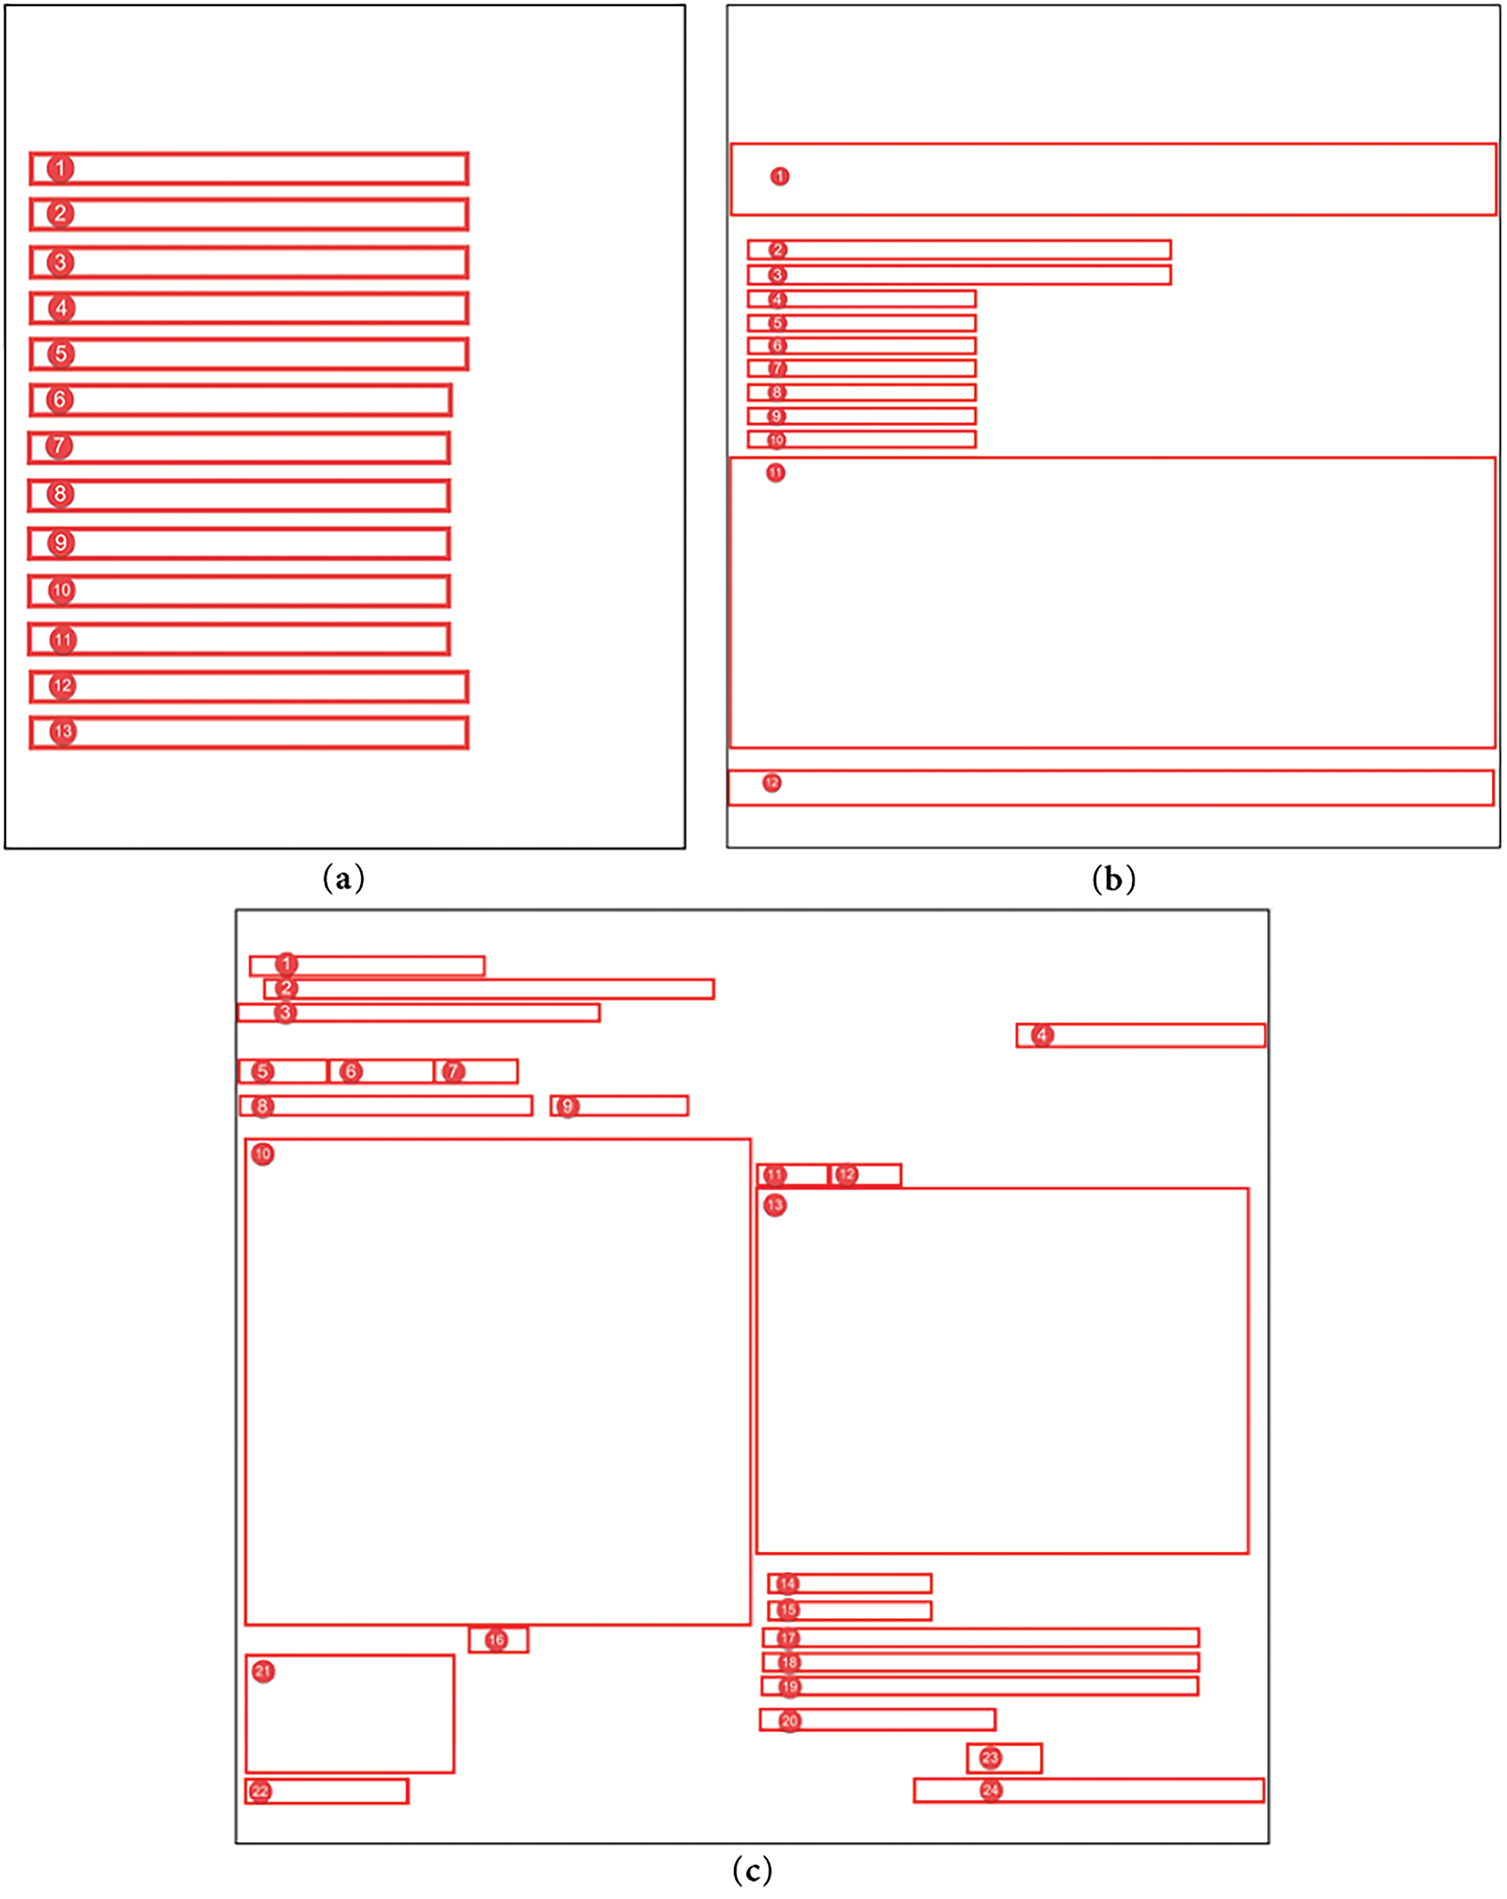
Figure 2: Original “advanced search” UI, “create” UI, and “assign workflow” UI of System A. (a): Original “advanced search” UI of System A, including 13 objects; (b): Original “create” UI of System A, including 12 objects; (c): Original “assign workflow” UI of System A, including 24 objects
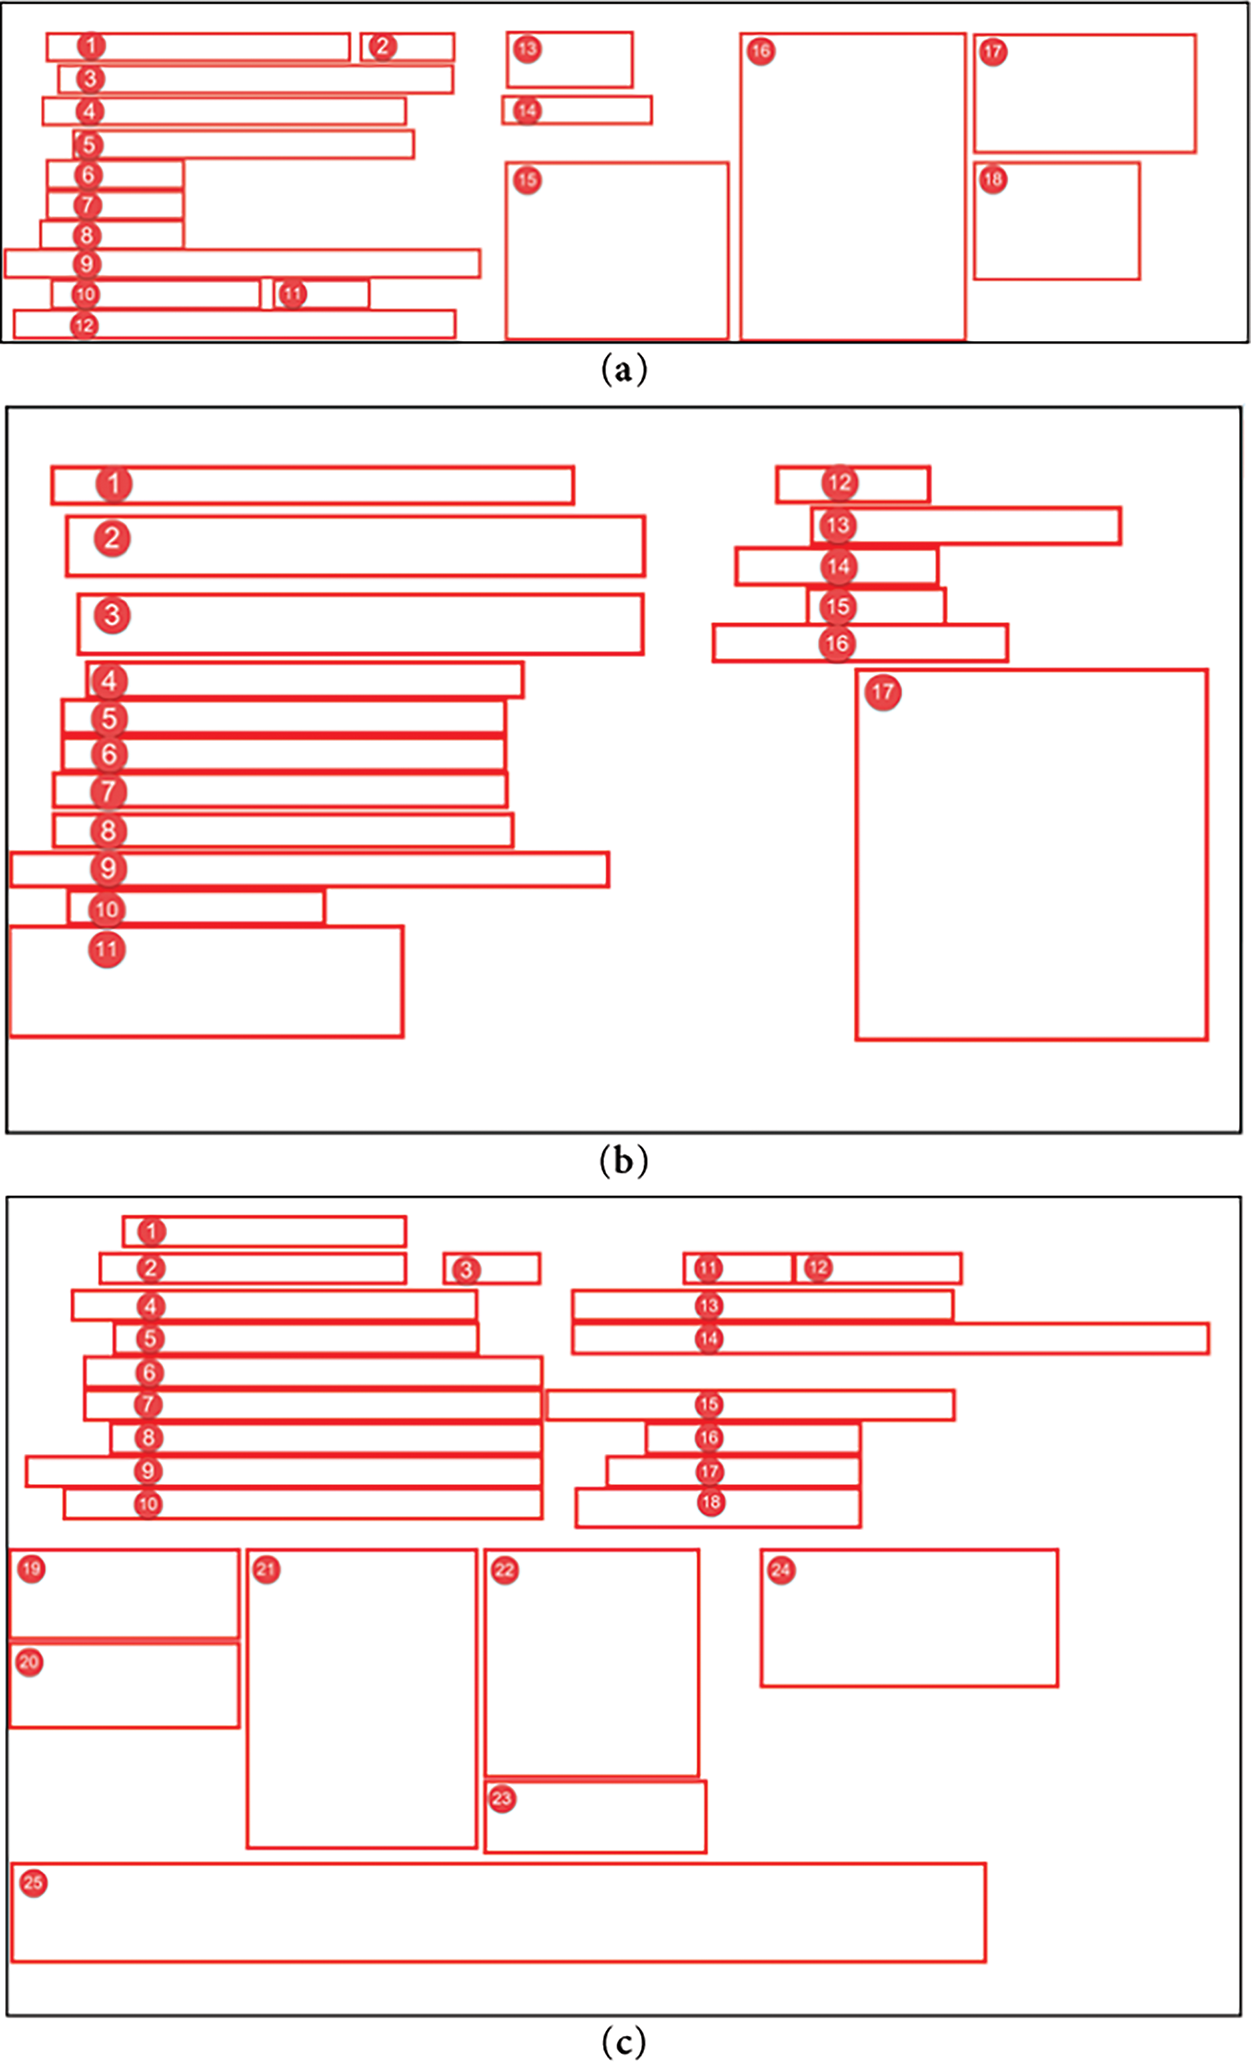
Figure 3: Original “advanced search” UI, “create” UI, and “assign workflow” UI of System B. (a): Original “advanced search” UI of System B, including 18 objects; (b): Original “create” UI of System B, including 17 objects; (c): Original “assign workflow” UI of System B, including 25 objects
Fig. 2a displays 13 objects, including 3 essential elements (e.g., search input field, submit button, result display, coded as 1–3), 1 configurable-default element (e.g., filter toggle, coded as 12), and 9 non-functional elements (e.g., redundant buttons, decorative icons, coded as 4–11, 13); Fig. 2b contains 12 objects, with 3 essential elements (e.g., part specification input, save button, template selector, coded as 2, 3, 7), 3 configurable-default elements (e.g., default parameter fields, coded as 4, 5, 10), and 6 non-functional elements (e.g., unused dropdowns, coded as 1, 6, 8, 9, 11, 12). Fig. 2c comprises 24 objects, including 6 essential elements (e.g., task assignment input, team member selector, confirm button, coded as 2, 10, 13, 17, 18, 23), 3 configurable-default elements (e.g., preset workflow templates, coded as 1, 3, 8), and 15 non-functional elements (e.g., redundant navigation links, coded as 4–7, 9, 11, 12, 14–16, 19–22, 24).
Fig. 3a includes 18 objects, with 4 essential elements (e.g., search bar, query submit, result filter, result table, coded as 1–3, 14), 2 configurable-default elements (e.g., advanced filter options, coded as 16, 17), and 12 non-functional elements (e.g., decorative graphics, unused toggles, coded as 4–13, 15, 18); Fig. 3b features 17 objects, including 5 essential elements (e.g., part name input, specification fields, save button, coded as 1, 2, 4, 5, 12), 6 configurable-default elements (e.g., default settings menus, coded as 9, 13–17), and 6 non-functional elements (e.g., redundant icons, coded as 3, 6–8, 10, 11); Fig. 3c contains 25 objects, with 10 essential elements (e.g., task input, assignee dropdown, priority selector, coded as 5, 10, 12, 14, 19–23, 25), 10 configurable-default elements (e.g., preset task templates, coded as 1–4, 6, 7, 9, 11, 16, 17), and 5 non-functional elements (e.g., unused buttons, coded as 8, 13, 15, 18, 24).
Interview sessions were conducted in designated conference rooms at each participating organization to ensure environmental control and participant privacy. Following established research protocols, each session involved one participant and the research team in a controlled, distraction-free setting. Researchers initiated the process by reviewing the informed consent documentation, explicitly detailing the study’s objectives and methodological procedures. Upon securing verbal consent, the semi-structured interview commenced, with a strict 60-min time limit maintained across all sessions. Participants provided verbal responses to all protocol items, with researchers offering standardized prompts and requesting clarifications when necessary to ensure data completeness. All sessions were audio-recorded using professional equipment solely for transcription accuracy purposes, with digital files permanently deleted following verbatim transcription in accordance with IRB-approved data management protocols.
3.4 Deductive Content Analysis
This study employed deductive content analysis to systematically examine interview transcripts, a methodological approach particularly suited for hypothesis verification through predefined categorical frameworks. A four-tier classification matrix was developed to categorize UI elements: (1) Essential—objects explicitly identified by participants as critical for task completion; (2) Configurable Default—objects requiring initial parameterization but maintaining static values during routine operations; (3) Non-functional—objects demonstrating no measurable utility across participant workflows; and (4) Ambiguous—objects not referenced during interviews. Two independent coders conducted the analysis using NVivo Pro 11 qualitative analysis software, with inter-rater reliability rigorously assessed through Cohen’s kappa coefficient to ensure coding consistency.
The coded data informed the development of structured use case diagrams and comprehensive descriptions, which systematically classified interface elements into three functional categories: essential, configurable default, and non-functional components. Adaptive interface prototypes were subsequently engineered through: (1) elimination of non-functional elements, and (2) strategic reorganization of essential and default components. These elements were partitioned into distinct visual zones, with essential objects prioritized in high-visibility regions (e.g., top/left visual fields) to optimize accessibility, while default elements were allocated to secondary areas (bottom/right fields). A comparative analysis of complexity metrics between the adaptive prototypes and original interfaces was conducted to quantitatively evaluate the research hypothesis.
Alemerien and Magel (2014) established a quantitative framework for assessing interface complexity during formative design stages, comprising five principal metrics: (1) visual alignment (spatial organization of elements), (2) functional grouping (logical clustering of related components), (3) element sizing (relative dimensional proportions), (4) information density (content distribution per unit area), and (5) aesthetic balance (symmetrical/asymmetrical weight distribution) [21]. These metrics provide a systematic approach for evaluating UI complexity prior to implementation.
Alignment: The alignment complexity of a user interface is determined by its vertical and horizontal alignment reference points, which govern the spatial organization of interface elements. A reduction in the total number of distinct alignment points corresponds to decreased visual complexity, as quantified by the Alignment-Complexity (AC) metric. The AC is formally expressed as:
where Vi and Hi are the number of vertical alignment points and horizontal alignment points of objects i, respectively. Vi is 1 if the object i’s vertical alignment point is not counted before and 0 if the vertical alignment point is already counted. Hi is calculated in the same way, and n is the number of total objects.
Grouping: Grouping complexity quantifies the perceptual organization of interface elements through strategic spatial clustering, chromatic differentiation, or containment framing based on functional or informational relationships. The Grouping-Complexity (GC) metric evaluates the cognitive efficiency of these visual hierarchies by measuring both the logical coherence of element associations and their gestalt unification. The GC is formally defined as:
where nungrouped is the number of ungrouped objects, nj is the number of different object types in group j, ngrouped is the number of groups, and n is the number of total objects.
Size: Size Complexity (SC) quantifies the dimensional heterogeneity of interface elements while controlling for multi-category inflation. The metric evaluates size variations within each object category independently, preventing artificial complexity escalation when diverse element types exhibit proportional sizing differences. This categorical isolation ensures the SC metric accurately reflects perceptually relevant size discrepancies rather than systemic diversity. The SC is formally expressed as:
where nk is the number of different sizes of objects in type l, nk is 1 if the size is not counted before and 0 if the size is already counted. nl is the number of objects in type l, ntypes is the number of different object types, and n is the number of total objects.
Density: Density Complexity (DC) quantifies the spatial occupation efficiency of interface elements by calculating the proportional relationship between the cumulative area of visual components and the total available display real estate. This metric evaluates information density while accounting for optimal whitespace distribution and visual crowding effects. The DC is formally defined as:
where Si is the size of object i, S is the total screen size, and n is the number of total objects.
Balance: The Balance Complexity (BC) metric, originally formulated by Alemerien and Magel (2014), provides a quantitative assessment of visual equilibrium by analyzing the symmetrical distribution of interface elements across four screen quadrants [21]. This metric evaluates the degree of compositional harmony through comparative weighting of graphical components in opposing visual fields. The BC is mathematically expressed as:
where sa is the overall object size of a quadrant which has the smaller object size than sb, sb is the overall object size of a quadrant which has the larger object size than sa, the ratio of sa to sb is always between 0 and 1. Since there are four quadrants, they can have six pair ratios. na is the overall object number of a quadrant which has the smaller object number than nb, nb is the overall object number of a quadrant which has the larger object number than na, the ratio of na to nb is always between 0 and 1. They also have six pair ratios. The object number and object size of each quadrant can be calculated by summing them up. If an object appears in more than one quadrant, it belongs to the quadrant which owns its largest size. If two quadrants have the same size of an object, each quadrant has 0.5 objects.
Overall Complexity: Overall complexity is calculated by taking a weighted average of five measures. According to Alemerien and Magel (2014) [21], weights of alignment, grouping, size, density, and balance are WA = 0.21, WG = 0.22, WS = 0.18, WD = 0.20, WB = 0.19, respectively. The equation for overall Complexity (C) is:
Two independent coders conducted thematic analysis of the thirty interview transcripts using a structured coding protocol. The finalized coding framework comprised 544 distinct codes, systematically classified into four mutually exclusive categories: essential, configurable-default, non-functional, or unaddressed elements. As presented in Table 2, inter-rater reliability analysis yielded a Cohen’s kappa coefficient of κ = 0.73 (95% CI [0.68,0.78]). This demonstrates substantial agreement according to conventional interpretation thresholds, where values between 0.61–0.80 represent strong concordance. The robust inter-coder reliability supports the internal validity and coding consistency of our qualitative analysis.

4.2 Use Case Diagrams and Descriptions
The content analysis outcomes informed the systematic development of use case diagrams and comprehensive scenario descriptions. As illustrated in Fig. 4, System A’s “advanced search” functionality was modeled through structured use case analysis, revealing: (1) the primary actor (design engineer) requires targeted part retrieval functionality; (2) core interaction involves keyword input through three essential interface components (Objects 1–3); (3) an optional configuration element (Object 12) typically retains default parameters; (4) remaining UI components demonstrated no measurable utility; and (5) the workflow necessitates system-generated part verification feedback. This structured representation captures both the essential task flow and interface optimization opportunities identified through empirical analysis.
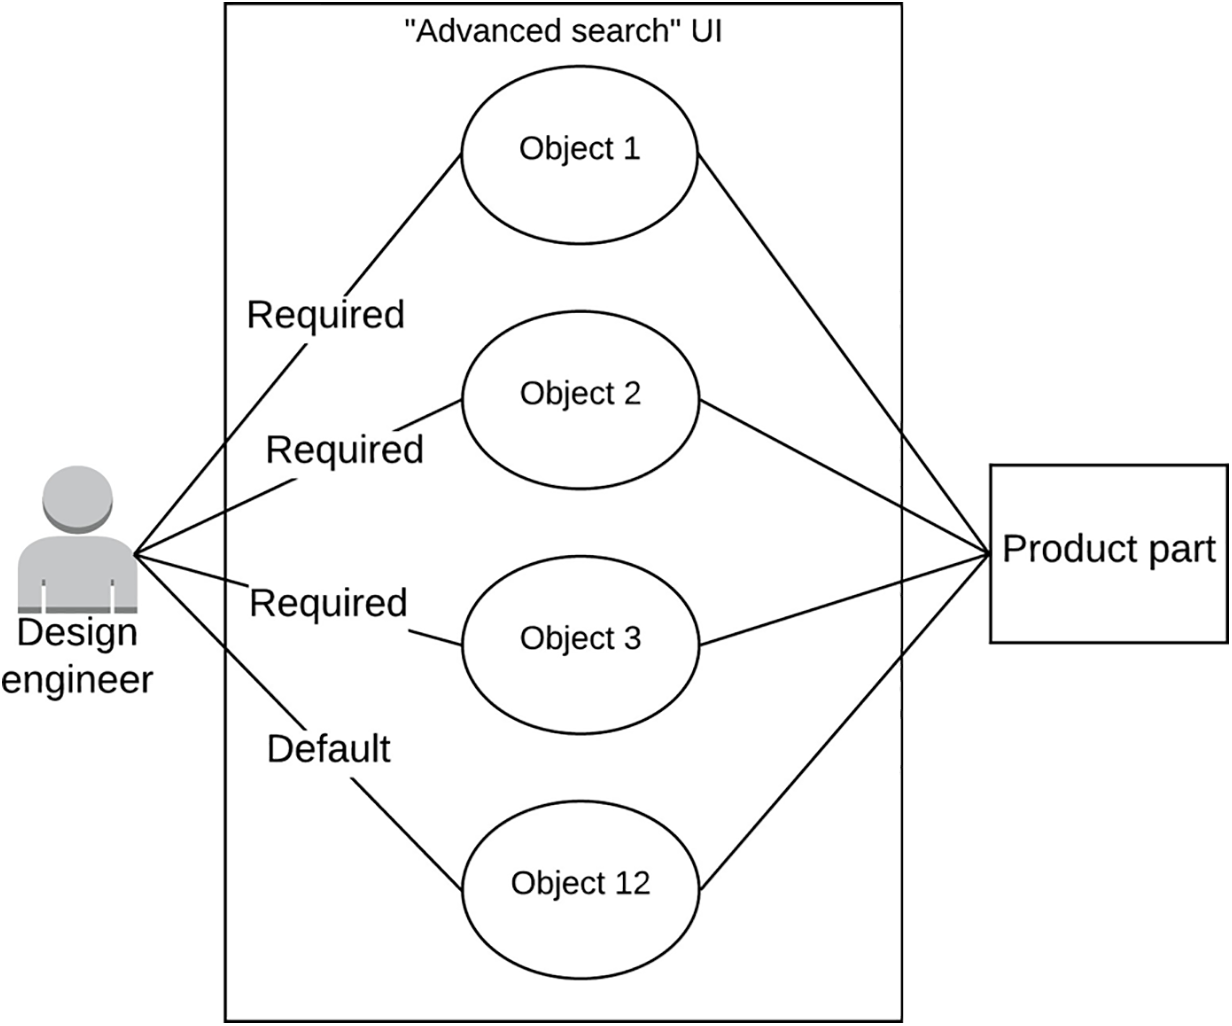
Figure 4: Use case diagram
The use case analysis yielded systematic categorization of interface components across all evaluated workflows. As presented in Table 3, quantitative analysis revealed significant variation in functional element distribution: For System A, the advanced search functionality comprised 3 essential components, 1 configurable-default element, and 9 non-functional items, while the creation workflow contained a balanced 3:3:6 ratio of these respective categories. The workflow assignment interface showed greater complexity with 6 essential, 3 default-configured, and 15 obsolete elements. System B demonstrated different optimization patterns, with its advanced search featuring 4 core elements, 2 default-configurable items, and 12 redundant components. The creation interface exhibited 5 fundamental, 6 customizable-default, and 6 unnecessary elements, whereas the workflow assignment function contained 10 mission-critical, 10 preset-configurable, and 5 extraneous components.

Figs. 5 and 6 present the optimized adaptive interface configurations derived for each use case through the systematic application of the OOUIC framework. These visual representations demonstrate the refined UI architectures resulting from: (1) elimination of non-functional elements, (2) strategic reorganization of essential components, and (3) intelligent placement of configurable-default elements based on usage patterns.

Figure 5: Adaptive UIs of “advanced search” UI, “create” UI, and “assign workflow” UI of System A. (a): Adaptive UI of System A’s “advanced search” UI, including three required objects and one default object; (b): Adaptive UI of System A’s “create” UI, including three required objects and three default objects; (c): Adaptive UI of System A’s “assign workflow” UI, including six required objects and three default objects

Figure 6: Adaptive UIs of “advanced search” UI, “create” UI, and “assign workflow” UI of System B. (a): Adaptive UI of System B’s “advanced search” UI, including four required objects and two default objects; (b): Adaptive UI of System B’s “create” UI, including five required objects and six default objects; (c): Adaptive UI of System B’s “assign workflow” UI, including ten required objects and ten default objects
Fig. 5a reduced from 13 to 4 objects by eliminating 9 non-functional elements (e.g., redundant buttons, coded as 4–11, 13) and reorganizing 3 essential elements (e.g., search input, submit button, result display, coded as 1–3) and 1 configurable-default element (e.g., filter toggle, coded as 12) into high-visibility top-left zones. Non-functional elements were removed to optimize usability; Fig. 5b reduced from 12 to 6 objects by eliminating 6 non-functional elements (e.g., unused dropdowns, coded as 1, 6, 8, 9, 11, 12) and reorganizing 3 essential elements (e.g., part specification input, save button, template selector, coded as 2, 3, 7) and 3 configurable-default elements (e.g., default parameter fields, coded as 4, 5, 10) into prioritized top-left and secondary bottom-right zones; Fig. 5c reduced from 24 to 9 objects by eliminating 15 non-functional elements (e.g., redundant navigation links, coded as 4–7, 9, 11, 12, 14–16, 19–22, 24) and reorganizing 6 essential elements (e.g., task assignment input, team member selector, confirm button, coded as 2, 10, 13, 17, 18, 23) and 3 configurable-default elements (e.g., preset workflow templates, coded as 1, 3, 8) into high-visibility top-left zones.
Fig. 6a reduced from 18 to 6 objects by eliminating 12 non-functional elements (e.g., decorative graphics, unused toggles, coded as 4–13, 15, 18) and reorganizing 4 essential elements (e.g., search bar, query submit, result filter, result table, coded as 1–3, 14) and 2 configurable-default elements (e.g., advanced filter options, coded as 16, 17) into high-visibility top-left zones; Fig. 6b reduced from 17 to 11 objects by eliminating 6 non-functional elements (e.g., redundant icons, coded as 3, 6–8, 10, 11) and reorganizing 5 essential elements (e.g., part name input, specification fields, save button, coded as 1, 2, 4, 5, 12) and 6 configurable-default elements (e.g., default settings menus, coded as 9, 13–17) into prioritized top-left and secondary bottom-right zones; Fig. 6c reduced from 25 to 20 objects by eliminating 5 non-functional elements (e.g., unused buttons, coded as 8, 13, 15, 18, 24) and reorganizing 10 essential elements (e.g., task input, assignee dropdown, priority selector, coded as 5, 10, 12, 14, 19–23, 25) and 10 configurable-default elements (e.g., preset task templates, coded as 1–4, 6, 7, 9, 11, 16, 17) into high-visibility top-left and secondary bottom-right zones.
As quantified in Table 4, the complexity metric analysis revealed significant optimization patterns across all interface variants. For System A: (1) the adaptive “advanced search” UI demonstrated reduced Grouping Complexity (GC), Density Complexity (DC), and Balance Complexity (BC), but exhibited elevated Alignment Complexity (AC) and Size Complexity (SC) relative to the original implementation; (2) the “create” UI adaptation showed decreased SC and DC with improved BC, while maintaining equivalent AC and GC values; (3) the “assign workflow” UI optimization yielded lower AC, DC, and BC alongside increased GC and SC. System B exhibited consistent improvements across all adaptive UIs, with reductions in AC, GC, DC, and BC metrics, though with marginally higher SC values compared to baseline implementations.

As illustrated in Fig. 7, comparative analysis demonstrated a consistent reduction in aggregate interface complexity across all adaptive UI implementations relative to their original counterparts. A paired-samples t-test revealed statistically significant differences between conditions (t(5) = 8.26, p < 0.001, Cohen’s d = 3.37), with original UIs exhibiting higher mean complexity (M = 0.62, SD = 0.09) compared to optimized adaptive interfaces (M = 0.51, SD = 0.09), yielding a mean difference of 0.11 (SD = 0.033). Post-hoc power analysis (α = 0.05, n = 6) confirmed excellent statistical power (1-β = 0.99), substantially exceeding conventional thresholds for minimizing both Type I (false positive) and Type II (false negative) error rates. This robust effect size (d > 3) and near-ceiling power provide strong empirical validation of the complexity reduction achieved through the adaptive UI framework.

Figure 7: Overall complexity of six use cases’ original UIs and adaptive UIs. All adaptive UIs had less complexity than original UIs
The statistical analysis yielded a significant reduction in interface complexity for adaptive UIs (MD = 0.11, t(5) = 8.26, p < 0.001), empirically validating that UCA-developed adaptive interfaces achieve lower complexity than conventional PLM system UIs. This finding substantiates UCD’s efficacy for interface simplification through systematic requirements transformation. The deductive content analysis methodology employed in this study enabled rigorous categorization of qualitative interview data into predefined functional classifications (essential, configurable-default, non-functional, and unaddressed elements). This analytical approach offers two key advantages for adaptive UI development: (1) it establishes an objective framework for prioritizing interface elements based on goal-achievement criticality, and (2) facilitates targeted optimization through non-functional element elimination and importance-based organization. For practical implementation, designers could enhance this framework by incorporating usage-frequency metrics or other context-aware classification schemata to further refine UI adaptations.
This study identified critical limitations in the alignment complexity metric (Eq. (1)) under specific interface configurations. For System A’s “advanced search” UI (Fig. 2a), where all elements shared a single vertical alignment axis while maintaining distinct horizontal positions, the metric calculation produced counterintuitive results: as the number of objects (n) increased, alignment complexity (AC) approached 0.5, whereas smaller n values drove AC toward 1. This inverse relationship between object quantity and calculated complexity violates fundamental UI complexity principles. The metric only yields theoretically consistent results—where reduced object counts appropriately correlate with lower complexity—in interfaces featuring both vertical and horizontal element distributions. Consequently, Eq. (1)’s application is constrained to sufficiently complex layouts with multidimensional (both vertical and horizontal) object arrangements, limiting its generalizability for purely linear interface configurations.
The density complexity (DC) metric calculation in this study maintained constant window dimensions across comparative UI versions to isolate the impact of object quantity. While this controlled approach demonstrated that DC decreases proportionally with object reduction, its practical utility is limited in dynamic interface environments where viewport dimensions adapt to content. In such responsive layouts, concurrent scaling of both object counts and window area creates an indeterminate relationship: DC may increase, decrease, or remain stable depending on their relative scaling factors. Consequently, DC loses discriminant validity when applied to self-adjusting interfaces where viewport and content maintain proportional relationships. This fundamental constraint suggests the metric is primarily suitable for evaluating static UI configurations with fixed display parameters.
To address the limitations of the Alignment Complexity and Density Complexity metrics, we propose several actionable revisions and future research directions. For Alignment Complexity, which may oversimplify user preference alignment by assuming uniform weighting, we suggest incorporating user-specific preference weights to better capture individual variability. For Density Complexity, which struggles with non-uniform design element distributions, we recommend integrating spatial clustering techniques to refine the metric’s sensitivity to localized design features. Additionally, alternative metrics like perceptual entropy, which quantifies visual complexity based on information theory, or cognitive load indices, derived from user interaction studies, could complement the current framework. These modifications will be empirically validated in future work, with plans to test their effectiveness across diverse product categories to ensure robustness and generalizability.
Based on complexity metric analysis, this study proposes three evidence-based design principles for interface simplification: (1) Size Standardization. Maintain dimensional consistency among functionally equivalent objects. While adaptive UIs generally exhibited increased size complexity (except System A’s “create” UI), this resulted from eliminating redundant same-size elements per Eq. (3). To optimize visual parsing, designers should first remove non-essential objects, then enforce size uniformity within object categories; (2) Negative Space Optimization. Actively manage blank areas post-element removal. Excessive whitespace from object reduction may compromise layout aesthetics when implementing quadrant balancing. Designers should either: (a) proportionally reduce window dimensions, or (b) strategically resize retained elements to occupy available space effectively; (3) Central Axis Alignment. Implement center-aligned layouts for unidirectional (purely vertical/horizontal) object arrangements. As demonstrated in System A’s “advanced search” UI (Fig. 5a), this approach can minimize balance complexity to zero when object centroids align with the viewport midline.
A limitation of this study is its reliance on semi-structured interviews and deductive content analysis for requirements elicitation, which, while rigorously executed, lacks direct verification of task performance improvements through usability testing or observational data. This approach effectively captures user-reported needs but may not fully reflect actual interaction efficiencies in real-world settings. To address this gap, future work will incorporate usability testing with task-based performance metrics (e.g., task completion time, error rates) and observational data collection during live PLM system interactions to validate the adaptive UIs’ impact on operational efficiency. These studies will involve diverse user groups to ensure robust evaluation across varied contexts, enhancing the framework’s practical applicability.
While this study validates the Object-Oriented User Interface Customization (OOUIC) framework within the context of Product Lifecycle Management (PLM) systems for design engineers, its principles are designed to generalize across diverse systems and user roles. The framework’s reliance on User-Centered Design (UCD) and Use Case Analysis (UCA) enables its adaptation to other domains, such as healthcare systems, where adaptive UIs could streamline patient record navigation for clinicians, or educational platforms, where personalized interfaces could enhance student engagement with learning management systems. The framework’s modular architecture, particularly the integration of deductive content analysis and complexity metrics, supports scalability to varied user needs and system requirements. Future work will empirically test the OOUIC framework in these domains to confirm its generalizability, with preliminary simulations suggesting applicability to systems with similar complexity profiles.
This study empirically validated the efficacy of the Object-Oriented User Interface Customization (OOUIC) framework through systematic implementation of Use Case Analysis (UCA) to develop and evaluate adaptive interfaces for two Product Lifecycle Management (PLM) systems. The results demonstrate that UCD methodologies effectively support complexity reduction in adaptive UI design, with statistically significant improvements observed across multiple complexity metrics (p < 0.001). Key practical recommendations emerge from these findings: (1) Deductive content analysis serves as a robust method for object prioritization through structured categorization of user requirements; (2) Beyond non-functional element removal and importance-based grouping, designers should enforce dimensional uniformity among homogeneous objects to minimize size complexity; and (3) Dynamic viewport resizing and proportional element scaling represent viable strategies for whitespace optimization in simplified layouts. These evidence-based principles collectively advance the development of cognitively efficient interface adaptations.
Acknowledgement: We deeply appreciate the support from the National Natural Science Foundation.
Funding Statement: This work was supported by the National Natural Science Foundation of China (Grant No. 72301061).
Author Contributions: The authors confirm contribution to the paper as follows: study conception and design: Qing-Xing Qu, Le Zhang, Vincent G. Duffy; data collection: Qing-Xing Qu, Le Zhang, Fu Guo; analysis and interpretation of results: Qing-Xing Qu, Le Zhang, Fu Guo; draft manuscript preparation: Qing-Xing Qu, Le Zhang, Fu Guo, Vincent G. Duffy. All authors reviewed the results and approved the final version of the manuscript.
Availability of Data and Materials: The data that support the findings of this study are available from the corresponding authors, upon reasonable request.
Ethics Approval: The authors declare that all procedures performed in the writing of this study were in accordance with the American Psychological Association’s Ethical Principles and received formal approval from the Institutional Review Board (IRB) (ID: 1602017215) at Purdue university.
Informed Consent: All participants provided voluntary informed consent.
Conflicts of Interest: The authors declare no conflicts of interest to report regarding the present study.
References
1. Khamaj A, Ali AM. Adapting user experience with reinforcement learning: personalizing interfaces based on user behavior analysis in real-time. Alex Eng J. 2024;95(2):164–73. doi:10.1016/j.aej.2024.03.045. [Google Scholar] [CrossRef]
2. Liu Y, Tan H, Cao G, Xu Y. Enhancing user engagement through adaptive UI/UX Design: a study on personalized mobile app interfaces. Comput Sci IT Res J. 2024;5(8):1942–62. doi:10.51594/csitrj.v5i8.1457. [Google Scholar] [CrossRef]
3. Zhan X, Xu Y, Liu Y. Personalized UI layout generation using deep learning: an adaptive interface design approach for enhanced user experience. Int J Eng Manag Res. 2024;6(1):463–78. doi:10.60087/jaigs.v6i1.270. [Google Scholar] [CrossRef]
4. Susarla A, Gopal R, Thatcher JB, Sarker S. The Janus effect of generative AI: charting the path for responsible conduct of scholarly activities in information systems. Inf Syst Res. 2023;34(2):399–408. doi:10.1287/isre.2023.ed.v34.n2. [Google Scholar] [CrossRef]
5. Mishra A, Shukla A, Rana NP, Currie WL, Dwivedi YK. Re-examining post-acceptance model of information systems continuance: a revised theoretical model using MASEM approach. Int J Inf Manag. 2023;68(2):102571. doi:10.1016/j.ijinfomgt.2022.102571. [Google Scholar] [CrossRef]
6. Nguyen A, Tuunanen T, Gardner L, Sheridan D. Design principles for learning analytics information systems in higher education. Eur J Inf Syst. 2021;30(5):541–68. doi:10.1080/0960085X.2020.1816144. [Google Scholar] [CrossRef]
7. Al-Shafei M. Navigating human-chatbot interactions: an investigation into factors influencing user satisfaction and engagement. Int J Hum-Comput Interact. 2025;41(1):411–28. doi:10.1080/10447318.2023.2301252. [Google Scholar] [CrossRef]
8. Khakifirooz M, Fathi M, Dolgui A. Theory of AI-driven scheduling (TAISa service-oriented scheduling framework by integrating theory of constraints and AI. Int J Prod Res. 2024;2024(2):1–35. doi:10.1080/00207543.2024.2424976. [Google Scholar] [CrossRef]
9. Nwanna M, Offiong E, Ogidan T, Fagbohun O, Ifaturoti A, Fasogbon O. AI-driven personalisation: transforming user experience across mobile applications. J Artif Intell Mach Learn Data Sci. 2025;3(1):1930–7. doi:10.51219/jaimld/maxwell-nwanna/425. [Google Scholar] [CrossRef]
10. Zhang L, Qu QX, Chao WY, Duffy VG. Investigating the combination of adaptive UIs and adaptable UIs for improving usability and user performance of complex UIs. Int J Hum Comput Interact. 2020;36(1):82–94. doi:10.1080/10447318.2019.1606975. [Google Scholar] [CrossRef]
11. Jiang Y, Ji S, Sun J, Huang J, Li Y, Zou G, et al. A universal interface for plug-and-play assembly of stretchable devices. Nature. 2023;614(7948):456–62. doi:10.1038/s41586-022-05579-z. [Google Scholar] [PubMed] [CrossRef]
12. Braham A, Buendía F, Khemaja M, Gargouri F. User interface design patterns and ontology models for adaptive mobile applications. Pers Ubiquitous Comput. 2022;26(6):1395–411. doi:10.1007/s00779-020-01481-5. [Google Scholar] [CrossRef]
13. Calhoun G. Adaptable (not adaptive) automation: forefront of human-automation teaming. Hum Factors. 2022;64(2):269–77. doi:10.1177/00187208211037457. [Google Scholar] [PubMed] [CrossRef]
14. Ntoa S. Usability and user experience evaluation in intelligent environments: a review and reappraisal. Int J Hum Comput Interact. 2025;41(5):2829–58. doi:10.1080/10447318.2024.2394724. [Google Scholar] [CrossRef]
15. Han Y, Moghaddam M. Analysis of sentiment expressions for user-centered design. Expert Syst Appl. 2021;171(4):114604. doi:10.1016/j.eswa.2021.114604. [Google Scholar] [CrossRef]
16. Heo IS, Putri AKH, Kim BS, Kwon MS, Kim SH. Analysis of quality standards for industrial collaborative robots based on user-centered design framework. Hum Factors Ergon Manuf Serv Ind. 2024;34(2):100–17. doi:10.1002/hfm.21014. [Google Scholar] [CrossRef]
17. Yi X, Liu Z, Li H, Jiang B. Immersive experiences in museums for elderly with cognitive disorders: a user-centered design approach. Sci Rep. 1971 2024;14(1):303. doi:10.1038/s41598-024-51929-4. [Google Scholar] [PubMed] [CrossRef]
18. Kaur R, Gabrijelčič D, Klobučar T. Artificial intelligence for cybersecurity: literature review and future research directions. Inf Fusion. 2023;97(6):101804. doi:10.1016/j.inffus.2023.101804. [Google Scholar] [CrossRef]
19. Seiger R, Malburg L, Weber B, Bergmann R. Integrating process management and event processing in smart factories: a systems architecture and use cases. J Manuf Syst. 2022;63(1):575–92. doi:10.1016/j.jmsy.2022.05.012. [Google Scholar] [CrossRef]
20. Taipalus T. Vector database management systems: fundamental concepts, use-cases, and current challenges. Cogn Syst Res. 2024;85(7):101216. doi:10.1016/j.cogsys.2024.101216. [Google Scholar] [CrossRef]
21. Alemerien K, Magel K. GUIEvaluator: a metric-tool for evaluating the complexity of graphical user interfaces. In: 26th International Conference on Software Engineering and Knowledge Engineering (SEKE); 2014 Jul 1–3; Hyatt Regency, VAN, Canada. p. 13–8. [Google Scholar]
22. de Souza Lima AL, Gresse von Wangenheim C. Assessing the visual esthetics of user interfaces: a ten-year systematic mapping. Int J Hum Comput Interact. 2022;38(2):144–64. doi:10.1080/10447318.2021.1926118. [Google Scholar] [CrossRef]
23. Dominguez A, Florez J, Lafuente A, Masneri S, Tamayo I, Zorrilla M. A model for user interface adaptation of multi-device media services. IEEE Trans Broadcast. 2021;67(3):606–18. doi:10.1109/tbc.2021.3064221. [Google Scholar] [CrossRef]
24. Leonidis A, Antona M, Stephanidis C. Rapid prototyping of adaptable user interfaces. Int J Hum Comput Interact. 2012;28(4):213–35. doi:10.1080/10447318.2011.581891. [Google Scholar] [CrossRef]
25. Sundar SS, Marathe SS. Personalization versus customization: the importance of agency, privacy, and power usage. Hum Commun Res. 2010;36(3):298–322. doi:10.1111/j.1468-2958.2010.01377.x. [Google Scholar] [CrossRef]
26. Diego-Mas JA, Garzon-Leal D, Poveda-Bautista R, Alcaide-Marzal J. User-interfaces layout optimization using eye-tracking, mouse movements and genetic algorithms. Appl Ergon. 2019;78(3):197–209. doi:10.1016/j.apergo.2019.03.004. [Google Scholar] [PubMed] [CrossRef]
27. Lee G, Eastman CM, Taunk T, Ho CH. Usability principles and best practices for the user interface design of complex 3D architectural design and engineering tools. Int J Hum Comput Stud. 2010;68(1–2):90–104. doi:10.1016/j.ijhcs.2009.10.001. [Google Scholar] [CrossRef]
28. Starke SD, Baber C. The effect of four user interface concepts on visual scan pattern similarity and information foraging in a complex decision making task. Appl Ergon. 2018;70:6–17. doi:10.1016/j.apergo.2018.01.010. [Google Scholar] [PubMed] [CrossRef]
29. Wang Z, Zhang X, Li L, Zhou Y, Lu Z, Dai Y, et al. Evaluating visual encoding quality of a mixed reality user interface for human-machine co-assembly in complex operational terrain. Adv Eng Inform. 2023;58(1):102171. doi:10.1016/j.aei.2023.102171. [Google Scholar] [CrossRef]
30. Ji H, Yun Y, Lee S, Kim K, Lim H. An adaptable UI/UX considering user’s cognitive and behavior information in distributed environment. Clust Comput. 2018;21(1):1045–58. doi:10.1007/s10586-017-0999-9. [Google Scholar] [CrossRef]
31. Huang H, Yang M, Yang C, Lv T. User performance effects with graphical icons and training for elderly novice users: a case study on automatic teller machines. Appl Ergon. 2019;78(2):62–9. doi:10.1016/j.apergo.2019.02.006. [Google Scholar] [PubMed] [CrossRef]
32. Akiki PA, Bandara AK, Yu Y. Engineering adaptive model-driven user interfaces. IIEEE Trans Software Eng. 2016;42(12):1118–47. doi:10.1109/tse.2016.2553035. [Google Scholar] [CrossRef]
33. Reinecke K, Bernstein A. Improving performance, perceived usability, and aesthetics with culturally adaptive user interfaces. ACM Trans Comput-Hum Interact. 2011;18(2):1–29. doi:10.1145/1970378.1970382. [Google Scholar] [CrossRef]
34. Gajos KZ, Weld DS, Wobbrock JO. Automatically generating personalized user interfaces with Supple. Artif Intell. 2010;174(12–13):910–50. doi:10.1016/j.artint.2010.05.005. [Google Scholar] [CrossRef]
35. Akiki PA, Bandara AK, Yu Y. Adaptive model-driven user interface development systems. ACM Comput Surv. 2014;47(1):1–33. doi:10.1145/2597999. [Google Scholar] [CrossRef]
36. Feigh KM, Dorneich MC, Hayes CC. Toward a characterization of adaptive systems: a framework for researchers and system designers. Hum Factors. 2012;54(6):1008–24. doi:10.1177/0018720812443983. [Google Scholar] [PubMed] [CrossRef]
37. Muktamar BA, Lumingkewas CS, Rofi’i A. The implementation of user centered design method in developing UI/UX. J Inf Syst Technol Eng. 2023;1(2):26–31. doi:10.61487/jiste.v1i2.13. [Google Scholar] [CrossRef]
38. Karwowski W. A review of human factors challenges of complex adaptive systems: discovering and understanding chaos in human performance. Hum Factors. 2012;54(6):983–95. doi:10.1177/0018720812467459. [Google Scholar] [PubMed] [CrossRef]
39. Li W. User-centered design for diversity: human-computer interaction (HCI) approaches to serve vulnerable communities. J Comput Technol Appl Math. 2024;1(3):85–90. [Google Scholar]
40. Kettwich C, Schrank A, Oehl M. Teleoperation of highly automated vehicles in public transport: user-centered design of a human-machine interface for remote-operation and its expert usability evaluation. Multimodal Technol Interact. 2021;5(5):26. doi:10.3390/mti5050026. [Google Scholar] [CrossRef]
41. Law YC, Wehrt W, Sonnentag S, Weyers B. Obtaining semi-formal models from qualitative data: from interviews into BPMN models in user-centered design processes. Int J Hum Comput Interact. 2023;39(3):476–93. doi:10.1080/10447318.2022.2041899. [Google Scholar] [CrossRef]
42. François M, Osiurak F, Fort A, Crave P, Navarro J. Usability and acceptance of truck dashboards designed by drivers: two participatory design approaches compared to a user-centered design. Int J Ind Ergon. 2021;81(6):103073. doi:10.1016/j.ergon.2020.103073. [Google Scholar] [CrossRef]
43. Tirschmann F, Klebbe R, Neumann S, Eicher C, Scherzinger S, Werthwein O, et al. Healthcare robotics control for upper limb paralysis in neuromuscular diseases: user-centered design for responsible technology development. Int J Soc Robot. 2025;19(3):342. doi:10.1007/s12369-025-01242-5. [Google Scholar] [CrossRef]
44. Johnson CM, Johnson TR, Zhang J. A user-centered framework for redesigning health care interfaces. J Biomed Inform. 2005;38(1):75–87. doi:10.1016/j.jbi.2004.11.005. [Google Scholar] [PubMed] [CrossRef]
45. Van Velsen L, Van Der Geest T, Klaassen R, Steehouder M. User-centered evaluation of adaptive and adaptable systems: a literature review. Knowl Eng Rev. 2008;23(3):261–81. doi:10.1017/s0269888908001379. [Google Scholar] [CrossRef]
Cite This Article
 Copyright © 2025 The Author(s). Published by Tech Science Press.
This work is licensed under a Creative Commons Attribution 4.0 International License , which permits unrestricted use, distribution, and reproduction in any medium, provided the original work is properly cited.
 Downloads
 Citation Tools