
 Submit a Paper
 Propose a Special lssue
 Open Access
ARTICLE

Multi-Expert Collaboration Based Information Graph Learning for Anomaly Diagnosis in Smart Grids
1 Shenyang Institute of Computing Technology, Chinese Academy of Sciences, Shenyang, 110168, China
2 School of Computer Science and Technology, University of Chinese Academy of Sciences, Beijing, 101408, China
* Corresponding Author: Li Lv. Email:
(This article belongs to the Special Issue: Multimodal Learning for Big Data)
Computers, Materials & Continua 2025, 85(3), 5359-5376. https://doi.org/10.32604/cmc.2025.069427
Received 23 June 2025; Accepted 21 August 2025; Issue published 23 October 2025
 View Full Text
 Download PDF
Abstract
Accurate and reliable fault diagnosis is critical for secure operation in complex smart power systems. While graph neural networks show promise for this task, existing methods often neglect the long-tailed distribution inherent in real-world grid fault data and fail to provide reliability estimates for their decisions. To address these dual challenges, we propose a novel multi-expert collaboration uncertainty-aware power fault recognition framework with cross-view graph learning. Its core innovations are two synergistic modules: (1) The infographics aggregation module tackles the long-tail problem by learning robust graph-level representations. It employs an information-driven optimization loss within a contrastive graph architecture, explicitly preserving global invariance and local structural information across diverse (including rare) fault states. This ensures balanced representation learning for both the head and tail classes. (2) The multi-expert reliable decision module addresses prediction uncertainty. It trains individual expert classifiers using the Dirichlet distribution to explicitly model the credibility (uncertainty) of each expert’s decision. Crucially, a complementary collaboration rule based on evidence theory dynamically integrates these experts. This rule generates active weights for expert participation, prioritizing more certain experts and fusing their evidence to produce a final decision with a quantifiable reliability estimate. Collaboratively, these modules enable reliable diagnosis under data imbalance: The Infographics Module provides discriminative representations for all fault types, especially tail classes, while the Multi-Expert Module leverages these representations to make decisions with explicit uncertainty quantification. This synergy significantly improves both the accuracy and the reliability of fault recognition, particularly for rare or ambiguous grid conditions. Ultimately, extensive experiment evaluations on the four datasets reveal that the proposed method outperforms the state-of-the-art methods in the fault diagnosis of smart grids, in terms of accuracy, precision, f score and recall.Keywords
With the deep integration of industrial Internet of things (IIoT) technologies into the intelligent transformation of power systems, smart grids are evolving into sophisticated cyber-physical systems characterized by tight coupling among physical equipment, sensor networks, and digital twins [1–3]. The massive deployment of IIoT terminals generates real-time interactions of equipment status parameters, environmental sensing data, and operational control commands through IIoT architectures, significantly enhancing grid operational efficiency and resilience [4–6]. However, as power grid structures become increasingly complex and geographically expansive, ensuring their secure and stable operation requires multi-layered safeguards [7,8]. During grid operations, faults inevitably occur due to natural disasters, equipment failures, and structural vulnerabilities in local grid components. Such failures can disrupt normal power supply to end-users and potentially trigger large-scale blackouts, posing severe societal and economic risks [9]. To mitigate these risks, rapid and accurate fault detection and classification in complex power systems have become critical research priorities. For long-distance power transmission systems with hundreds of transmission lines, manual inspections prove prohibitively expensive and inefficient [10]. Conventional manual diagnostic approaches face three fundamental limitations: First, inspection outcomes are susceptible to subjective judgment and operator experience, particularly in complex fault scenarios. Second, constrained sensing capabilities and data processing requirements hinder accurate identification of subtle or multi-layered faults. Modern grid systems generate massive measurement, monitoring, and control data that exceed human analytical capacity. Third, inherent latency in manual methods renders them inadequate for real-time fault diagnosis in smart grid applications. Currently, how to perceive and capture power system fault patterns from vast IIoT data, enabling accurate localization and evolution prediction of system failures, has emerged as a core challenge in ensuring the secure and reliable operation of smart grids.
Contemporary power grid fault diagnosis can be broadly categorized into two methodological paradigms: deep-learning-based methods [11] and graph-learning-based methods [12]. Deep-learning-based fault diagnosis treats the power system as a collection of time-series or image-like signals [13]. Within this paradigm, spatial or temporal measurements are directly fed into deep neural architectures to learn discriminative patterns. The key advantage is powerful automatic feature extraction from raw sensory data; the main limitation is that the intrinsic grid topology is only implicitly encoded, often leading to sub-optimal generalization under topology reconfigurations [14]. Graph-learning-based fault diagnosis explicitly models the power grid as a graph, where buses, generators, and loads become nodes and physical branches become edges [15]. Message-passing neural networks propagate local measurements along edges to produce topology-aware node or graph embeddings. This paradigm excels at capturing structural dependencies and offers inherent robustness to topological changes [16].
While existing methodologies have made substantial progress in grid fault pattern diagnosis, two unresolved challenges critically undermine their practical deployment: (1) Long-tailed data distribution: Current graph neural networks (GNNs) fail to account for the extreme long-tailed nature inherent in real-world power grid operational data. This manifests as a severe frequency imbalance: normal states and common faults dominate datasets, while critical but rare fault patterns (e.g., cascading failures, cyber-physical attacks) form a sparse “tail”. Practically, this imbalance poses grave risks: GNNs become biased toward frequent patterns, rendering them blind to rare yet high-impact faults. This directly compromises grid safety, as undetected tail-class anomalies can trigger cascading outages or equipment damage. Furthermore, the lack of robust representations for rare faults hinders proactive maintenance and increases operational vulnerability. (2) Absence of uncertainty estimation: Power grid fault diagnosis operates under inherently uncertain conditions—noisy sensor data, dynamic grid topologies, overlapping fault signatures, and complex environmental disturbances. Current deterministic GNN methods ignore this uncertainty, producing overconfident but potentially erroneous decisions. This has severe operational consequences: Without quantifying reliability, operators cannot distinguish high-confidence diagnoses from low-confidence guesses. This erodes trust in automated systems, leads to missed interventions or unnecessary shutdowns, and forces reliance on manual verification during critical events—delaying response times and escalating risks. In safety-critical infrastructure, the inability to assess decision trustworthiness is not merely a technical gap but a fundamental barrier to reliable autonomy.
To this end, this works proposes a multi-expert collaboration uncertainty-aware power fault reliable recognition method (MCIG) with cross-view information graph learning, which includes the information graph aggregation module and the multi-expert reliable decision module. Specifically, the information graph aggregation module utilizes the contrastive graph neural network with the data augmentation to extract corresponding graph-level representations via aggregating local structure relationships between nodes, and then maximizes mutual information between graph-level representations and graph-level augmentation representations from the perspective of adversarial game theory to learn global invariance, which proposes a robust and discriminative graph-level representations for subsequent fault diagnosis of power grid state. Meanwhile, the multi-expert reliable decision module utilizes Dirichlet function to measure the credibility of the individual-expert classification, and then utilizes the evidence theory to learn the active weights for expert participation in decision-making of power grid states, as well as maximizing the differences between Dirichlet distributions of experts, which achieves the multi-expert complementary collaboration based on the credibility estimation of each expert. The information graph aggregation module and the multi-expert reliable decision module operate synergistically within an end-to-end framework, ensuring robust and interpretable fault diagnosis. Extensive experiments on four real-world smart grid datasets—including power load fluctuations, equipment status logs, environmental sensor data, and historical fault records—demonstrate MCIG’s superiority. Compared with the benchmarks on the UK-29 datasets, MCIG exceeds the second-best method with an improvement of 3.24%, 1.77%, 3.08% and 2.97% in terms of Acc, Pre, Rec, and F1. These results demonstrate MCIG’s capability to integrate structural learning and collaborative decision-making, offering a reliable solution for real-time fault diagnosis in smart grids.
Threefold contributions of MCIG are illustrated as follows:
• We propose an information-driven contrastive graph neural network for capturing a robust and discriminative graph-level representations of power grid states, via learning local structure relationships and global semantic invariance.
• We design a multi-expert reliable decision paradigm via utilizing Dirichlet function with the evidence theory, greatly improving the accuracy and reliability of decision-making on abnormal power grid states.
• Extensive experiment evaluations on the four datasets reveal that the proposed method outperforms the state-of-the-art performance methods in the fault diagnosis of smart grids, in terms of ACC, NMI, and PUR.
The rest of MCIG is organized as follows. Section 2 presents the related work and background information. Section 3 details the methodology. Section 4 reports the results of our experiments. Finally, Section 5 concludes MCIG and suggests directions for future research.
2.1 Fault Diagnosis in Smart Grids
Deep learning-based fault diagnosis in smart grids represents a next-generation paradigm for power system health management that integrates IIoT sensing technologies with AI-driven cognitive advancements, which leverages cutting-edge deep algorithms to perform intelligent analysis on massive IIoT-generated datasets, thus achieving precise identification and predictive detection of grid anomalies [10].
For example, Park and Pandey [17] proposed a context-aware fault detection framework, GridCAL, which leverages context-agnostic learning to unify measurements across varying grid operating conditions. GridCAL employs linear sensitivity factors, such as Power Transfer Distribution Factors and Line Outage Distribution Factors, to transform real-time power flow measurements into context-agnostic values, enabling the aggregation of data from diverse grid contexts into a unified statistical model and significantly reducing false positives caused by anticipated topology changes and load-generation shifts. Harrou et al. [18] proposed a hybrid deep learning framework that integrates a gated recurrent unit-based stacked autoencoder with semi-supervised fault detection algorithms to achieve fault detection in smart grids. Danilczyk et al. [19] proposed a deep learning-based digital twin framework for fault detection via leveraging a convolutional neural network to analyze high-resolution phasor measurement unit data, which achieves simultaneous fault detection and localization by mapping the three-phase voltage signals of power system buses to a CNN architecture analogous to image processing. Abdel-Basset et al. [20] proposed a privacy-preserving federated semi-supervised framework for fault detection in smart grids, integrating a block-structured temporal convolutional generative network to address class imbalance and enhance minority sample generation.
In recent years, stemming from the graph-structured nature of power systems, deep graph neural networks have emerged as a transformative solution for fault diagnosis in smart grids, offering capabilities to model the non-Euclidean relationships between grid components [12]. Chen et al. [11] designed an improved GraphSAGE model based on time-neighbor features to detect power system anomalies, effectively identifying hidden anomalies by aggregating neighbor node features and considering time-series changes. van Nooten et al. [21] proposed a graph isomorphic network-oriented architecture to assess the states of medium-voltage grids under the N-1 contingency criterion by integrating both node features and edge features into a novel message-passing procedure within the inherent graph structure of power systems. Wang et al. [22] proposed a hybrid short-term voltage stability prediction framework, where a graph convolutional network models spatial dependencies among grid nodes, and LSTM captures temporal dynamics. Gao et al. [15] utilized a graph convolutional neural network to extract graph structure features and input these features into a transformer-based encoder-decoder to achieve fault detection. Wang et al. [16] introduced a graph representation learning framework by modeling power grids as graphs and generating node embeddings through parallelizable walks, which leverage biased random walks to capture both topological relationships and node features. Furthermore, smart grid data often has a temporal nature [23]. For example, Qiu et al. [24] designed an graph neural network framework with spatia-temporal attention for time-series forecasting. The integration of temporal information with graph-based models can enhance the detection and prediction of faults in power systems by leveraging both spatial and temporal patterns in the data [25].
2.2 Long-Tailed Classification
The goal of long-tailed classification is to suppress the nuisances of class imbalance in mining patterns of data, which are classified into three branches: re-sampling-based methods, re-weighting-based methods [26], and collaborative-based methods [27]. Re-sampling-based methods adjust the sample distribution of different classes in the training dataset to mitigate the impact of class imbalance. For example, Zhao et al. [28] encoded node similarity in embedding space to ensure the authenticity of newly synthesized samples and simultaneously trained an edge generator to simulate relationship information, thereby improving imbalanced node pattern mining on graphs. Re-weighting-based methods assign different weights to samples of different classes in the loss function, prompting the model to focus more on minority classes. For example, Zhong et al. [29] designed a sample-aware smoothing cross-entropy loss that smooths each class’s labels, enabling more precise confidence adjustments and alleviating overconfidence imbalances. Collaborative-based methods enhance the mining of long-tail data patterns by integrating complementary knowledge from multiple experts. For example, Yi et al. [30] devised a multi-expert collaborative graph-level classification framework where gated selection and knowledge distillation aggregate complementary expert information to enhance decision robustness. MCIG builds on the strengths of collaborative-based methods, focusing on fostering reliable decision-making and dynamic interaction among experts to enhance pattern mining of long-tailed data.
To capture the fault patterns and complex structure relationships in the power grid, we model the power grid fault diagnosis as a graph-level classification problem. Mathematically, the power grid can be represented as a graph
where the first term and the second term stand for graph-level representation learning and state decision objectives, respectively.
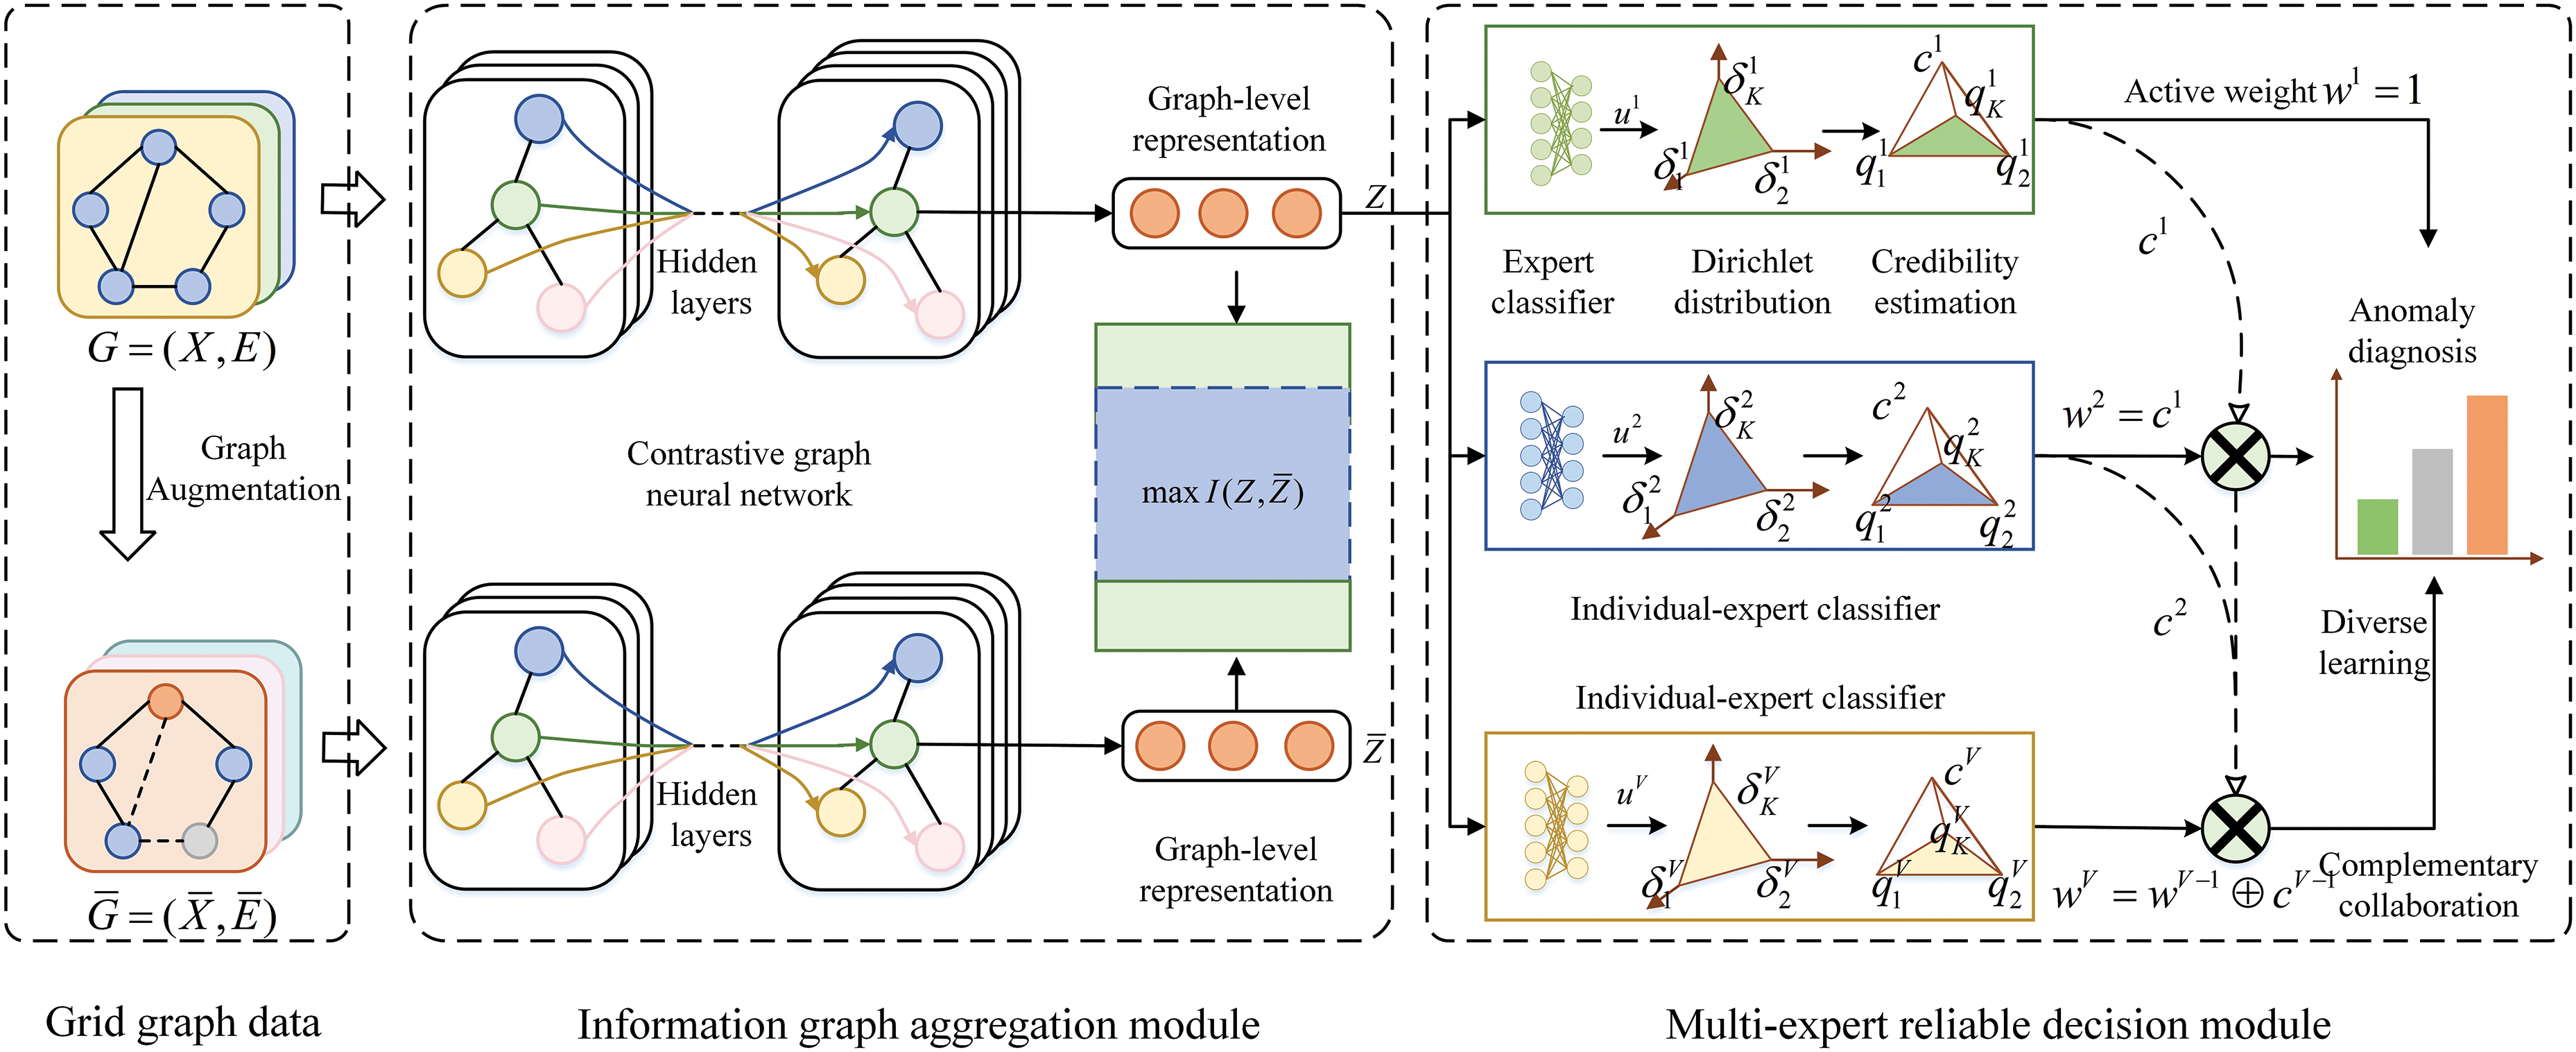
Figure 1: The overall architecture of MCIG. MCIG utilizes data augmentation function to generate augmentation graph
3.2 Information Graph Aggregation
The Information Graph Aggregation (IGA) module is designed to address the challenge of long-tailed data distribution in smart grid fault diagnosis. It leverages a contrastive graph neural network framework to learn robust graph-level representations by maximizing mutual information between original and augmented graph data. This approach ensures that both common and rare fault patterns are effectively captured, providing a balanced representation for subsequent fault classification.
Given a power grid state graph
where
Then, the graph-level representation
where Fusion
where Perturbation
Generally, the augmentation does not change the category information of the original graph, i.e., the semantic information of both the original and augmentation graph should remain consistent. Therefore, it is nature to introduce the mutual information maximization between the representations of the original and augmented data for capturing information invariance. The mutual information maximization is formulated as follows:
where
According to the variational inference, the JS divergence is expanded in the following form,
Hence, we have
where
where
where
3.3 Multi-Expert Reliable Decision
The Multi-Expert Reliable Decision (MRD) module tackles the issue of prediction uncertainty in fault diagnosis. It employs a multi-expert collaborative framework where individual expert classifiers are trained using the Dirichlet distribution to model the credibility of each decision. A dynamic integration rule based on evidence theory assigns active weights to experts, prioritizing those with higher certainty. This mechanism not only improves the reliability of fault recognition but also provides quantifiable uncertainty estimates for each decision.
Individual-expert classifier learning: MRD utilizes Dirichlet function to measure the credibility of the individual-expert classification, which effectively alleviates the overconfidence problem of traditional classifiers with the softmax-like function in forecasting probability assignment for long-tailed graph data. Specifically, MRD defines the credibility estimation of the individual-expert classification as
Then, MRD leverages the Dirichlet function
where
To implement the Dirichlet function
where
Based on the learned graph-level representations
In the power grid fault diagnosis, we hope the model can not only provide classification results, but also provide confidence estimates for the classification results. Thus, the empirical Bayes function is used to optimize individual-expert classifier learning by maximizing marginal likelihood. Specifically, based on the output
where
Meanwhile, in classification problems, the model is expected that can not only recognize the correct categories, but also realize that its predictions for incorrect categories lack sufficient evidence support. If the model shows high confidence in predicting all categories, then this may hide the uncertainty of the model in certain situations. This underestimation of uncertainty may lead to the model being overly confident in practical applications, which may result in making overly deterministic decisions that may actually be unreliable. To address this issue, MRD introduces a simplex loss to distribution parameters of the Dirichlet function as close as possible to the vertices corresponding to the simplex:
where
where
Multi-expert complementary collaboration: In multi-expert frameworks, independent expert classifiers collaboratively perform data classification tasks. While this architecture enhances classification performance by leveraging complementary expert decisions, simply increasing the number of experts escalates computational complexity—particularly for easily classifiable samples where redundant expert involvement wastes resources. To address this, we propose a reliable-aware adaptive ensemble mechanism that dynamically adjusts the number of active experts based on difficulty assessments of sample classification:
First, MRD utilizes the credibility estimation to generate active weights of each expert:
where
The active weight
Next, the loss of the multi-expert classifier learning is defined as follows:
where
where
Thus, combining the information graph aggregation and the multi-expert complementary collaboration, the overall loss of MCIG is defined as follows:
where
In MCIG, the information graph aggregation module and the multi-expert reliable decision module operate synergistically within an end-to-end framework, ensuring robust and interpretable fault diagnosis. The graph-level representations generated by the contrastive graph neural network provide a unified and discriminative input for the multi-expert decision module. These representations, enriched with global structural invariance and local node relationships, serve as the foundation for expert evaluations. Concurrently, the multi-expert module dynamically adjusts the weights of individual experts based on their credibility, quantified via the Dirichlet function and evidence theory, ensuring that high-confidence experts dominate the final decision while suppressing unreliable opinions. This closed-loop interaction enables the system to adaptively refine graph representations through diagnostic feedback while leveraging these representations to enhance decision reliability.
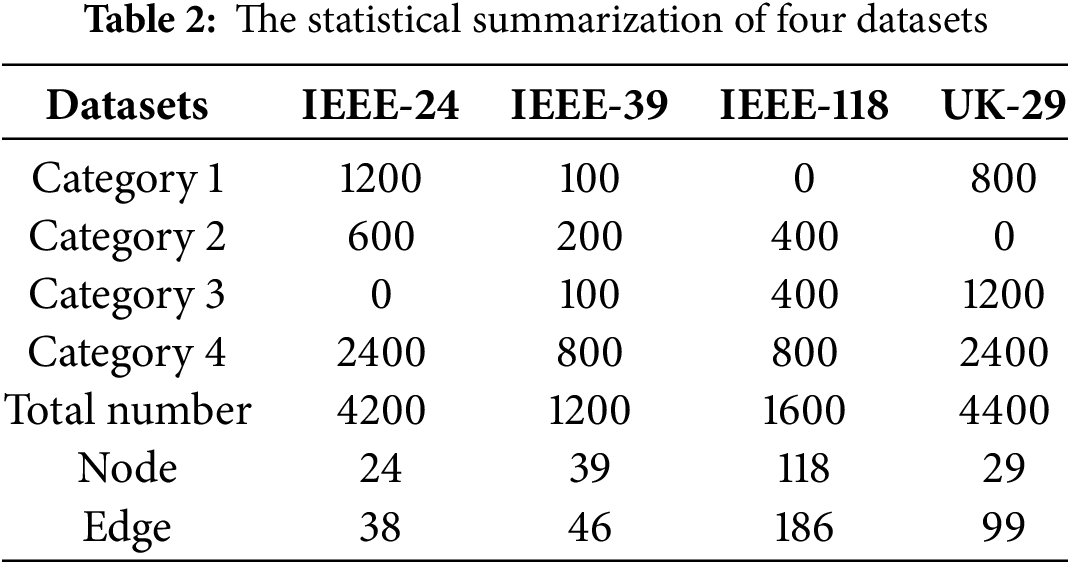
Dataset: The performance of MCIG is evaluated using four fault diagnosis datasets with the long-tailed form, i.e., IEEE-24, IEEE-39, IEEE-118, and UK-29, with their statistical details summarized in the Table 2. For IEEE-24, there are 1200 samples in category 1, 600 samples in category 2, and 2400 samples in Category 4 where each sample is a graph with 24 nodes and 38 edges. For IEEE-39, there are 100 samples in Category 1, 200 samples in Category 2, 100 samples in category 3, and 800 samples in Category 4 where each sample is a graph with 39 nodes and 46 edges. For IEEE-118, there are 400 samples in Category 2, 400 samples in category 3, and 800 samples in category 4 where each sample is a graph with 118 nodes and 186 edges. For UK-29, there are 800 samples in Category 1, 1200 samples in Category 3, and 2400 samples in Category 4 where each sample is a graph with 29 nodes and 99 edges. Category 1 denotes the failure to meet power generation demand with cascading failure. Category 2 denotes failure to meet power generation demand without cascading failure. Category 3 denotes meeting power generation demand with cascading failure. And Category 4 denotes meeting power generation demand without cascading failure. In the four datasets, each graph’s nodes represent power grid buses, which are connection points for multiple devices like generators and voltage regulators. These buses can be seen as virtual devices with functions of various equipment. Each node’s features are P_net, S_net, and V. P_net = P_gen - P_load (net active power), where P_gen is generated active power and P_load is demanded active power. S_net = S_gen - S_load (net apparent power), with S_gen as generated apparent power and S_load as demanded apparent power. V is the complex voltage value. Edges in each graph represent transmission branches or lines connecting different buses. Each edge’s features are active power flow, reactive power flow, reactance, and maximum power capacity.
Metric: Following current works, accuracy (ACC), precision (Pre), f_score (F1), and recall (Rec) are used to evaluated the performance of MCIG in the fault diagnosis of smart grids. Accuracy: The proportion of correctly predicted instances relative to the total number of instances. Precision: The ratio of correctly predicted positive instances to all instances predicted as positive. Recall: The ratio of correctly predicted positive instances to all actual positive instances. F1-score: The harmonic mean of precision and recall, balancing both metrics to evaluate overall model performance. The larger the values of the four metrics, the better the performance.
Implementation Details: The programming environment utilizes Python 3.6.10, with PyTorch 1.4.0 as the core deep learning framework. GPU-accelerated computations are enabled through CUDA 10.1 on compatible NVIDIA GPUs, optimizing training and inference efficiency. A 2-layer graph neural network is used as the extractor of the graph-level representations and a 2-layer MLP is used as the individual-expert classifier. The numbers of epoch and batch size are set to 300 and 64 for training the overall network, respectively. The optimizer uses Adam with 0.0001 of the learning rate. In all four datasets, 80% of the data is selected as the training set and 20% as the test set.
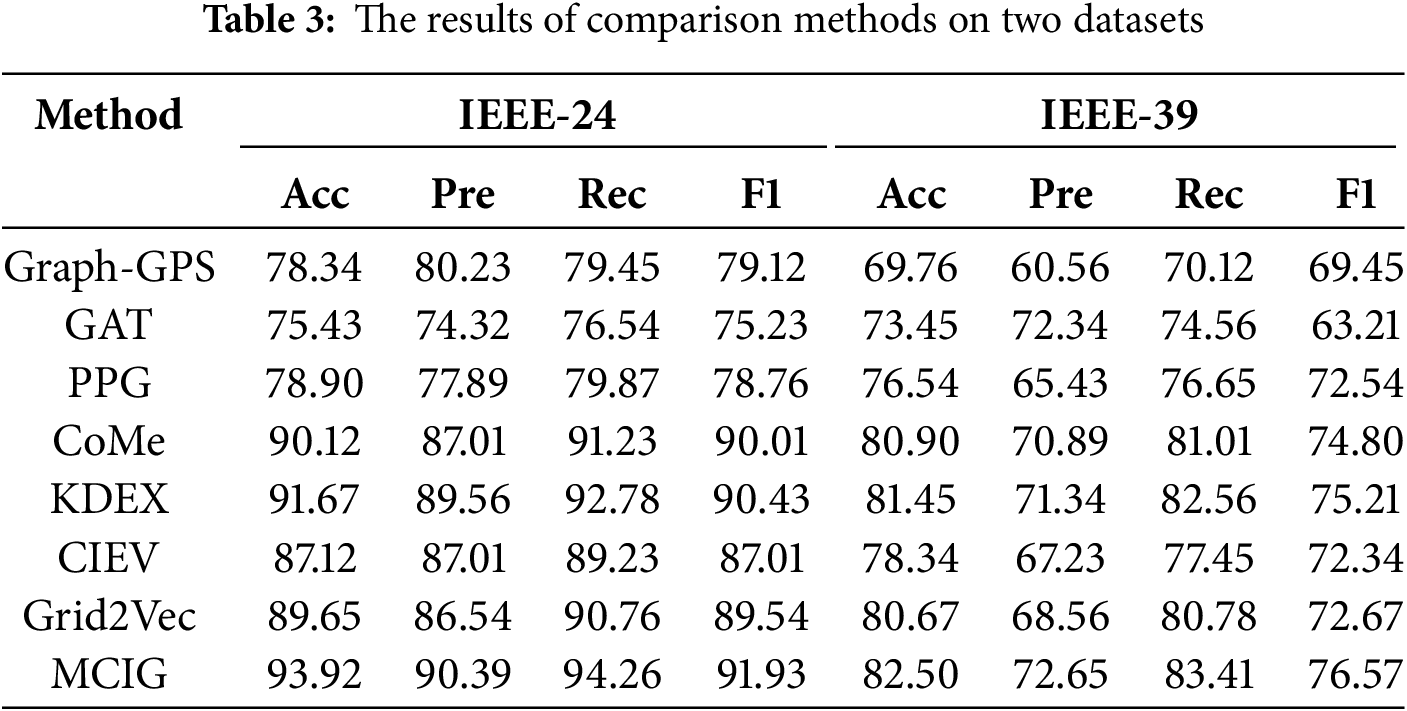
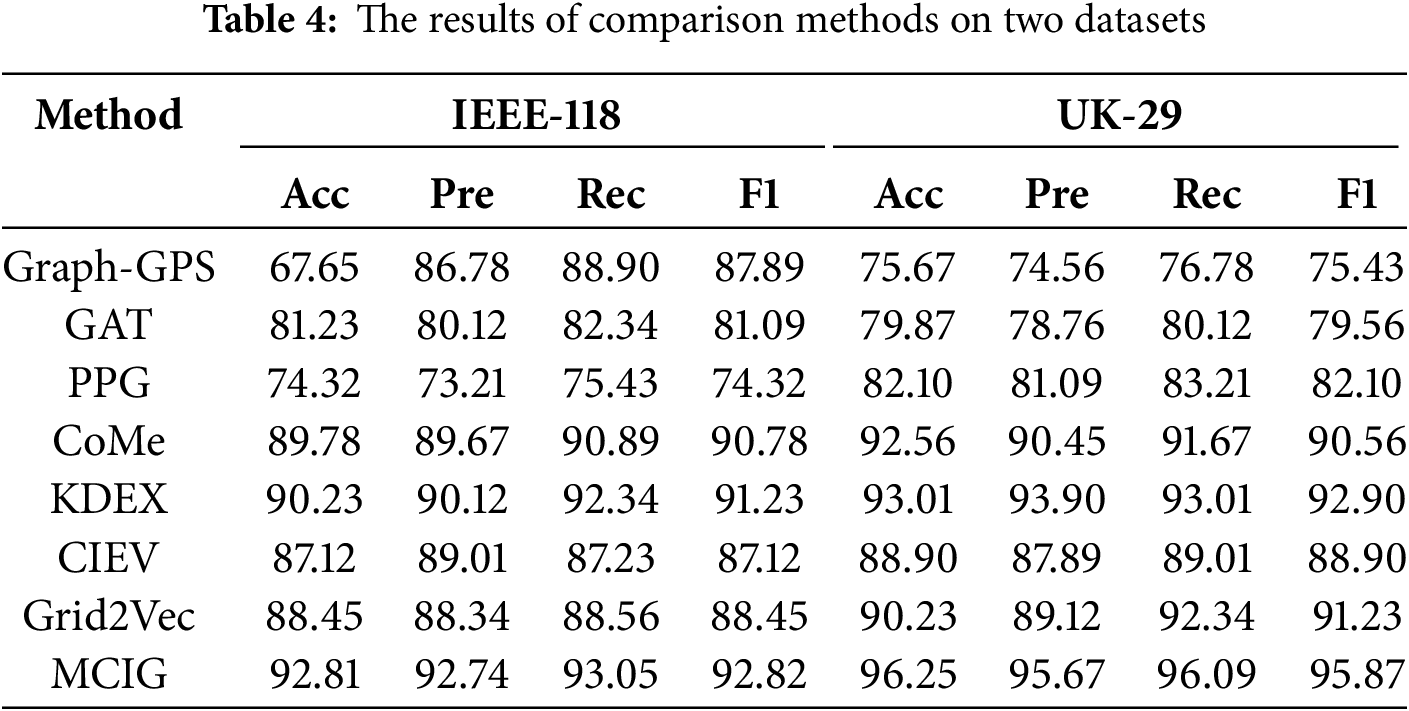
Tables 3 and 4 show the comparison results on four fault diagnosis datasets with seven state-of-the-art methods, i.e., Grapg-GPS [31], GAT [32], PPG [33], CoMe [29], KDEX [27], CIEV [13], and Grid2Vec [16]. Grapg-GPS, GAT, and PPG are common graph learning methods. CoMe and KDEX are graph learning method with long-tailed form. CIEV and Grid2Vec are graph learning methods for fault diagnosis. The following observations are evident upon scrutiny of the table: (1) MCIG demonstrates significant superiority over seven baselines about four metrics. For instance, on the UK-29 datasets, MCIG exceeds the second-best method with an improvement of 3.24%, 1.77%, 3.08% and 2.97% in terms of Acc, Pre, Rec, and F1. Besides, on the UK-29 datasets, DCGLC also outperforms the runner up GLCC by more than 14.00% across all metrics. The results strongly suggest that the synergistic interaction between the information graph aggregation module and the multi expert reliable decision module within MCIG can significantly enhance robust representation learning and improve the reliability of abnormal diagnosis for long-tailed data in smart grids. (2) Empirical results demonstrate that graph-learning methods accounting for long-tail properties in data markedly outperform common ones. For example. on the UK-29 datasets, MCIG exceeds the PPG with an improvement of 14.15%, 14.61%, 12.88% and 13.77% in terms of Acc, Pre, Rec, and F1. These results highlight the necessity and value of specialized methods for power grid abnormality detection in long-tailed datasets. They address the unique challenges of such data, which generic methods often fail to handle. Specialized approaches can capture subtle patterns in the data’s long tail, leading to more accurate models and analyses. This precision is essential for improving diagnostic accuracy and ensuring smart grid stability.
The Nemenyi test in Fig. 2 is a post-hoc statistical test used to compare the performance of multiple algorithms across multiple datasets. It helps determine if the observed differences in performance are statistically significant. MCIG’s superior performance in the Nemenyi test, as evidenced by the highest rank, indicates that it consistently outperforms other methods across different datasets. This statistical validation reinforces the practical significance of MCIG’s performance advantage.
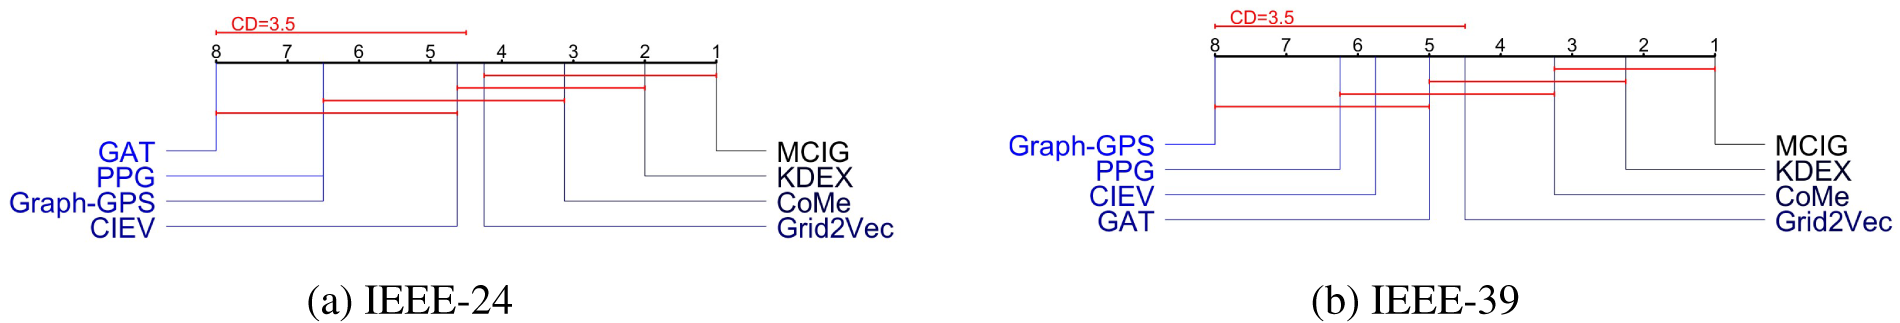
Figure 2: The Nemenyi test results on the two datasets: (a) IEEE-24; (b) IEEE-39
This section conducts an ablation study on four datasets in terms of Acc and F1, containing the loss ablation and the architecture ablation.
For the loss ablation, there are four variants: (1) MCIG utilizes the mutual information maximization loss
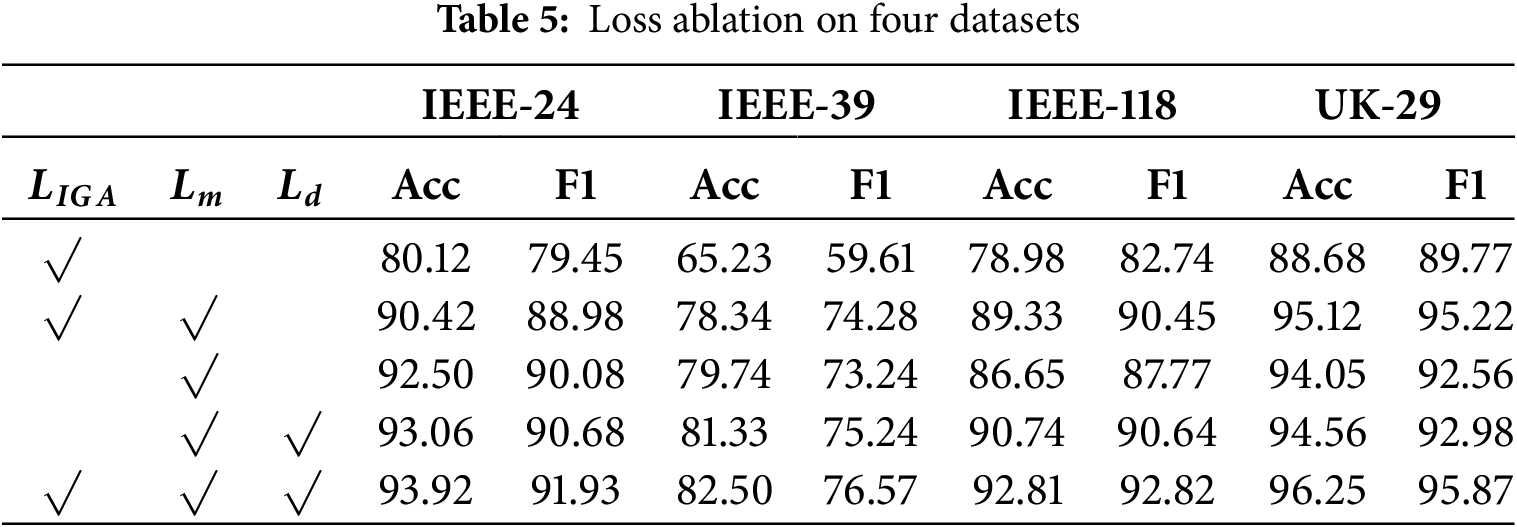
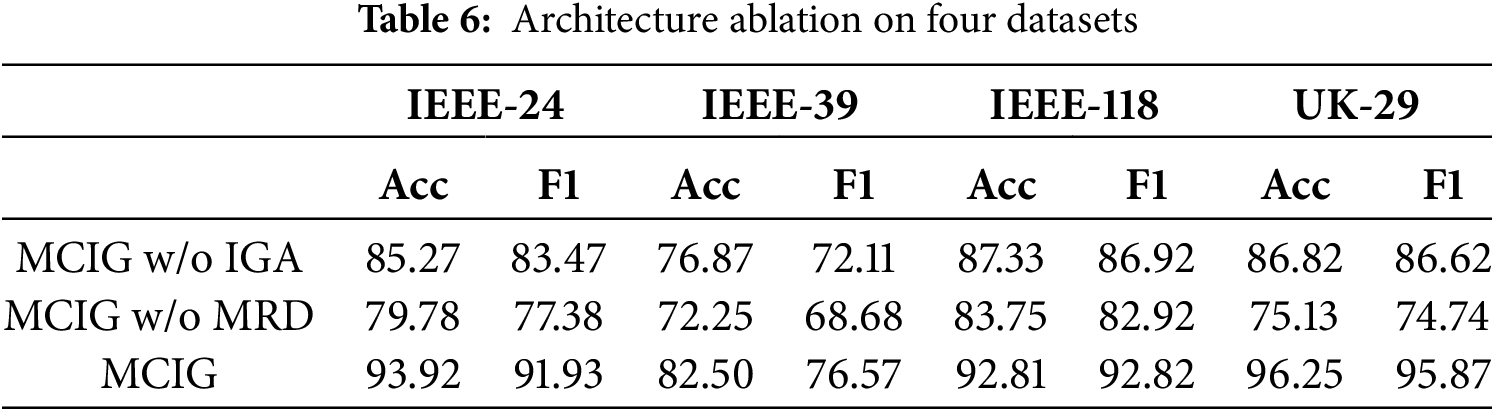
For the architecture ablation, three are two variants: (1) MCIG w/o IGA denotes the remove of the information graph aggregation module. (2) (1) MCIG w/o MDR denotes the remove of the multi-expert reliable decision module. The ablation results are shown in Table 6. It can be observed that the two variants produces inferior results compared with MCIG on four datasets. That is, the removal of each module causes the decease in anomaly diagnosis in smart grids, validating the effectiveness of each module.
This section conducts the parameter study on IEEE-24 dataset in terms of hyperparameters, number of layers, and number of experts.
Hyperparameter study investigates the impact of two loss hyperparameters, i.e.,
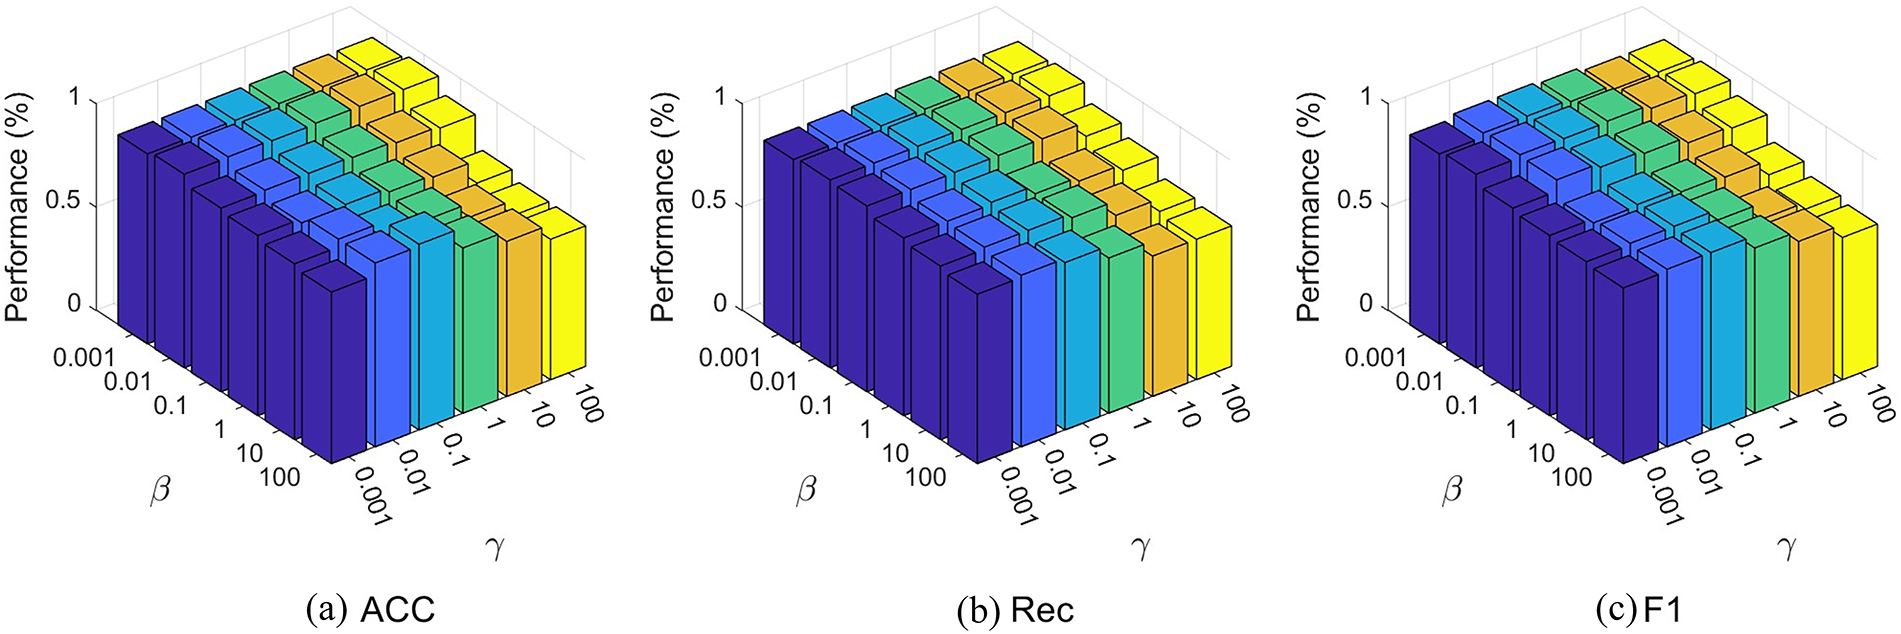
Figure 3: Parameters study of
Network layer study evaluates the impact of varying layers in the information graph aggregation module on MCIG’s performance. Results across four datasets in Fig. 4a indicate that performance peaks at two layers, demonstrating that this configuration effectively captures structural dependencies in grid data. Increasing layers beyond two leads to overfitting and training challenges, reducing performance. Thus, a two-layer setup optimally balances model complexity and performance for smart grid fault diagnosis.
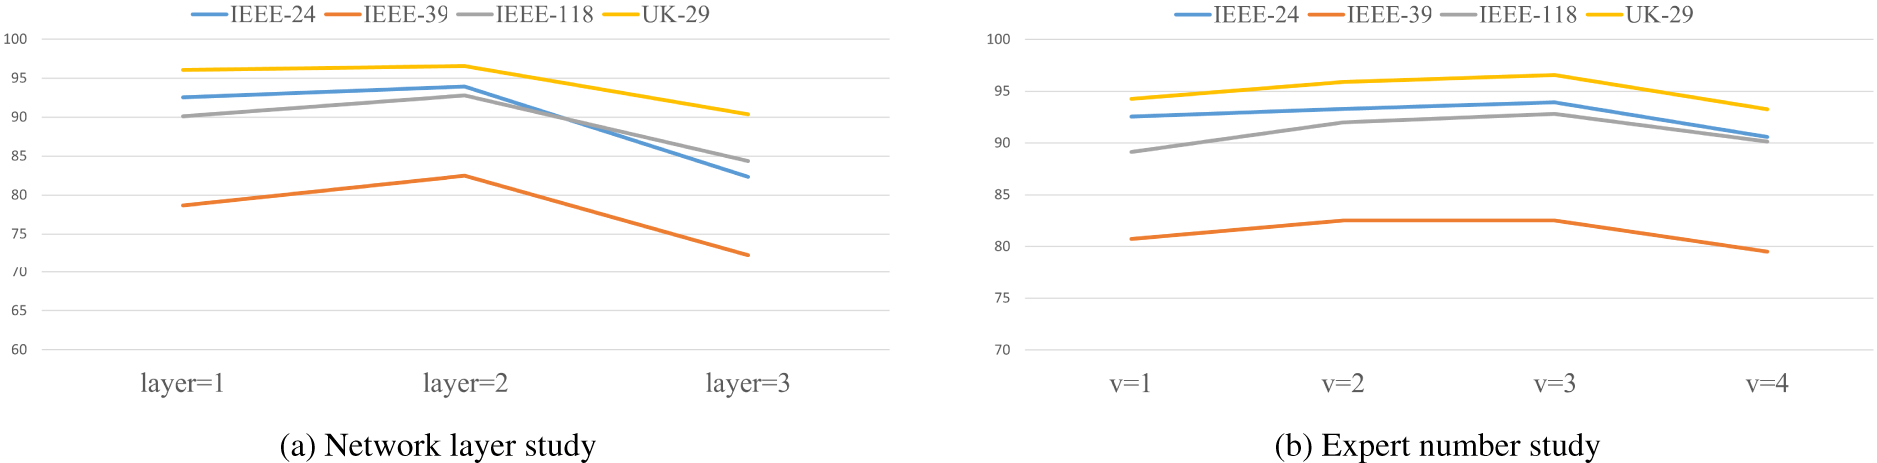
Figure 4: The network layer study and the expert number study on the four datasets: (a) Network layer study; (b) Expert number study
Expert number study evaluates the impact of the number of experts in the multi-expert reliable decision module on MCIG’s performance. Evaluation results across four datasets in Fig. 4b indicate that three experts achieve the highest performance. This suggests that three experts provide an optimal balance of complementary information and dynamic integration for reliable fault diagnosis. Increasing the number of experts beyond three introduces redundancy, slightly reducing performance. Thus, three experts are recommended for accurate fault recognition in smart grids.
Fig. 5 depicts the convergence analysis of MCIG on IEEE-24, IEEE-39, IEEE-118, and UK-29. It shows a downward trend as the number of training epochs increases, indicating good convergence during the training process. Overall, within 100 epochs, all datasets achieve effective model convergence, demonstrating the strong generalization ability and stability of MCIG.
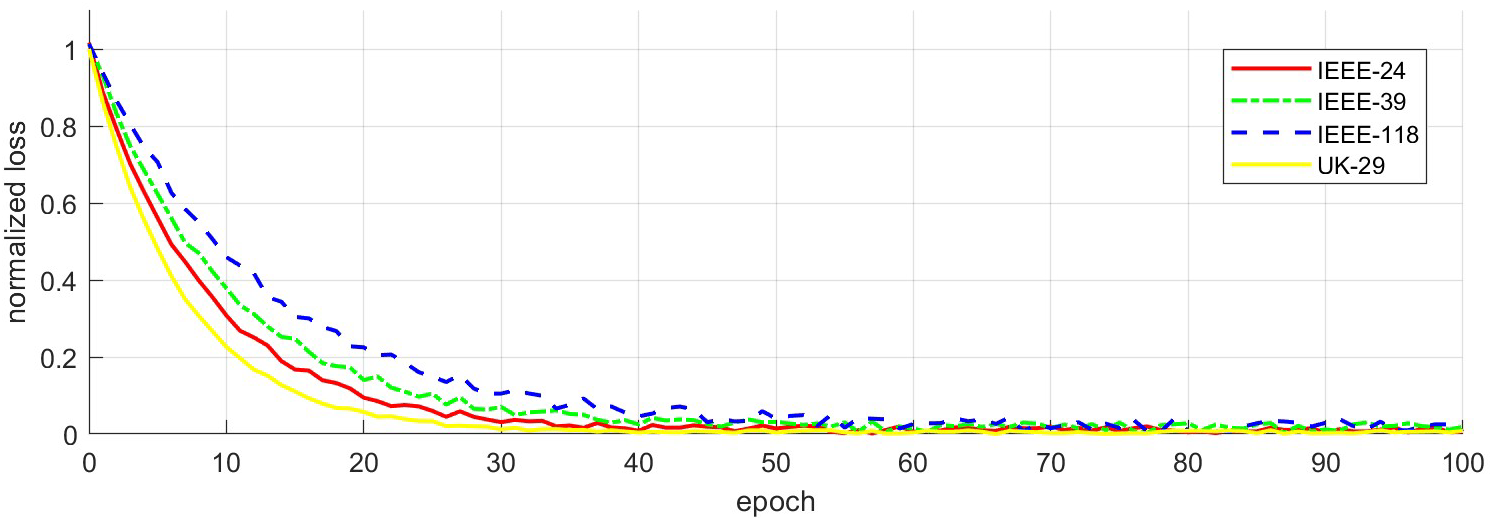
Figure 5: Convergence analysis on four dataset
This work has proposed a multi-expert collaboration-based information graph learning method (MCIG) to ensure secure operation within increasingly complex smart grid infrastructures. MCIG achieves the reliable and precise identification and diagnosis of the system fault in smart grids via integrating the information graph aggregation and the multi-expert reliable decision into a unified architecture. Extensive experiment evaluations on the four datasets have revealed that MCIG outperforms the state-of-the-art existing benchmarks. For future research directions, several avenues present significant potential. First, temporal-aware grid fault diagnosis is crucial. Smart grid data have temporal characteristics. It is critical to investigate leveraging temporal analysis to detect early fault signs and prevent escalation. Advanced temporal models for real-time monitoring and early warning could be developed. Second, multimodal-fused grid fault diagnosis is promising. Smart grids have diverse data types. Integrating multimodal data can enhance fault diagnosis accuracy and reliability.
Acknowledgement: The authors would like to express their gratitude to the University of Chinese Academy of Sciences for the academic support. The authors are also thankful to the Northeast Power Grid for providing the data support.
Funding Statement: This work is supported by the Development Department Science and Technology Project (52992624000X).
Author Contributions: The authors confirm contribution to the paper as follows: study conception and design: Zengyao Tian and Li Lv; data collection: Zengyao Tian and Li Lv; analysis and interpretation of results: Wenchen Deng; draft manuscript preparation: Zengyao Tian. All authors reviewed the results and approved the final version of the manuscript.
Availability of Data and Materials: The data that support the findings of this study are openly available at https://figshare.com/articles/dataset/PowerGraph/22820534 (accessed on 20 August 2025).
Ethics Approval: This study does not involve human or animal experiments, therefore ethical approval is not required. However, in the research process, we still strictly followed the ethical principles of scientific research and relevant laws and regulations, ensuring that the data sources were legal, the research methods were rigorous, the research results were true and reliable, and did not cause potential harm or adverse effects to any individual or group.
Conflicts of Interest: The authors declare no conflicts of interest to report regarding the present study.
References
1. Li Y, Yan J. Cybersecurity of smart inverters in the smart grid: a survey. IEEE Trans Power Electron. 2022;38(2):2364–83. doi:10.1109/TPEL.2022.3206239. [Google Scholar] [CrossRef]
2. Boopathy P, Liyanage M, Deepa N, Velavali M, Reddy S, Maddikunta PKR, et al. Deep learning for intelligent demand response and smart grids: a comprehensive survey. Comput Sci Rev. 2024;51(1):100617. doi:10.1016/j.cosrev.2024.100617. [Google Scholar] [CrossRef]
3. Zhang X, Wang Z, Du M, Mao X, Ding R, Yu H, et al. Research on data-driven model for power grid fault diagnosis fusing topological quantification information. Eng Appl Artif Intell. 2024;133(2):108286. doi:10.1016/j.engappai.2024.108286. [Google Scholar] [CrossRef]
4. Gao J, Liu M, Li P, Zhang J, Chen Z. Deep multiview adaptive clustering with semantic invariance. IEEE Trans Neural Netw Learn Syst. 2024;35(9):12965–12978. doi:10.1109/TNNLS.2023.3265699. [Google Scholar] [PubMed] [CrossRef]
5. Gao J, Liu M, Li P, Laghari AA, Javed AR, Victor N, et al. Deep incomplete multiview clustering via information bottleneck for pattern mining of data in extreme-environment IoT. IEEE Internet Things J. 2024;11(16):26700–12. doi:10.1109/JIOT.2023.3325272. [Google Scholar] [CrossRef]
6. Zhao L, Xie Q, Li Z, Wu S, Yang Y. Dynamic graph guided progressive partial view-aligned clustering. IEEE Trans Neural Netw Learn Syst. 2024;36(5):9370–82. doi:10.1109/TNNLS.2024.1234567. [Google Scholar] [CrossRef]
7. Wang Y, Hao Y, Zhao K, Yao Y. Stochastic configuration networks for short-term power load forecasting. Inf Sci. 2025;689:121489. doi:10.1016/J.INS.2024.121489. [Google Scholar] [CrossRef]
8. Zhao L, Wang X, Liu Z, Wang Z, Chen Z. Learnable graph guided deep multi-view representation learning via information bottleneck. IEEE Trans Circuits Syst Video Technol. 2024;35(4):3303–14. doi:10.1109/TCSVT.2024.1234567. [Google Scholar] [CrossRef]
9. Wang T, Liu W, Cabrera LV, Wang P, Wei X, Zang T. A novel fault diagnosis method of smart grids based on memory spiking neural P systems considering measurement tampering attacks. Inf Sci. 2022;596(3):520–36. doi:10.1016/j.ins.2022.03.013. [Google Scholar] [CrossRef]
10. Ghamizi S, Bojchevski A, Ma A, Cao J. SafePowerGraph: safety-aware evaluation of graph neural networks for transmission power grids. arXiv:2407.12421. 2024. [Google Scholar]
11. Chen C, Li Q, Chen L, Liang Y, Huang H. An improved GraphSAGE to detect power system anomaly based on time-neighbor feature. Energy Rep. 2023;9(5):930–7. doi:10.1016/j.egyr.2022.11.116. [Google Scholar] [CrossRef]
12. Grassi F, Manganini GM, Kouramas K. Graph-based data mining, pattern recognition and anomaly detection for intelligent energy networks. Comput Ind Eng. 2024;193(4):110329. doi:10.1016/j.cie.2024.110329. [Google Scholar] [CrossRef]
13. Liu J, Duan Z, Liu H. A grid fault diagnosis framework based on adaptive integrated decomposition and cross-modal attention fusion. Neural Netw. 2024;178:106400. doi:10.1016/j.neunet.2024.106400. [Google Scholar] [PubMed] [CrossRef]
14. Jobe A, Ky R, Luo S, Dhamsania A, Purohit S, Serra E. Power grid anomaly detection via hybrid LSTM-GIN model (student abstract). Proc AAAI Conf Artif Intell. 2024;38(21):23525–7. doi:10.1609/aaai.v38i21.30457. [Google Scholar] [CrossRef]
15. Gao Y, Zhang J, Chen Z, Chen X. Anomaly detection algorithm of power system based on graph structure and anomaly attention. Comput Mater Contin. 2024;79(1):493–507. doi:10.32604/cmc.2024.048615. [Google Scholar] [CrossRef]
16. Wang Z, Jiang W, Xu J, Xu Z, Zhou A, Xu M. Grid2Vec: learning node representations of digital power systems for anomaly detection. IEEE Trans Smart Grid. 2024;15(5):5031–42. doi:10.1109/TSG.2024.3377223. [Google Scholar] [CrossRef]
17. Park S, Pandey A. Anomaly detection in power grids via context-agnostic learning. arXiv:2404.07898. 2024. [Google Scholar]
18. Harrou F, Bouyeddou B, Dairi A, Sun Y. Exploiting autoencoder-based anomaly detection to enhance cybersecurity in power grids. Future Internet. 2024;16(6):184. doi:10.3390/fi16060184. [Google Scholar] [CrossRef]
19. Danilczyk W, Sun YL, He H. Smart grid anomaly detection using a deep learning digital twin. In: 2020 52nd North American Power Symposium (NAPS); 2021 Apr 11–13; Tempe, AZ, USA. p. 1–6. doi:10.1109/NAPS50074.2021.9449682. [Google Scholar] [CrossRef]
20. Abdel-Basset M, Moustafa N, Hawash H. Privacy-preserved generative network for trustworthy anomaly detection in smart grids: a federated semisupervised approach. IEEE Trans Ind Informat. 2023;19(1):995–1005. doi:10.1109/TII.2022.3165869. [Google Scholar] [CrossRef]
21. van Nooten CC ,van de Poll T, Füllhase S, Heres J, Heskes T, Shapovalova Y. Graph neural networks for assessing the reliability of the medium-voltage grid. Appl Energy. 2025;384(6):125401. doi:10.1016/j.apenergy.2025.125401. [Google Scholar] [CrossRef]
22. Wang G, Zhang Z, Bian Z, Xu Z. A short-term voltage stability online prediction method based on graph convolutional networks and long short-term memory networks. Int J Electr Power Energy. 2021;127(7):106647. doi:10.1016/j.ijepes.2020.106647. [Google Scholar] [CrossRef]
23. Bobakov V, Kuzmin S, Butorova A, Sergeev A. Application of graph-structured data for forecasting the dynamics of time series of natural origin. Eur Phys J Spec Top. 2024:1–15. doi:10.1140/epjs/s11734-024-01368-z. [Google Scholar] [CrossRef]
24. Qiu X, Qian J, Wang H, Tan X, Jin Y. An attentive copula-based spatio-temporal graph model for multivariate time-series forecasting. Appl Soft Comput. 2024;154(10):111324. doi:10.1016/J.ASOC.2024.111324. [Google Scholar] [CrossRef]
25. Daneshfar F, Dolati M, Sulaimany S. Graph clustering techniques for community detection in social networks. In: Community structure analysis from social networks. Boca Raton, FL, USA: Chapman and Hall/CRC; 2025. p. 81–100. doi:10.1140/epjs/s11734-024-01368-z. [Google Scholar] [CrossRef]
26. Zhao W, Li W, Li Y, Yang L, Liang Z, Hu E, et al. Constructing balanced training samples: a new perspective on long-tailed classification. IEEE Trans Multimed. 2025;27:5130–43. doi:10.1109/TMM.2025.3543084. [Google Scholar] [CrossRef]
27. Mao Z, Ju W, Yi S, Wang Y, Xiao Z, Long Q, et al. Learning knowledge-diverse experts for long-tailed graph classification. ACM Trans Knowl Discov Data. 2025;19(2):1–24. doi:10.1145/3705323. [Google Scholar] [CrossRef]
28. Zhao T, Zhang X, Wang S. Graphsmote: imbalanced node classification on graphs with graph neural networks. In: WSDM ’21: Proceedings of the 14th ACM International Conference on Web Search and Data Mining; 2021 Mar 8–12; p. 833–41. doi:10.1145/3437963.3441720. [Google Scholar] [CrossRef]
29. Zhong Z, Cui J, Liu S, Jia J. Improving calibration for long-tailed recognition. In: 2021 IEEE/CVF Conference on Computer Vision and Pattern Recognition (CVPR); 2021 Jun 20–25; Nashville, TN, USA. p. 16489–98. doi:10.1109/CVPR46437.2021.01622. [Google Scholar] [CrossRef]
30. Yi S-Y, Mao Z, Ju W, Zhou YD, Liu L, Luo X, et al. Towards long-tailed recognition for graph classification via collaborative experts. IEEE Trans Big Data. 2023;9(6):1683–96. doi:10.1109/TBDATA.2023.3313029. [Google Scholar] [CrossRef]
31. Rampášek L, Galkin M, Dwivedi VP, Luu AT, Wolf G, Beaini D. Recipe for a general, powerful, scalable graph transformer. Adv Neural Inf Process Syst. 2022;35:14501–15. [Google Scholar]
32. Veličković P, Cucurull G, Casanova A, Romero A, Lió P, Bengio Y. Graph attention networks. In: International Conference on Learning Representations (ICLR); 2018 Apr 30–May 3; Vancouver, BC, Canada. [Google Scholar]
33. Kim J, Nguyen D, Min S, Cho M, Lee H, Hong S. Pure transformers are powerful graph learners. Adv Neural Inf Process Syst. 2022;35:14582–95. [Google Scholar]
Cite This Article
 Copyright © 2025 The Author(s). Published by Tech Science Press.
This work is licensed under a Creative Commons Attribution 4.0 International License , which permits unrestricted use, distribution, and reproduction in any medium, provided the original work is properly cited.
 Downloads
 Citation Tools