
 Submit a Paper
 Propose a Special lssue
 Open Access
ARTICLE

HERL-ViT: A Hybrid Enhanced Vision Transformer Based on Regional-Local Attention for Malware Detection
1 School of Computer, North China Institute of Aerospace Engineering, Langfang, 065000, China
2 School of Automation, Southeast University, Nanjing, 210096, China
3 College of Intelligence and Computing, Tianjin University, Tianjin, 300072, China
* Corresponding Authors: Huijuan Wang. Email: ; Yongjun Qi. Email:
(This article belongs to the Special Issue: Advances in Efficient Vision Transformers: Architectures, Optimization, and Applications)
Computers, Materials & Continua 2025, 85(3), 5531-5553. https://doi.org/10.32604/cmc.2025.070101
Received 08 July 2025; Accepted 22 August 2025; Issue published 23 October 2025
 View Full Text
 Download PDF
Abstract
The proliferation of malware and the emergence of adversarial samples pose severe threats to global cybersecurity, demanding robust detection mechanisms. Traditional malware detection methods suffer from limited feature extraction capabilities, while existing Vision Transformer (ViT)-based approaches face high computational complexity due to global self-attention, hindering their efficiency in handling large-scale image data. To address these issues, this paper proposes a novel hybrid enhanced Vision Transformer architecture, HERL-ViT, tailored for malware detection. The detection framework involves five phases: malware image visualization, image segmentation with patch embedding, regional-local attention-based feature extraction, enhanced feature transformation, and classification. Methodologically, HERL-ViT integrates a multi-level pyramid structure to capture multi-scale features, a regional-to-local attention mechanism to reduce computational complexity, an Optimized Position Encoding Generator for dynamic relative position encoding, and enhanced MLP and downsampling modules to balance performance and efficiency. Key contributions include: (1) A unified framework integrating visualization, adversarial training, and hybrid attention for malware detection; (2) Regional-local attention to achieve both global awareness and local detail capture with lower complexity; (3) Optimized PEG to enhance spatial perception and reduce overfitting; (4) Lightweight network design (5.8M parameters) ensuring high efficiency. Experimental results show HERL-ViT achieves 99.2% accuracy (Loss = 0.066) on malware classification and 98.9% accuracy (Loss = 0.081) on adversarial samples, demonstrating superior performance and robustness compared to state-of-the-art methods.Keywords
With the continuous progress and popularization of Internet technology, computer systems have gradually become an indispensable part of people’s daily lives and work. This development provides a suitable environment for the continuous growth of malware. In the early days, malicious software only had simple destructive and disruptive functions, but due to the continuous development of computer technology, malicious software has gradually become more complex and diverse. In recent years, many researchers have used deep learning techniques to study malicious software in order to better identify its behavior and functionality. In 2011, Nataraj et al. [1] first converted malware samples into grayscale images, generating grayscale images by matching pixel values with vector values. Many researchers later analyzed the texture features represented by images based on this foundation [2–5]. In 2022, Falana et al. [6] converted malicious software and benign files into RGB images and used deep convolutional neural networks (DCNN) and deep generative adversarial networks (DGAN) for analysis, detection, and classification. In 2023, Chai et al. [7] explored how to effectively detect unknown malware in the case of a small number of samples. Their research method, Few Shot Learning (FSL), provides a new perspective for handling unknown malware detection. In the same year, Rodriguez Bazan et al. [8] proposed a method based on fuzzy hash visualization to generate fuzzy hash values, thereby generating grayscale image representations of APK files and further completing detection tasks. Rahman [9] used an interpretable AI method called LIME to illustrate the sample selection and classification process of the model, increasing its interpretability and providing a reference for future research directions. Chaganti et al. [10] chose EfficientNet as the main CNN model architecture to achieve high-precision and low-cost malware classification. In 2024, Li et al. [11] achieved excellent results in classifying enhanced malware images using perceptual hashing modules and CNN classification modules. In the same year, Katar and Yıldırım [12] adopted the ViT-B/16 pre-trained model on ImageNet and achieved higher detection performance at a lower hardware cost by fine-tuning it to adapt to malicious software image classification tasks and utilizing transfer learning methods.
Although the above work has achieved good results, in order to further cope with the rapid growth of malware and the continuous evolution of network attack methods, it is necessary to build efficient and robust detection models to solve the problems of insufficient ability of traditional models to process complex image data, and the waste of resources and reduction of reasoning speed caused by the complex calculation of self-attention mechanism when traditional ViT models process large-scale image data. This paper proposes an efficient detection model, HERL-ViT, which not only has higher detection accuracy, but also enhances the identification ability of malicious variants through adversarial training and adversarial samples, showing excellent robustness, which can resist the challenge of adversarial testing in intrusion scenarios and improve the effect of network security protection. The main contributions of this paper are as follows:
• Proposed a unified malware detection framework integrating visualization, adversarial sample generation, and hybrid attention-based classification
• We designed an enhanced ViT network architecture, HERL-ViT, which builds multi-scale features through a multi-level pyramid structure. It extracts regional and fine-grained features and captures image spatial representations by means of a region-to-local attention mechanism. Meanwhile, it simplifies information exchange and improves computational efficiency by using non-overlapping windows.
• Compared with traditional fixed-position coding, the relative position information is dynamically generated through multi-scale convolution, reducing the risk of overfitting (AUROC increases to 0.999), and is particularly suitable for the texture diversity of malicious software images.
• Enhanced MLP and downsampling structures, cutting model parameters to 5.8M (1/73 of Global-Local Attention-Based Butterfly ViT) while maintaining high accuracy.
Our method effectively detects raw samples of malicious software while assisting in the detection of adversarial samples, significantly improving the performance and robustness of the hybrid model.
The feature processing methods of malware detection technology mainly include image-based malware detection and graph-based malware detection. Image-based detection typically utilizes visualization techniques to convert malicious code samples into grayscale images, where binary data is read as a vector consisting of 8-bit unsigned integers and organized into a 2D array, resulting in grayscale or RGB images. In 2020, Danish [5] converted malware binary files into color images and compared the performance of different image texture feature maps on the training set. In multi-classification problems, using a fine-tuned CNN architecture, the classification accuracy on the Malimg dataset reached 0.9882. In 2022, Shen et al. [13] fused local textures with global textures, which showed better classification performance compared to a single attention mechanism. However, the detection method based on graph structure refers to extracting information from binary files of malicious software and converting this information into a graph structure with edges and nodes. Researchers express execution semantics through the logical structure of code, which can be represented by Function Call Graph (FCG), Control Flow Graph (CFG), and Program Dependency Graph (PDG). The detection model proposed by Fang [14] utilizes a unified intermediate representation to eliminate the differences in instruction architecture of binary code. The word embedding model combined with natural language processing technology embeds basic semantic blocks and the control flow information of the graph neural network model learning function, resulting in improved scalability and accuracy of the final results. Liu et al. [15] used disassembly tools to extract malicious code API call functions and annotated their properties. Based on the contribution of the API, select key APIs to generate call graphs as model inputs, and the experimental results can achieve an accuracy of 0.873.
Due to the high similarity in overall layout and texture features among images of the same malware family, this similarity is not only reflected in the macroscopic structure of the images, but also deeply into the microscopic distribution and correlation of gray levels. By analyzing and comparing these texture features, we can more effectively identify and classify malicious software. Therefore, this article adopts an image-based feature processing approach for research. This innovative method utilizes the visual expression of malicious samples, effectively avoiding the challenges faced by traditional detection methods such as code reuse and obfuscation. Research has shown that compared to traditional detection methods, image-based malware detection technology has demonstrated significant advantages in detection accuracy and efficiency. In addition, this method has the potential to enhance the ability to identify new and unknown malicious software, further strengthening network security protection.
In recent years, the Vision Transformer (ViT) model has achieved excellent results in various image recognition benchmark tests, including datasets such as ImageNet and CIFAR-100. Its performance is often better than or at least comparable to Convolutional Neural Networks (CNN), and even surpasses traditional CNN models on certain tasks. Many researchers also use the ViT model as a benchmark model for malware detection and improve it. In 2022, Seneviratne et al. [16] combined Vison Transformer with self supervised learning techniques to process RGB images, masking a portion of the input image and training the model to recover these masked parts, thereby learning useful semantic features. The application of self supervised learning technology greatly reduces the model’s dependence on annotated data. Kim and Cho [17] proposed a hybrid deep generative model that effectively detects malware variants by utilizing both global and local features, and analyzed which parts of the malware code affect the detection results through a class activation map (CAM). In 2023, Jo et al. [18] proposed a malicious behavior extraction method based on ViT model and attention graph to achieve high detection accuracy and high interpretability. Lyu et al. [19] proposed a malware detection method based on the Swin Transformer model, which is a visual Transformer model based on window segmentation and self-attention mechanism. It performs well in processing large-scale datasets with low computational resource requirements, improving computational efficiency. Belal and Sundaram [20] proposed a visual transformation based on butterfly construction, which is based on a transfer learning model and uses a pre-trained ViT model on the ImageNet dataset to initialize the training parameters of the transformer. In 2024, Yang et al. [21] proposed a malware detection model based on Pyramid Feature Processing (FPN) and Vision Transformer, where FPN was used to extract multi-scale pyramid features from N-gram features to enhance the model’s ability to characterize malware behavior. ViT is used for further processing of the feature maps output by FPN. The feature map output by FPN is converted into a series of patches and input into the ViT model to learn global dependencies and high-level feature representations. Existing window-based Transformers (e.g., Swin) use fixed window sizes, which cannot capture both large-scale structural features (e.g., section boundaries in PE files) and fine-grained textures (e.g., obfuscated instruction sequences) in malware images. HERL-ViT’s regional-local attention dynamically adjusts the scope of attention based on malware image characteristics, solving the “scale mismatch” problem.
Malware visualization images, with rich information and high entropy (retaining interference without significant quality loss), make image classification a key attack target. As malware evolves new attack methods, traditional deep learning models show insufficient robustness—attackers mislead models via small, deliberate perturbations. Thus, researchers use adversarial attack experiments to test model robustness, with effective adversarial sample generation methods like L-BFGS [22], FGSM [23], C&W [24], Moosavi-Dezfooli et al. [25], and ATMPA [26]. Adversarial attacks mainly include poisoning and evasion attacks [27]; evasion attacks, implemented during deployment, attract more attention for their practicality. In 2016, Grosse et al. [28] created adversarial samples for malware classifiers by adding small pixel perturbations, validated on Derbin Android dataset (limited to binary classification). Liu et al. (2019) proposed ATMPA, optimizing FGSM and C&W to attack malware visualization detection. Qiao [29] (2023) improved detection robustness via model interpretation and anomaly detection to identify adversarial ELF malware samples. Gao et al. [30] (2024) used FGSM, rFGSM, etc., to generate adversarial samples, evaluating detector performance across scenarios.
These studies performed well. With growing malware variants and threats, enhancing detection model robustness is key to improving overall malware detection.
This article proposes a high detection accuracy and robust network structure based on improved ViT, namely HERL-ViT. This model adopts a multi-level hierarchical structure and combines region-to-local attention mechanism to extract multi-scale information. Design an improved Optimized Position Encoding Generator to dynamically generate relative position encoding. In order to reduce the parameter and computational complexity of the model and improve its flexibility and generalization ability, this section significantly optimized the Downsample and MLP network structures. In addition, the design of the HERL-ViT encoder enables the model to have stronger ability to express detailed features, making it more accurate and efficient in handling complex spatial layouts and sequence patterns.
3.1 HERL-ViT Network Framework
This structure is based on the pyramid structure and ViT structure design of CNN, and detects across multiple output layers. Subsequently, the detection performance is enhanced by aggregating the results obtained from different layers. We designed a multi-level hierarchical structure consisting of four stages to deeply extract feature information. Each stage can be customized by the designer for depth and dimension, facilitating the generalization of the model. This process can fuse multi-level features extracted from different layers and then use the fused features to jointly train the detection network. For raw data with high-dimensional features in malicious software datasets, low-level and high-level abstract features can be gradually captured through feature extraction networks. In addition, the network structure of each stage is formed by connecting the optimized downsampling network and HERL Transformer Encoder, which is used to gradually process and transform features. Compared with global single-scale models, hierarchical structures can better adapt to visual tasks of different complexities. The network architecture diagram is shown in Fig. 1. We first adopted a transformation strategy based on grayscale images to visualize instances of malicious software. Then, using image segmentation and patch embedding strategies, the images are abstracted into two-dimensional sequences (including local and regional features). Next, the HERL Transformer Encoder will achieve the exchange of global and local information through a region-to-local attention mechanism and effectively fuse multi-scale features by stacking layers of multiple encoders. Finally, the output of the Transformer layer is transformed into the final category prediction through a classifier.
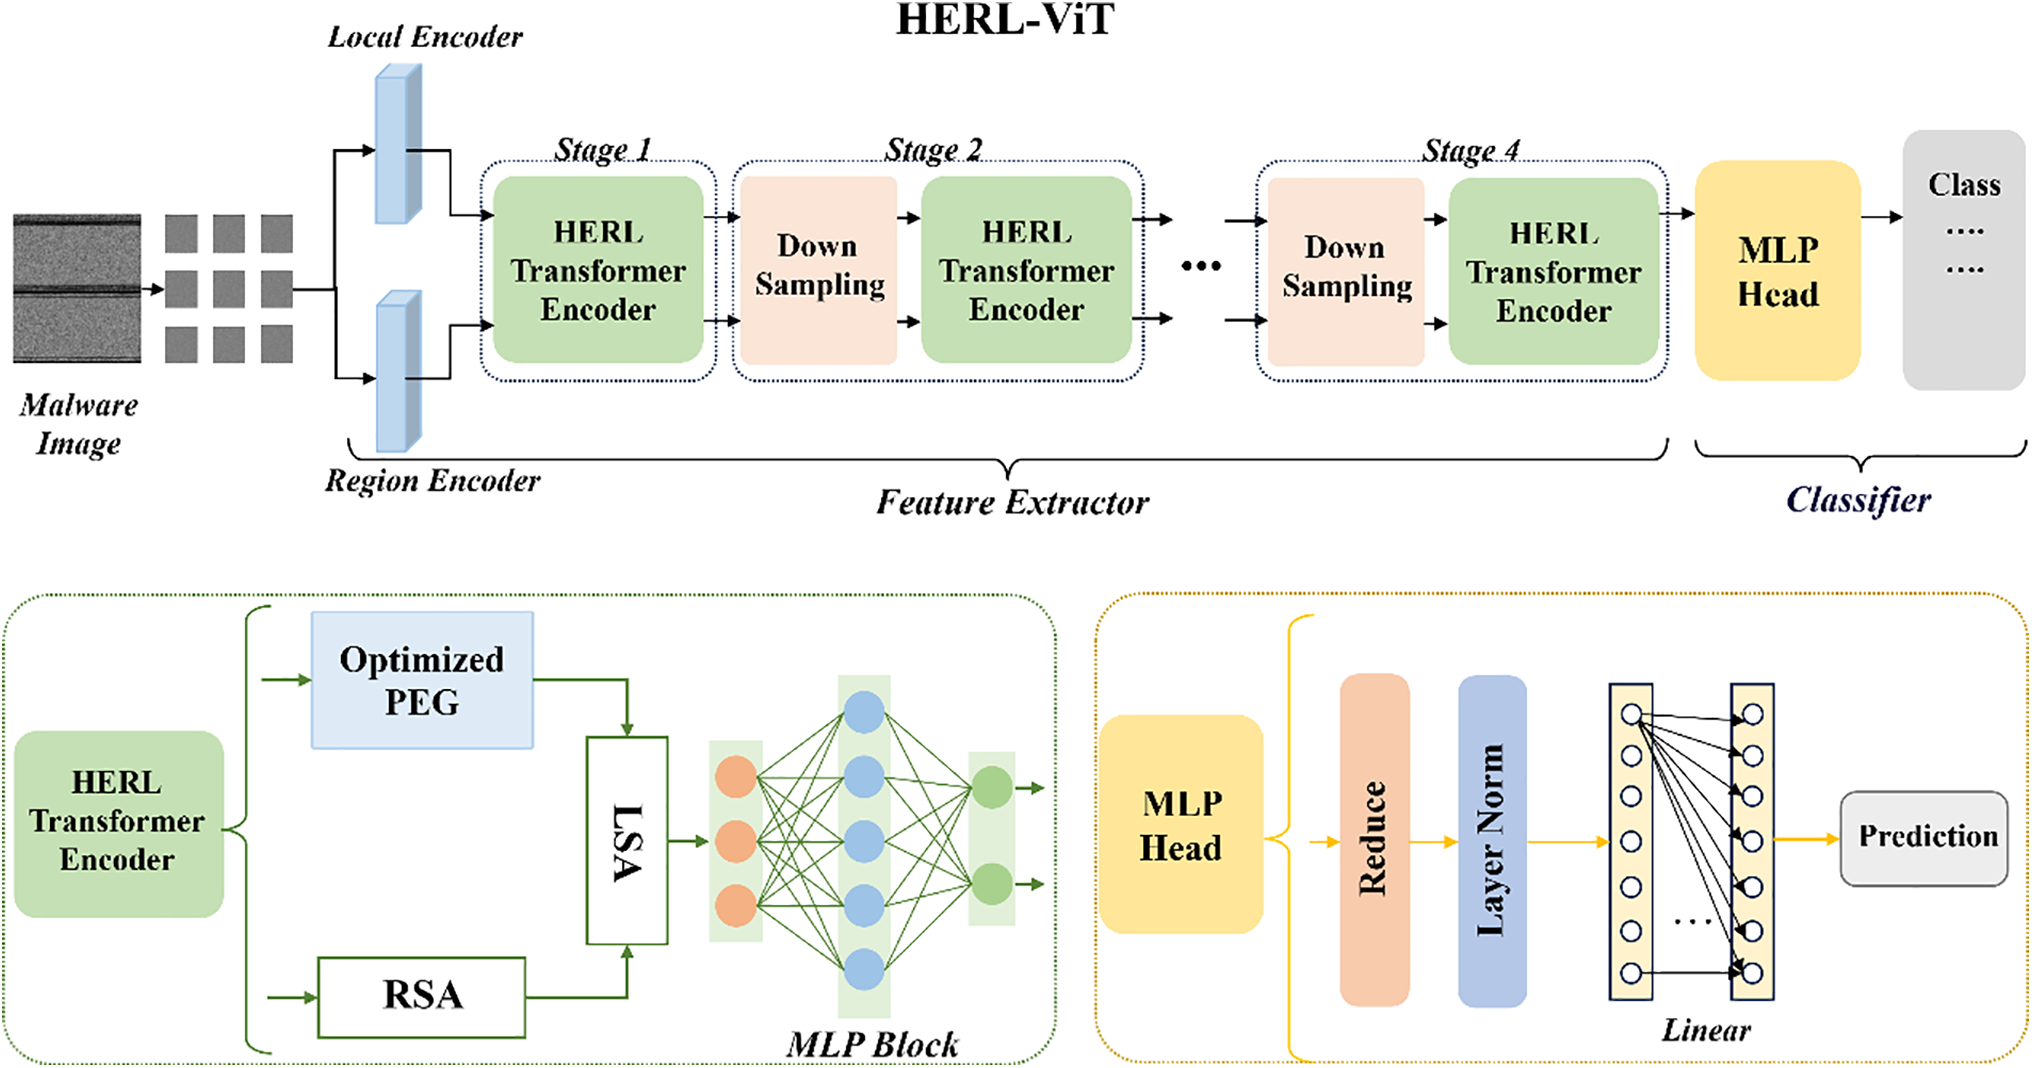
Figure 1: HERL-ViT network framework
3.2 Regional to Local Attention Mechanisms
The design in this section allows the model to capture and fuse multi-scale information at different levels by introducing a region-to-local attention mechanism. Restricting self-attention to local regions can reduce the computational burden of global self-attention. In this approach, we abstract the image into regional tokens and local tokens, and correspond to two sets of non-overlapping local and regional windows, respectively. Each local window will introduce a region token corresponding to the current window as a representative of the global information. As in Fig. 2.
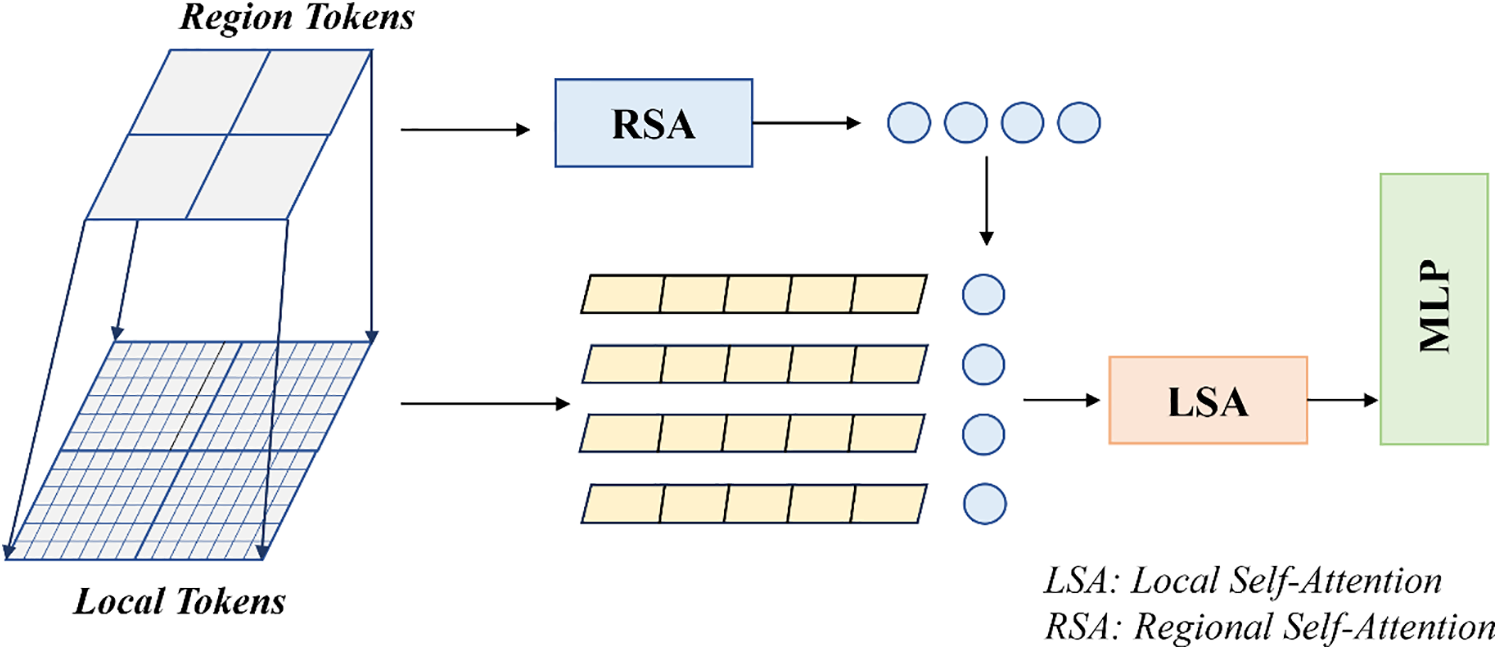
Figure 2: Region-Local attention block
In this study, the self-attention module includes Regional Self-Attention (RSA) and Local Self-Attention (LSA). Regional Self-Attention (RSA) acts as a carrier of global information and utilises all regional tokens to efficiently learn global information. It allows the model to process locally and still take into account the global context, which helps the model maintain its understanding of the overall scene while recognizing fine-grained features. And the local tokens interact within a local window through the Local Self-Attention (LSA) mechanism to capture fine-grained local features. In the Region-Local Attention mechanism, the regional and local features are stitched together into a longer sequence. The attention module will calculate the similarity between all the elements in the sequence and then sum the features weighted according to these weights. The model will then perform feature fusion based on the similarity between them. Firstly, for each head, the input feature
Among them,
Finally, the outputs of all the heads are spliced into a long sequence and combined by an additional linear transformation. Where
Therefore, the regional-to-local attention mechanism implements the use of LSA to focus deeply on fine-grained features in the image and RSA to help the model understand the overall image structure. This enables the model to improve its ability to focus on local features while being able to maintain global information, thus improving the model’s classification performance.
3.3 Optimized Position Encoding Generator
In this section, we propose a novel position encoding (PE) scheme that is dynamically generated and determined based on the local neighborhood of the input tokens. This means that the position encoding varies according to the input data, which makes it more flexible and adaptable. In order to maintain translation equivalence, we have chosen relative positional coding. It will take into account the distance between tokens in the input sequence, enhancing the model’s understanding of the spatial layout and relative positions between elements. Specifically, the relative positional relationship between elements usually reveals more about the intrinsic structure of the data than the absolute position. The interactions between elements can be modeled more effectively when dealing with sequence data. Therefore, we design an Optimized Position Encoding Generator for dynamically generating Positional Encoding (PE) based on the local neighborhood of the input markers. Optimized PEG uses multi-layer convolution, where the kernel size of each layer is different (e.g., 3 × 3, 5 × 5, 7 × 7). This is applied to the local neighborhood of the input sequence to generate the corresponding positional encoding. Optimized PEG is shown in Fig. 3.
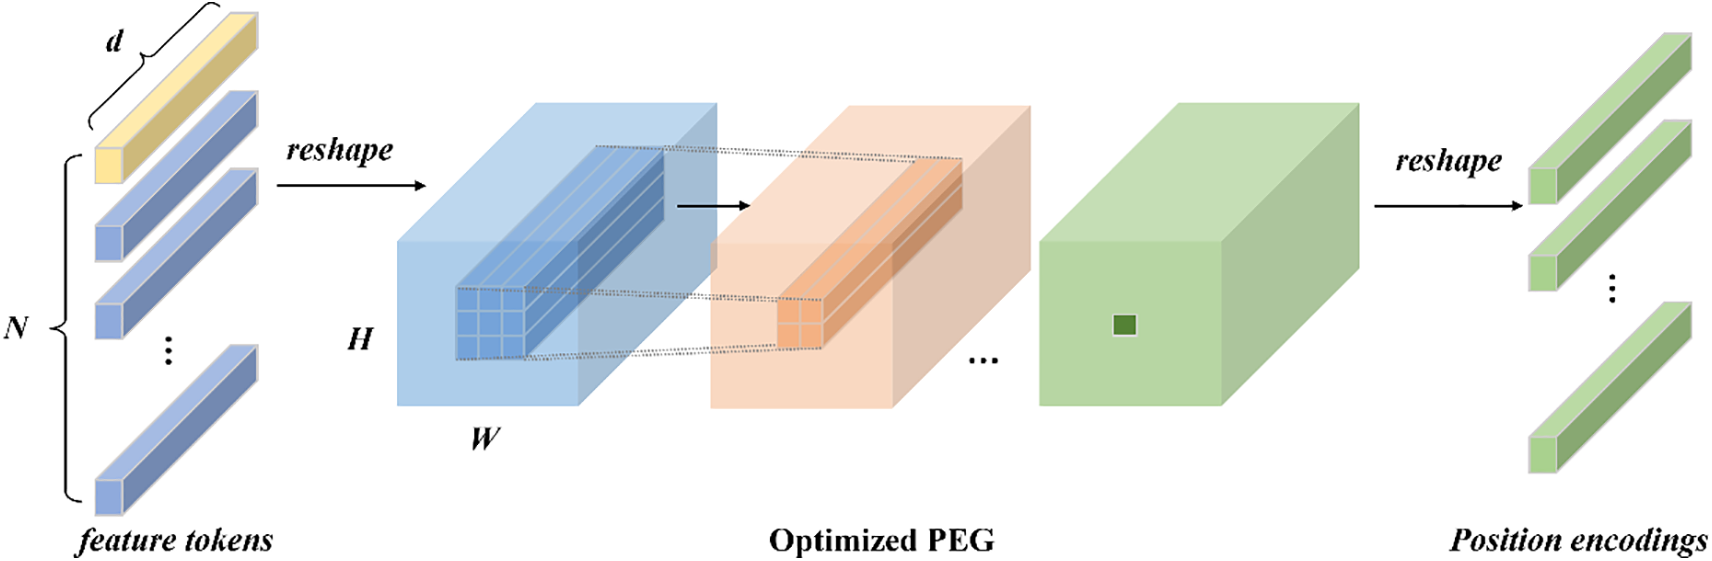
Figure 3: Structure of optimized PEG
In Optimized PEG, in order to capture the spatial relationships between patches in the local features of an image, we first compute the grid coordinates within each local window based on the spatial dimensions of the local tokens and region tokens. The relative positional offset between each element and its neighbors is determined by the difference between the grid coordinates. Using the offsets as indexes, the corresponding relative position encoding vectors were retrieved from the pre-trained embedding layer. At this point, each encoding vector matches the number of attention heads. This vector contains information about the particular relative position and is crucial for tuning the attention score. During the core computation of the attention mechanism, we innovatively integrate the retrieved relative position bias (rel_pos_bias) directly into the similarity computation of the query (Q) and the key (K) and adjust the attention allocation of the elements directly based on their relative positions to each other. The optimized attention mechanism can be formally represented as:
where
3.4 Enhanced Multilayer Perceptron Network
In the Transformer model, the Multilayer Perceptron (MLP) is a commonly used component, which is usually used to enhance the expressive power of the model by applying further nonlinear transformations to the output of the self-attention layer. In this paper, the MLP module is optimized by designing a bottleneck structure network that is explicitly divided into three stages: compression, transformation, and expansion. The option of residual linking is additionally provided to allow the original information to be preserved by summing the transformed output with the original input. This alleviates the problem of gradient vanishing in deep networks and improves the efficiency of model training. The specific structure is shown in Fig. 4:
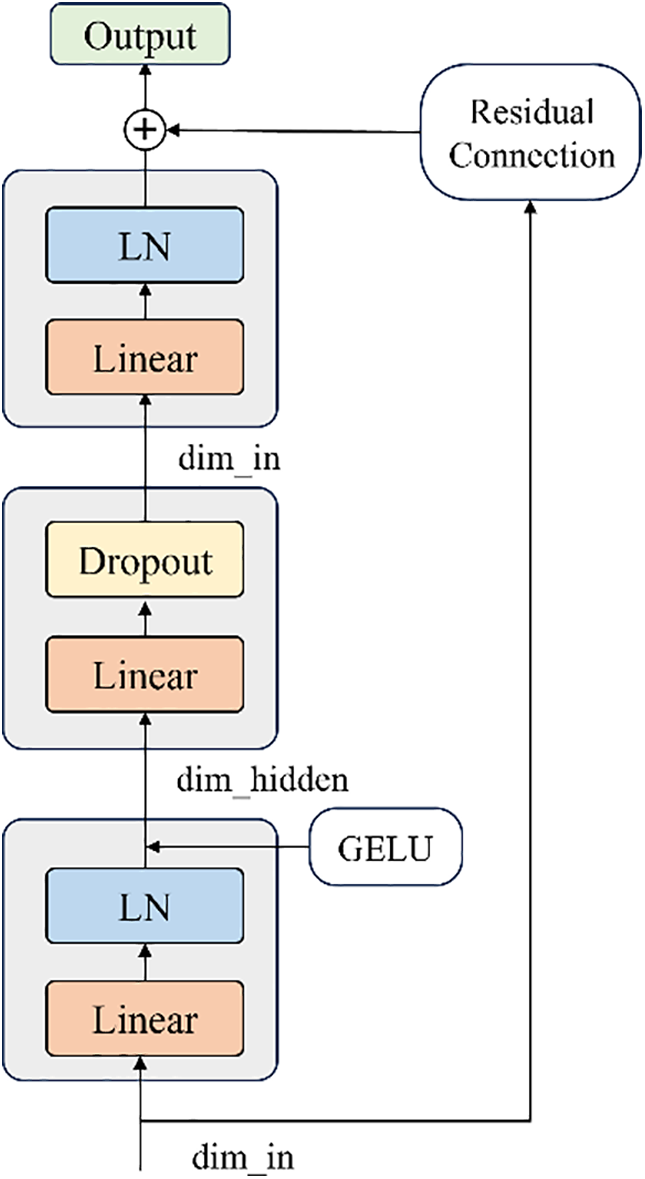
Figure 4: Enhanced MLP
The linear layer controls the feature dimension transformation. The compression phase reduces the dimensionality of the input features from
3.5 Optimizing the Downsampling Structure
Processed features are downsampled between multi-level stages to extract and integrate multi-scale features. To efficiently reduce dimensionality while retaining key features, a depth-separable convolution-based downsampling module is designed: depth convolution spatially filters input feature maps, followed by pointwise convolution to adjust channels, and ReLU for nonlinearity. This reduces model complexity and computational overhead while maintaining performance. Specifically, in non-first Transformer layers, depth-separable convolution performs downsampling to reduce feature map spatial dimensions and increase channels.
Depthwise convolution independently applies a convolution kernel to each input channel without mixing channel information. Mathematically, for the input feature map
Among them, DepthwiseConv2d represents the depthwise convolution operation, and the dimension of the output
Pointwise convolution is used to mix channel information and may change the number of channels. In Downsample, pointwise convolution is employed to reduce the output channel number of depthwise convolution from
wherein,
The implementation of our proposed framework consists of four phases (e.g., Fig. 5), respectively: (1) malicious sample image generation; (2) image segmentation and patch embedding; (3) training the malicious sample detection network; and (4) realizing the classification task. As shown in the figure, in the first stage, we generate the original image of malware and the antagonistic sample image, respectively, which are used to verify the model’s robustness. In addition, we focus on keeping the complexity and computational requirements of the framework as low as possible.
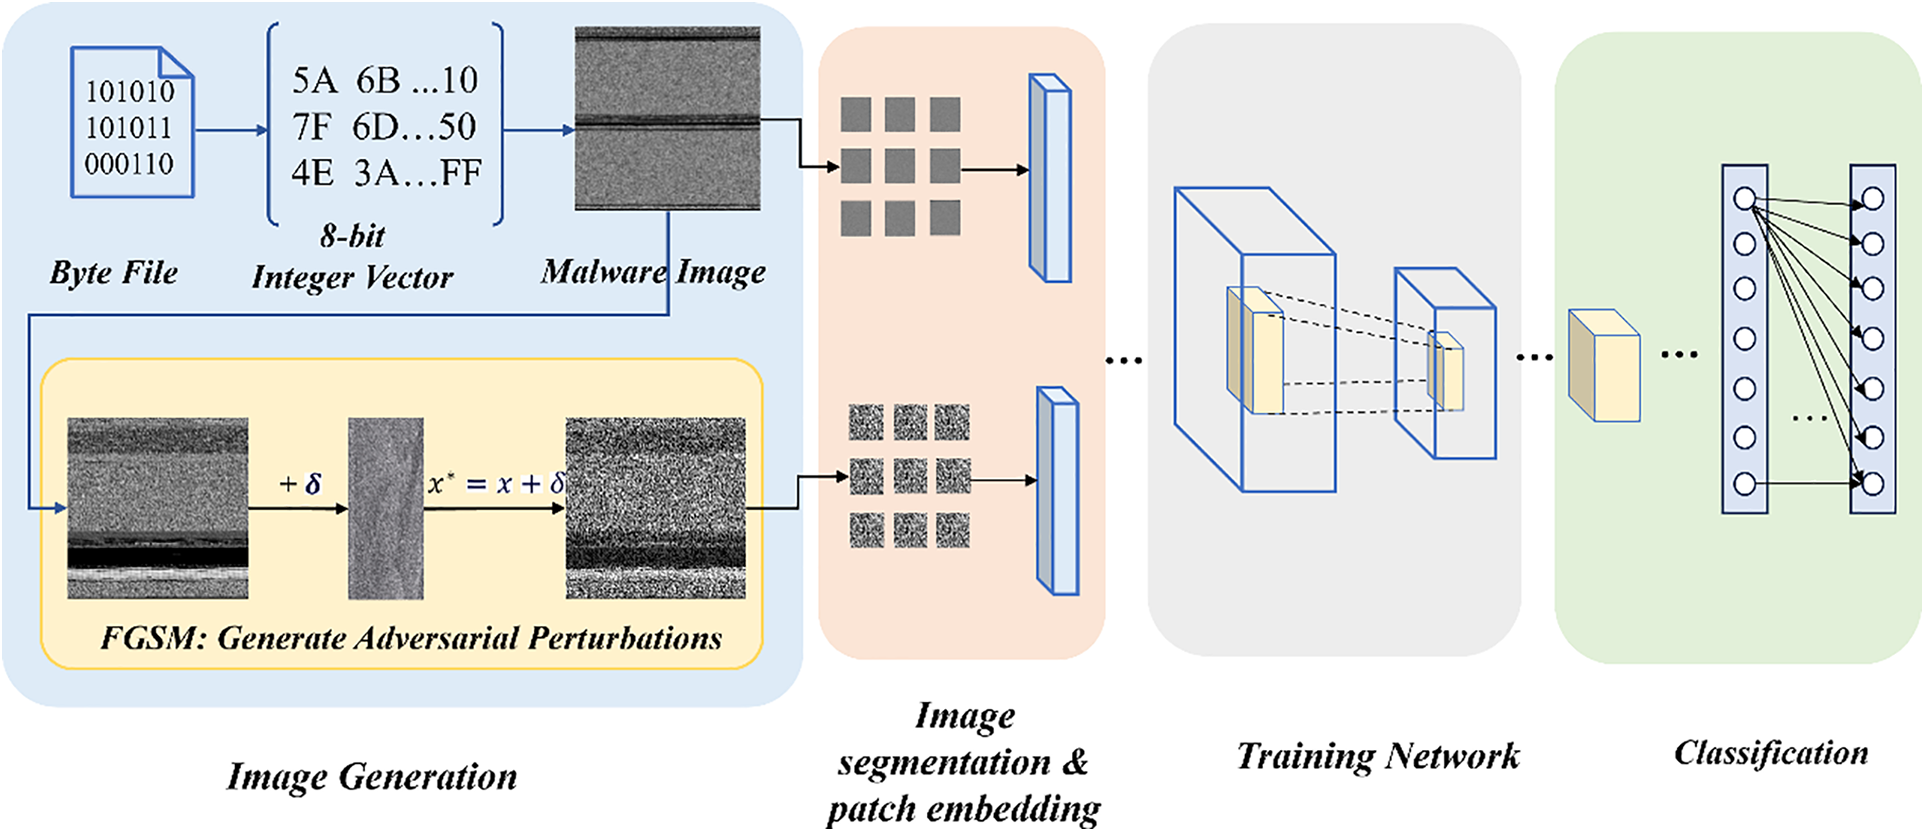
Figure 5: Overall realization process
Malware image visualization is the first step in code processing. Firstly, the malware byte file is read in binary form, and the original byte value is normalized to the range 0–255 (mapped to gray value). If the total number of bytes cannot form a complete image, the padded bytes are added. The specific process is as follows: The executable file is read as a one-dimensional vector of 8-bit unsigned integers, which is converted into a two-dimensional gray matrix in order each value in the vector corresponds to 256 gray pixels (0 is black, 255 is white). Finally, the gray image corresponding to the structural characteristics of the malware is formed.
4.2 Image Segmentation and Patch Embedding
After segmentation and embedding, the image is abstracted into a two-dimensional sequence containing local and regional features. In the segmentation process, the image is divided into non-overlapping regional Windows (28 × 28) and local Windows (7 × 7) as shown in Fig. 6, where one regional window covers 7 × 7 local tokens, corresponding to a local Patch size of 4 × 4, and the global computation is reduced by self-attention operation in independent Windows. In the embedding stage, both the local encoder and the region encoder are enabled. The local encoder extracts fine-grained features through multi-layer convolution (including normalization and activation function). The region encoder segments the feature map according to the preset size and reorganizes it into vectors, which are processed by convolution to generate region features. The final two sets of tokens are input into HERL-ViT for feature fusion and deep processing.
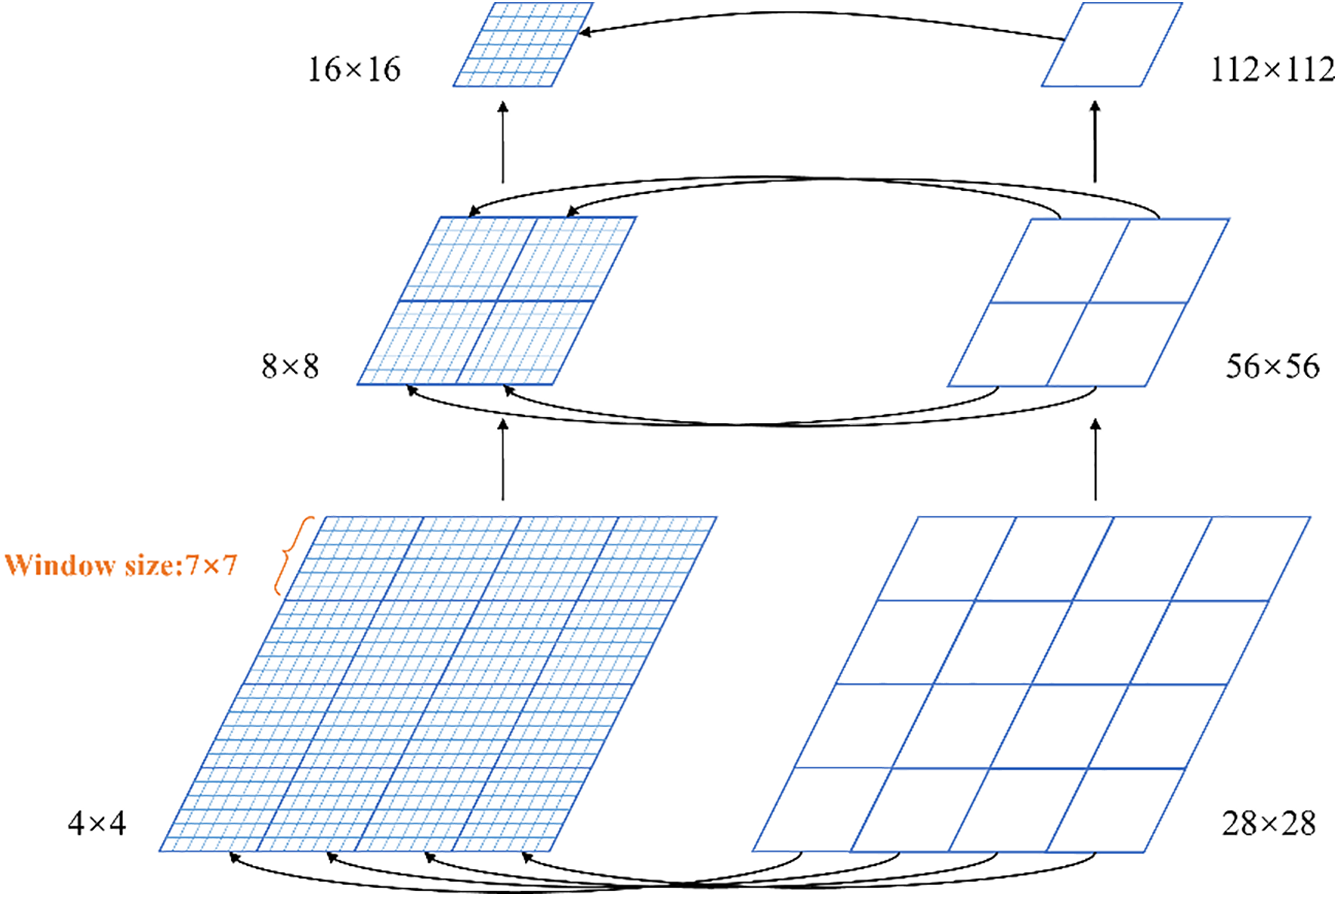
Figure 6: Regional features are fused with local features
4.3 Generation of Adversarial Samples
To verify the robustness of the model, the Fast Gradient Sign Method (FGSM) is adopted to generate adversarial samples. The core idea is to inject carefully designed tiny perturbations into the original input, causing the model to misjudge but maintaining the visual or functional similarity of the samples. The FGSM method is to approximate the solution by linearizing the gradient of the loss function near the input point, and the formula for calculating the adversarial perturbation is as follows.
here,
We evaluate the models for malware detection using precision, recall, Loss value, precision and F1-score, AUROC metric, and confusion matrix, among others.
where
The HERL-ViT implementation environment is 64-bit Windows 11, equipped with Intel (R) Xeon (R) w5-3423 4.2 GHz, NVIDIA RTX A5000 graphics card (CUDA 12.3) and 124 GB of memory. Python 3.10.13 and the libraries vit-pytorch, transformers, and vit_keras are adopted. Experimental hyperparameters: Learning rate 1 × 10⁻⁴, Adam optimizer, 150 epochs trained, batch size 48, cosine annealing strategy adopted (minimum learning rate 1 × 10⁻⁶); The dataset is divided into training, test and validation sets in an 8:1:1 ratio.
The public data set used in this study is the Big2015 data set released by Microsoft on Kaggle, which contains nine classes of families. From Fig. 7, we can see that the number of Simda families is only 42, accounting for about 0.38%, resulting in a serious imbalance of the data set. Moreover, Trojan attacks account for more than half of the size of the dataset, so the model needs to overcome these problems during training. In this dataset: Ramnit (3000 samples), Lollipop (2478), Kelihos_ver3 (1541), Vundo (1228), Obfuscator. ACY (1013), Gatak (751), Kelihos_ver1 (475), Tracur (398), and Simda (42). Notably: Severe class imbalance: Simda (0.38%) vs. Ramnit (27.3%). Includes obfuscated samples: Obfuscator. ACY (1013 samples) uses string obfuscation and control flow flattening. Trojans account for 58% (Ramnit, Lollipop, Tracur), requiring the model to distinguish similar structural features. Fig. 8 shows that we need to overcome the structural similarity exhibited by many families during the training process.
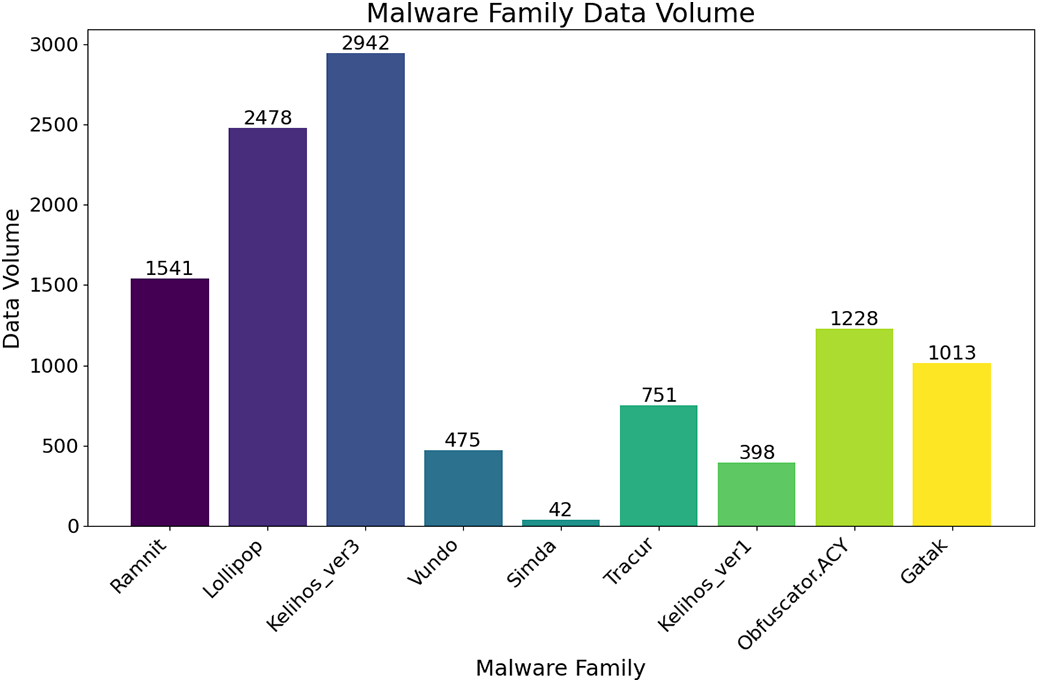
Figure 7: Dataset distribution
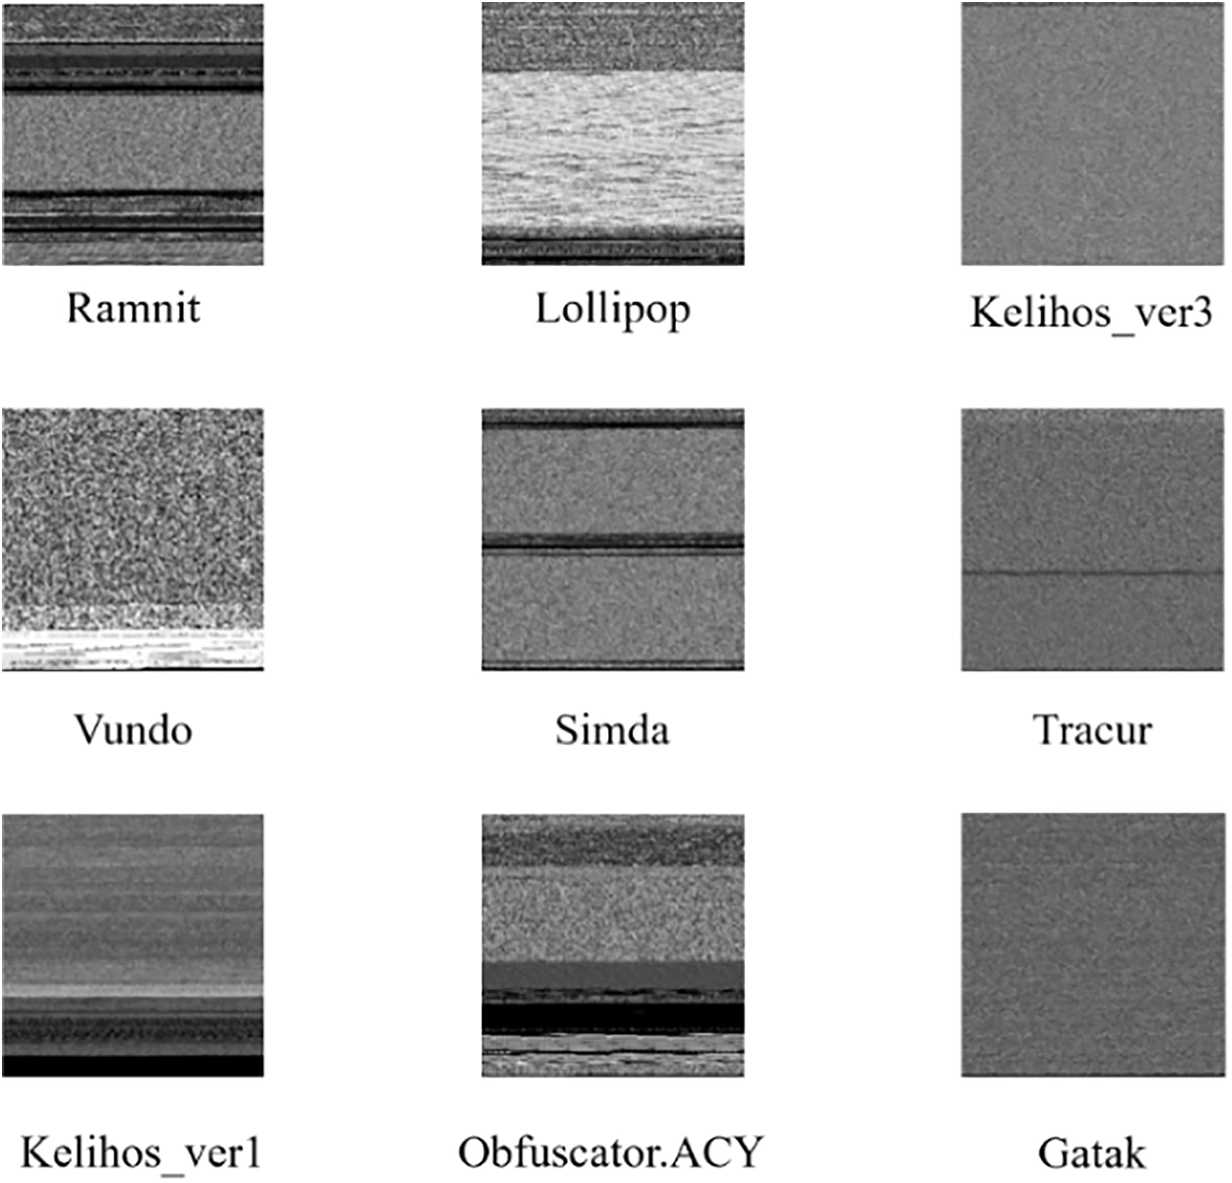
Figure 8: Malware family
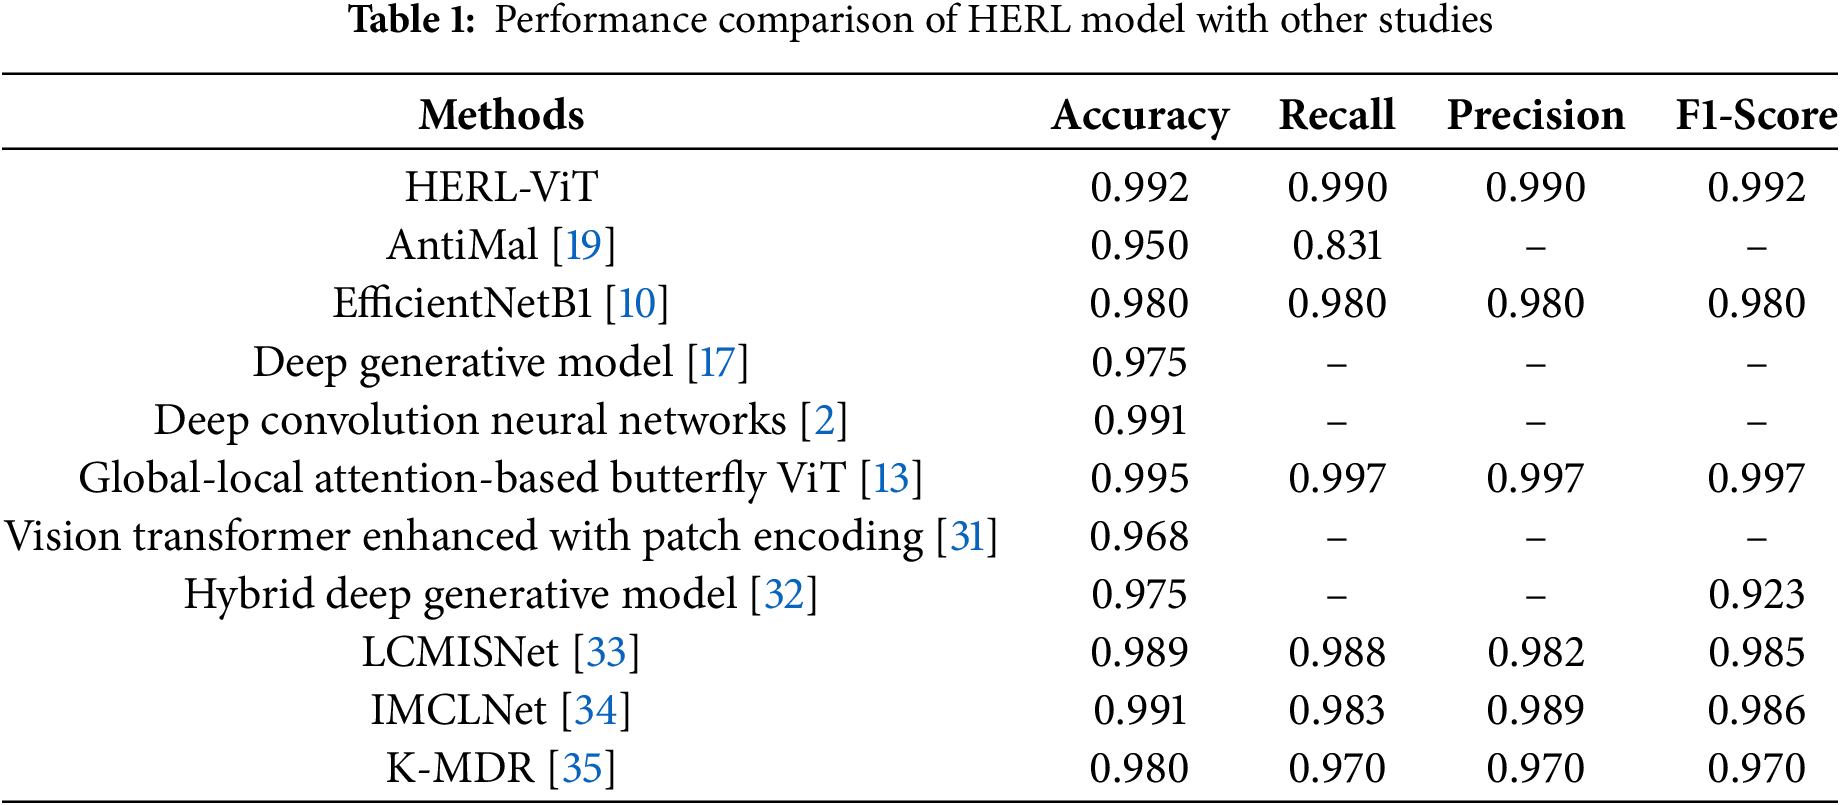
5.2 Comparison with Existing Work
We conducted a comparative analysis with the algorithms proposed in existing works on the same dataset (see Table 1). The accuracy of the HERL-ViT model exceeds 99%, second only to Global Local Attention Based Butterfly ViT’s 0.9949. This high accuracy rate indicates that HERL-ViT has excellent overall performance in recognition tasks. However, the accuracy of other models only stays between 0.95 and 0.98. The accuracy and recall of HERL-ViT are 0.99, indicating that the model has good performance in predicting the quality of results and reducing the risk of false positives. Compared with Global-Local Attention-Based Butterfly ViT: While both use hybrid attention, HERL-ViT adopts a 4-stage hierarchical structure (20 layers) instead of 8 stages (192 layers), and larger patch sizes (28 × 28 vs. 16 × 16), reducing parameters from 425.6M to 5.8M while maintaining 99.2% accuracy.
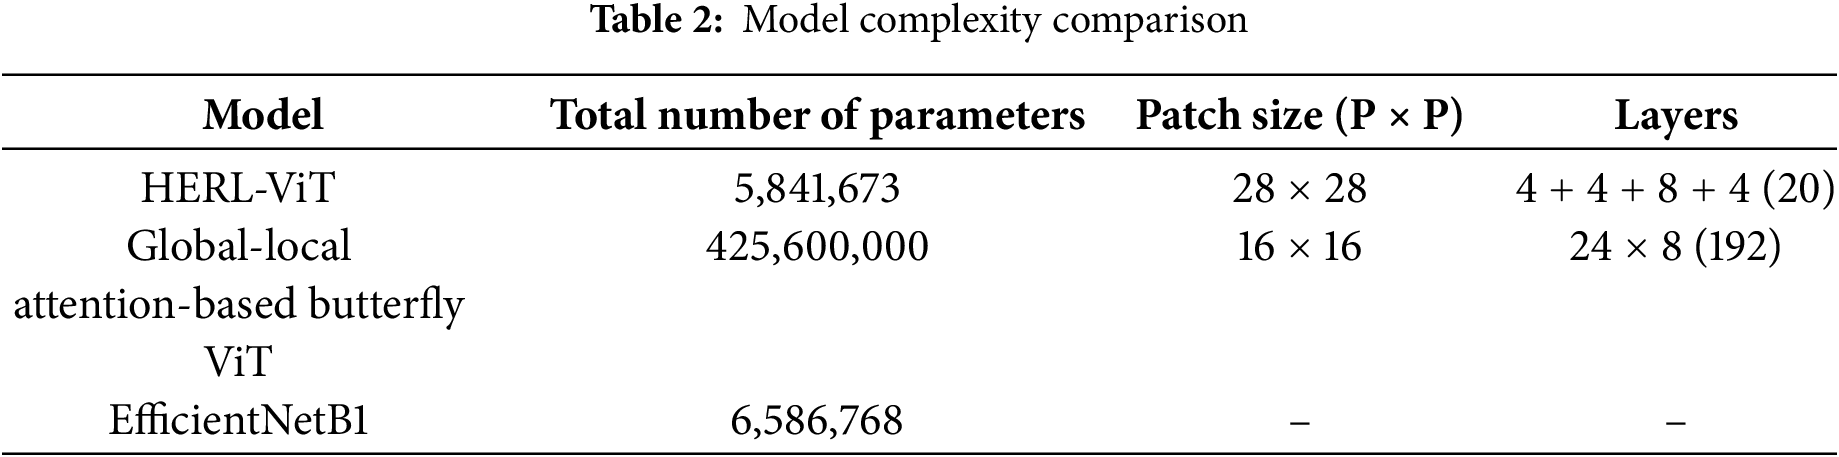
In order to evaluate the model performance more comprehensively, we compared the model complexity of existing methods that introduced the model structure or parameter counts in the existing work, as shown in Table 2. First, compared to the 16 × 16 of the Global-Local Attention-Based Butterfly ViT, the HERL-ViT adopts a larger patch size (28 × 28), which helps to reduce the sequence length and thus the computational complexity. Second, the encoder of Global-Local Attention-Based Butterfly ViT has 8 identical stages with 24 layers per stage, totaling 192 layers, while HERL-ViT adopts a hierarchical structural design of
5.3 Ablation Experiments for the HERL-ViT Model
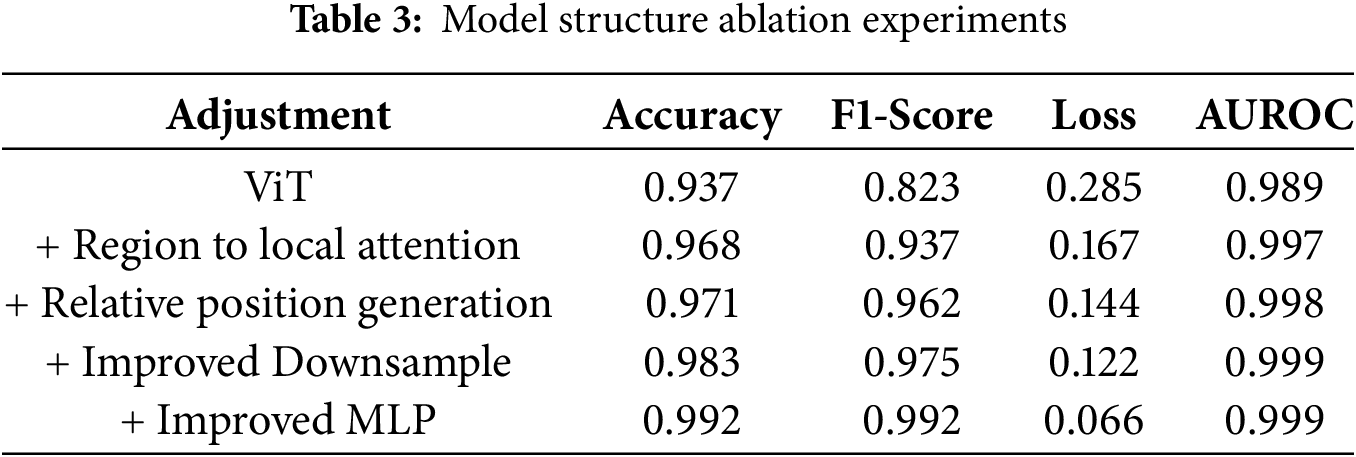
This section presents the ablation experiment regarding the model structure as depicted in Table 3. By progressively adding components and observing the variation of model performance, the ultimate performance is enhanced by 5.5% compared to the base model. This experiment commences with the base ViT model, which demonstrates a baseline performance of 0.937 in the malware detection task. Incorporate our proposed enhancements stepwise and assess the influence of each step on model performance. From the ablation experiments, it can be noted that the optimization scheme in this study has a favorable positive effect on the ViT model.
5.4 Comparison Experiments of Different Improved Versions of ViT Models
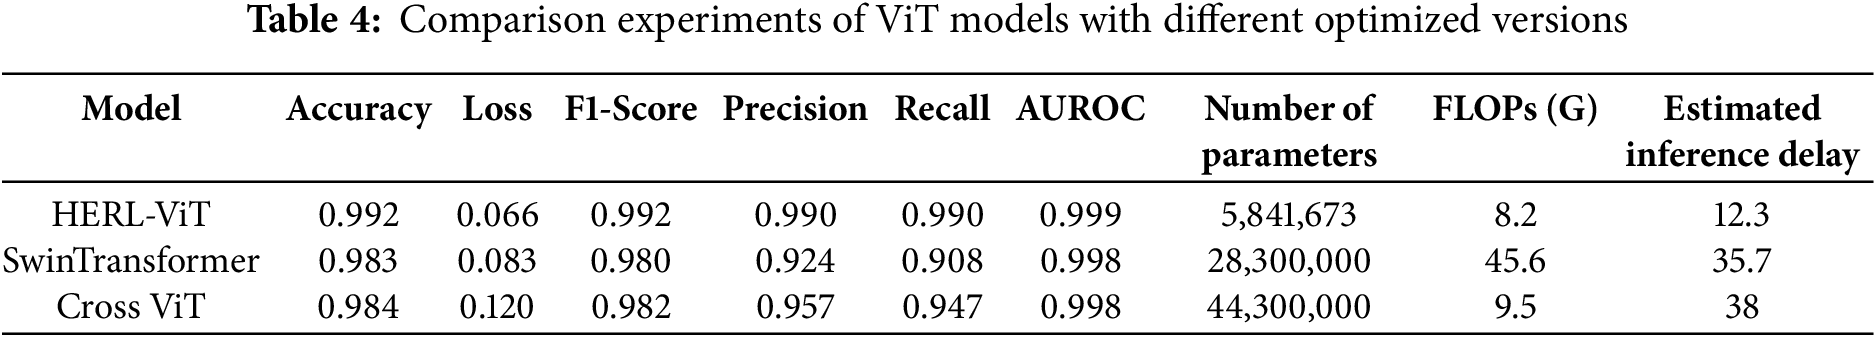
5.4.1 Performance Comparison Analysis
To verify the optimization effect, this section compares the performances of different optimized ViT models and Swin Transformer and Cross ViT (Table 4). The results show that HERL-ViT performs outstandingly overall: the accuracy is 0.992, significantly higher than 0.983 of Swin Transformer and 0.984 of Cross ViT; The training is stable and efficient, with a loss of 0.066 (lower than 0.083 and 0.12 of the two), an F1 value of 0.992, and better precision, recall rate and AUROC. Table 4 also shows that the parameters of HERL-ViT are only 20.6% of those of Swin Transformer, with a reduction of 82.0% in FLOPs. While maintaining a high accuracy of 99.2%, it significantly reduces the computational complexity and is more suitable for large-scale malware detection deployments.
5.4.2 Confusion Matrix Analysis
To specifically analyze the recognition performance of the model for each family, we have plotted the confusion matrix heatmaps of the HERL-ViT, SwinTransformer, and Cross ViT models as Fig. 9a–c, respectively. It presents the contrast between the predictions and actual situations of different families in the classification model, as well as the proportion of correct predictions for each category in the dataset. It can be seen from Fig. 9a that most families in HERL-ViT have achieved extremely high accuracy rates. Among them, the prediction accuracy rates of Kelihos_ver3, Vundo, Simda, and Kelihos_ver1 have all reached 100%. Even though the functions and structures of Tracur are similar to those of Lollipop and Obfuscator. ACY, there is only a 1.33% probability of being predicted as Lollipop and Obfuscator. ACY in the Tracur category. Under the premise of a severely imbalanced dataset, this result shows that our model can well resist the issue of data imbalance and has higher detection performance.
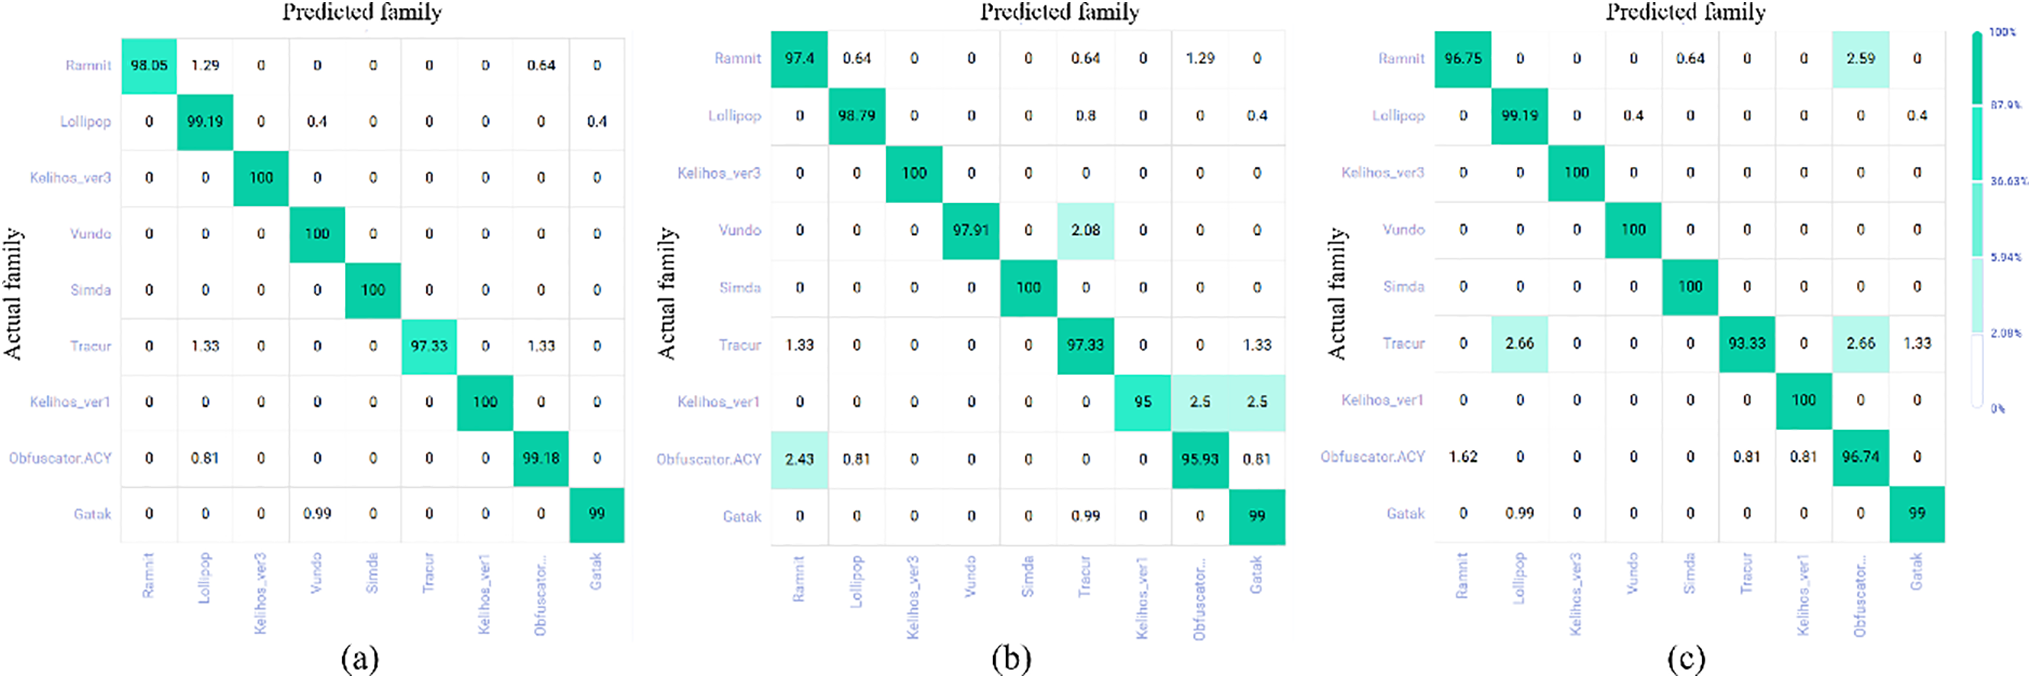
Figure 9: Confusion matrix heatmap
5.4.3 Training Process Analysis
Fig. 10 shows the training performance of ViT, HERL-ViT, Swin Transformer, and Cross ViT: The training of HERL-ViT is stable, the accuracy and F1 curves increase steadily, and the AUCROC shows that its classification ability continues to improve, finally near perfect. After optimization, HERL-ViT has excellent performance in convergence speed, stability, final error and classification effect. Fig. 11 shows the model validation performance curve: the accuracy of HERL-ViT fluctuates between 99%–100%, the loss converges quickly and is stable, F1 becomes stable after 80 rounds, and the precision, recall and AUROC are all optimal. Swin Transformer and Cross ViT converge slower.
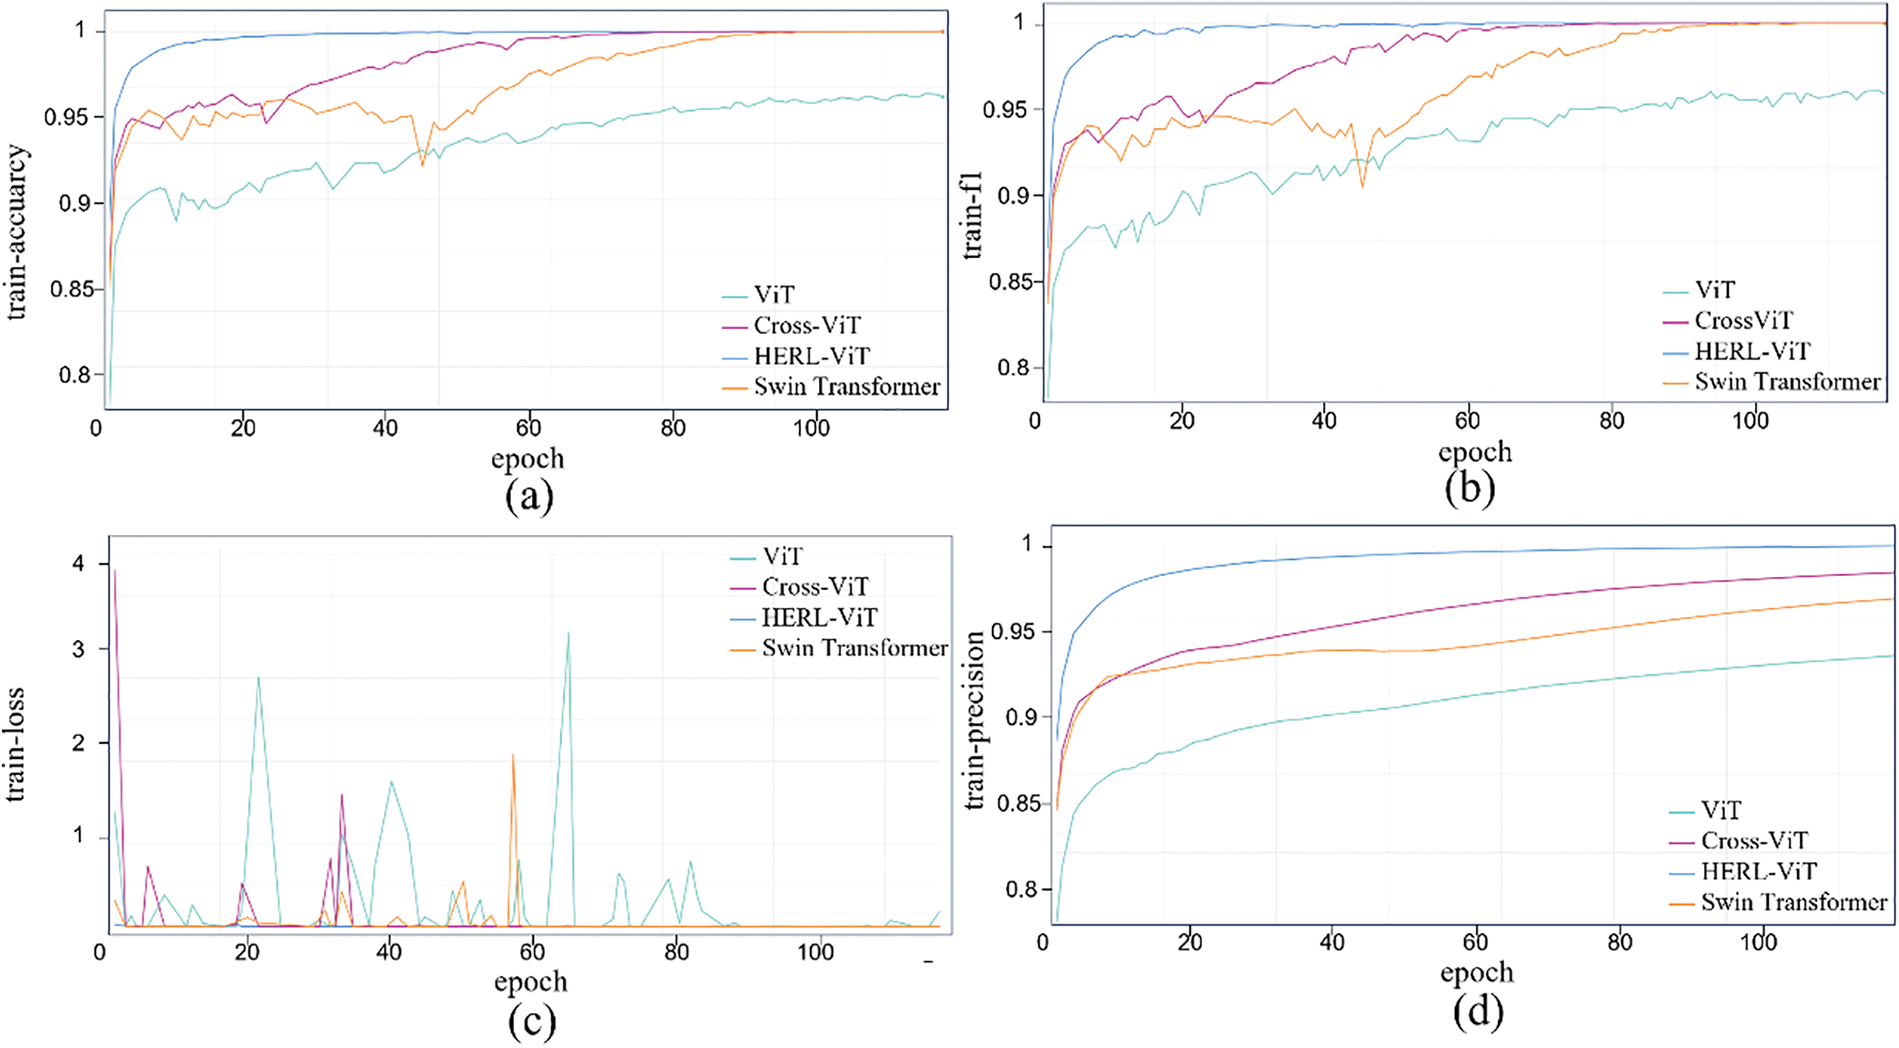
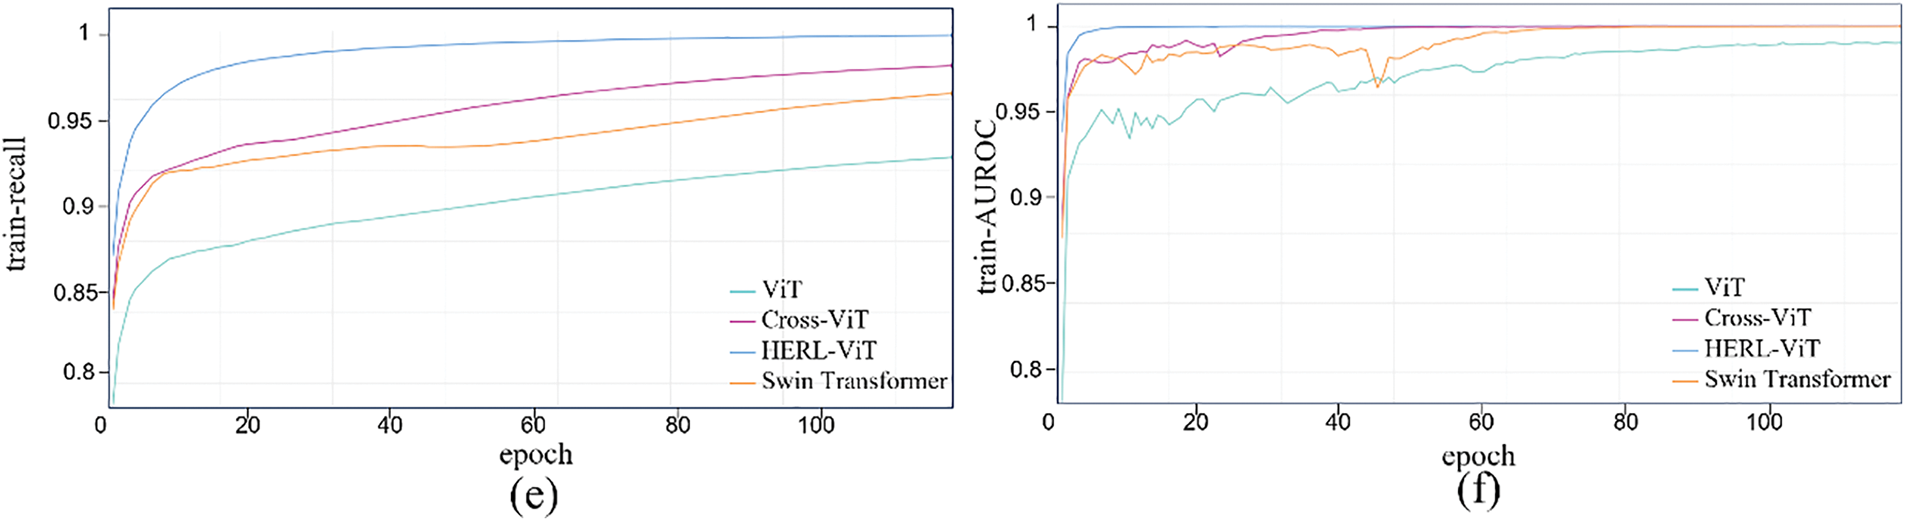
Figure 10: Performance change curves of different improved ViT versions of the model during training. (a) Training accuracy curve; (b) Training F1 curve; (c) Training loss curve; (d) Training precision curve; (e) Training recall curve; (f) Training AUPRC curve
Figure 11: The performance curves of different improved ViT version models during the validation process. (a) Validation accuracy curve; (b) Validation F1 curve; (c) Validation loss curve; (d) Validation precision curve; (e) Validation recall curve; (f) Validation AUROC curve
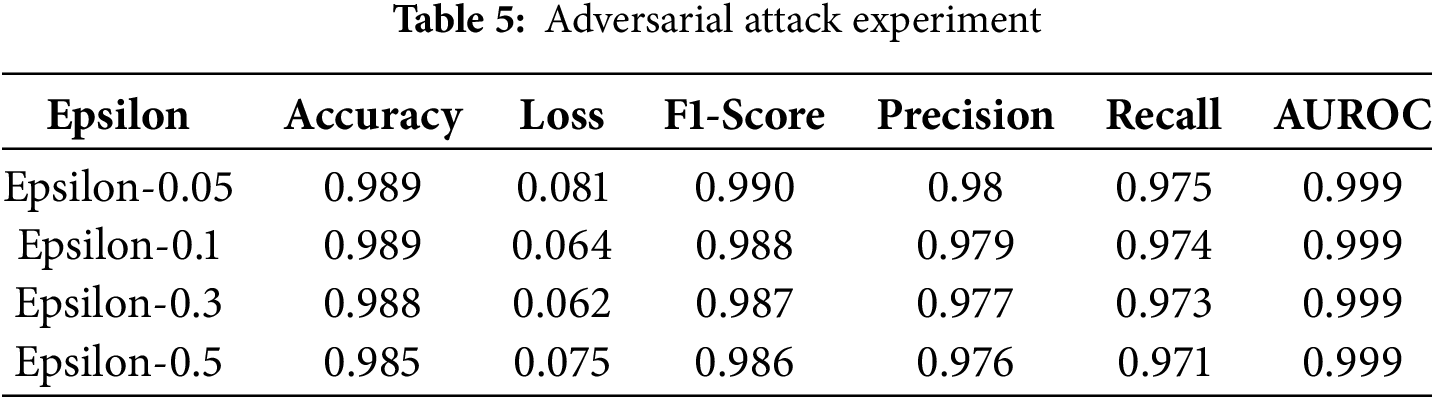
5.5 Adversarial Attack Experiment
5.5.1 Performance Analysis of Adversarial Experiments
To evaluate the detection effect in actual intrusion scenarios, we designed an adversarial attack experiment. Adversarial samples were generated by using the Fast Gradient Notation (FGSM) method, and the performance of the model in the face of minor disturbances was tested. In the experiment, we set the perturbation values epsilon of the generative adversarial samples to 0.05, 0.1, 0.3, and 0.5, respectively, and observed the performance changes of the model under these perturbations. As shown in Table 5, HERL-ViT still maintains an accuracy rate of 98.5% under the FGSM attack with
5.5.2 Confusion Matrix Analysis for Adversarial Experiments
To analyze the influence of each perturbation value on the prediction results of different malware families, a confusion matrix heatmap (Fig. 12) was drawn, with (a–d) corresponding to the perturbation values of 0.05, 0.1, 0.3, and 0.5, respectively. The model still maintains good predictive performance under large disturbances. For instance, the accuracy rate of the four types reaches 100% when the disturbance is 0.5, demonstrating its robustness and stability.
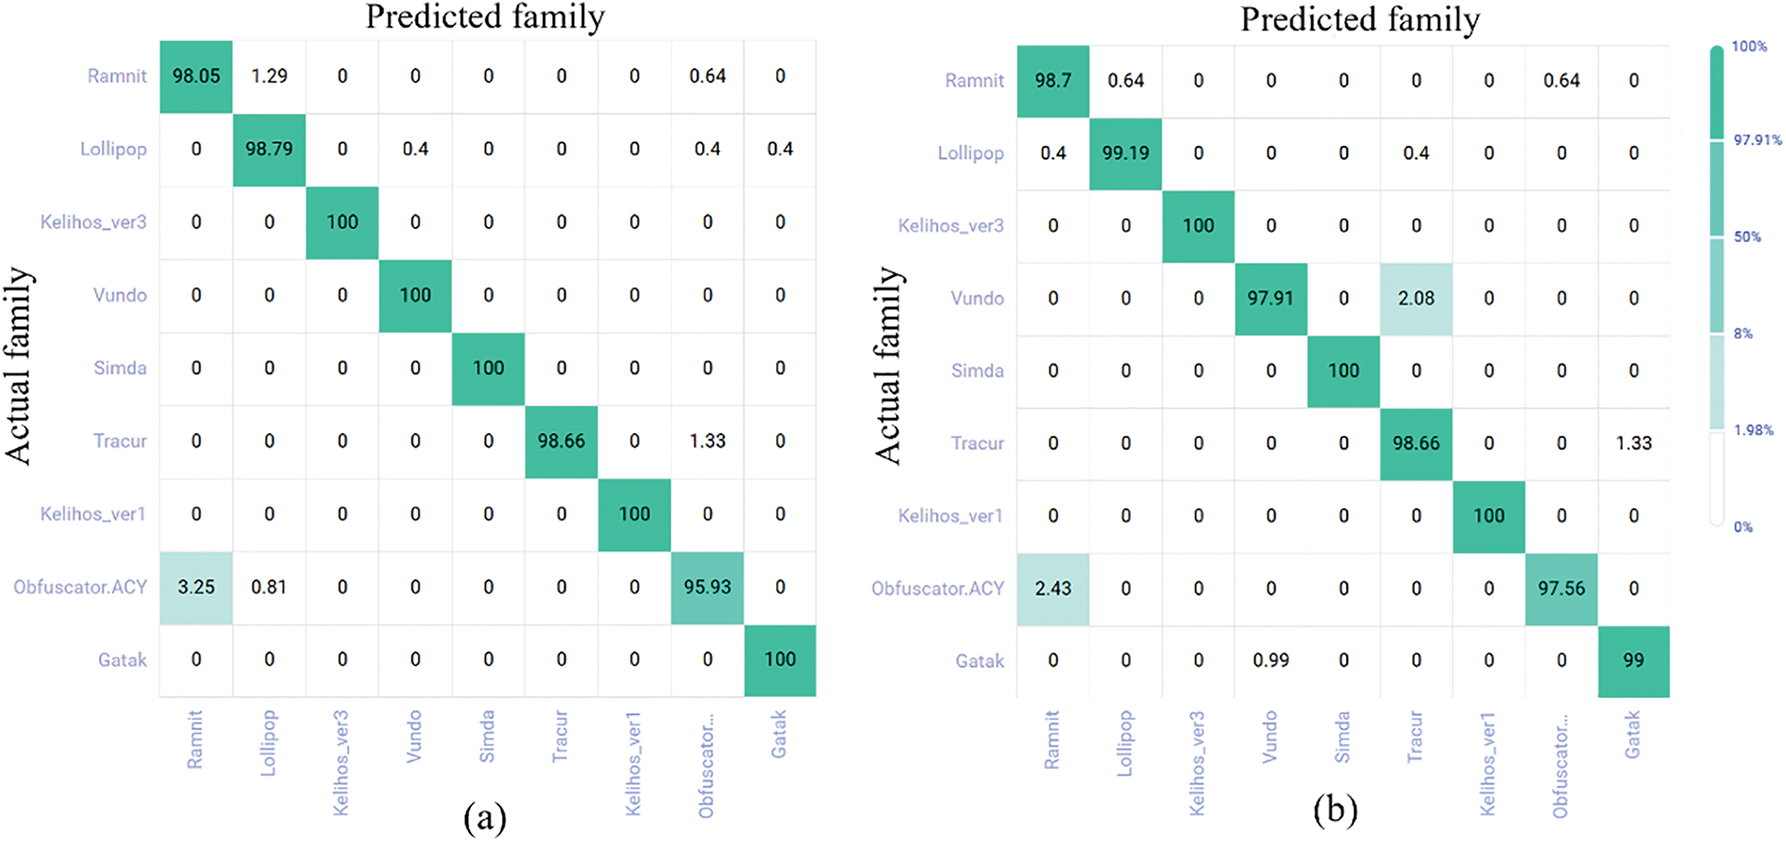
Figure 12: Confusion matrix for adversarial training. (a) Confusion matrix heatmap with perturbation value 0.05; (b) Confusion matrix heatmap with perturbation value 0.1; (c) Confusion matrix heatmap with perturbation value 0.3; (d) Confusion matrix heatmap with perturbation value 0.5
5.5.3 Analysis of Training Process of Adversarial Experiment
Fig. 13 shows training performance trends under varying perturbations, with accuracy, loss, precision, recall, AUROC vs. epoch. With more epochs, accuracy and F1 fluctuate upward, stabilizing near 1 after 80 rounds; losses converge fast to near zero; precision and recall rise steadily; AUROC reaches 0.999. Thus, higher perturbations minimally affect performance, demonstrating strong robustness. Fig. 14 shows validation performance (6 metrics): Accuracy and F1 stabilize after 100 rounds (98%–99% fluctuation), showing strong detection and anti-confusion ability. AUROC fluctuates more than in training but approaches 1. Larger epsilon (e.g., 0.5) may cause higher initial errors and losses, but the model adapts, stabilizing performance. Precision and recall vary little across perturbations; even with epsilon = 0.5, performance drops slightly but stays high. This confirms HERL-ViT’s strong robustness in adversarial environments, effectively resisting external perturbations to maintain stable output—vital for practical stability and reliability.
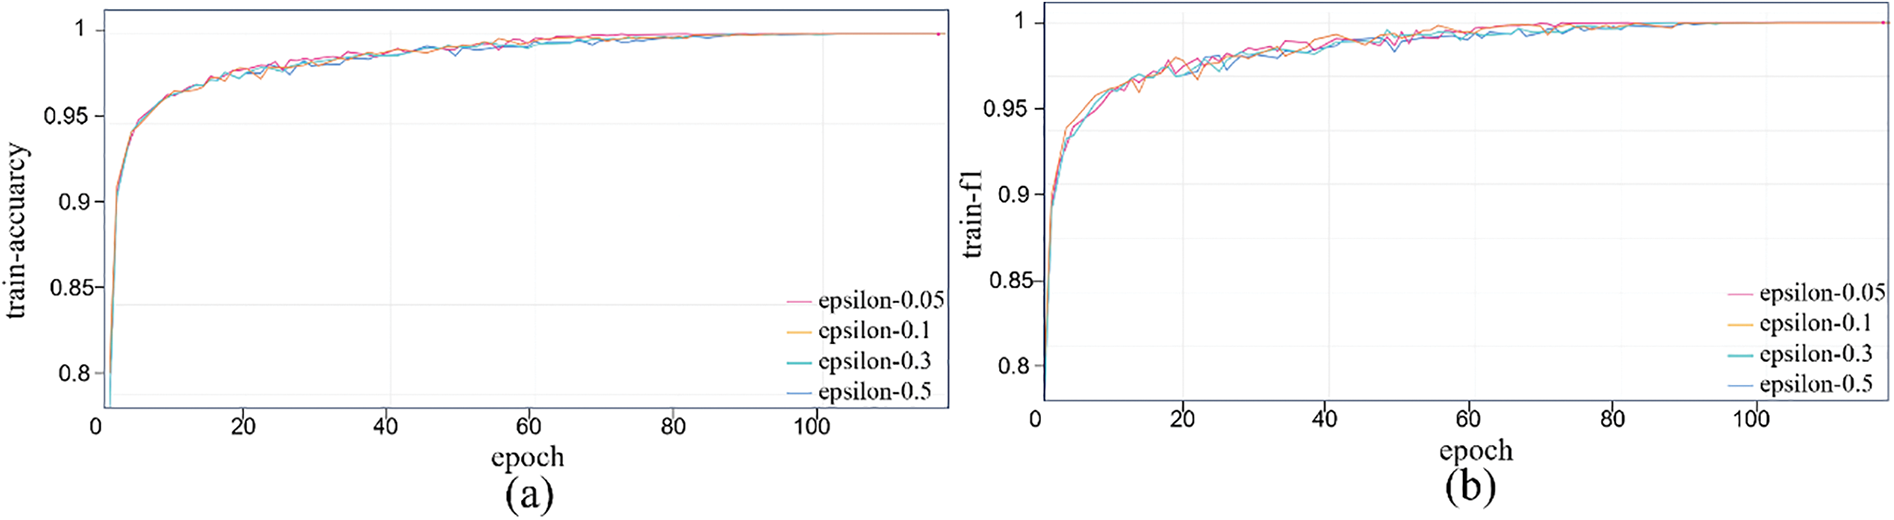
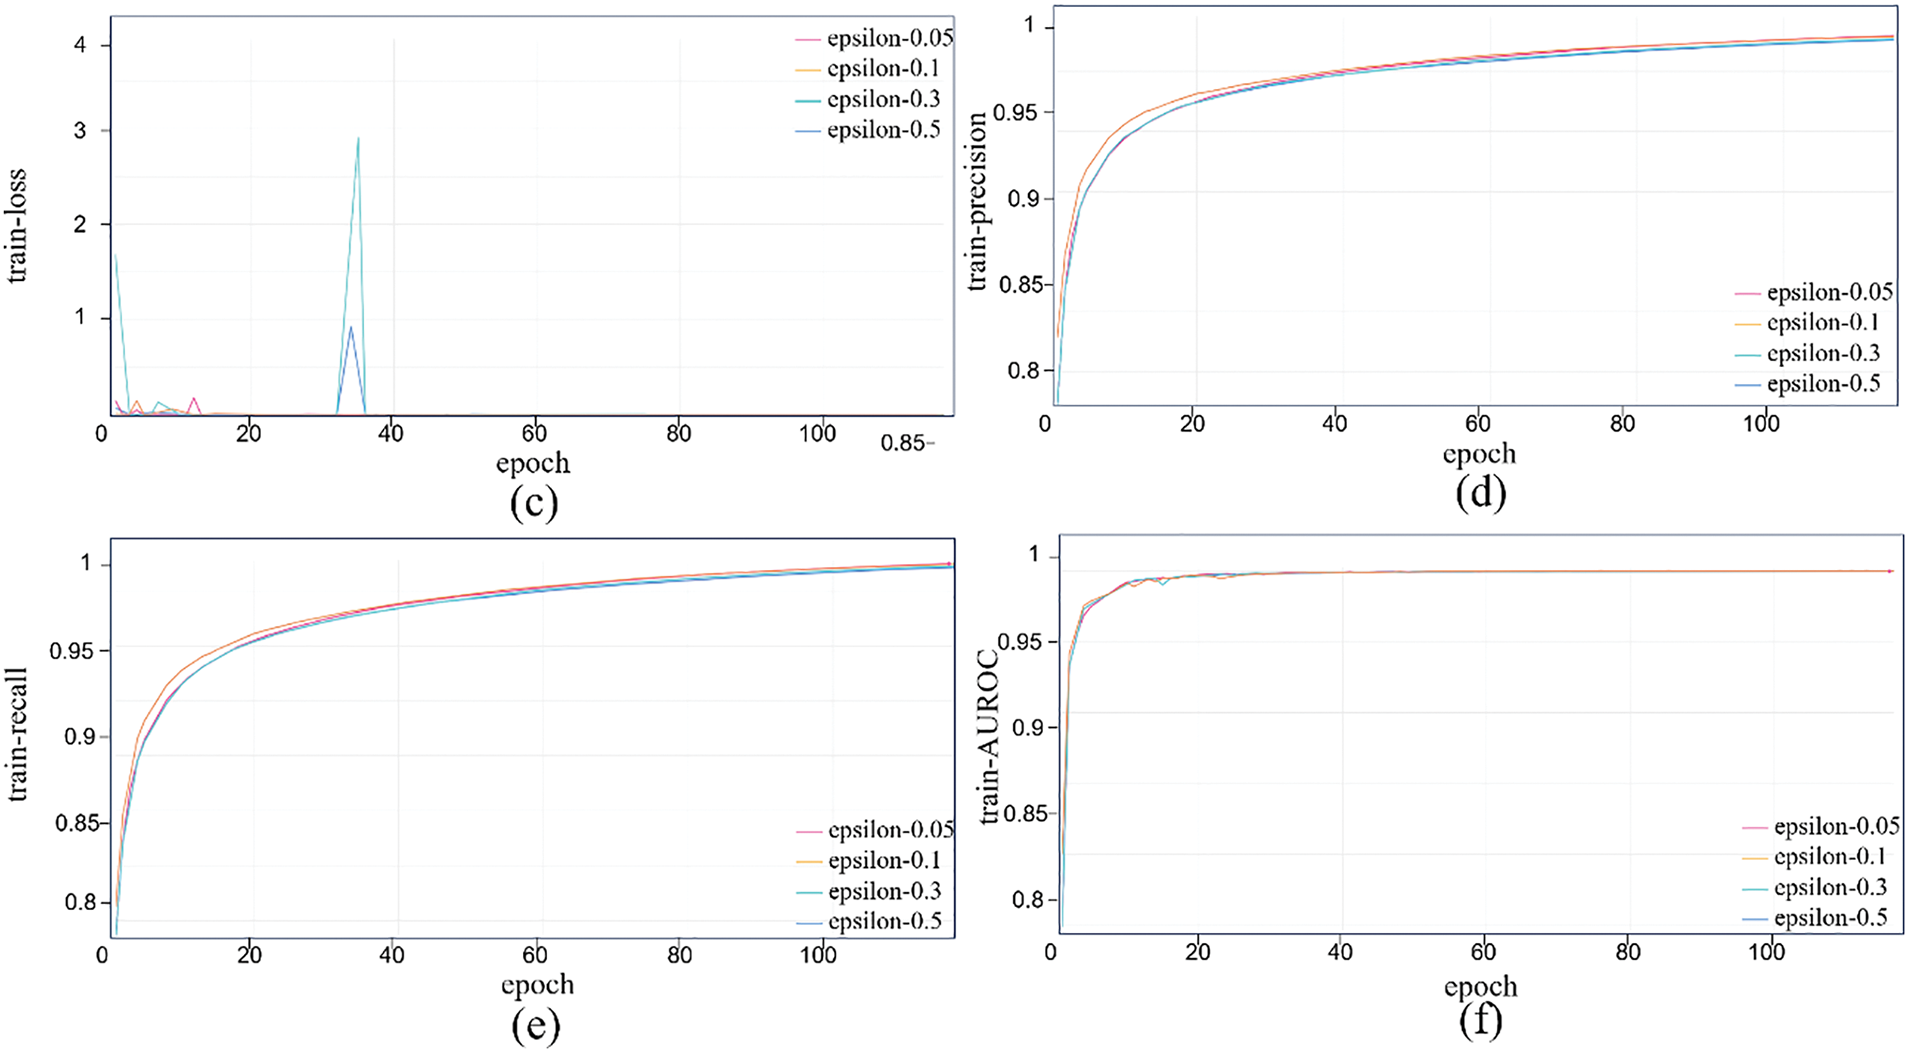
Figure 13: Performance change curve of adversarial attack experiment during training. (a) Training accuracy curve under different epsilon values; (b) Training F1 curve under different epsilon values; (c) Training loss curve under different epsilon values; (d) Training precision curve under different epsilon values; (e) Training recall curve under different epsilon values; (f) Training AUROC curve under different epsilon values
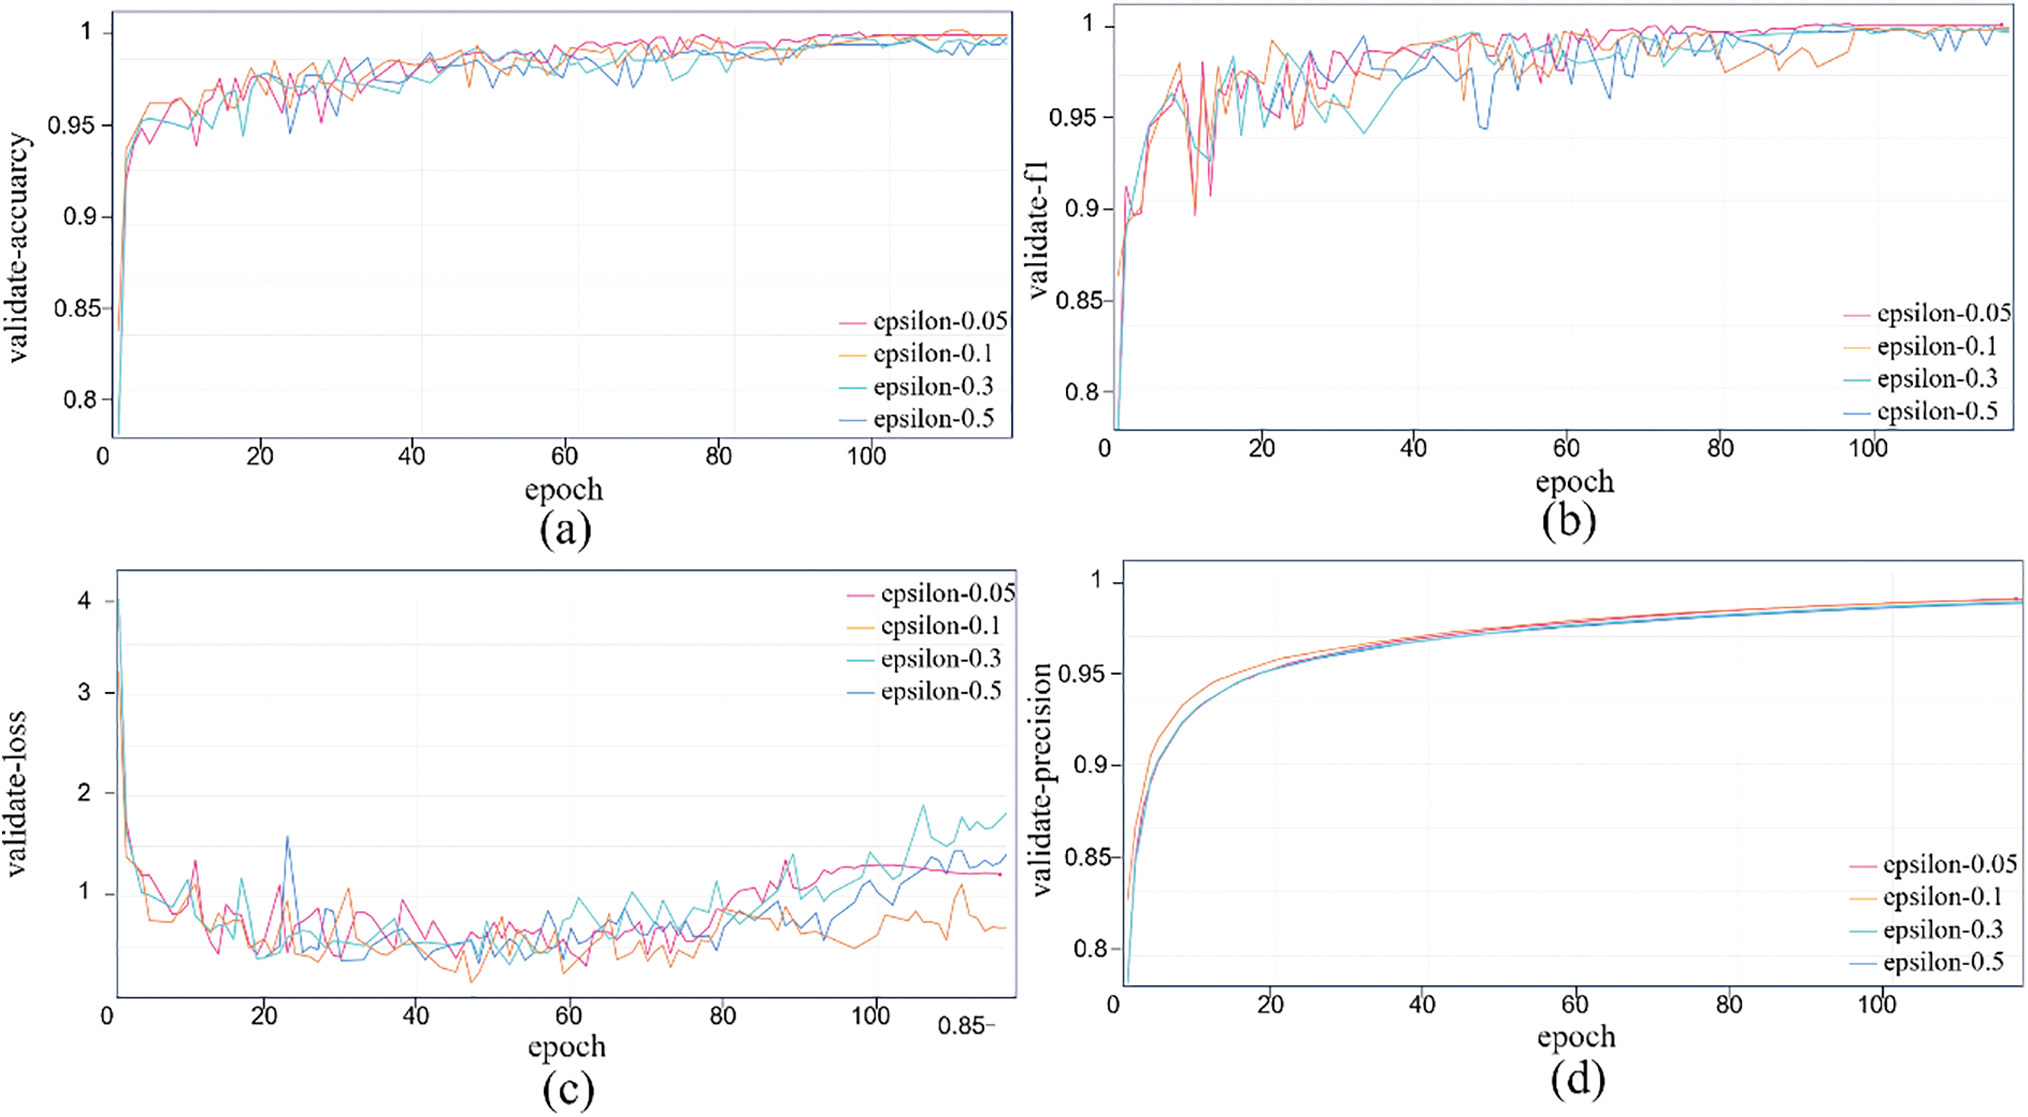
Figure 14: Performance change curve of the adversarial attack experiment during the verification process. (a) Validation accuracy curve under different epsilon values; (b) Validation F1 curve under different epsilon values; (c) Validation loss curve under different epsilon values; (d) Validation precision curve under different epsilon values; (e) Validation recall curve under different epsilon values; (f) Validation AUROC curve under different epsilon values
To overcome limitations of traditional models in malware detection and classification, this study proposes HERL-ViT, an enhanced Vision Transformer network incorporating multifaceted improvements. First, a multilevel pyramid structure analogous to CNNs is integrated to extract multiscale features from high-dimensional raw data. Different from the fixed window attention of Swin Transformer and the global attention of ViT, HERL-ViT adopts a dual-path design of “capturing the global structure with regional tokens + extracting fine-grained features with local tokens”. While reducing the computational complexity, the feature resolution ability was enhanced. Second, the conventional absolute position encoding is replaced with dynamically generated relative position encoding, realized through a novel Optimized Position Encoding Generator. This enhancement enables faster and semantically richer feature capture from fine to coarse granularity. Additionally, an augmented MLP network and a redesigned downsampling structure are introduced, significantly boosting computational and storage efficiency without compromising detection accuracy. Evaluation on the Microsoft 2015 dataset demonstrates HERL-ViT’s superior performance. Compared to the baseline ViT, HERL-ViT achieves 99.2% accuracy in malware multiclass classification, representing improvements of 5.5% in accuracy and 16.9% in F1 score. The model also exhibits strong robustness, attaining 98.5% detection performance on adversarial samples. To further bolster resilience against adversarial attacks, FGSM techniques were employed to rapidly generate adversarial samples used for model training. By constraining the parameter size to 23.25 M, the study effectively balances model complexity and performance, enhancing portability and easing deployment on resource-constrained devices. Moreover, The scalability of HERL ViT is reflected in: (1) the multi-stage pyramid structure can directly adapt to malware images with larger resolution, without the need to reconstruct the model; (2) The region local attention mechanism is universal for cross platform malware, because texture features are consistent in binary visualization; (3) Combined with MobileViT’s deeply separable convolution, it can be further lightweight to adapt to edge devices.
Although this research has achieved remarkable results in the field of malware detection, there are still some directions that are worth further exploration and improvement. This model is based on the static image representation of malware, mainly capturing static structural features. It fails to directly handle dynamic payloads or advanced obfuscation techniques. In the future, it is planned to integrate dynamic features. Build a static-dynamic multimodal fusion model to enhance the detection capability of complex malware. This paper has not yet tested more complex evasion techniques. In the future, experiments on attack methods such as PGD and C&W will be supplemented, and adversarial training will be combined to further enhance robustness.
Acknowledgement: Not applicable.
Funding Statement: This study was funded by the Special Project of Langfang Key Research and Development under Grant No. 2023011005B and the Technology Innovation Platform Construction Project of North China Institute of Aerospace Engineering under Grant No. CXPT-2023-02.
Author Contributions: Boyan Cui participated in the conceptual design of the study, drafting and revising the manuscript. Huijuan Wang conducted in-depth data analysis and interpretation and served as the corresponding author. Yongjun Qi participated in the design of the study, provided methodological advice, assisted in data analysis and interpretation, and revised the key manuscript. Hongce Chen assisted in data collection and pre-processing, and provided feedback on the manuscript. Quanbo Yuan contributed to the conceptualization and participated in the result interpretation discussion. Dongran Liu assisted in collecting the data, collating the dataset, and supporting the discussion of data analysis. Xuehua Zhou participated in the literature review, formulated the research questions, and provided structural feedback. All authors reviewed the results and approved the final version of the manuscript.
Availability of Data and Materials: The data that support the findings of this study are available from the corresponding author, Huijuan Wang, upon reasonable request.
Ethics Approval: Not applicable.
Conflicts of Interest: The authors declare no conflicts of interest to report regarding the present study.
References
1. Nataraj L, Yegneswaran V, Porras P, Zhang J. A comparative assessment of malware classification using binary texture analysis and dynamic analysis. In: Proceedings of the 4th ACM Workshop on Security and Artificial Intelligence; 2011 Oct 21; Chicago, IL, USA. p. 21–30. doi:10.1145/2046684.2046689. [Google Scholar] [CrossRef]
2. Ren Z, Chen G, Lu W. Malware visualization methods based on deep convolution neural networks. Multimed Tools Appl. 2020;79(15):10975–93. doi:10.1007/s11042-019-08310-9. [Google Scholar] [CrossRef]
3. Bhodia N, Prajapati P, Di Troia F, Stamp M. Transfer learning for image-based malware classification. arXiv:1903.11551. 2019. [Google Scholar]
4. Cui Z, Du L, Wang P, Cai X, Zhang W. Malicious code detection based on CNNs and multi-objective algorithm. J Parallel Distrib Comput. 2019;129(5):50–8. doi:10.1016/j.jpdc.2019.03.010. [Google Scholar] [CrossRef]
5. Vasan D, Alazab M, Wassan S, Naeem H, Safaei B, Zheng Q. IMCFN: image-based malware classification using fine-tuned convolutional neural network architecture. Comput Netw. 2020;171(1):107138. doi:10.1016/j.comnet.2020.107138. [Google Scholar] [CrossRef]
6. Falana OJ, Sodiya AS, Onashoga SA, Badmus BS. Mal-Detect: an intelligent visualization approach for malware detection. J King Saud Univ Comput Inf Sci. 2022;34(5):1968–83. doi:10.1016/j.jksuci.2022.02.026. [Google Scholar] [CrossRef]
7. Chai Y, Du L, Qiu J, Yin L, Tian Z. Dynamic prototype network based on sample adaptation for few-shot malware detection. IEEE Trans Knowl Data Eng. 2023;35(5):4754–66. doi:10.1109/TKDE.2022.3142820. [Google Scholar] [CrossRef]
8. Rodriguez-Bazan H, Sidorov G, Escamilla-Ambrosio PJ. Android malware classification based on fuzzy hashing visualization. Mach Learn Knowl Extr. 2023;5(4):1826–47. doi:10.3390/make5040088. [Google Scholar] [CrossRef]
9. Rahman MM, Ahmed A, Khan MH, Mahin MRH, Kibria FB, Karim DZ, et al. CNN vs. transformer variants: malware classification using binary malware images. In: 2023 IEEE International Conference on Communication, Networks and Satellite (COMNETSAT); 2023 Nov 23–25; Malang, Indonesia. p. 308–15. doi:10.1109/COMNETSAT59769.2023.10420585. [Google Scholar] [CrossRef]
10. Chaganti R, Ravi V, Pham TD. Image-based malware representation approach with EfficientNet convolutional neural networks for effective malware classification. J Inf Secur Appl. 2022;69(7):103306. doi:10.1016/j.jisa.2022.103306. [Google Scholar] [CrossRef]
11. Li H, Wu J, Gu F. pH-CNN for PE malware classification by means of enhanced images. In: 2024 10th International Symposium on System Security, Safety, and Reliability (ISSSR); 2024 Mar 16–17; Xiamen, China. p. 104–9. doi:10.1109/ISSSR61934.2024.00019. [Google Scholar] [CrossRef]
12. Katar O, Yıldırım Ö. Classification of malware images using fine-tunned ViT. Sakarya Univ J Comput Inf Sci. 2024;7(1):22–35. doi:10.35377/saucis.1341082. [Google Scholar] [CrossRef]
13. Shen G, Chen Z, Wang H, Chen H, Wang S. Feature fusion-based malicious code detection with dual attention mechanism and BiLSTM. Comput Secur. 2022;119(7):102761. doi:10.1016/j.cose.2022.102761. [Google Scholar] [CrossRef]
14. Fang L, Wei Q, Wu ZH, Du J, Zhang XM. Neural network-based binary function similarity detection. Comput Sci. 2021;48(10):286–93. (In Chinese). doi:10.11896/jsjkx.200900185. [Google Scholar] [CrossRef]
15. Liu K, Fang Y, Zhang L, Zuo Z, Liu L. Malicious code clustering based on graph convolutional networks. J Sichuan Univ. 2019;56(4):654–60. [Google Scholar]
16. Seneviratne S, Shariffdeen R, Rasnayaka S, Kasthuriarachchi N. Self-supervised vision transformers for malware detection. IEEE Access. 2022;10:103121–35. doi:10.1109/ACCESS.2022.3206445. [Google Scholar] [CrossRef]
17. Kim JY, Cho SB. Obfuscated malware detection using deep generative model based on global/local features. Comput Secur. 2022;112(8):102501. doi:10.1016/j.cose.2021.102501. [Google Scholar] [CrossRef]
18. Jo J, Cho J, Moon J. A malware detection and extraction method for the related information using the ViT attention mechanism on Android operating system. Appl Sci. 2023;13(11):6839. doi:10.3390/app13116839. [Google Scholar] [CrossRef]
19. Lyu C, Yao Y, Guo X, Huang Z, Dong C, Zhang Y, et al. AntiMal: an approach of malware detection employing swin transformer. In: Proceedings of the 2023 13th International Conference on Communication and Network Security; 2023 Dec 6–8; Fuzhou China. doi:10.1145/3638782.3638783. [Google Scholar] [CrossRef]
20. Belal MM, Sundaram DM. Global-local attention-based butterfly vision transformer for visualization-based malware classification. IEEE Access. 2023;11:69337–55. doi:10.1109/ACCESS.2023.3293530. [Google Scholar] [CrossRef]
21. Yang D, Ding Y, Zhang H, Li Y. PVitNet: an effective approach for Android malware detection using pyramid feature processing and vision transformer. In: ICASSP 2024—2024 IEEE International Conference on Acoustics, Speech and Signal Processing (ICASSP); 2024 Apr 14–19; Seoul, Republic of Korea. p. 2440–4. doi:10.1109/ICASSP48485.2024.10446595. [Google Scholar] [CrossRef]
22. Szegedy C, Zaremba W, Sutskever I, Bruna J, Erhan D, Goodfellow I, et al. Intriguing properties of neural networks. arXiv:1312.6199. 2013. [Google Scholar]
23. Goodfellow IJ, Shlens J, Szegedy C. Explaining and harnessing adversarial examples. arXiv:1412.6572. 2014. [Google Scholar]
24. Carlini N, Wagner D. Towards evaluating the robustness of neural networks. In: 2017 IEEE Symposium on Security and Privacy (SP); 2017 May 22–26; San Jose, CA, USA. p. 39–57. doi:10.1109/sp.2017.49. [Google Scholar] [CrossRef]
25. Moosavi-Dezfooli SM, Fawzi A, Frossard P. DeepFool: a simple and accurate method to fool deep neural networks. In: Proceedings of the 2016 IEEE Conference on Computer Vision and Pattern Recognition (CVPR); 2016 Jun 27–30; Las Vegas, NV, USA. p. 2574–82. doi:10.1109/CVPR.2016.282. [Google Scholar] [CrossRef]
26. Liu X, Zhang J, Lin Y, Li H. ATMPA: attacking machine learning-based malware visualization detection methods via adversarial examples. In: Proceedings of the International Symposium on Quality of Service; 2019 Jun 24–25; Phoenix, AZ, USA. doi:10.1145/3326285.3329073. [Google Scholar] [CrossRef]
27. Wang C, Zhang L, Zhao K, Ding X, Wang X. AdvAndMal: adversarial training for Android malware detection and family classification. Symmetry. 2021;13(6):1081. doi:10.3390/sym13061081. [Google Scholar] [CrossRef]
28. Grosse K, Papernot N, Manoharan P, Backes M, McDaniel P. Adversarial perturbations against deep neural networks for malware classification. arXiv:1606.04435. 2016. [Google Scholar]
29. Qiao Y, Zhang W, Tian Z, Yang LT, Liu Y, Alazab M. Adversarial ELF malware detection method using model interpretation. IEEE Trans Ind Inf. 2023;19(1):605–15. doi:10.1109/tii.2022.3192901. [Google Scholar] [CrossRef]
30. Gao C, Huang G, Li H, Wu B, Wu Y, Yuan W. A comprehensive study of learning-based Android malware detectors under challenging environments. In: Proceedings of the IEEE/ACM 46th International Conference on Software Engineering; 2024 Apr 14–20; Lisbon, Portugal. p. 1–13. doi:10.1145/3597503.3623320. [Google Scholar] [CrossRef]
31. Park KW, Cho SB. A vision transformer enhanced with patch encoding for malware classification. In: Intelligent Data Engineering and Automated Learning—IDEAL 2022; 2022 Nov 24–26; Manchester, UK. Cham, Switzerland: Springer International Publishing. p. 289–99. doi:10.1007/978-3-031-21753-1_29. [Google Scholar] [CrossRef]
32. Darem A, Abawajy J, Makkar A, Alhashmi A, Alanazi S. Visualization and deep-learning-based malware variant detection using OpCode-level features. Future Gener Comput Syst. 2021;125:314–23. doi:10.1016/j.future.2021.06.032. [Google Scholar] [CrossRef]
33. Li L, Kong Y, Zhang Q. Lightweight malicious code classification method based on improved SqueezeNet. Comput Mater Contin. 2024;78(1):551–67. doi:10.32604/cmc.2023.045512. [Google Scholar] [CrossRef]
34. Zou B, Cao C, Tao F, Wang L. IMCLNet: a lightweight deep neural network for Image-based malware classification. J Inf Secur Appl. 2022;70(10):103313. doi:10.1016/j.jisa.2022.103313. [Google Scholar] [CrossRef]
35. Farfoura ME, Mashal I, Alkhatib A, Batyha RM. A lightweight machine learning methods for malware classification. Clust Comput. 2024;28(1):1. doi:10.1007/s10586-024-04755-2. [Google Scholar] [CrossRef]
Cite This Article
 Copyright © 2025 The Author(s). Published by Tech Science Press.
This work is licensed under a Creative Commons Attribution 4.0 International License , which permits unrestricted use, distribution, and reproduction in any medium, provided the original work is properly cited.
 Downloads
 Citation Tools