
 Submit a Paper
 Propose a Special lssue
 Open Access
ARTICLE

Machine Learning Prediction of Density for Binary Mg-Containing Phases
1 Lanxi Magnesium Materials Research Institute, Lanxi, 321100, China
2 School of Metallurgy and Power Engineering, Chongqing University of Science and Technology, Chongqing, 401331, China
3 College of Materials Science and Engineering, Chongqing University of Technology, Chongqing, 400054, China
4 National Engineering Research Center for Magnesium Alloys, Chongqing University, Chongqing, 400044, China
* Corresponding Authors: Xiaoxi Mi. Email: ; Shibo Zhou. Email:
(This article belongs to the Special Issue: Machine Learning-Assisted Light Alloy Design)
Computers, Materials & Continua 2025, 85(3), 4571-4586. https://doi.org/10.32604/cmc.2025.070649
Received 21 July 2025; Accepted 12 September 2025; Issue published 23 October 2025
 View Full Text
 Download PDF
Abstract
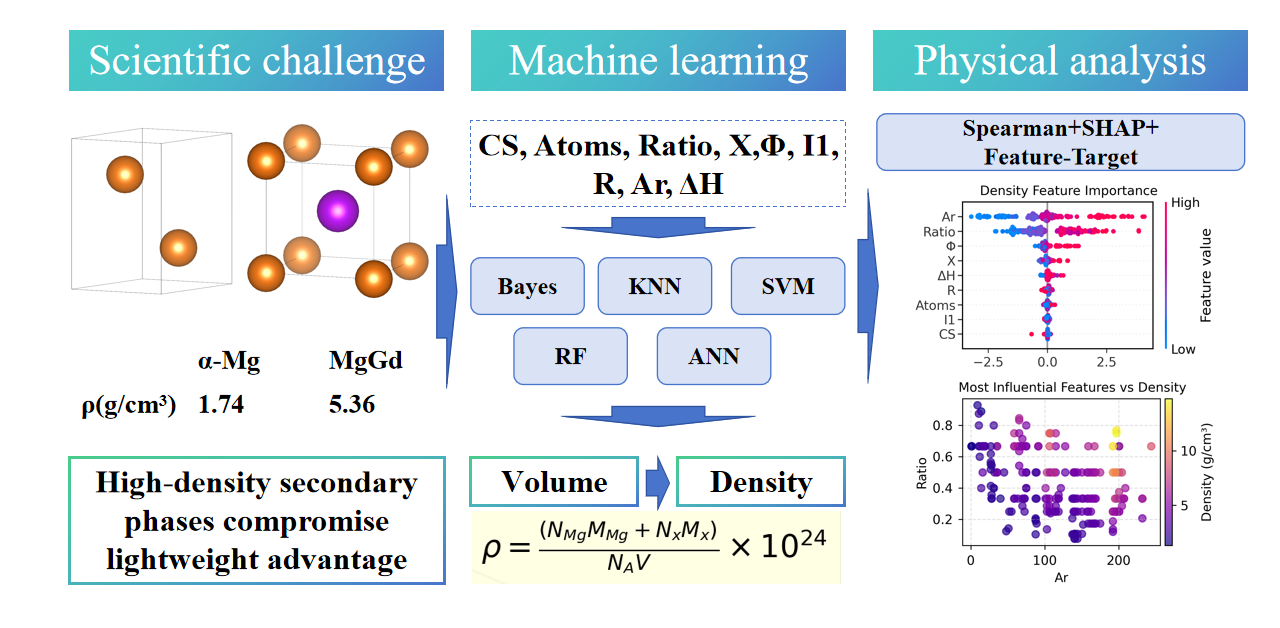
Magnesium (Mg) alloys face a critical challenge in balancing performance optimization and unintended density increases caused by high-density secondary phases. To address this, machine learning was employed to predict the density and volume of Mg-containing binary phases, aiming to guide lightweight alloy design. Using 211 experimentally observed data points, five machine learning (ML) algorithms—Random Forest (RF), Support Vector Machine (SVM), Artificial Neural Network (ANN), K-Nearest Neighbors (KNN), and Bayesian Ridge (Bayes)—were trained and tested. Quantitative results showed that RF achieved exceptional performance in volume prediction, with a testing coefficient of determination (R²) exceeding 0.96 and a mean absolute error (MAE) of 41.0 Å3, while SVM outperformed others in density prediction with a testing R2 of 0.885 and MAE of 0.421 g/cm3. Feature importance analysis revealed that atomic count is the primary determinant of phase volume, whereas density prediction depends on the synergistic interaction of relative atomic mass and stoichiometric ratio, as further validated by SHapley Additive exPlanations (SHAP) analysis. This work establishes a physics-informed predictive model that accelerates the development of lightweight Mg alloys by mitigating high-density secondary phases, and can be extended to other alloy systems.Graphic Abstract
Keywords
Supplementary Material
Supplementary Material FileMagnesium (Mg) alloys have emerged as promising lightweight materials for modern engineering applications, particularly in the automotive, aerospace, and biomedical industries [1,2]. Their low density (1.74 g/cm3), high specific strength, and biocompatibility make them as ideal candidates for replacing heavier structural metals such as steel and aluminum [3–5]. Alloying is one of the most fundamental and crucial methods for enhancing the mechanical and corrosion properties of Mg alloys [6,7]. For instance, a balance between ultimate tensile strength (425 MPa) and fracture elongation (3.4%) is achieved in Mg-23Gd-2Zn-0.4Zr alloy [8]. Rare earth (RE) elements enhance the mechanical properties of Mg alloys effectively, while non-RE systems offer cost advantages [9]. Mg-Zn-Ca alloys exhibit temperature-dependent slip activation, enabling high-temperature formability [10]. Additionally, the corrosion rate of Mg-8.1 wt% Er alloy with an oxide film is only 0.12 mm/y in 3.5 wt% NaCl solution, even lower than that of high-purity Mg [11]. However, these advancements introduce a critical yet overlooked challenge: the formation of high density secondary phases [3,12]. Intermetallic compounds like MgGd (~5.36 g/cm3) and MgEr (~5.98 g/cm3) often exhibit densities much higher than that of pure Mg, weakening the lightweight advantage. Consequently, optimizing mechanical performance while minimizing density penalties from secondary phases remains an unresolved priority.
Despite the critical role of secondary phases in determining alloy density, systematic studies on their density variations are scarce. Traditional experimental methods, such as Archimedes’ principle and pycnometry, require lots of bulk samples. This makes them too slow for quickly testing new material compositions [13]. Computational approaches like density functional theory (DFT) offer atomic-scale insights but face efficiency limitations. For example, Mao et al. [14] calculated the density of MgCu2, Mg2Ca and MgZn2. Such calculations derive secondary phase density from lattice parameters and other structural descriptors, demanding significant computational resources [15].
Compared to traditional empirical modeling approaches, machine learning (ML) offers distinct advantages in alloy development, including accelerated compositional screening, multi-scale data integration, nonlinear relationship modeling, multi-objective optimization capabilities, and interpretable design rule extraction [16,17]. For instance, ML models accurately predict magnetic behavior vs. Al content/temperature in high-entropy alloys, reducing experimental time, cost, and energy [18]. In Mg-Al alloys, ML deciphers microstructural drivers of strength-ductility synergy, achieving <9% prediction errors under optimized processing parameters [19]. Multi-model screening enables inverse design of Mg alloys with <10% property prediction errors by correlating 28 compositional/processing features [20]. Zhang et al. [21] established models linking texture characteristics to tensile properties in AZ31 Mg alloys using artificial neural networks. Hou et al. [22] utilized ensemble ML to predict mechanical properties of biomedical Mg alloys. Mi et al. [23] proposed an ultra-fine grain design strategy for Mg-Mn-based alloys using ML methods. Cheng et al. [24] reviewed ML applications in Mg alloy research spanning composition design, coating development, Mg matrix composite design, grain size forecasting, and alloy performance evaluation.
Despite its potential, ML has rarely been used to predict density of secondary phases. Prior studies have predominantly focused on predicting mechanical properties or phase stability [25,26], overlooking secondary phase [24] and density—a critical parameter for lightweight design. This limitation arises from two challenges: first, the scarcity of curated datasets linking composition/structure to density; and second, the multidimensional nature of density, which depends on both intrinsic atomic properties and extrinsic structural features. Addressing these challenges requires a systematic, ML-driven approach to decode the composition-structure-property relationships governing secondary phase density.
Therefore, unlike prior ML studies focused on mechanical properties, phase classification, or other properties, this work specifically addresses the density of secondary phases—a decisive yet neglected factor in lightweight alloy design. This work aims to develop a ML-based predictive framework for the density of Mg-based binary secondary phases, enabling rational design of lightweight alloys by quantifying the relationship between composition, structure, and density.
The predictive capabilities of five common ML algorithms [27–29]—Bayesian Ridge (Bayes), K-Nearest Neighbors (KNN), Support Vector Machine (SVM), Random Forest (RF), and Artificial Neural Network (ANN) were evaluated in this work-across distinct material property: density. RF and SVM are chosen for their robustness in handling nonlinear relationships; ANN for capturing complex feature interactions; KNN as a simple baseline; and Bayesian Ridge for probabilistic interpretation. These models cover diverse algorithmic principles, ensuring comprehensive performance comparison. All regression models were implemented via Scikit-learn [30] (https://scikit-learn.org/stable/ (accessed on 01 September 2025)) using 211 compiled data points from Materials Project database to establish structure-property relationships. The feature matrix incorporated critical parameters including crystal system, while the target variable were density of secondary phases. Notably, the density
where
Due to the lack of work function for some gaseous elements, missing values were imputed using the mean. To reduce the risk of overfitting, the training set and test set were divided using a 5-fold cross-validation method (Training set:Test set = 4:1, shuffle = True, random_state = 42) [31]. For each model, the hyperparameters after optimizing are listed in Table 1. The comparative analysis employs R2 (coefficient of determination), MAE (mean absolute error) and RMSE (root mean square error) metrics across both training and testing datasets to assess model generalization performance, as defined in Eqs. (2)–(4) [32].

In this study, the Spearman correlation coefficient [33,34] was used to calculate the degree of association between two features, as shown in Eq. (5).
where
A total of 211 experimentally observed phases were selected from the Materials Project website (https://next-gen.materialsproject.org/ (accessed on 01 September 2025)) [35,36], as detailed in the supplementary material. All 211 samples are binary Mg-containing phases, and the data set contains 65 elements, such as Al, Zn, Sr, Ce, and In. Table 2 shows a summary table of descriptors of twelve material properties analyzed in this work. Each feature is defined in the “Descriptions” column, clarifying its physical or chemical significance. For instance, crystal structure denotes the atomic arrangement type, numerically encoded (e.g., Cubic = 1, Trigonal = 6), while density explicitly refers to mass per unit volume. Ranges for each feature reveal variability within the dataset. Structural properties exhibit notable ranges: atoms per phase range from 2 to 152, and volume extends from 18 Å3 to 2670 Å3. Crucially, density values range from 1.313 to 14.794 g/cm3, confirming the existence of high density phases in Mg alloys.

Fig. 1 shows the frequency distributions of volume and density. The volume distribution reveals unusual characteristics. An exceptionally high frequency of small-volume measurements dominates the distribution, far exceeding all other values combined. This is mainly attributed to the fact that most unit cells contain a small number of atoms. In the unit cell, atoms are arranged in the closest and most stable manner. This arrangement often requires no excessive number of atoms to achieve structural stability and symmetry. The density values exhibit a strong left-skewed distribution, with measurements heavily concentrated at lower values. This is because all current secondary phases contain Mg, but Mg has a low density of 1.74 g/cm3, and a relative atomic mass of 24.308.
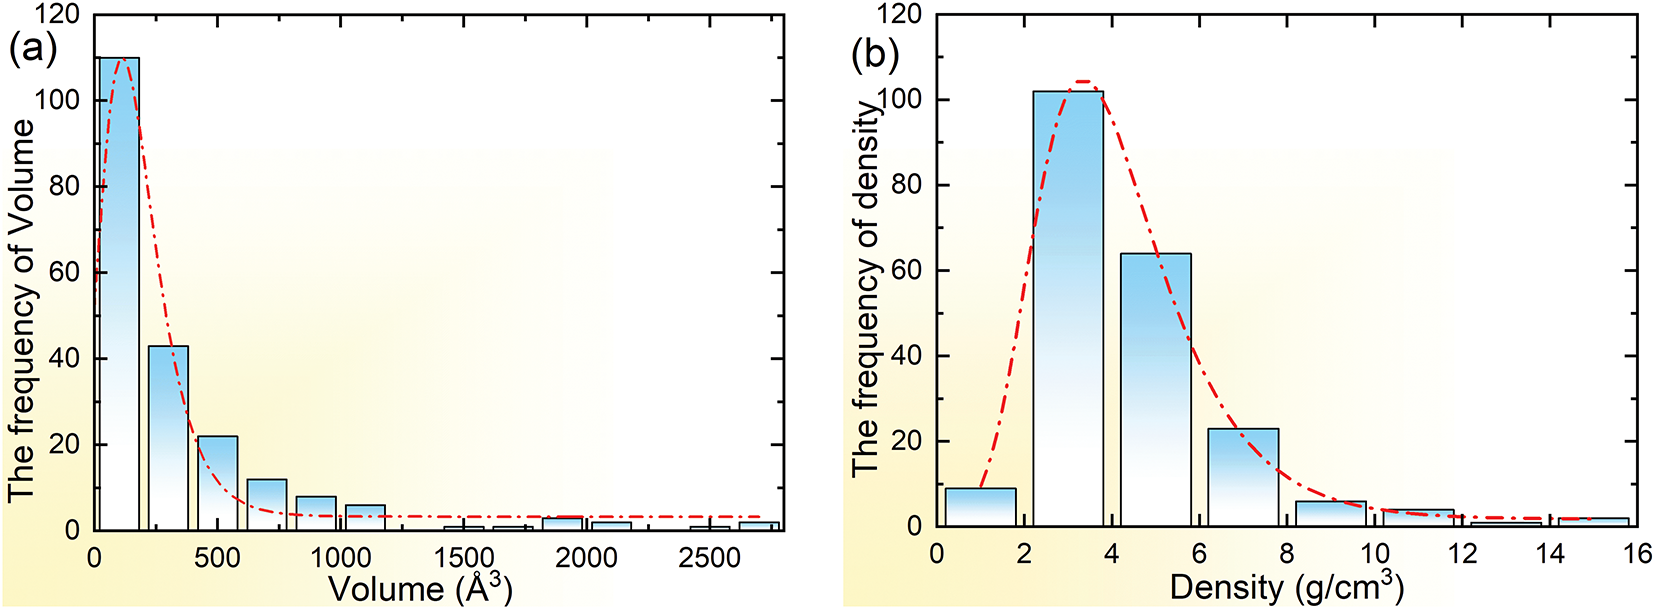
Figure 1: Frequency diagrams of unit cell (a) volume and (b) density
3.2 Modeling the Prediction of Density
The comparative performance of five ML models for predicting volume and density is presented in Fig. 2, evaluated using R2, MAE and RMSE metrics on both training and test datasets. For volume prediction, RF demonstrated exceptional performance, achieving the highest testing R2, lowest testing MAE and RMSE, indicating robust generalization. RF can directly handle high-dimensional data. By integrating multiple decision trees and introducing randomness in data and features, it effectively reduces the risk of overfitting [41]. For example, in high-entropy alloys, RF achieved 10 times higher accuracy than SVM and KNN in phase classification [42]. In Mg alloys, the RF algorithm effectively demonstrated the influence of chemical composition and environmental factors on the corrosion potential and corrosion current of each sample [43]. Bayesian Ridge and ANN also exhibited strong test performance. While SVM showed near-perfect training results, its test performance suggested overfitting and was substantially inferior. KNN exhibited the weakest generalization for Volume. For density prediction, performance varied significantly across models. SVM achieved the best testing results with the highest R, lowest MAE and RSME, demonstrating effective generalization. ANN followed closely. Notably, RF may exhibit significant overfitting for density, with good training performance degrading substantially during test. Bayesian Ridge showed moderate testing performance, while KNN again demonstrated the poorest generalization.
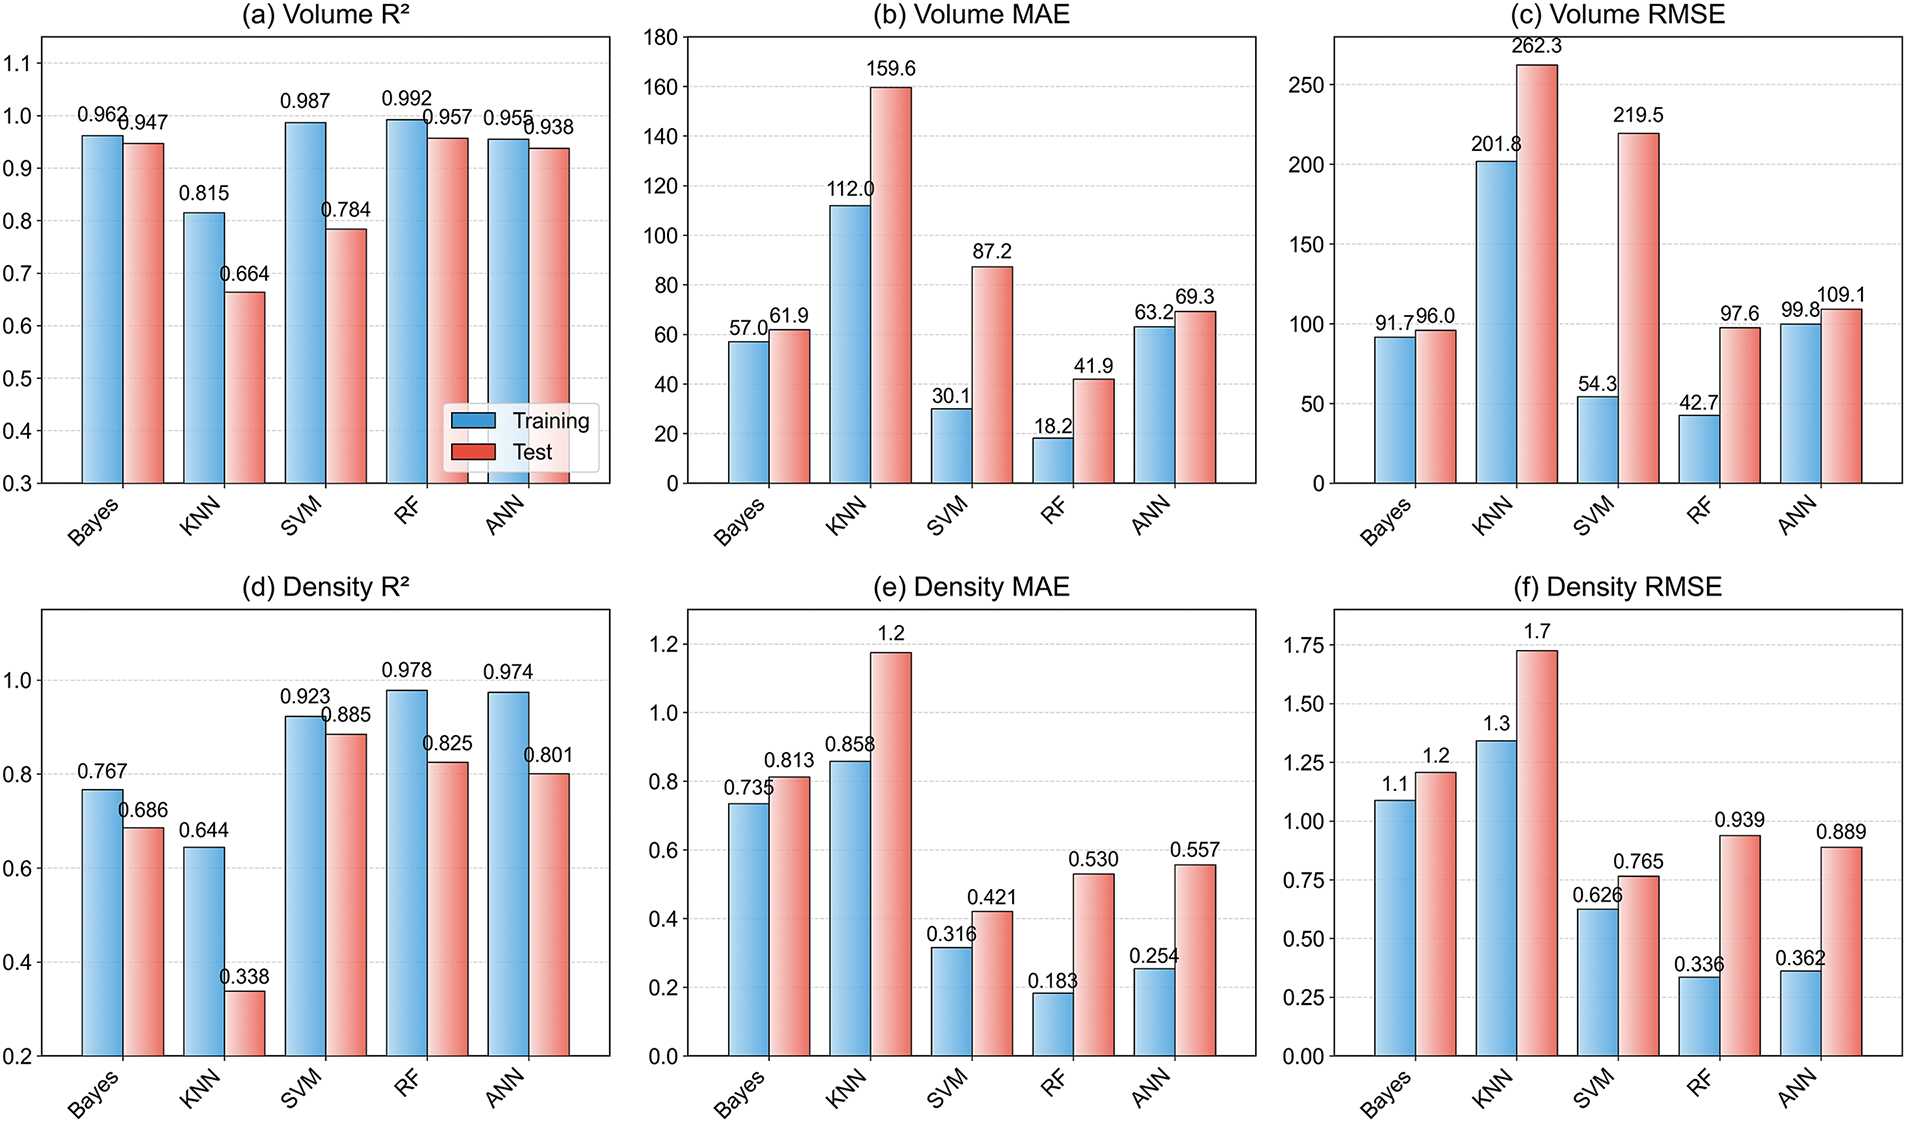
Figure 2: Average accuracy of 5-fold cross-validation for different models: (a) R2, (b) MAE, (c) RMSE for volume prediction; (d) R2, (e) MAE, (f) RMSE for density prediction
These results reveal critical insights. First, optimal model selection is inherently feature-dependent: RF is strongly recommended for volume prediction due to its outstanding test accuracy and robustness, whereas SVM emerges as the superior choice for density prediction. This occurs because volume prediction relies on global structural features, which the tree splitting mechanism of RF excels at capturing [44], while density prediction requires correlation with atomic-scale electron distribution where SVM’s kernel mapping more effectively models nonlinear relationships [45]. Second, overfitting may exist in specific instances, particularly with RF for density and SVM for volume, demonstrating the necessity of test validation. Third, models consistently achieve higher predictive accuracy for volume than for density, suggesting density presents greater modeling challenges, potentially due to higher noise, stronger non-linearity, or weaker feature relationships. Fourth, Bayesian Ridge and ANN demonstrate relatively consistent training-test performance for both features, indicating good stability despite did not yield the highest performance. Finally, the KNN model has the lowest prediction accuracy, thus it may be less suitable for the current task. Since density predictions still aren’t accurate enough, input features need to be improved or alternative ML models should be explored. Consequently, since the density of the secondary phase is directly calculable from the volume through physical laws, the RF-based volume prediction model is recommended for this work.
These results further reveal two critical phenomena: (1) Model performance exhibits significant task-specific divergence even when trained on identical datasets; (2) Despite the deterministic physical relationship between volume and density, ML predictions for these physically linked properties demonstrate marked discrepancies, suggesting inherent differences in their learnability. These task-specific performance disparities may arise from three interrelated mechanisms: First, feature relevance asymmetry may explain the different prediction accuracy between volume and density. Second, ML models introduce independent stochastic errors for each property, compounding prediction uncertainties in a manner not captured by classical physical relationships. Third, the greater difficulty in predicting density vs. volume may be attributed to its greater sensitivity to microscopic material variations. These details are either hidden inside volume measurements or missed by current data features, making density modeling computationally tougher.
To further analyze the model’s impact on prediction results, parity plots from the 5-fold cross-validation comparing the actual vs. predicted volume and density of secondary phases for the ANN model are shown in Fig. 3. The results reveal that the ANN model demonstrates strong predictive capability for volume but may exhibit notable overfitting tendencies for density. While volume predictions maintain consistent accuracy across folds, density predictions show higher variability, indicating poor model generalization on density features.
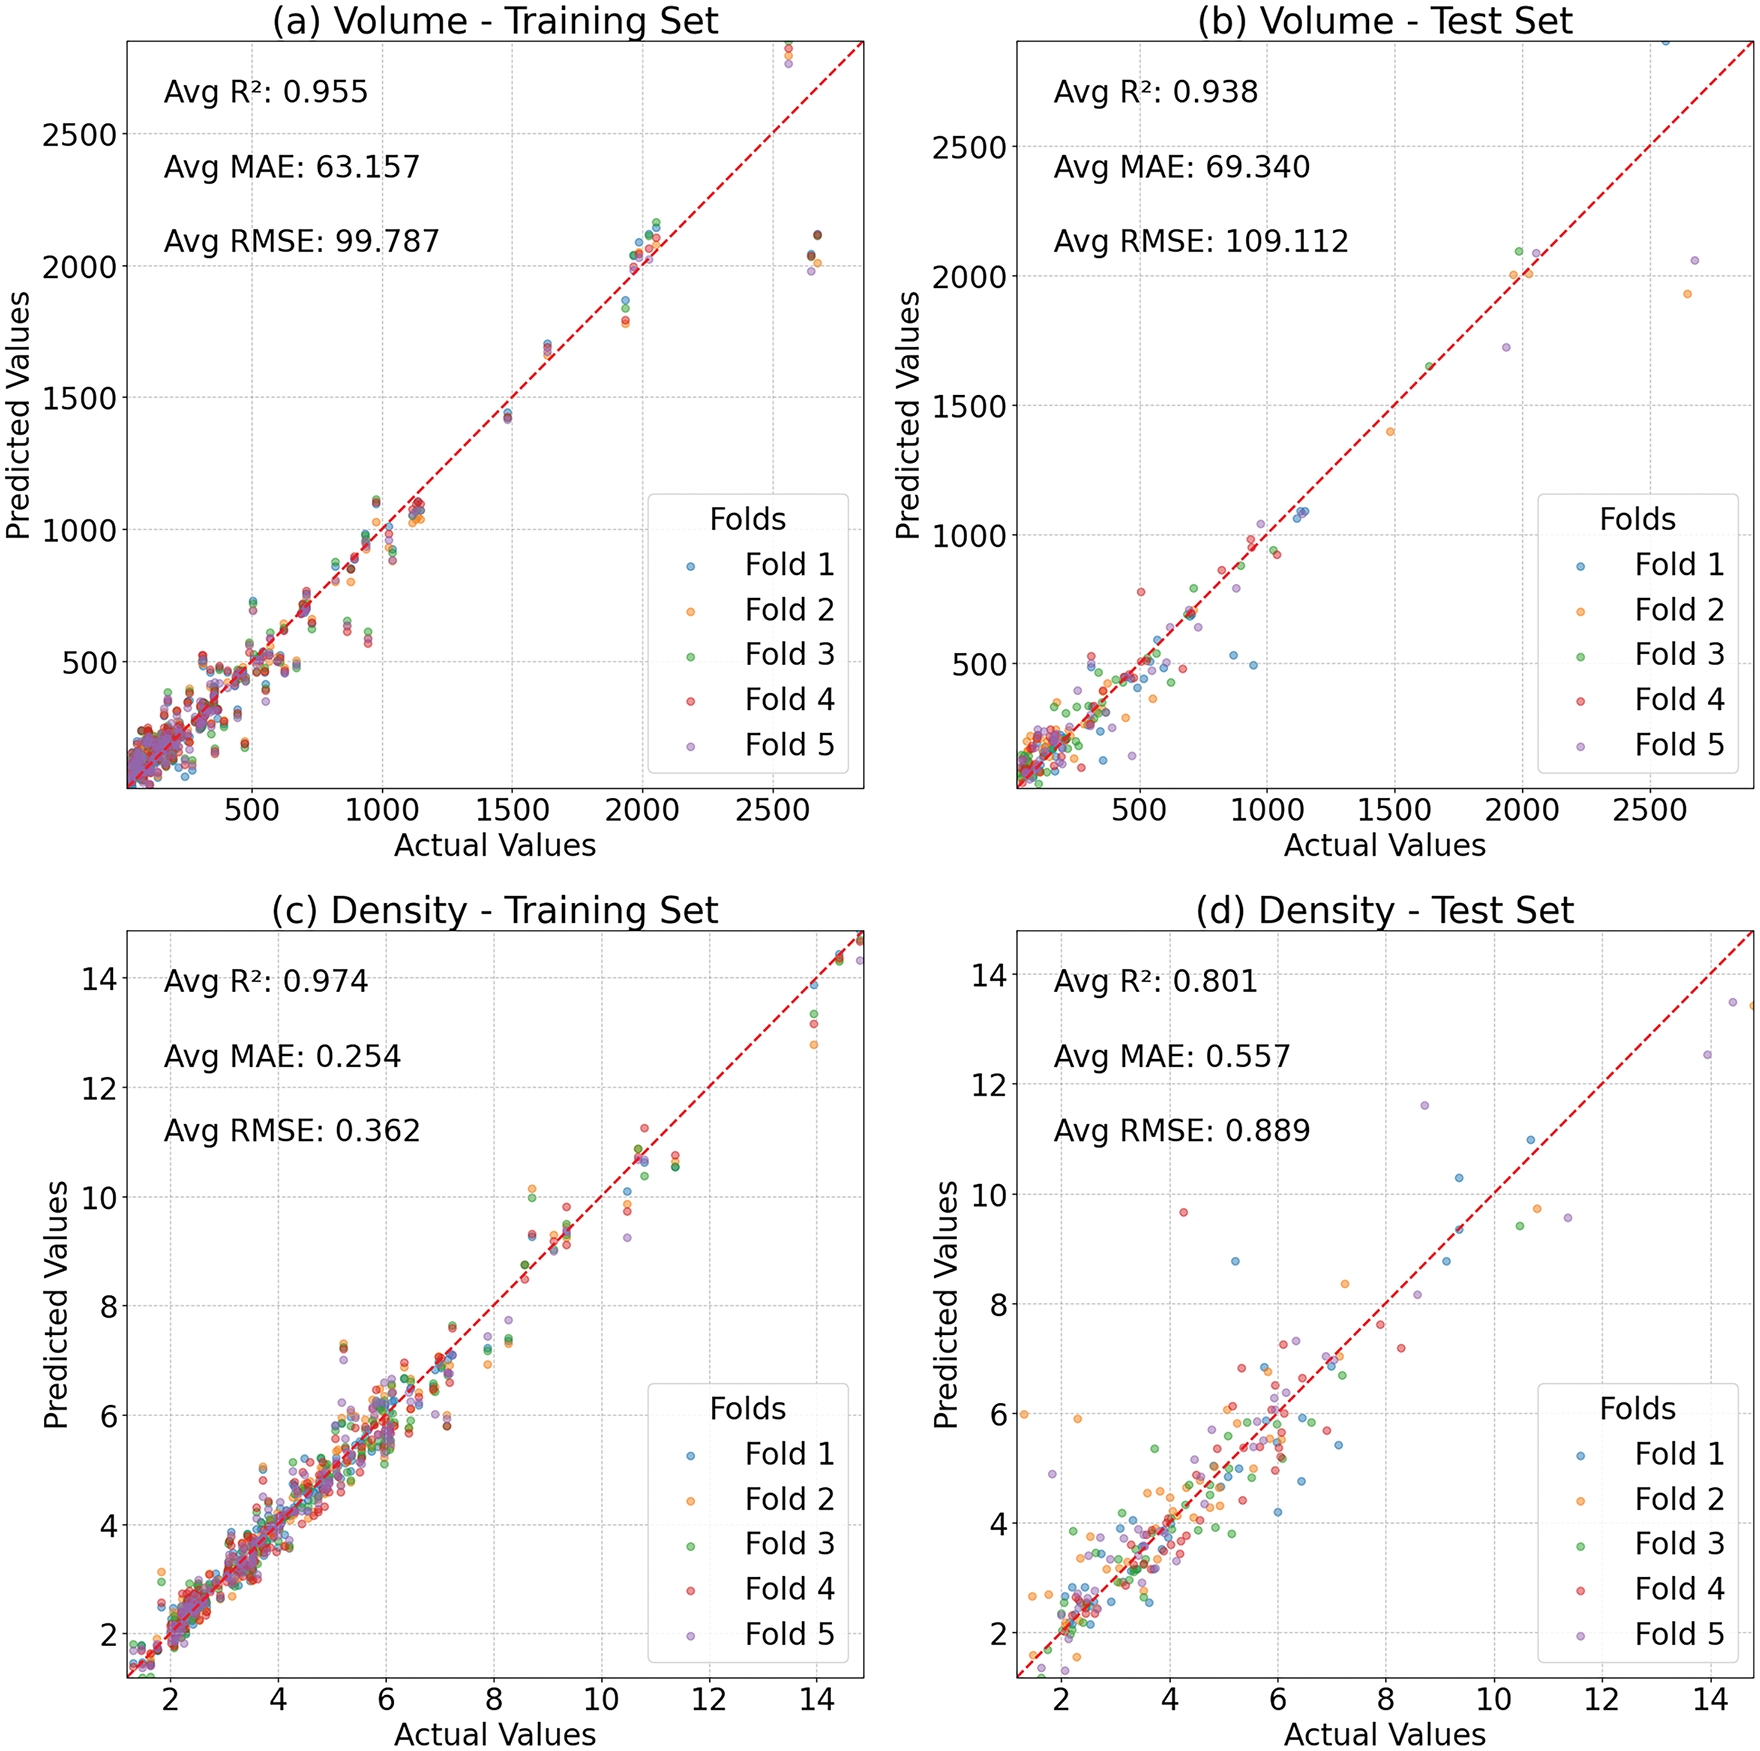
Figure 3: Results in 5-fold cross-validation for ANN: (a) training set for volume, (b) test set for volume, (c) training set for density, (d) test set for density
3.3 Spearman Correlation and Feature Importance in RF
The Spearman correlation analysis reveals insights into feature relationships, as shown in Fig. 4. For volume, the extremely high correlation with Atoms validates its dominance in feature importance scores, suggesting volume predictions heavily rely on system size rather than structural complexity. Notably, the inverse relationship between volume and Ratio can be attributed to most atoms having an ionic radius smaller than that of an Mg atom. However, the weak negative correlation with R indicates atomic radius has marginal direct influence on volume. This may be because the non-bonding atomic radius and ionic radius of atoms differ significantly, depending on factors such as charge transfer.
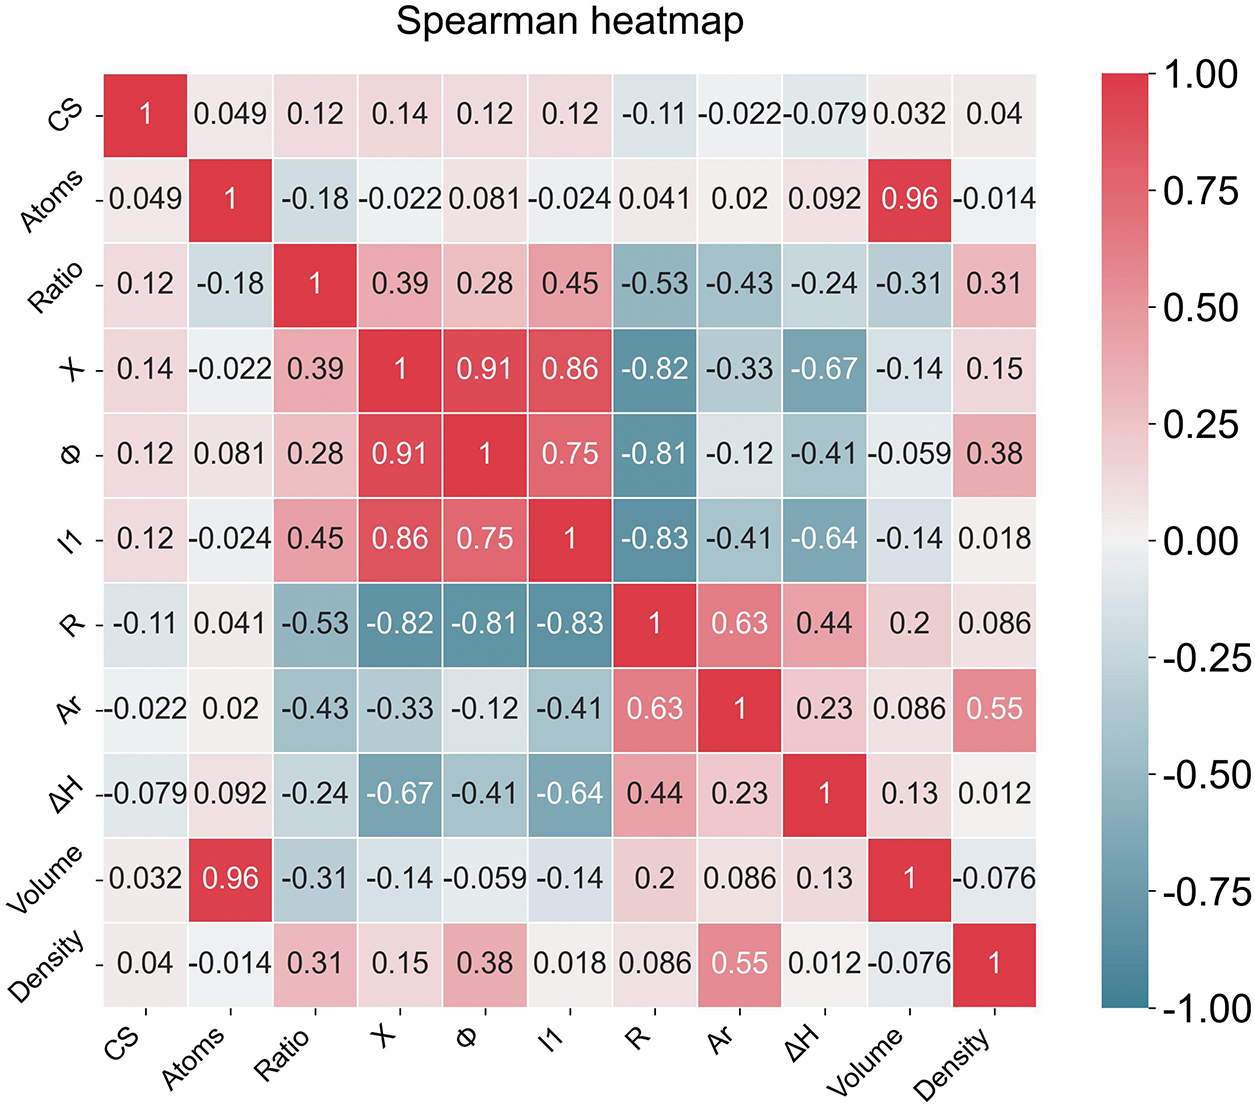
Figure 4: Spearman heatmap for all features
For density, the positive correlation exists with Ar, and moderate correlations exist with Ratio and Φ. However, the moderate positive correlation between density and Ar contrasts with the weak negative relationship between Ar and volume, indicating distinct physical drivers for these properties. X, I1 and Φ exhibit strong positive correlations [46], while all three show significant negative correlations with R, primarily due to the unified effect of nuclear attraction on electron binding strength [47]. These inter-feature relationships may contribute to density’s higher prediction variability, as models need to disentangle collinear effects between Ar/Ratio/Φ and structural parameters like R and CS.
Fig. 5 shows that the random forest feature importance analysis underscores distinct dominant predictors for volume and density, aligning with physical intuition and previous Spearman correlations. For volume, Atoms account for 94% of predictive power, reflecting its overwhelming dependence on system size rather than structural complexity or electronic properties. This dominance corroborates the Spearman matrix where volume and Atoms showed strong correlation, validating the model’s ability to capture systemic scaling effects. The contributions of other features are small, likely due to collinearity with Atoms or negligible independent influence.
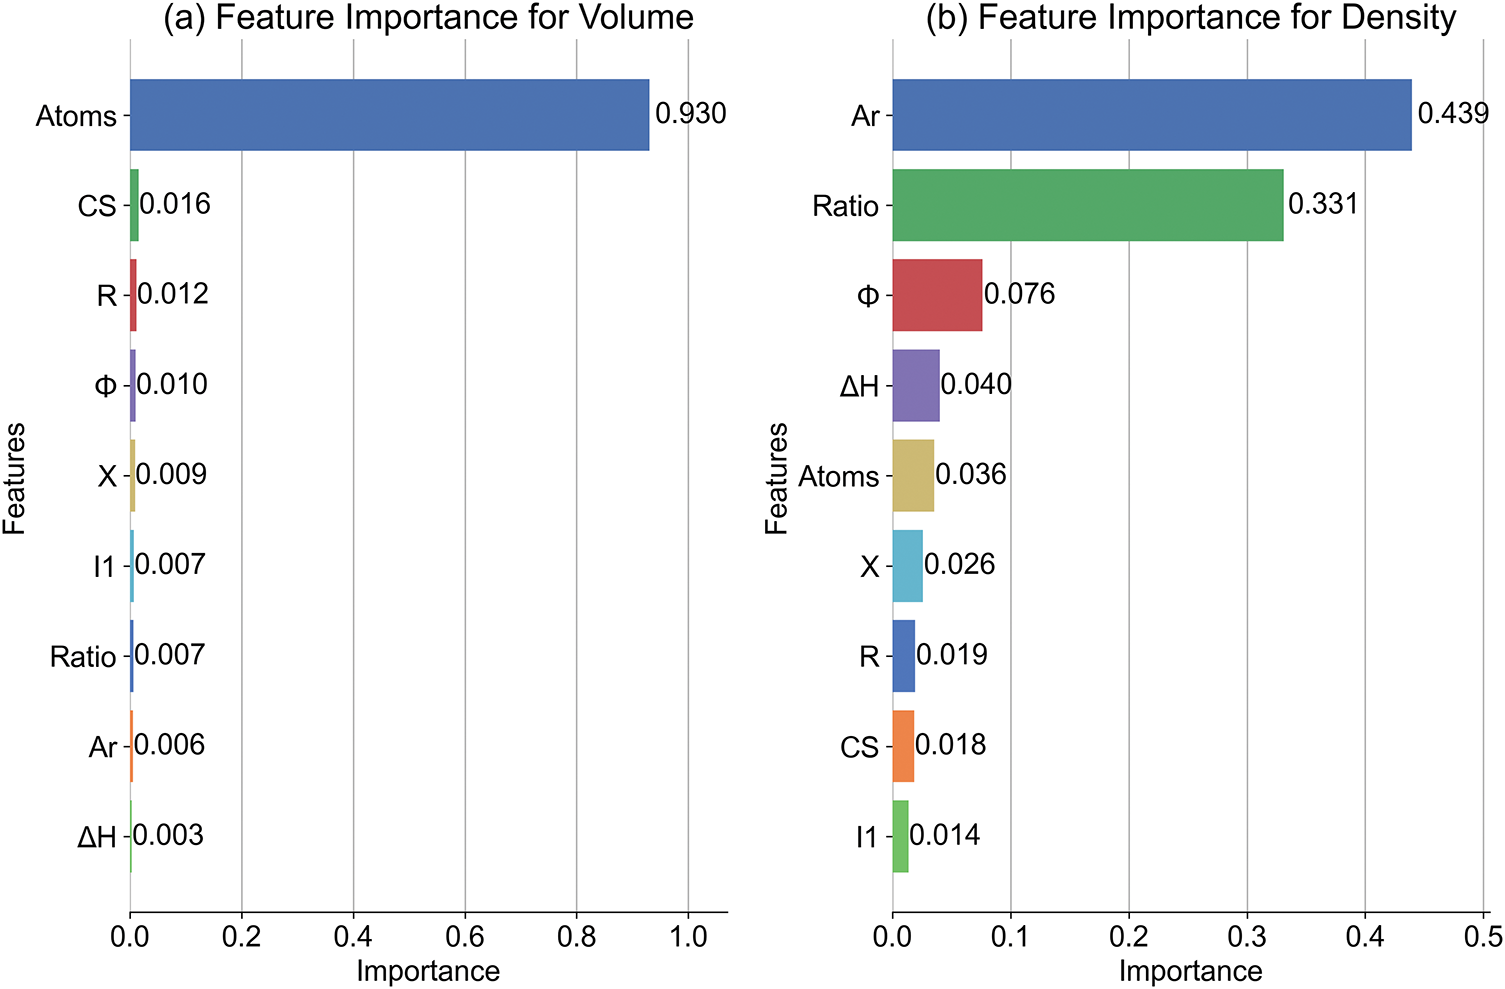
Figure 5: Feature importance from the Random Forest model for (a) volume and (b) density prediction
For density, the model highlights a synergistic effect between Relative Atomic Mass and Ratio. This aligns with the Spearman analysis where density correlated strongly with Ar and Ratio, emphasizing density’s dual dependence on atomic composition and stoichiometry. Work Function emerges as a secondary electronic contributor, potentially reflecting electron density effects on mass distribution. This may be attributed to the fact that charge transfer changes the radius of atoms/ions [48,49]. Notably, while Atoms retain mild importance, their reduced role compared to volume suggests density regulation occurs through compositional rather than sheer size mechanisms. These results demonstrate the RF’s capacity to disentangle complex material property drivers, complementing ANN findings while offering interpretable hierarchy through feature decomposition.
3.4 Feature Reduction of the RF Model
Figs. 6 and 7 show the recursive feature elimination (RFE) results for the RF models, which reveal critical insights into feature importance and model optimization for predicting volume and density. For volume, the optimal feature subset retains 5 out of 9 initial features, achieving a slight performance improvement and reduced error over the full feature set. Notably, removing some features enhances model performance, suggesting potential noise or redundancy in the original feature set.
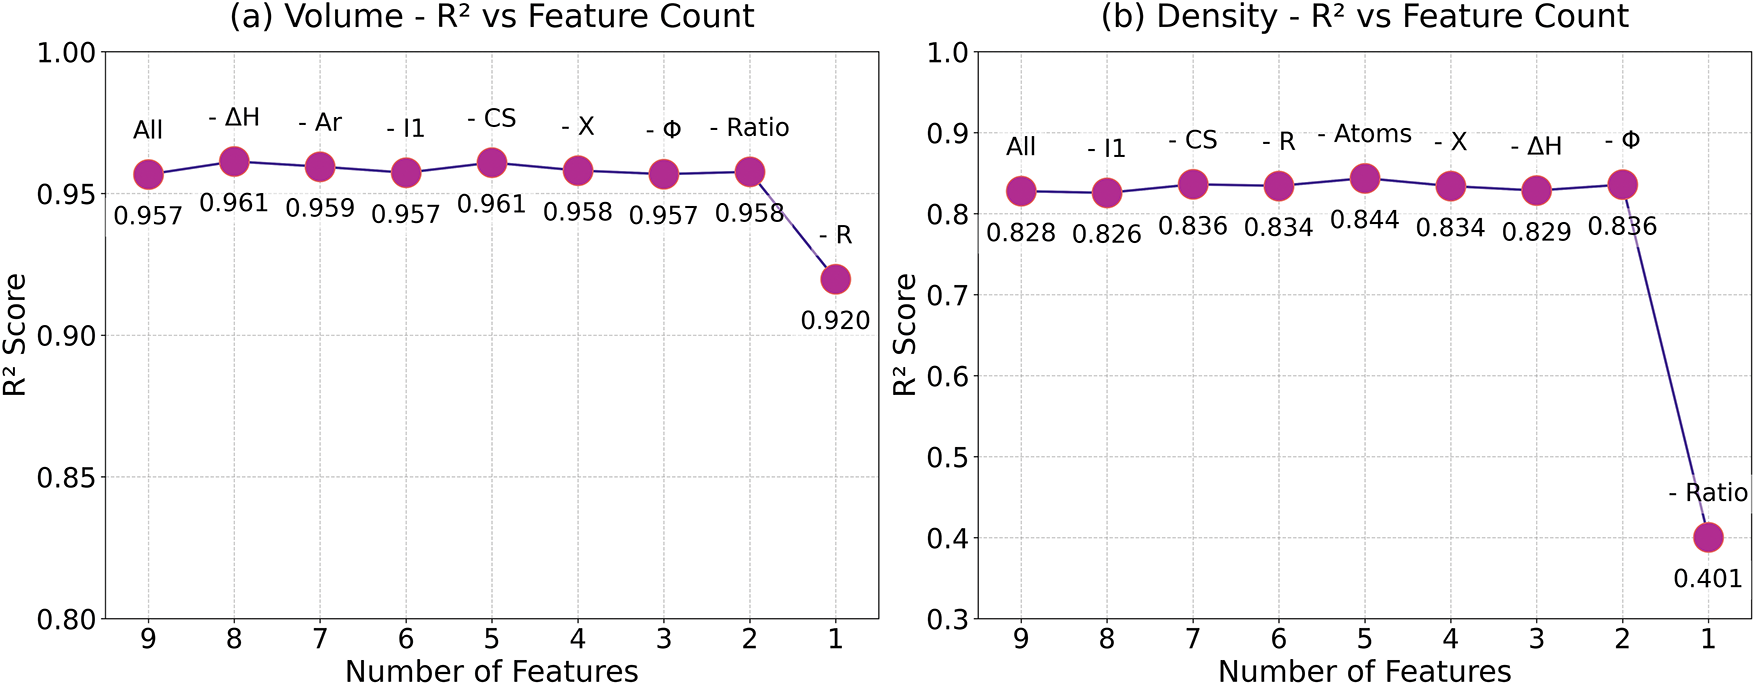
Figure 6: Feature reduction analysis in RF model for (a) volume and (b) density
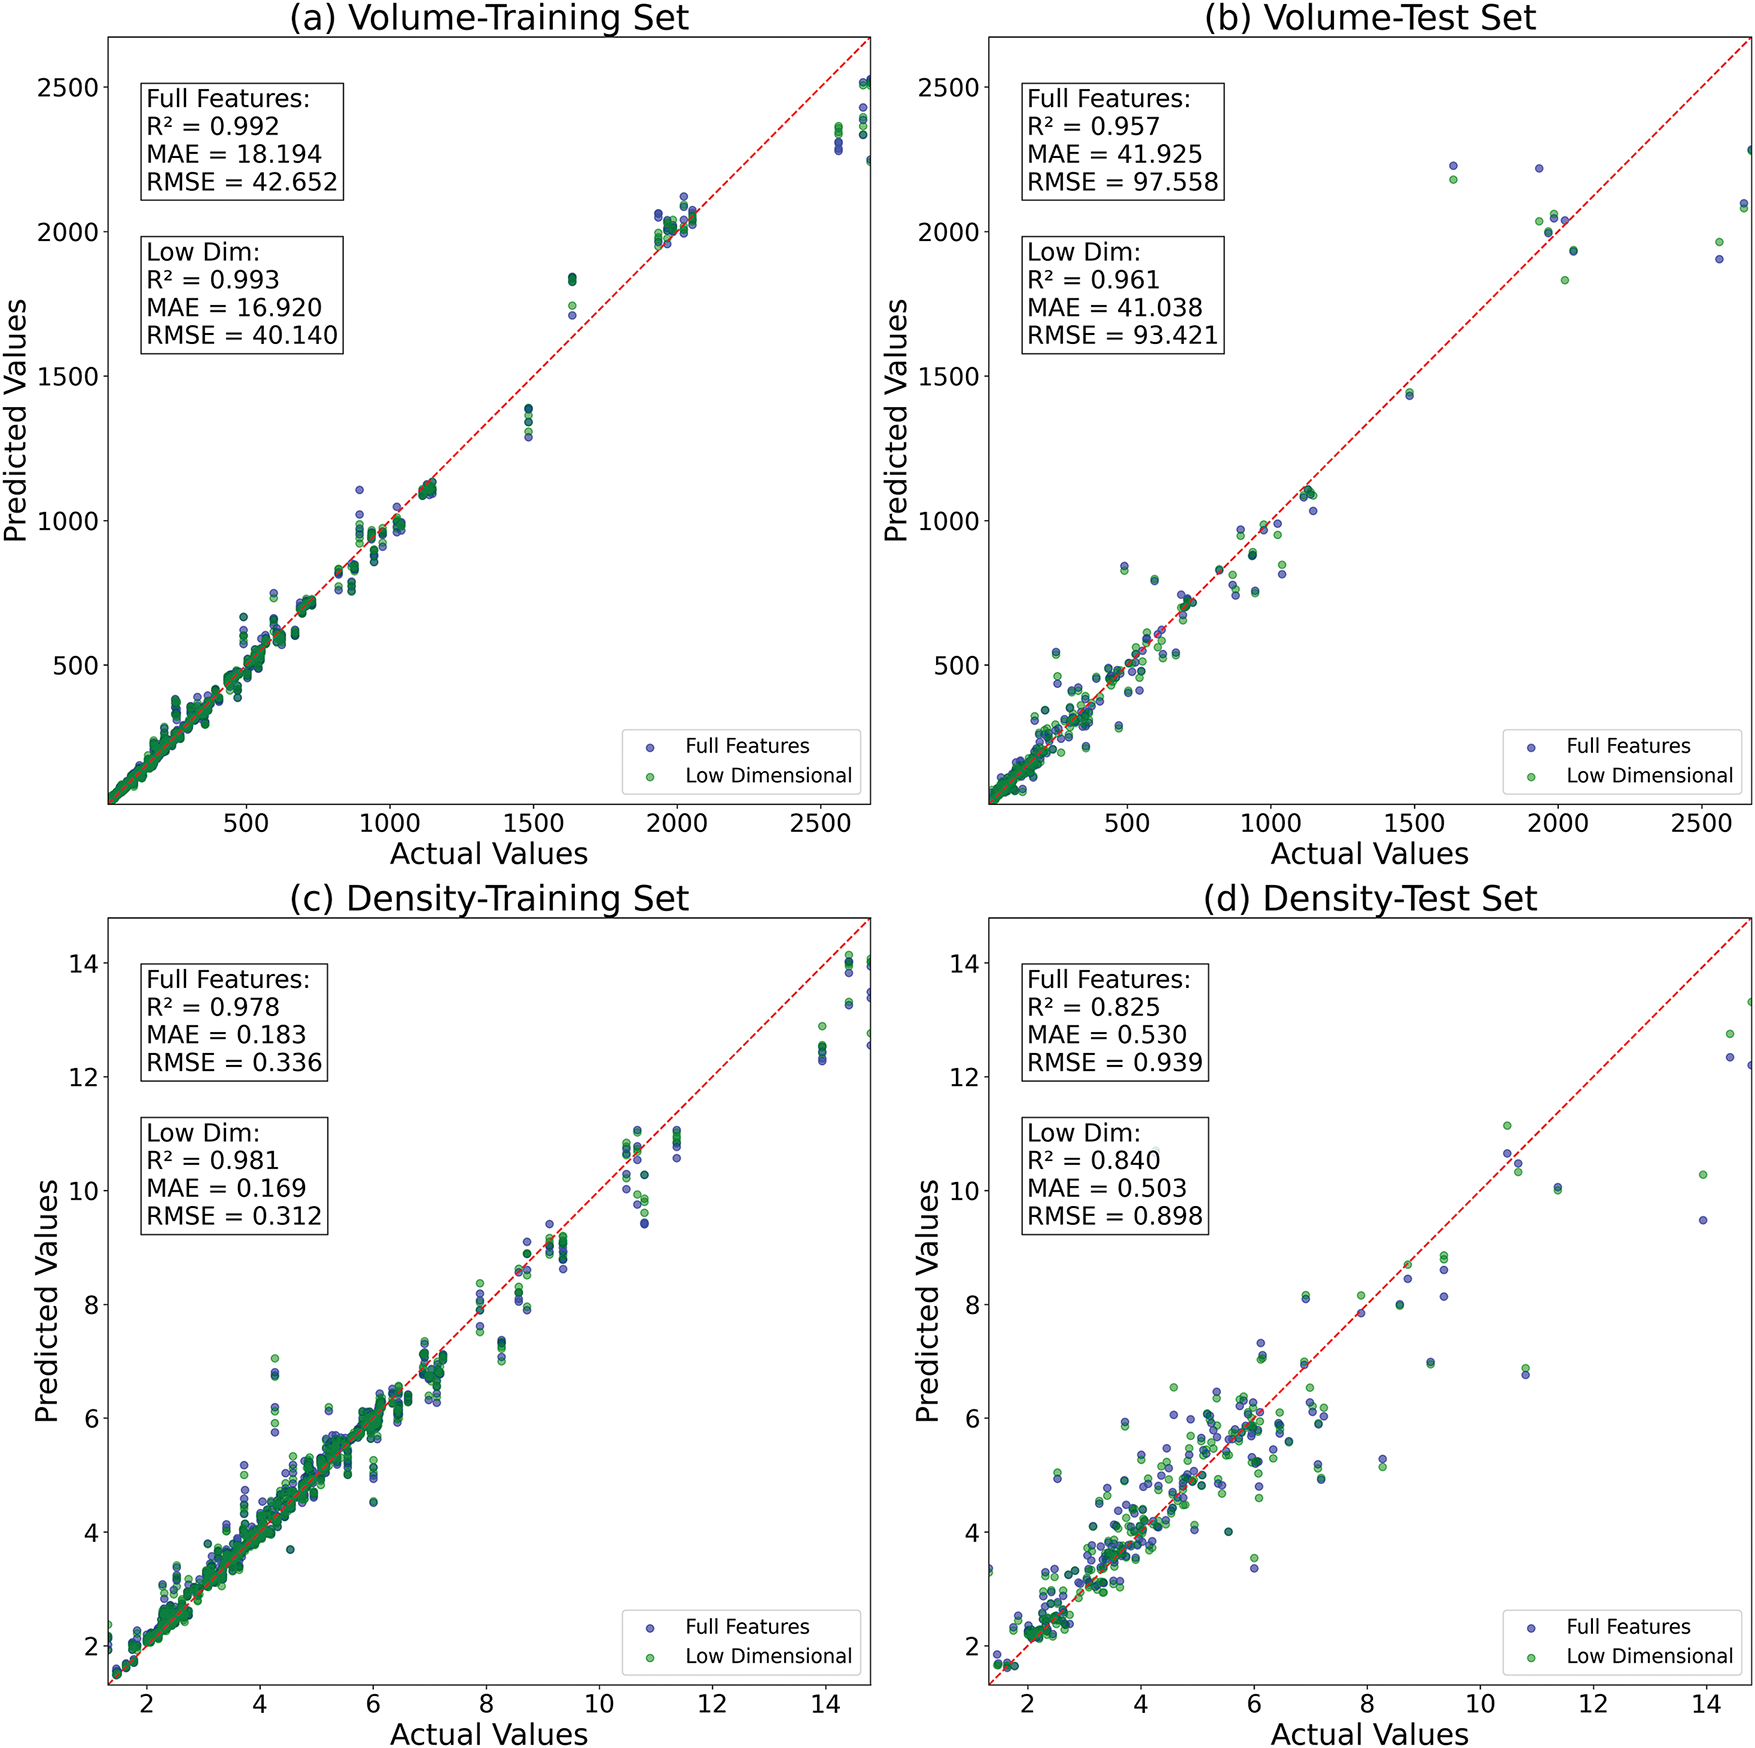
Figure 7: Effect of feature reduction in RF model: (a) training set for volume, (b) test set for volume, (c) training set for density, (d) test set for density
For density, the optimal feature subset excludes 4 features, retaining only Ratio, X, Φ, Ar, and ΔH. This subset improves performance and reduces error, with Ratio emerging as the most influential predictor. The removal of the “Atoms” feature can be anticipated, as it lacks a direct physical correlation with the density of the secondary phase. The dominance of chemical composition and electronic properties aligns with domain knowledge, since density is inherently tied to atomic packing efficiency and electronic interactions.
Methodologically, the RFE process proves less features may work better: reducing feature count while maintaining or improving performance. The stability of volume’s R2 across full and optimal subsets suggests robust generalization, whereas density’s gains indicate suppression of noise. Additionally, the reduction of parameters can improve model efficiency and potentially enhance prediction for secondary phase volume and density, even with limited data. In conclusion, both models benefit from feature pruning.
3.5 Physical Origin for Volume and Density Changes
The SHAP (SHapley Additive exPlanations) [50] analysis reveals distinct feature importance hierarchies for volume and density predictions. As shown in Fig. 8, for volume, Atoms emerge as the predominant driver, consistent with their direct physical linkage to material dimensions. This dominance suggests that atomic count establishes a foundational predictive basis, while the non-negligible SHAP contribution of R indicates that atomic size acts as a secondary role. This interplay implies that while Atoms capture bulk volumetric trends, R refines predictions by accounting for lattice expansion or contraction effects, particularly in systems where structural packing adapts to atomic radii. The relatively minor roles of other features further underscore the model’s heavy reliance on atomic composition and scale for volumetric estimation.
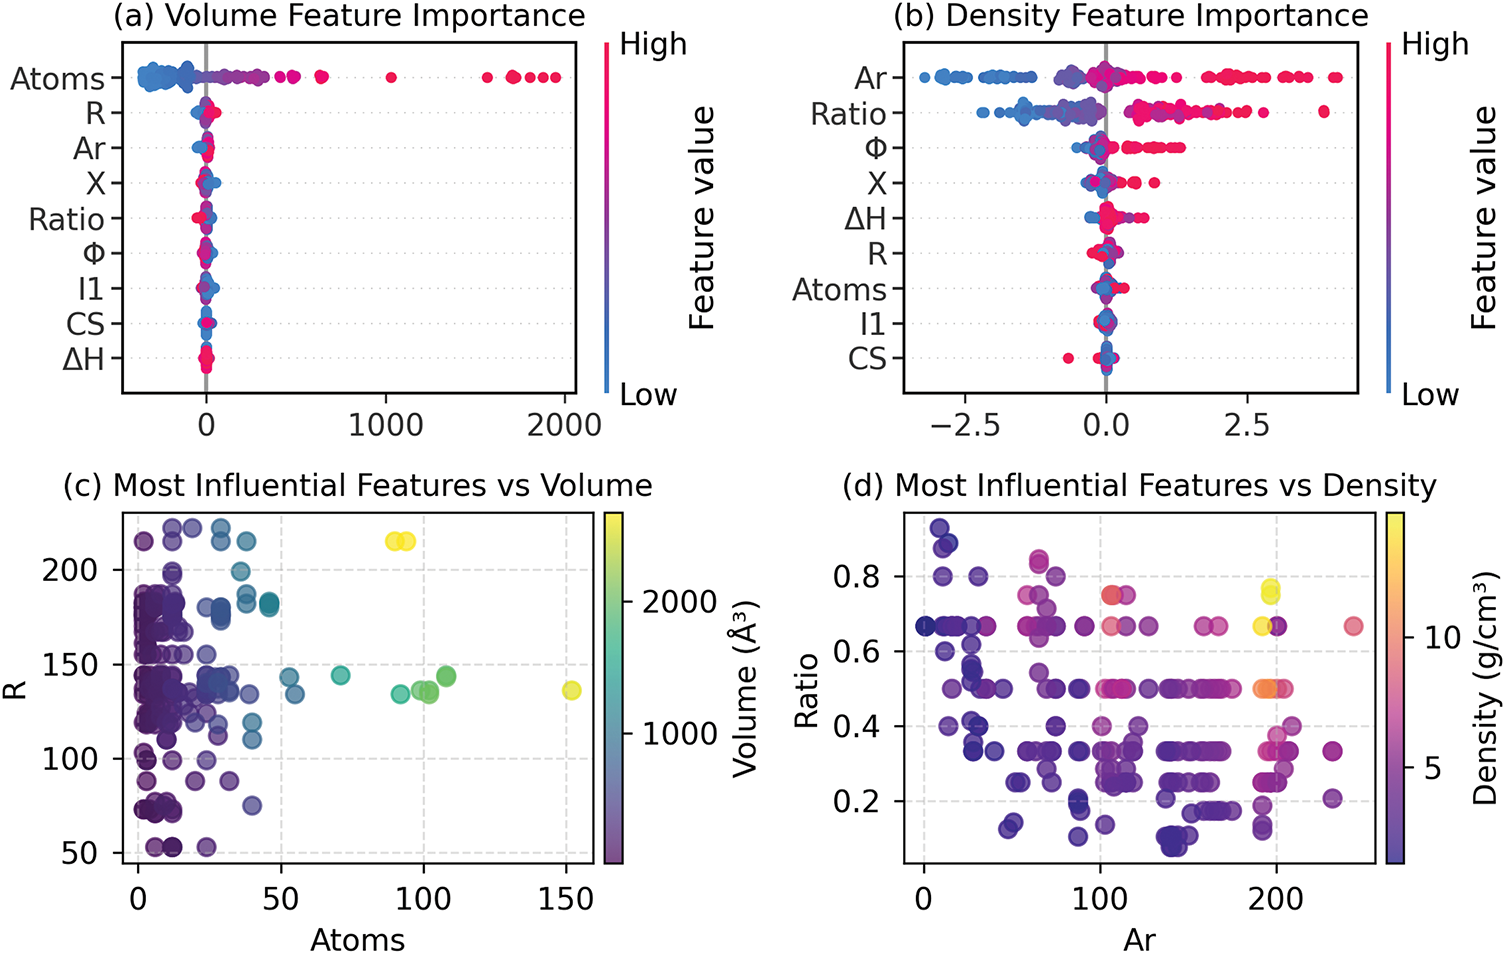
Figure 8: SHAP-driven feature importance for (a) volume and (b) density prediction; feature-target relationships for (c) volume and (d) density prediction
For density, the SHAP values show a more balanced interplay between Ar and Ratio, reflecting density’s dual dependence on atomic scale and chemical composition. Ar’s prominence aligns with its role in atomic packing efficiency, while Ratio captures compositional effects, such as ionic bonding characteristics in compounds. Notably, the lower SHAP magnitudes compared to volume suggest that density predictions are more sensitive to subtle feature interactions. For instance, while Ar and Ratio dominate, residual contributions from ΔH or Φ hint at uncaptured thermodynamic or electronic influences, pointing to potential importance in feature set expansion.
Scatter plot analyses provide complementary insights into feature-target relationships. For volume, in the Atoms-Volume plot, some data points deviate from the ideal scaling trend due to R variations. For example, samples with identical atom counts exhibit volume variations depending on R, demonstrating atomic size also influences volume prediction. This observation aligns with the SHAP results, where R’s influence modifies the baseline established by Atoms. For density, the Ar-Ratio plot reveals nonlinear interactions: high Ar values correlate with elevated density in some samples but not others, depending on Ratio. This dependence suggests that the model may benefit from explicit inclusion of interaction terms to capture compound-specific stoichiometric effects, such as charge balancing in crystals. Together, these visualizations reinforce the need for hybrid models that integrate both additive and synergistic feature contributions.
3.6 Model Assessment Using Other Data
To further validate the prediction performance of the model, this work selected compounds of non-rare earth element Al and rare earth element La with Mg. These compounds, which have not been experimentally observed in the Material Project database, include Mg15Al, Mg16Al13, Mg18Al11, Mg2Al3, Mg3Al, Mg7Al, MgAl, MgAl3, La2Mg, La3Mg, La4Mg, La5Mg, La5Mg41, LaMg12, LaMg15, LaMg5, and LaMg7, as detailed in supplementary material. RF models were employed to predict the volume and density of these secondary phases, with evaluations conducted using two distinct feature sets: a comprehensive full-feature model and a streamlined reduced-feature model, as shown in Fig. 9. The comparative analysis of these models provides insights into the interplay between feature complexity and predictive performance.
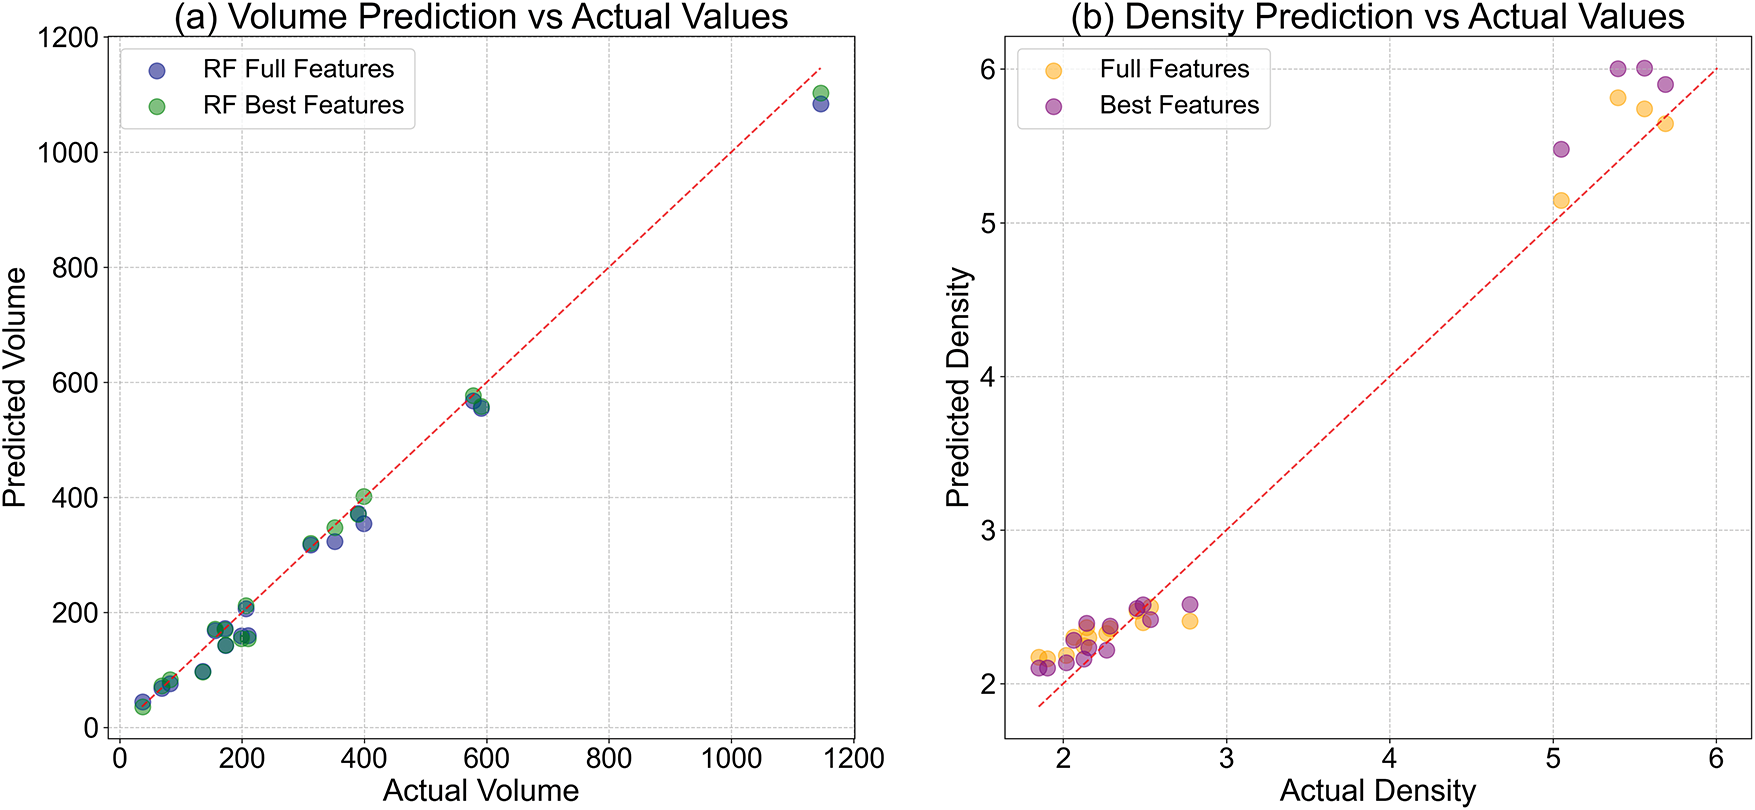
Figure 9: Actual and predicted values of Mg-Al phases and Mg-La phases for (a) volume and (b) density
For volume predictions, the reduced-feature model demonstrated notable advantages over the full-feature counterpart, as evidenced by improved goodness-of-fit and reduced prediction errors. This outcome suggests that a carefully compiled subset of features can effectively capture the dominant trends governing volume variations, potentially by eliminating redundant or noisy inputs. The enhanced performance of the reduced model underscores the importance of feature selection in simplifying the model structure while maintaining or even boosting predictive accuracy. Such a finding is particularly valuable for practical applications where model interpretability and computational efficiency are prioritized.
Conversely, for density predictions, the full-feature model exhibited superior performance compared to the reduced-feature model. This discrepancy implies that density estimation benefits from a broader array of input variables. These variables may contain small, complex interactions or non-linear relationships that are important for accurately modeling how density behaves. The reduced model’s relatively lower performance in this context underscores the risk of omitting features that, while non-essential for volume prediction, contribute meaningfully to the complexity of density behavior.
A comparative examination of the two target properties reveals that volume predictions achieved higher overall accuracy, as evidenced by stronger correlation between observed and predicted values. This distinction may arise from differences in the inherent variability or responsiveness of volume and density to the input features. Notably, neither model exhibited discernible systematic biases in over or underestimating the targets, demonstrating reliable predictive capability and robust generalization across the dateset.
The scatter plots of actual vs. predicted values further elucidate these dynamics. For volume, both models clustered closely around the diagonal of perfect agreement, with the reduced-feature model showing marginally tighter adherence. For density, the full-feature model displayed a more consistent residual distribution, suggesting greater stability in capturing the underlying patterns. These visualizations reinforce the conclusion that feature selection strategies must be tailored to the specific properties being predicted, as optimal performance for one target does not necessarily translate to another.
In this work, five ML models were established to predict secondary phase densities in binary Mg-containing phases. Key findings demonstrate:
(1) Prediction models have been constructed for volume (RF, test R² = 0.961) and density (SVM, test R² = 0.885).
(2) Calculations such as SHAP reveal that density is mainly determined by atomic packing efficiency and stoichiometric ratio, while volume is mainly dependent on atomic count.
(3) Density can be indirectly derived from volume via physical formulas, avoiding direct modeling uncertainties while maintaining accuracy.
Acknowledgement: Not applicable.
Funding Statement: This work is financially supported by Jinhua City Science and Technology Plan Project (2024-1-106) and the National Natural Science Foundation of China (U24A2035).
Author Contributions: Tao Chen: Writing—original draft, Funding. Xiaoxi Mi: Supervision, Methodology. Shibo Zhou: Conception. Shijun Tong: Data curation. Yunxuan Zhou: Data curation. Yulin Zhang: Review & editing. Yuan Yuan: Review & editing, Funding. All authors reviewed the results and approved the final version of the manuscript.
Availability of Data and Materials: The datasets generated and/or analyzed during the current study are available on request.
Ethics Approval: This study involves no human or animal subjects, and ethics approval is not applicable.
Conflicts of Interest: On behalf of all authors, the corresponding authors state that there is no known conflicts of interest.
Supplementary Materials: The supplementary material is available online at https://www.techscience.com/doi/10.32604/cmc.2025.070649/s1.
References
1. Luo AA. Magnesium is at a crossroads: an industrial metal or a technology metal. J Magnes Alloys. 2025;13(1):1–3. doi:10.1016/j.jma.2024.12.017. [Google Scholar] [CrossRef]
2. Zhang J, Miao J, Balasubramani N, Cho DH, Avey T, Chang CY, et al. Magnesium research and applications: past, present and future. J Magnes Alloys. 2023;11(11):3867–95. doi:10.1016/j.jma.2023.11.007. [Google Scholar] [CrossRef]
3. Wang H, Luo XC, Zhang DT, Qiu C, Chen DL. High-strength extruded magnesium alloys: a critical review. J Mater Sci Technol. 2024;199:27–52. doi:10.1016/j.jmst.2024.01.089. [Google Scholar] [CrossRef]
4. Bai J, Yang Y, Wen C, Chen J, Zhou G, Jiang B, et al. Applications of magnesium alloys for aerospace: a review. J Magnes Alloys. 2023;11(10):3609–19. doi:10.1016/j.jma.2023.09.015. [Google Scholar] [CrossRef]
5. Tan J, Ramakrishna S. Applications of magnesium and its alloys: a review. Appl Sci. 2021;11(15):6861. doi:10.3390/app11156861. [Google Scholar] [CrossRef]
6. Xie J, Zhang J, You Z, Liu S, Guan K, Wu R, et al. Towards developing Mg alloys with simultaneously improved strength and corrosion resistance via RE alloying. J Magnes Alloys. 2021;9(1):41–56. doi:10.1016/j.jma.2020.08.016. [Google Scholar] [CrossRef]
7. Jain S, Bhowmik A, Lee J. Machine learning approaches for predicting and validating mechanical properties of Mg rare earth alloys for light weight applications. Sci Technol Adv Mater. 2025;26(1):2449811. doi:10.1080/14686996.2025.2449811. [Google Scholar] [PubMed] [CrossRef]
8. Xu Z, Li Z, Shen C, Zheng D, Tu Y. Additive manufacturing high-strength and ultra-high-rare-earth magnesium alloys: excellent long-time aging hardening and strengthening behavior. J Magnes Alloys. 2025;97(3):S2213956725001422. doi:10.1016/j.jma.2025.04.007. [Google Scholar] [CrossRef]
9. Tariq HMR, Ishtiaq M, Kang HH, Chaudry UM, Jun TS. A critical review on the comparative assessment of rare-earth and non-rare-earth alloying in magnesium alloys. Metals. 2025;15(2):128. doi:10.3390/met15020128. [Google Scholar] [CrossRef]
10. Yu Y, Wei Y, Song Y, Shou H, He L. Mechanisms of temperature effects on the tensile properties and dislocation behavior of Mg-Zn-Ca alloys. Sci Rep. 2025;15(1):18066. doi:10.1038/s41598-025-01805-6. [Google Scholar] [PubMed] [CrossRef]
11. Wu J, Yuan Y, Chen T, Wu L, Cao F, Chen X, et al. Ultrahigh corrosion resistance of Mg-Er alloys by two-layer barrier from oxide film and triangular prism-like Mg(OH)2. Corros Sci. 2024;235(6):112166. doi:10.1016/j.corsci.2024.112166. [Google Scholar] [CrossRef]
12. Ding Z, Zhi X, Liu B, Hou H, Zhang S, Guo W, et al. Enhancement of strength and elastic modulus of Mg-Gd-Y-Zn-Zr alloy by Sn addition. Mater Sci Eng A. 2022;854:143885. doi:10.1016/j.msea.2022.143885. [Google Scholar] [CrossRef]
13. Tian G, Wang J, Wang S, Xue C, Yang X, Su H. An ultra-light Mg-Li alloy with exceptional elastic modulus, high strength, and corrosion-resistance. Mater Today Commun. 2023;35(1):105623. doi:10.1016/j.mtcomm.2023.105623. [Google Scholar] [CrossRef]
14. Mao P, Yu B, Liu Z, Wang F, Ju Y. First-principles calculations of structural, elastic and electronic properties of AB2 type intermetallics in Mg–Zn–Ca–Cu alloy. J Magnes Alloys. 2013;1(3):256–62. doi:10.1016/j.jma.2013.10.001. [Google Scholar] [CrossRef]
15. Mishin Y. Machine-learning interatomic potentials for materials science. Acta Mater. 2021;214(14):116980. doi:10.1016/j.actamat.2021.116980. [Google Scholar] [CrossRef]
16. Hart GLW, Mueller T, Toher C, Curtarolo S. Machine learning for alloys. Nat Rev Mater. 2021;6(8):730–55. doi:10.1038/s41578-021-00340-w. [Google Scholar] [CrossRef]
17. Liu Y, Niu C, Wang Z, Gan Y, Zhu Y, Sun S, et al. Machine learning in materials genome initiative: a review. J Mater Sci Technol. 2020;57:113–22. doi:10.1016/j.jmst.2020.01.067. [Google Scholar] [CrossRef]
18. Jain S, Wagri NK, Arya M, Bhowmik A, Park N. Predicting the magnetic behaviour of homogenized CoCrFeNiAlx high entropy alloys at different aluminium content and temperatures: reducing experimental dependency through machine learning approaches. Mater Chem Phys. 2025;346:131386. doi:10.1016/j.matchemphys.2025.131386. [Google Scholar] [CrossRef]
19. Ai SM, Fang DR, Guo YW, Ye J, Lin XP. Machine learning-driven prediction of microstructure-mechanical property relationships in Mg-Al alloys. J Alloys Compd. 2025;1036(8):181995. doi:10.1016/j.jallcom.2025.181995. [Google Scholar] [CrossRef]
20. Zhu G, Du X, Sun D. Machine learning accelerated design of magnesium alloys with high strength and high ductility. Mater Today Commun. 2025;44:111894. doi:10.1016/j.mtcomm.2025.111894. [Google Scholar] [CrossRef]
21. Zhang Y, Bai S, Jiang B, Li K, Dong Z, Pan F. Modeling the correlation between texture characteristics and tensile properties of AZ31 magnesium alloy based on the artificial neural networks. J Mater Res Technol. 2023;24(12):5286–97. doi:10.1016/j.jmrt.2023.04.079. [Google Scholar] [CrossRef]
22. Hou H, Wang J, Ye L, Zhu S, Wang L, Guan S. Prediction of mechanical properties of biomedical magnesium alloys based on ensemble machine learning. Mater Lett. 2023;348(6):134605. doi:10.1016/j.matlet.2023.134605. [Google Scholar] [CrossRef]
23. Mi X, Jing X, Wang H, Xu J, She J, Tang A, et al. A machine learning enabled ultra-fine grain design strategy of Mg-Mn-based alloys. J Mater Res Technol. 2023;23(1):4576–90. doi:10.1016/j.jmrt.2023.02.091. [Google Scholar] [CrossRef]
24. Cheng Y, Wang L, Yang C, Bai Y, Wang H, Cheng W, et al. A brief review of machine learning-assisted Mg alloy design, processing, and property predictions. J Mater Res Technol. 2024;30(4):8108–27. doi:10.1016/j.jmrt.2024.05.139. [Google Scholar] [CrossRef]
25. Salmenjoki H, Papanikolaou S, Shi D, Tourret D, Cepeda-Jiménez CM, Pérez-Prado MT, et al. Machine learning dislocation density correlations and solute effects in Mg-based alloys. Sci Rep. 2023;13(1):11114. doi:10.1038/s41598-023-37633-9. [Google Scholar] [PubMed] [CrossRef]
26. Huang SJ, Adityawardhana Y, Sanjaya J. Predicting mechanical properties of magnesium matrix composites with regression models by machine learning. J Compos Sci. 2023;7(9):347. doi:10.3390/jcs7090347. [Google Scholar] [CrossRef]
27. Machaka R, Motsi GT, Raganya LM, Radingoana PM, Chikosha S. Machine learning-based prediction of phases in high-entropy alloys: a data article. Data Brief. 2021;38:107346. doi:10.1016/j.dib.2021.107346. [Google Scholar] [PubMed] [CrossRef]
28. He Z, Zhang H, Cheng H, Ge M, Si T, Che L, et al. Machine learning guided BCC or FCC phase prediction in high entropy alloys. J Mater Res Technol. 2024;29(5):3477–86. doi:10.1016/j.jmrt.2024.01.257. [Google Scholar] [CrossRef]
29. Talib MM, Croock MS. Implementation of an intelligent power management system for building using machine learning model. Ingénierie Des Systèmes D Inf. 2025;30(2):335–47. doi:10.18280/isi.300205. [Google Scholar] [CrossRef]
30. Pedregosa F, Varoquaux G, Gramfort A, Michel V, Thirion B, Grisel O, et al. Scikit-learn: machine learning in python. J Mach Learn Re. 2011;12:2825–30. [Google Scholar]
31. Zhang Y, Ling C. A strategy to apply machine learning to small datasets in materials science. npj Comput Mater. 2018;4(1):25. doi:10.1038/s41524-018-0081-z. [Google Scholar] [CrossRef]
32. Wei X, Wang J, Wang C, Zhu S, Wang L, Guan S. Prediction of electronic work function of the second phase in binary magnesium alloy based on machine learning method. J Mater Res. 2022;37(21):3792–802. doi:10.1557/s43578-022-00752-6. [Google Scholar] [CrossRef]
33. Spearman C. The proof and measurement of association between two things. Am J Psychol. 1904;15(1):72–101. [Google Scholar]
34. You D, Ganorkar S, Kim S, Kang K, Shin WY, Lee D. Machine learning-based prediction models for formation energies of interstitial atoms in HCP crystals. Scr Mater. 2020;183(7732):1–5. doi:10.1016/j.scriptamat.2020.02.042. [Google Scholar] [CrossRef]
35. Jain A, Ong SP, Hautier G, Chen W, Richards WD, Dacek S, et al. Commentary: the materials project: a materials genome approach to accelerating materials innovation. APL Mater. 2013;1(1):011002. doi:10.1063/1.4812323. [Google Scholar] [CrossRef]
36. Horton MK, Huck P, Yang RX, Munro JM, Dwaraknath S, Ganose AM, et al. Accelerated data-driven materials science with the materials project. Nat Mater. 2025;2:036001. doi:10.1038/s41563-025-02272-0. [Google Scholar] [PubMed] [CrossRef]
37. Materials Project [Internet]. [cited 2025 Sep 1]. Available from: http://next-gen.materialsproject.org. [Google Scholar]
38. Michaelson HB. The work function of the elements and its periodicity. J Appl Phys. 1977;48(11):4729–33. doi:10.1063/1.323539. [Google Scholar] [CrossRef]
39. Chen T, Gao Q, Yuan Y, Li T, Xi Q, Liu T, et al. Coupling physics in machine learning to investigate the solution behavior of binary Mg alloys. J Magnes Alloys. 2022;10(10):2817–32. doi:10.1016/j.jma.2021.06.014. [Google Scholar] [CrossRef]
40. The Photographic Periodic Table of the Elements [Internet]. [cited 2025 Sep 1]. Available from: http://periodictable.com. [Google Scholar]
41. Liu J, Wang J, Li X, Lin H, Liu T, Zhou B, et al. Quantitative analysis and identification of magnesium alloys using fs-LA-SIBS combined with machine learning methods. RSC Adv. 2025;15(3):1549–56. doi:10.1039/d4ra07007k. [Google Scholar] [PubMed] [CrossRef]
42. Yousefi M, Rahmani K, Rajabi M, Reyhani A, Moudi M. Random forest classifier for high entropy alloys phase diagnosis. Afr Mat. 2024;35(3):57. doi:10.1007/s13370-024-01198-1. [Google Scholar] [CrossRef]
43. Moses A, Chen D, Wan P, Wang S. Prediction of electrochemical corrosion behavior of magnesium alloy using machine learning methods. Mater Today Commun. 2023;37:107285. doi:10.1016/j.mtcomm.2023.107285. [Google Scholar] [CrossRef]
44. Breiman L. Random forests. Mach Learn. 2001;45(1):5–32. doi:10.1023/A:1010933404324. [Google Scholar] [CrossRef]
45. Cortes C, Vapnik V. Support-vector networks. Mach Learn. 1995;20(3):273–97. doi:10.1023/A:1022627411411. [Google Scholar] [CrossRef]
46. Bučinskas A. Investigation of structure-properties relationship of organic carbazolyl-containing semiconductors [master’s thesis]. Kaunas, Lietuva: Kauno Technologijos Universitetas; 2016. [Google Scholar]
47. Lieb EH. Monotonicity of the molecular electronic energy in the nuclear coordinates. In: The stability of matter: from atoms to stars. Berlin/Heidelberg, Germany: Springer; 1997. p. 78–81. doi:10.1007/978-3-662-03436-1_5. [Google Scholar] [CrossRef]
48. Chen T, Zhou Y, Tong S, Zhang Y, Yuan Y, Chen X, et al. Effect of impurity elements on the corrosion behavior of Mg-Al alloys: a first principles study. J Mater Res Technol. 2025;36(11):8632–42. doi:10.1016/j.jmrt.2025.05.078. [Google Scholar] [CrossRef]
49. Chen T, Yuan Y, Mi X, Wu J, Tang A, Wang J, et al. Interaction of elements in dilute Mg alloys: a DFT and machine learning study. J Mater Res Technol. 2022;21:4512–25. doi:10.1016/j.jmrt.2022.11.071. [Google Scholar] [CrossRef]
50. Lundberg SM, Lee S. A unified approach to interpreting model predictions. In: Proceedings of the Neural Information Processing Systems; 2017 Sep 4–9; Long Beach, CA, USA. [Google Scholar]
Cite This Article
 Copyright © 2025 The Author(s). Published by Tech Science Press.
This work is licensed under a Creative Commons Attribution 4.0 International License , which permits unrestricted use, distribution, and reproduction in any medium, provided the original work is properly cited.
 Downloads
 Citation Tools