
 Submit a Paper
 Propose a Special lssue
 Open Access
ARTICLE

Graph-Based Intrusion Detection with Explainable Edge Classification Learning
1 Department of Applied Data Science, Sungkyunkwan University, Seoul, 03063, Republic of Korea
2 Convergence Program for Social Innovation, Dept. of Applied Artificial Intelligence, Sungkyunkwan University, Seoul, 03063, Republic of Korea
* Corresponding Author: Jaekwang Kim. Email:
(This article belongs to the Special Issue: Advances in Machine Learning and Artificial Intelligence for Intrusion Detection Systems)
Computers, Materials & Continua 2026, 86(1), 1-26. https://doi.org/10.32604/cmc.2025.068767
Received 05 June 2025; Accepted 01 August 2025; Issue published 10 November 2025
 View Full Text
 Download PDF
Abstract
Network attacks have become a critical issue in the internet security domain. Artificial intelligence technology-based detection methodologies have attracted attention; however, recent studies have struggled to adapt to changing attack patterns and complex network environments. In addition, it is difficult to explain the detection results logically using artificial intelligence. We propose a method for classifying network attacks using graph models to explain the detection results. First, we reconstruct the network packet data into a graphical structure. We then use a graph model to predict network attacks using edge classification. To explain the prediction results, we observed numerical changes by randomly masking and calculating the importance of neighbors, allowing us to extract significant subgraphs. Our experiments on six public datasets demonstrate superior performance with an average F1-score of 0.960 and accuracy of 0.964, outperforming traditional machine learning and other graph models. The visual representation of the extracted subgraphs highlights the neighboring nodes that have the greatest impact on the results, thus explaining detection. In conclusion, this study demonstrates that graph-based models are suitable for network attack detection in complex environments, and the importance of graph neighbors can be calculated to efficiently analyze the results. This approach can contribute to real-world network security analyses and provide a new direction in the field.Keywords
As internet technologies evolve, cyber threats are growing in scale and complexity. Sophisticated cyberattacks such as phishing and distributed denial-of-service (DDoS) attacks lead to devastating consequences, including data breaches and critical infrastructure damage, highlighting the pressing need for robust and adaptive intrusion detection systems (IDSs) capable of effectively responding to emerging threats [1,2].
Conventional rule-based intrusion detection systems often underperform in modern network environments due to their reliance on rigid pattern-matching, which results in high false positive rates and poor detection of novel attacks [3]. In response, recent research has increasingly adopted AI-driven approaches, which demonstrate superior capability in pattern recognition and detection of previously unseen threats [4].
Graph Neural Networks (GNN) have emerged as an effective technique for network security, as graph representations naturally model the complex interactions in network traffic by representing hosts as nodes and communication flows as edges [5]. By aggregating features from neighboring nodes and edges, GNNs facilitate robust identification of anomalous behavior [6]. In particular, edge classification is valuable for predicting connection types, enhancing detection of both known and zero-day attacks [7,8].
Despite their performance advantages, GNN-based IDS models exhibit limited interpretability. Their complex architectures and non-linear operations make it challenging for analysts to understand how predictions are derived. This limitation is particularly problematic in security-critical contexts, where trust in automated decisions is essential. To address this, explainable artificial intelligence (XAI) techniques have garnered growing attention [9]. However, applying XAI to edge-level predictions in graph-based models remains challenging due to the intricacies of graph topologies and the interdependence between nodes and edges [10,11].
Recent research in intrusion detection and anomaly detection has seen significant progress, particularly within the last year. Zhou et al. (2025) introduced the HIDIM framework to address hierarchical dependencies and class imbalance in network intrusion detection [12]. Cao et al. (2025) proposed IBPL, utilizing Information Bottleneck for graph out-of-distribution detection [13]. Mir and Trik (2025) developed a GCN-GRU model optimized with ant colony optimization for industrial IoT IDS [14]. Gowdhaman and Dhanapal (2024) presented a hybrid deep learning-based IDS for wireless sensor networks [15]. In addition, Huang et al. (2024) proposed Flow2GNN for enhancing GNNs beyond homophily, while Fu et al. (2025) introduced a method for fraud detection using disentangled homophily and heterophily in multi-relational graphs [16,17]. Yue et al. (2025) developed an IQR-DFFCNN-based DDoS detection system for SDN, and Huang et al. (2025) explored hypergraph transformation for graph anomaly detection [18,19]. Despite these advancements, challenges remain in terms of class imbalance, scalability, real-time performance, and generalization to evolving threats. Our approach aims to address these limitations by integrating the strengths of recent methods while overcoming their constraints.
In this work, we propose a novel intrusion detection framework that integrates GraphSAGE-based edge classification with a graph-specific XAI method. Network traffic is transformed into a graph, where each edge represents a communication session enriched with statistical features. To interpret the model’s predictions, we design a masking-based XAI technique that visualizes the influence of neighboring edges on the final decision. This approach not only improves detection performance but also enhances model transparency, providing valuable insights for security practitioners in real-world deployments.
The main contributions of this work are summarized as follows:
• Practical and Explainable IDS Model: We develop a robust intrusion detection system by adapting the GraphSAGE model for edge classification and integrating a novel explainability algorithm. This approach effectively captures communication-based attack patterns and enhances model interpretability. Extensive experiments on six public benchmark datasets (e.g., CIC-IDS-2017, NF-UNSW-NB15-v2) demonstrate superior or competitive performance compared to existing machine learning and GNN-based methods.
• Explainable AI Method for Edge Classification: We propose a novel XAI algorithm tailored for edge classification in graph models, filling a key gap in GNN explainability. Unlike existing methods focused on node-level explanations, our approach uses Randomized Masking Sensitivity Analysis to quantify and visualize the influence of neighboring edges on target edge predictions. The resulting visual attribution graph improves interpretability, enabling transparent intrusion detection and supporting real-time security response.
• Practical Analysis for Real-World Deployment: This study addresses two critical yet often-overlooked aspects of security systems: data imbalance and inference efficiency. We apply hybrid sampling and cost-sensitive learning to improve detection of rare attacks, and evaluate latency and resource usage on realistic hardware. Collectively, these contributions extend beyond predictive performance, offering a practical, interpretable, and deployment-ready framework for modern network security.
These research findings not only expand the applicability of graph neural networks in the field of network security but also contribute to the development of explainable AI-based security solutions, which could transform how we approach and understand network threats.
2.1 Network Data Packet Structure
Packet data generated in a network environment are required to detect network traffic attacks. A packet is the basic unit of data transmitted over a network, consisting of headers and payloads. The header contains essential information such as IP/port, protocol type, and packet length, while the payload contains the actual message, which is processed according to the network protocol.
The technique of network detection based on payload is Deep Packet Inspection (DPI), which identifies patterns or anomalies in a payload. Payload analysis enables direct detection of malicious code or spam information within the message and allows for identifying detailed patterns not observable in the header. However, payloads may include user-sensitive data, posing privacy risks. Moreover, analyzing payloads requires more computing resources, potentially degrading system performance. In modern communication environments, payloads are often encrypted, requiring decryption for analysis—making DPI difficult to apply in practice.
By contrast, research on network attack detection using header information has been actively conducted. The header contains essential metadata such as source/destination IP/Port, protocol type, and packet size, which can be used to detect anomaly patterns. Artificial intelligence models can leverage these features to learn unique attack patterns and monitor traffic for abnormal behavior. This approach is more cost-effective, less complex, and more efficient than DPI. In addition, using only header data helps preserve user privacy and enhances the reliability and integrity of the network.
2.2 Graph and Edge Classification Model
The field of network attack detection has been extensively studied, encompassing traditional machine learning methods and modern deep learning models. A recent survey identified two key reasons why graph-based models are significant for intrusion detection [7]. First, graph models effectively capture both individual flow features and interdependencies. Second, they offer robustness and explainability against adversarial attacks, supporting the development of more reliable models. However, further research is needed on rapid adaptation to novel attacks and the integration of explainable AI. Accordingly, this study focuses on improving the explainability of graph-based intrusion detection models to enhance decision-making and increase trust among security experts.
Graph-based intrusion detection methods are typically categorized into node-based and edge-based approaches. While node-based detection dominated until 2020, recent years have seen a shift toward edge-based detection [7]. Edge classification offers distinct advantages: it directly represents traffic flows as edges, allowing for more intuitive graph analysis, and it facilitates the effective use of port information, which is often underutilized in node-based methods. Studies highlight the utility of edge classification in complex network environments [20], though class imbalance among edges remains a challenge. Addressing this requires strategies such as edge-level weighting. This study therefore focuses on edge-based intrusion detection with an emphasis on mitigating class imbalance through edge weighting.
2.3 Graph Sample and Aggregation Model
GraphSAGE (Graph Sample and Aggregation) is an efficient graph neural network (GNN) model for processing graph-structured data. It samples and aggregates information from neighboring nodes to convert node attributes into vectors, making it well-suited for large graph data [21]. This method applies to various graph-based tasks, including node classification, link prediction, and graph classification.
Traditional GNN models treat an entire graph as a fixed structure, which can lead to high computational costs for large graphs. In contrast, GraphSAGE learns efficiently by sampling a node’s neighbors and aggregating their information. It uses an aggregator function to integrate neighbor features and generate embeddings, enabling prediction of network attacks based on previous connections.
GraphSAGE also supports inductive learning by generating embeddings for unseen nodes during inference. This adaptability makes it suitable for real-world network environments with continuous changes. It achieves efficient computation and generalization on large, complex graphs through its sampling-based approach.
2.4 Explainability in Graph Neural Networks Model
This study examines various Explainable Artificial Intelligence (XAI) methodologies to determine the nodes and features important in graph model prediction. The results are presented in Table 1 [11].

GNN Explainer identifies important nodes and edges by finding the subgraph and node features that contribute the most to the predictions of the model, helping users understand which graph structures and features are pivotal [22]. PGExplainer uses a stochastic approach to model the importance of each edge for a given prediction, highlighting key connections in complex graph structures [23]. Subgraph X extracts small subgraphs with the greatest influence on predictions and evaluates their importance using Shapley values, revealing key graph patterns [24]. GCF descriptor quantifies the influence of specific nodes or edges on predictions, offering a comprehensive view of important decision-making elements [25]. XGNN leverages graph generation to describe the decision process by producing key graph patterns learned by the model, enhancing interpretability [26].
Recently, there has been a growing emphasis on the need for explainable artificial intelligence (XAI) in the context of network security, especially for detecting and understanding advanced and evolving network attacks [27,28]. Research has shown that explanation models can help identify not only why a prediction was made, but also how an attack may propagate through the network, thereby revealing structural vulnerabilities that attackers may exploit [27]. Furthermore, systematic reviews highlight the need to improve transparency in intrusion detection systems (IDS) by integrating XAI techniques.
However, existing XAI approaches mostly focus on node- or graph-level predictions, which limits their applicability for network attack detection tasks that fundamentally require edge-level classification to accurately identify malicious connections. As mentioned in Table 1, most of the studied models, as well as the GNN Explainer, PG Explainer, SubgrapX, GCF Explainer, and XGNN methods, predict graphs or nodes. Because we must apply edge classification models to detect network attacks, we cannot obtain explanatory results using these models. Consequently, this study proposes a method that can provide explanations using edge classification models.
This study utilizes network packet data for the evaluation of intrusion detection systems. Packet header information is transformed into a tabular format, comprising over 50 features that encompass fundamental network parameters and flow-based statistics. The overall data preprocessing in this study was conducted by referencing widely known methods in the fields of machine learning and network security analysis.
To accurately identify distinct network nodes and the services they provide, we preprocess IP addresses and port numbers by concatenating them into a single string (e.g., “192.168.0.1:8080”). This is crucial because identical IP addresses with different port numbers signify separate services that require unique identification. By combining the source IP and port and the destination IP and port, we create unique textual representations for network nodes. These unique strings are then essential for constructing network graphs, ensuring that each node, representing a specific service on a device, is distinctly recognized within the intrusion detection system [29].
The numerical features prevalent in network traffic data often exhibit substantial variance originating from various sources, which can adversely impact model training efficiency. To mitigate this issue, the Z score was normalized. This method was selected over alternatives, such as Min-Max normalization, primarily due to its enhanced robustness to outliers, a common characteristic of network traffic data. Unlike scaling methods sensitive to extreme values that can distort the data’s range, Z-score normalization effectively standardizes the data while preserving its intrinsic distribution.
Finally, categorical attack types were converted into numerical representations. Label encoding assigns a unique integer to each category, simplifying the conversion and reducing memory requirements. In this study, label encoding was implemented to facilitate the model’s effective processing of categorical data.
3.2 Graph Construction and Entity Definition
Graph-based analysis is an effective method for identifying complex interactions, optimizing network performance, defining failover strategies, and detecting anomalous patterns (e.g., DDoS attacks) by observing specific relationships among network entities. This methodology also efficiently handles large volumes of network data by leveraging techniques like neighbor sampling for scalable model training.
In this study, network nodes are precisely defined by the unique combination of preprocessed IP addresses and port numbers (e.g., “192.168.1.1:80”). Within a communication flow, the source IP-port serves as the initiating node, while the destination IP-port functions as the terminating node. These distinct concatenations establish unique identifiers for each network entity within the constructed graph. Furthermore, to facilitate the training of graph-based models such as Graph Neural Networks (GNNs) for tasks including anomaly detection and attack type classification, attack features are incorporated as edge labels. The comprehensive methodology for transforming raw network data into this structured graph representation is visually depicted in Fig. 1, illustrating how IP-port pairs form nodes, and communication characteristics, alongside attack types, are assigned as edge features and labels, respectively.

Figure 1: Transformation of network data into a graph
The entire graph is constructed using libraries such as Python’s NetworkX, integrating node information, edge features, and edge labels, thereby enabling the visualization and analysis of inherent relationships within the network data. When a graph is constructed, the relationship between the data can be observed, as illustrated in Fig. 2. Edges are defined according to the features of the nodes.

Figure 2: Visualization of the network attack graph structure
3.3 Graph-Based Edge Classification Model
Graph Sample and Aggregation (GraphSAGE) is a model designed to efficiently extract features from graph-structured data. As shown in the Fig. 3, it creates node embeddings by sampling neighbors, aggregating their features, and generating new node embeddings. Unlike conventional methods, GraphSAGE can produce embeddings using only partial neighborhood information instead of loading the entire graph into memory, making it suitable for large graphs. By sampling edges instead of calculating all node embeddings using every edge, this approach reduces computational resources needed for training the model and improves classification accuracy. Additionally, this approach minimizes overfitting, as opposed to learning by reflecting the features of all nodes, which enables the model to effectively predict even real network data that has not been seen during training. The following order of learning is employed using this model.

Figure 3: Visualization of the node embedding
1. Neighbor Sampling: For node
2. Aggregate Function: A new embedding of node
where
3. Final Node Embedding: After going through all the layers, we go through a normalization process to get the final node embedding as follows.
In this study, we generated node embeddings by using the GraphSAGE model. Each node is represented in a low-dimensional vector space by considering the complex connection structure and various characteristics of the nodes within the network. The transformed low-dimensional vector effectively reflects the relationships and characteristics between the nodes. The vector obtained through node embedding is transformed into edge embedding in a later stage, and then the role and location of the node in the network and its relationship with other nodes can be learned to effectively detect the aggressor or nodes exhibiting abnormal behavior.
Following the above sequence, the GraphSAGE model creates a low-dimensional embedding of all generated nodes and selects a sample of all connected edge features with a selected K value. Only the features in the selected edge samples were aggregated. To aggregate the selected features, the average vector of each feature vector was computed. In this process, the information of neighboring features is passed along to enable classification using the information of neighbors. A weight matrix W was applied to transform the aggregated vectors into a new low-dimensional vector representation, and a nonlinear activation function was applied to obtain a new vector representation of node
The process of generating node embeddings using GraphSAGE enables the learning of the vector representation of nodes from graph data. These node embeddings can be created by using vector combinations. We then leverage the corresponding edge embedding vectors to proceed with the edge classification task. This section describes the use of node embeddings generated by GraphSAGE for this purpose and classifies the relationships between two connected nodes based on these embeddings.
1. Node embedding vector generation: GraphSAGE was used to generate the embeddings for each node. In this process, each node is represented by a vector that synthesizes information regarding its properties and its neighboring properties.
2. Combination of two connected nodes: The embedding of two nodes to predict the relationship for edge classification is combined. The most common method is to connect the embeddings of two nodes, as shown Fig. 4. For example, if the embedding of nodes A and B is
3. Edge classifier training and prediction: The embeddings of the two connected nodes are combined and used as inputs to train a classifier that performs edge classification. The classifier uses combined embeddings to predict whether a specific relationship exists between two nodes.

Figure 4: Visualization of the edge embedding
The dataset contains a source node, a destination node, and an attack label corresponding to this connection. Therefore, the objective is to create an edge embedding connecting the source and destination nodes and use it to predict the attack label. Edge embedding was first created for network attack prediction. The two vectors were then concatenated to form a single vector. This is passed through a classifier to train the model by predicting the attack label.
3.4 Explainability in Edge Classification
Explainable AI (XAI) techniques are crucial for providing clear and interpretable results in network attack prediction models based on graph structures. The XAI study is the process of determining which neighbors are important in the prediction of a model and clearly understanding the factors that influence the model’s decision. This approach enhances the model’s reliability and grants end-users a transparent understanding of how the model arrives at its predictions. In this study, we specifically focus on determining the critical neighboring nodes that affect the labels of target edges.
To enhance the transparency of our graph-based intrusion detection model, we propose a novel algorithm for explaining edge classification predictions. Our approach is motivated by the mean-field variational approximation (MFVA) technique, which is widely used in Bayesian statistics for approximating complex posterior distributions [30]. In many Bayesian inference problems, the true posterior
Inspired by MFVA, our algorithm estimates the influence of neighboring edges on a target edge’s prediction by treating each edge’s contribution as an independent factor. Instead of directly estimating the full joint distribution of influences, we perform iterative random masking within the region of interest (ROI) around the target edge. The model’s performance is evaluated in each iteration before and after masking. The difference in performance metrics serves as a proxy for the importance of the masked edges. Aggregating these differences over multiple iterations yields a robust estimate of the posterior distribution of edge importance.
Based on the above methods, the algorithm proposed in this study is shown in Fig. 5 and explained in detail in the following sections. Furthermore, the proposed algorithm is summarized in Algorithm 1. This method not only reduces the computational complexity associated with full posterior inference but also provides statistically meaningful insights into the internal decision-making process of our intrusion detection system.
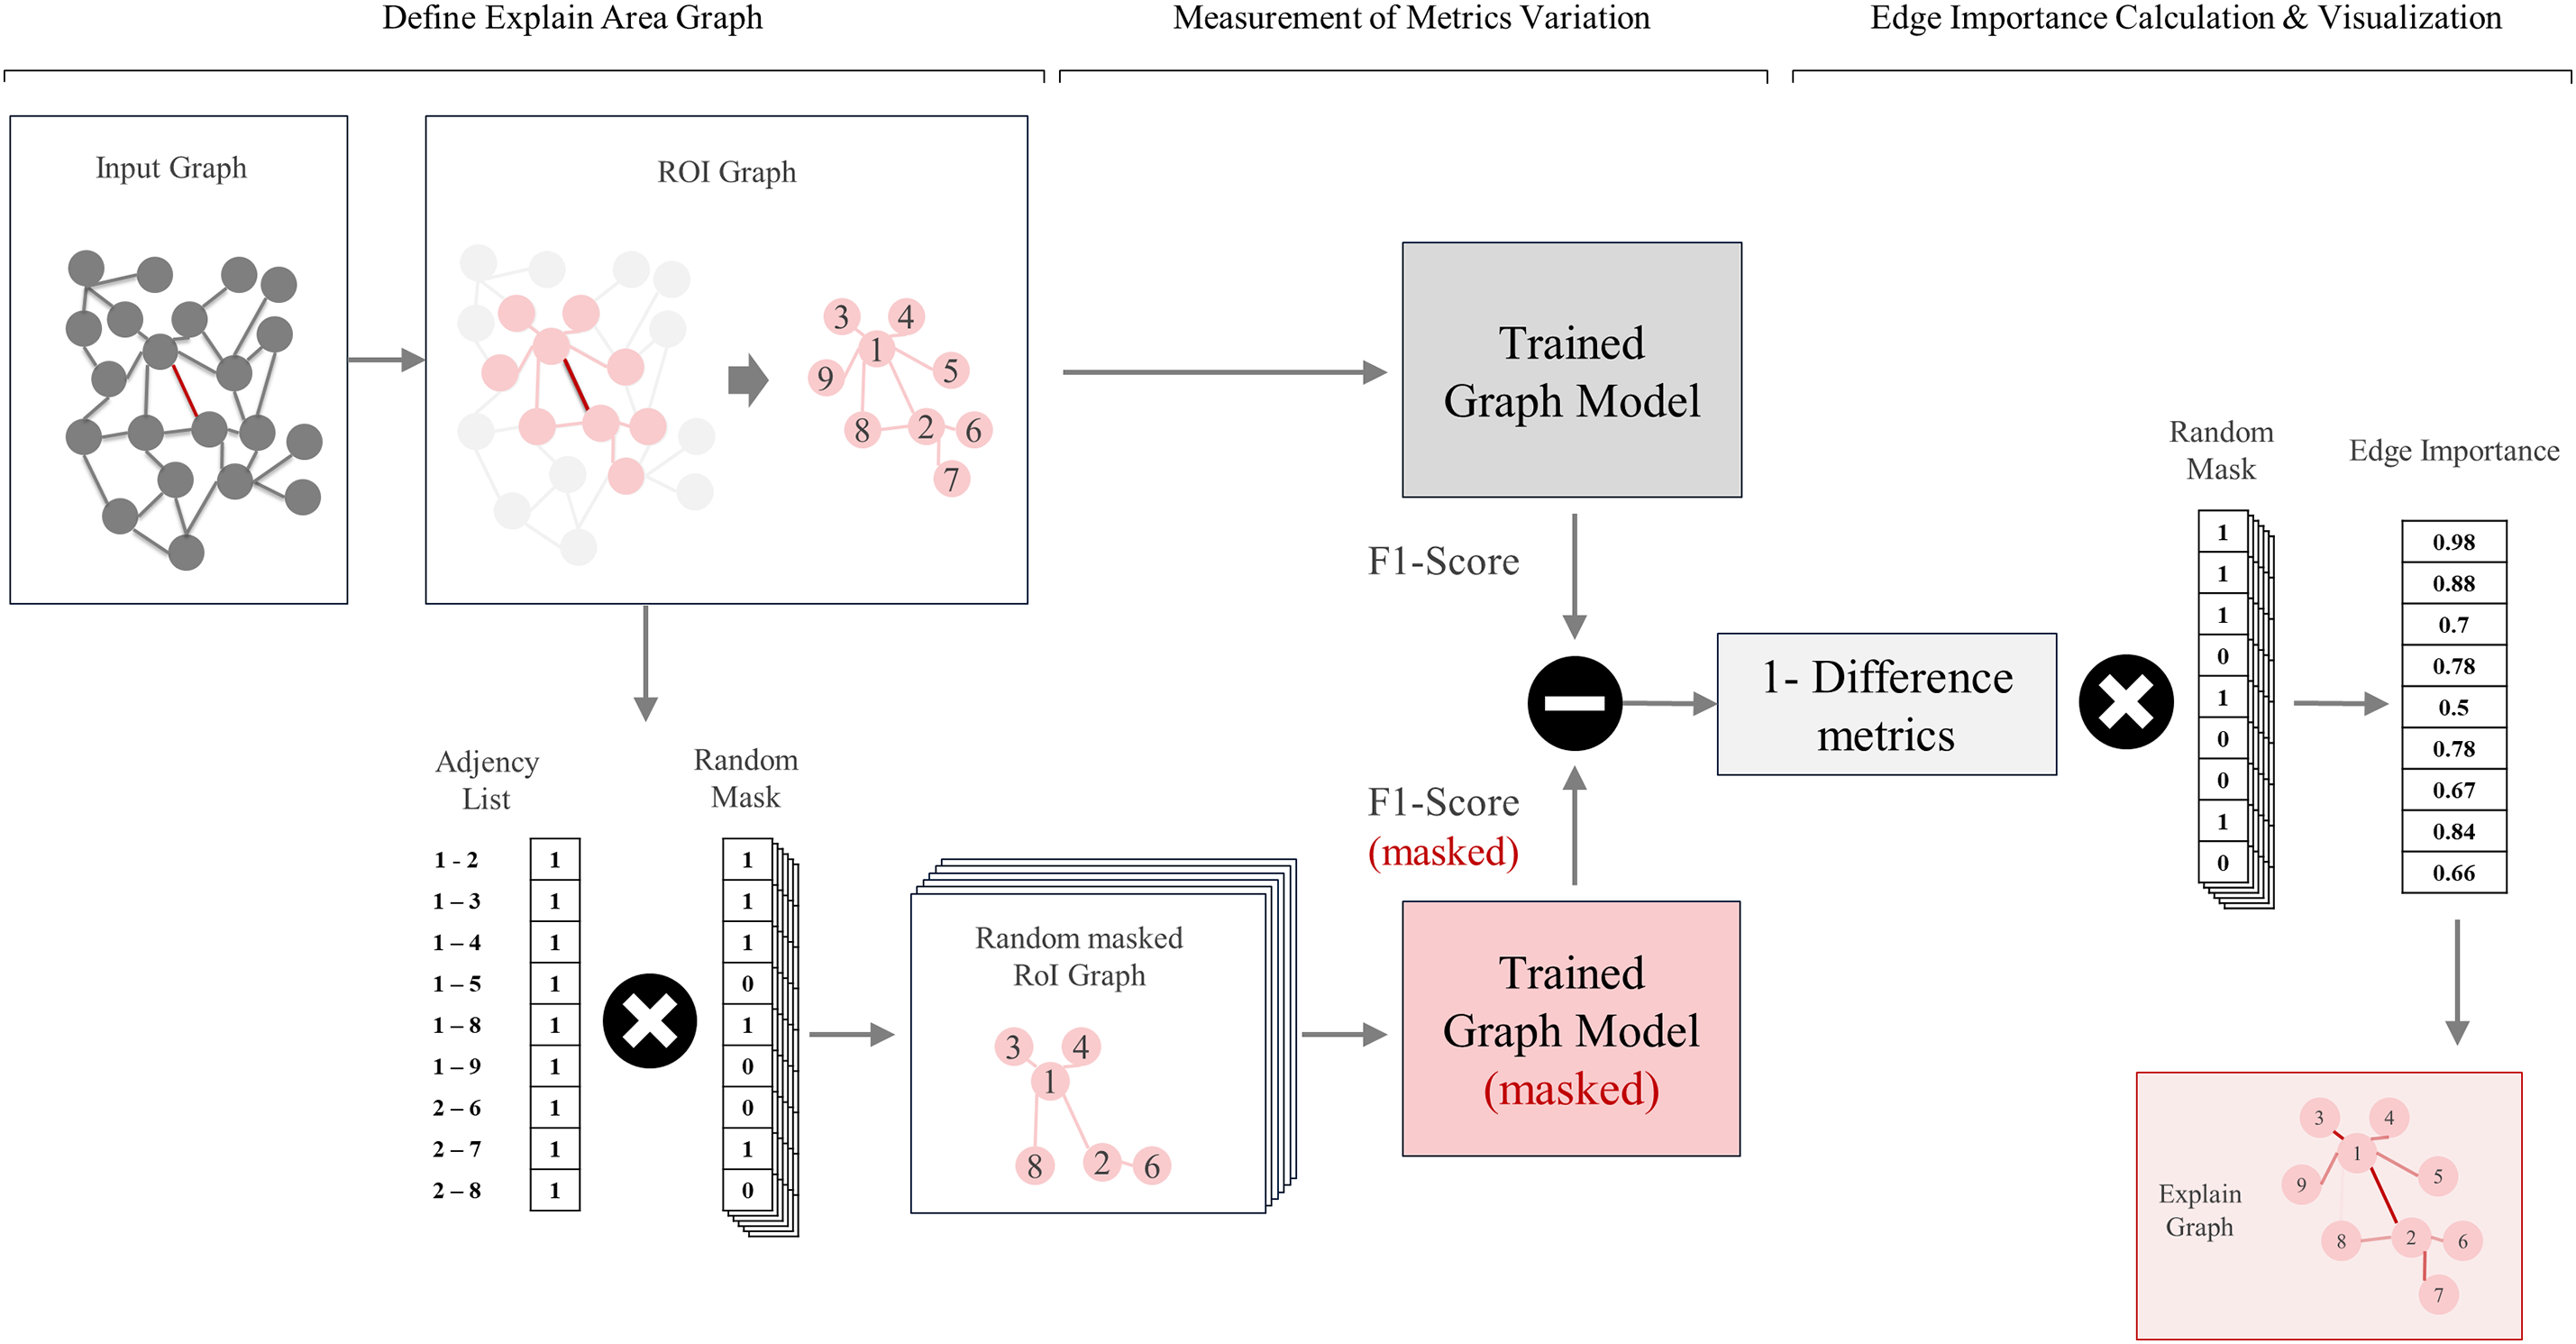
Figure 5: Process of the edge classification explanation algorithm
3.4.1 Components of the Explanation Method
1. Identification of Target Edges: First, select the specific edges to be analyzed. These edges form the focal point of the examination and are chosen based on their perceived importance or relevance in the network. For example, if one aims to evaluate the impact of a particular connection between critical nodes, that connection would be designated as the target edge for subsequent analysis.
2. Defining the Region of Interest (ROI): Setting the region of interest(ROI) based on a Target Edge across the entire network sets the ROI around the selected edge. This can include nodes and edges that are directly connected to the target edge to determine the scope of the analysis. Setting an ROI makes the analysis more efficient and allows us to focus on relevant information. The ROI is selected as the neighbor of the nodes connected to the edge in the region of interest. By constraining the scope to nodes and edges that are proximal to the target edge, we can more precisely evaluate the relevant interactions that may affect edge classification.
3. Random Masking of Neighbor Connections: Randomly mask the matrix that checks for neighboring edge connections. Generate a neighbor list that represents the connectivity between nodes within the ROI. Then, some of the values in this neighbor list are randomly masked to hide information. The rationale behind this masking step is to observe how the absence or presence of specific edges influences the model’s classification confidence. By systematically masking edges, we can quantify each edge’s contribution to the prediction outcomes.
4. Evaluation of Masking Effects on Model Metrics: Apply the pre-trained intrusion detection model to both the masked and unmasked versions of the neighbor list. Next, compute the difference in key performance metrics (e.g., accuracy, F1-score) between these two scenarios. Define
5. Iterative Posterior Distribution Estimation: To obtain a statistically robust estimation, the masking and evaluation process is repeated multiple times. Each iteration refines the distribution of importance for every edge in the ROI. By aggregating these iterative outcomes, one can derive a posterior distribution of importance that aligns with the principles of mean field variational approximation. This approach treats each edge’s contribution as an independent factor, enabling the method to scale without exhaustive combinatorial searches.
6. Visualization of the Posterior Distribution: Finally, leverage the aggregated importance distribution to produce a visual representation of edge significance. For instance, edges deemed critical could be highlighted with thicker lines or bolder colors in the network graph, allowing practitioners to quickly spot high-impact connections. By examining these variations in color and thickness, one can easily determine which neighboring edges are the most influential, thus guiding more targeted investigation or remediation efforts in a network security context.
3.4.2 Algorithmic Formalization of the Explanation
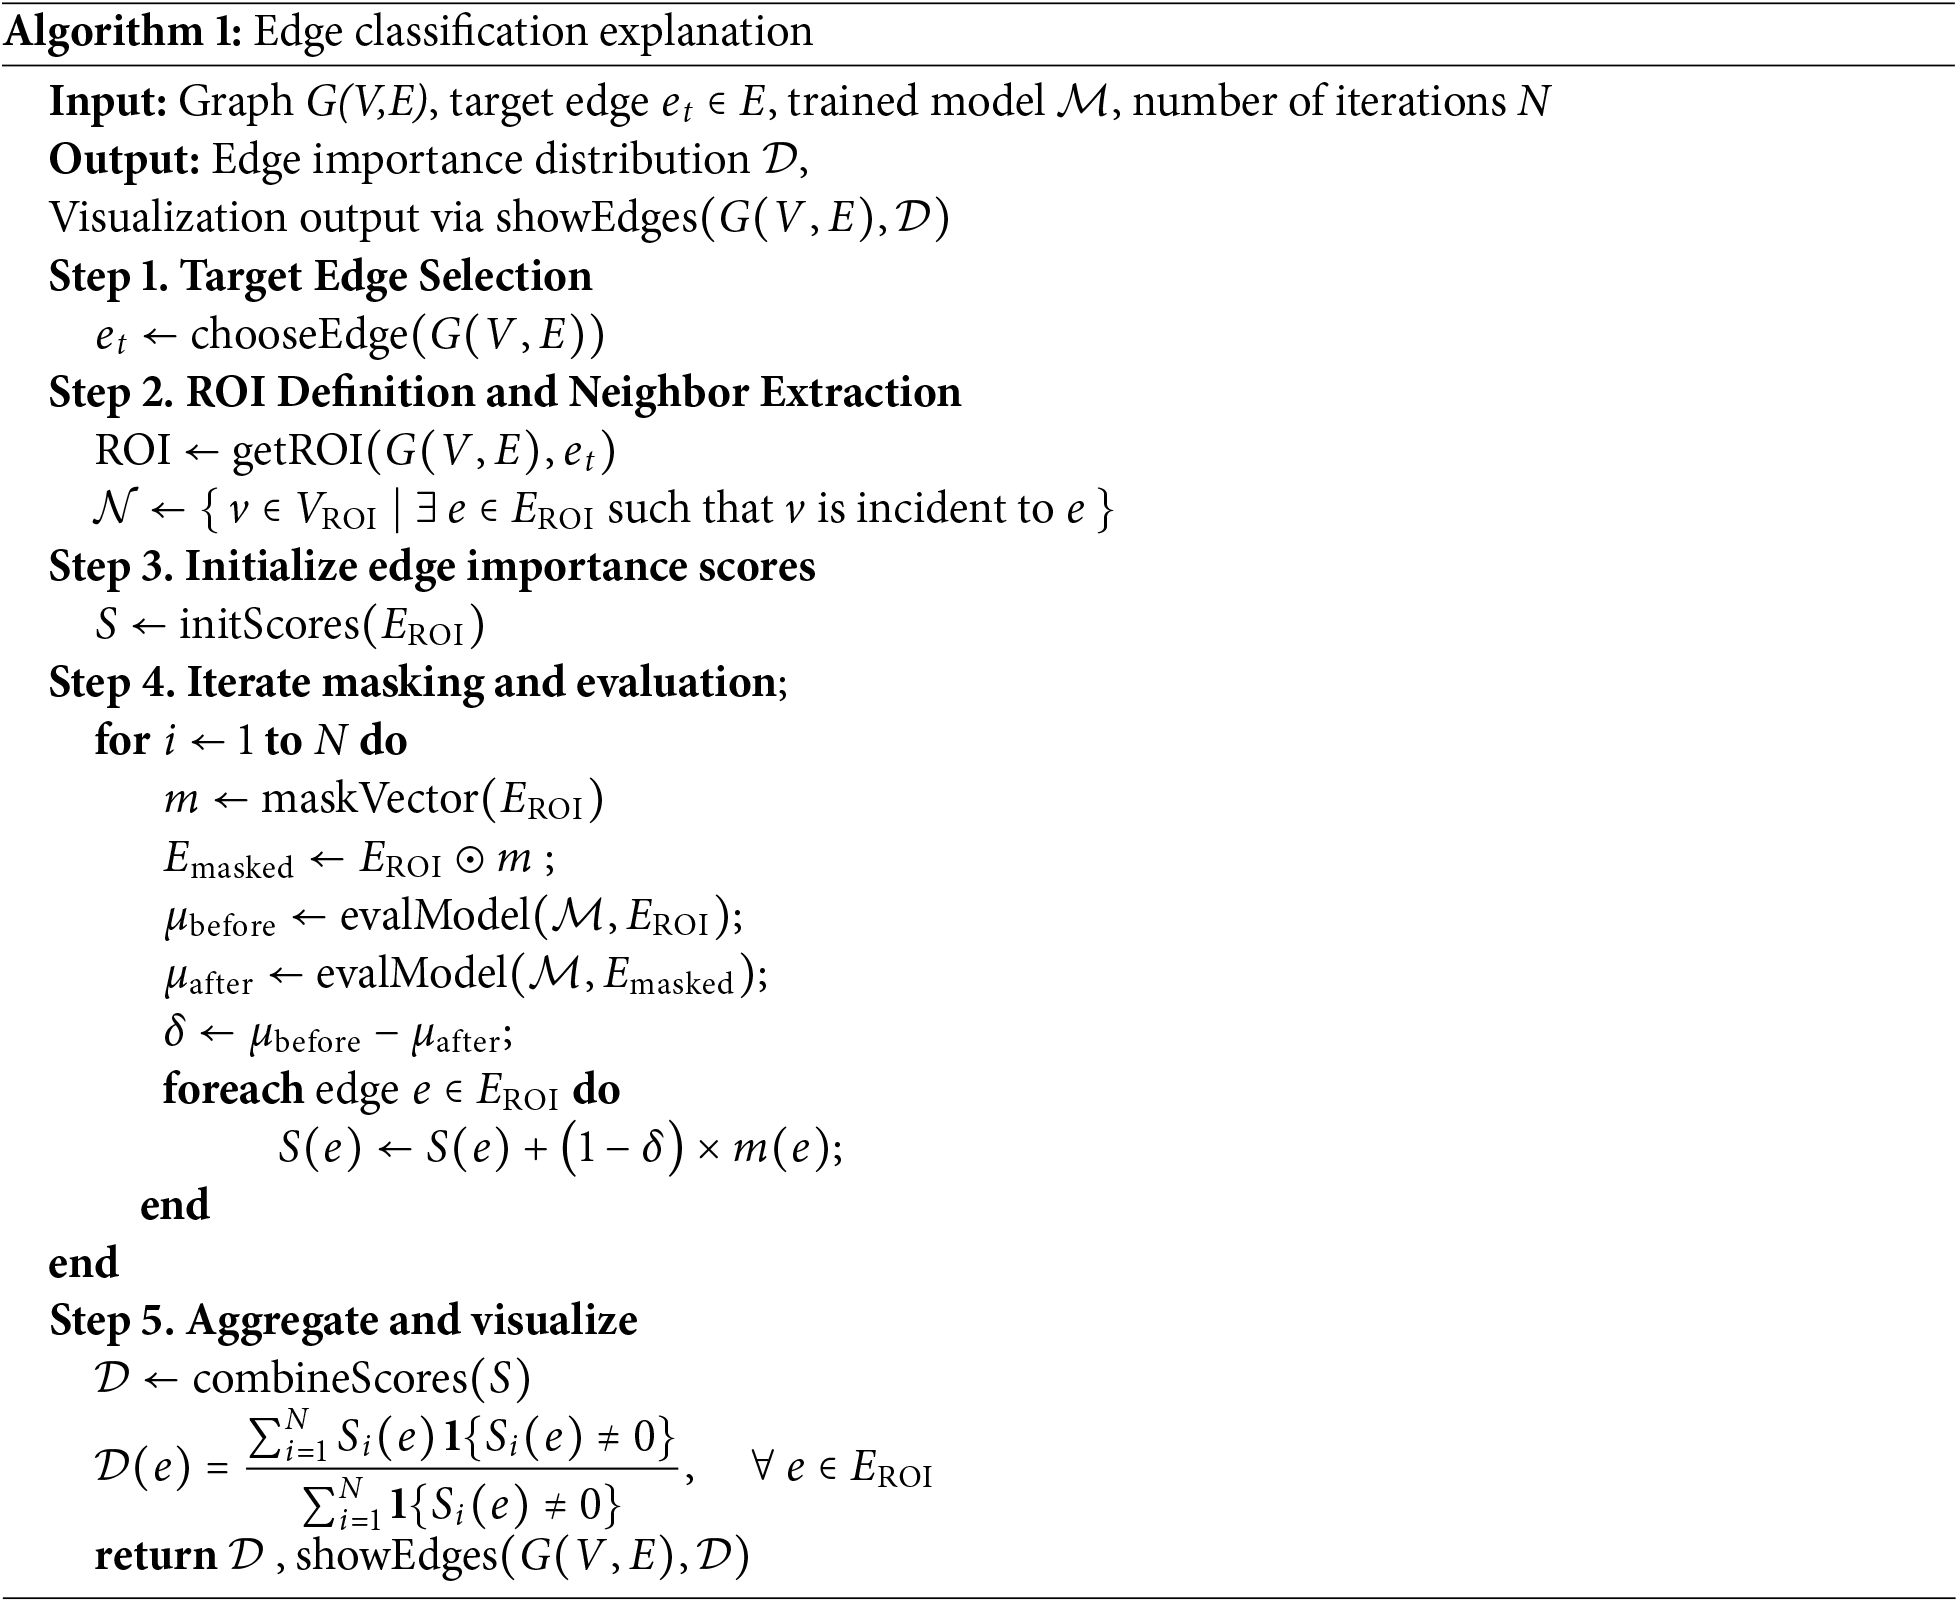
The decision-making process of the GNN-based edge classification model is explained through the proposal of a localized explanation method based on randomly masking, as formally described in Algorithm 1. The goal of this method is to estimate the contribution of each edge within a designated Region of Interest (ROI) to the model’s prediction for a specific target edge
Let
At each iteration
We then compute the model’s score for the target edge
To quantify edge-wise importance, we initialize a score vector
After performing N iterations, the final edge importance distribution
The resulting distribution
In summary, this edge-level explanation algorithm offers a systematic way to assess how individual connections within a network graph affect classification results. By integrating a mean field variational approximation concept, the method efficiently handles large or complex network structures. Such interpretable insights can enhance user trust in the detection model’s predictions, enabling more informed decision-making in network security scenarios.
1. CIC-IDS-2017: The CIC-IDS-2017 dataset is widely used for network security and intrusion detection. Provided by the University of New Brunswick, it includes various real-world attack types such as DDoS, port scans, brute force, and web attacks.
2. NF-CIC-IDS 2018-v2: The NF-CSE-CIC-IDS2018-v2 dataset is a NetFlow-based version generated from original pcap files. It contains 18,893,708 flows, including 2,258,141 attack samples and 16,635,567 benign samples [31,32].
3. NF-TON-IoT-v2: This dataset evaluates AI-based cybersecurity applications in IoT. It includes telemetry, OS, and network traffic data collected from a realistic network environment at the Australian Defence University [31].
4. NF-UNSW-NB15-v2: Developed by the University of New South Wales, this dataset includes worms, trojans, DoS, and botnet attacks along with normal traffic, and reflects real-world-like simulated traffic [31,33].
5. NF-BOT-IoT-v2: This IoT NetFlow-based dataset includes 37,763,497 flows, with 37,628,460 labeled as attacks across four categories. Features were extracted from publicly available pcap files [31,34].
6. NF-UQ-NIDS-v2: The NF-UQ-NIDS-v2 dataset consists of flows from multiple network setups and attack types. It includes a label for the original dataset source and merges specific attacks into broader categories such as DoS, DDoS, and brute-force [31].
4.1.2 Graph Construction and Data Partitioning
The graph learning methodology proposed in this study was designed with optimal efficiency, allowing for effective learning from large-scale graph data. To accurately represent complex network structures, the entire dataset was used to construct a multi-graph. In this process, a transductive learning technique was applied to create an entire graph without labels of previously known test data. However, structural characteristics and attribute information are also included in the learning process [35].
Transductive learning generally has the disadvantage of degraded predictive performance for completely new data that are not encountered during the learning process. However, the Graph Sage model we adopted has an advantage in that it can overcome this limitation. Graph Sage uses a sampling mechanism that aggregates information from neighboring nodes during the learning process, allowing the model to effectively learn the local structure of a graph [21].
The composition of the learning data consists of each data point with a start node, an end node, and an attack classification label for that connection. We established a systematic data-splitting strategy to effectively utilize these data. Specifically, while maintaining the ratio of attack labels, we used a specific number as a Random Seed to randomly shuffle the data and then split the entire dataset into training, validation, and test sets at ratios of 60.
In the model’s learning process, we adopted a mini-batch approach that considered computational efficiency and learning. Each mini-batch consists of 1000 samples, which allowed us to maintain a relatively short update cycle for the model parameters. This approach has the advantage of allowing the model to converge faster on large-scale graph data and reducing the risk of falling into local optima.
4.1.3 Implementing Contrast Models
In this study, we used the NetFlow-Edge Generated Subgraph Contrast (NEGSC) model, a self-supervised graph representation learning method for network intrusion detection, as the contrast model. The implementation of NEGSC begins with the transformation of the NetFlow data into a graph structure. We used an encoder called NetFlow-Edge Graph Attention Network (NEGAT), which enhances the aggregation of information between adjacent flows by utilizing edge features through a self-attention mechanism. We constructed a self-supervised learning method that contrastive subgraphs from sampled central nodes and their immediate neighbors and optimized the model using a structured contrastive loss function. Detailed implementation methods have allowed further exploration [36].
In this study, we implemented a deep learning-based intrusion detection system (IDS) based on a deep neural network (DNN) model as a comparison model. This approach builds further insights into previous research that combined network and host-based intrusion detection [37]. The model consisted of three layers: an input layer, multiple hidden layers, and an output layer. The hidden layers utilize rectified linear unit (ReLU) activation functions, while the output layer uses a softmax function. To optimize the process, the Adam optimizer was used with categorical cross-entropy as the loss function. The model was trained for up to 100 epochs, with learning rates adjusted between 0.01 and 0.5. Hyperparameters such as batch size, number of hidden layers, and number of neurons per layer were optimized through a grid search. To prevent overfitting, dropout was applied, and the weights were initialized using the He initialization method. Additionally, early stopping was implemented to enhance learning efficiency and further mitigate overfitting.
XGBoost is a scalable tree-boosting system that can handle large-scale datasets efficiently [38]. This system results in superior predictive performance and rapid training speed across various machine learning tasks, making it an excellent choice as a comparison model in our study. In our implementation, we first applied data preprocessing techniques, including onehot encoding for categorical variables and min-max scaling for numerical features. The XGBoost model was then configured with hyperparameters optimized through a grid search. Specifically, we set n-estimators between 100 and 500, max-depth between 3 and 5 to prevent overfitting, learning rate from 0.01 to 0.3, and min-child-weight between 1 and 5. Throughout the optimization process, cross-validation was used to assess and enhance the generalization performance of the model. This comprehensive approach ensures that our XGBoost model is well-tuned to deliver optimal results for network anomaly detection tasks.
This study used metrics such as the F1-Score and Accuracy values to calculate the classification accuracy.
The F1-Score is the harmony between the precision and recall of the model. These metrics were used to evaluate the performance of the model in an imbalanced dataset comprehensively. Here, precision is the ratio of precisely predicted positive observations to the overall positive observation values. Recall is the ratio of the predicted positive observation values to all observations of the actual class. In addition, to determine the precision and recall values, the values of TP, TN, FP, and FN must be calculated. Accuracy is the percentage of all classifications made correctly. This can be expressed as follows in a formula:
4.2 Network Attack Classification Experiment Analysis
In this study, the datasets were used for network attack detection. XGBoost, DNN, and NEGSC models were used for comparison with the proposed model. The XGBoost model is a representative machine learning model used in many areas and network attacks. The Deep Neural Network (DNN) model is a representative model that detects complex network attack features by creating a deep layer with a multi-layer perceptron. The NetFlow-Edge Generative Subgraph Contrast (NEGSC) model is an application of GNN to differentiate the specific types of networks in an unsupervised manner [36]. Table 2 lists the experimental results obtained using these models.

On the CIC-IDS-2017 dataset, all models—including the proposed model, XGBoost, and DNN—achieved F1-Scores and Accuracy metrics of 0.97 or higher. Since the dataset contains a much higher proportion of benign classes, all models—including XGBoost and DNN—achieved high performance overall. For the NF-CIC-IDS-2018-v2 dataset, all models except DNN maintained metrics of 0.96 or higher. These scores were somewhat lower than those from CIC-IDS-2017 due to over 15 target variables, yet still demonstrated excellent detection performance. The NF-UNSW-NB15-v2 dataset also featured a high percentage of steady-state data, similar to CIC-IDS-2017, leading to good overall metrics. Here, the DNN model obtained the highest metric.
The NF-TON-IOT-v2 dataset, with its more than ten features and even data distribution, resulted in lower metrics across all models compared to other experiments. As this data is IoT-related, packet-level importance outweighs network relationships. Indeed, models like XGBoost and DNN, which don’t emphasize relationships, exhibited better performance. The NF-BoT-IoT-v2 dataset, having only a few target classes, yielded high overall metrics, and the proposed model achieved the highest performance. Finally, the NF-UQ-NIDS-v2 dataset, which combines all v2 network attack types and represents the largest number of data points, also saw the proposed model obtain the highest metrics.
It is important to note that evaluation based solely on raw performance metrics may not accurately reflect a model’s practical detection capability. For instance, while most algorithms yielded favorable numerical results on the CIC-IDS-2017 dataset, the overwhelming presence of benign traffic substantially hindered the identification of malicious activities. In this context, the GNN-based approach demonstrated only marginal improvement, suggesting that relational learning offers limited advantage in highly imbalanced scenarios. Conversely, graph-oriented methods displayed more consistent generalization when applied to datasets containing a variety of attack types and sparse annotations. Specifically, on NF-CIC-IDS-2018-v2, the DNN experienced a considerable decline in detection rates, while the proposed method capitalized on relational cues to more effectively identify infrequent classes.
Furthermore, in IoT network environments with weak structural relations, conventional feature-based classifiers like XGBoost and DNN achieved higher performance than graph-based techniques. Experiments on NF-ToN-IoT-v2 corroborated this, showing limited utility of structural modeling when relational context is insufficient, as tree-based and neural models outperformed their graph-based counterparts. Conversely, in settings with repetitive and consistent communication patterns, graph-based approaches demonstrated marked efficacy. For instance, on NF-BoT-IoT-v2, such pattern regularity allowed the proposed model to attain the highest performance despite the dataset’s structural simplicity. Finally, when applied to realistic, noisy, and heterogeneous traffic from the NF-UQ-NIDS-v2 dataset, the graph-based learning model exhibited robustness and adaptability, sustaining stable detection rates amid annotation noise and varied attack modalities. These findings suggest that while model effectiveness is context-dependent, the graph-based approach offers significant advantages in complex and heterogeneous network conditions due to its enhanced generalization capabilities.
4.3 Analysis of Data Imbalance Mitigation
In the domain of network intrusion detection (IDS: Intrusion Detection System), real-world data consists predominantly of benign traffic, with only a small fraction representing attack traffic, thereby giving rise to a severe data imbalance problem. For example, in real-world traffic log collections, benign traffic often accounts for more than 90% of the data, while certain types of attacks account for less than 1%. This skewed distribution increases the likelihood that the model will fail to learn the minority attack class correctly, thereby increasing the risk of missing actual intrusions (i.e., a high false negative rate). Furthermore, for attack types with insufficient data, the model may have difficulty learning adequate features, resulting in reduced accuracy. Consequently, enhancing detection performance for various attack types, despite their minority representation, is a critical challenge in IDS research. To address the data imbalance issue, experiments have been performed.
To address this problem, experiments were conducted using the data ratios presented in Table 3 Class Distribution, combining various sampling techniques with cost-sensitive learning.

Under-sampling is a technique that mitigates data imbalance by artificially reducing the number of samples in the majority class (e.g., benign traffic), thereby increasing the relative proportion of the minority class (e.g., attack traffic). While this approach is easy to implement and can improve the detection rate for the minority class to some extent, Under-sampling can result in significant information loss due to insufficient training on benign data [39]. In this experiment, under-sampling was implemented by randomly removing benign data while preserving the attack data to achieve a balanced distribution. In order to mitigate information loss, one-fourth of the total benign samples were retained while the remainder were removed.
The over-sampling technique is a data augmentation method that increases the number of minority class samples by artificially increasing the number of minority class samples. A notable example is SMOTE (Synthetic Minority Over-sampling Technique), which generates synthetic samples at intermediate points based on the distances between existing minority class samples, thereby ensuring greater diversity than simple replication [40]. This technique has been shown to substantially expand the learning opportunities for the minority class and improve key metrics such as recall. However, it is important to note that excessive augmentation may increase the risk of overfitting the minority class. In the present experiment, the benign data (majority class) were left unchanged, while only the minority class was augmented using the SMOTE technique. The augmentation was calculated-without being excessive-to preserve the original distribution characteristics by adjusting the size of the augmented data depending on whether the original data proportion was at least 1%, between 0.1% and 1%, or below 0.1% for extremely rare classes.
The Hybrid Sampling method effectively addresses data imbalance by appropriately combining oversampling and undersampling. To reduce the number of samples from the majority class while increasing the number of samples from the minority class, for example, the disadvantages of each method are balanced out. This approach is a relatively natural balance of class distributions, while avoiding the extremes of excessive benign data loss or overfitting in the minority class. In the experiment, under-sampling was applied to the benign data (majority class), while the proportion of attack data (minority class) was incrementally increased to prevent excessive augmentation.
Cost-sensitive learning is an approach that encourages a classification model to reduce specific errors (e.g., missed attacks) by training it with different error costs for each class. To improve the performance of an IDS, for example, if the cost of missing an attack is set significantly higher than the cost of misclassifying benign traffic, the model is incentivized to improve its accuracy for the minority class (attacks). This approach has been shown to be effective in maximising specialized metrics under imbalanced conditions [39]. Furthermore, when combined with under-sampling or over-sampling, it can render the model even more responsive to the minority class. In the experiment, costs were defined as the reciprocal of each class’s proportion in the overall data, and these values were incorporated into the loss function via a cost matrix to assign different weights.
A separate experiment for each case was conducted, comparing scenarios with and without cost-sensitive learning (CSL). The evaluation metrics employed were the F2-score and recall. The F2-score, being the harmonic mean of precision and recall, places greater emphasis on recall. In the context of IDS, the security implications of false negatives (i.e., missed attacks) are significant; consequently, it is crucial to emphasise recall when assessing the model’s detection efficiency. The F2-score was selected as it further reinforces the objective of “non-missed detection” relative to the F1-score [41]. The recall metric represents the proportion of actual attack samples that the model correctly predicts as attacks, reflecting its ability to detect attacks without missing an attack. Consequently, as this study focuses on the non-missed detection of attacks, recall was selected as the main metric.
A synthesis of the results presented in Table 3 Evaluation Metrics reveals that various techniques aimed at addressing class imbalance have a clear impact on overall performance metrics, namely Macro F2-score and Average Recall. The baseline model demonstrated relatively low performance, with a Macro F2-score of 0.668 and an Average Recall of 0.658. The application of cost-sensitive learning (CSL) alone resulted in a modest improvement. In contrast, both under-sampling and over-sampling techniques led to increases in Macro F2-score and Average Recall, with over-sampling demonstrating a remarkable improvement to a Macro F2-score of 0.877 and an Average Recall of 0.864. The hybrid sampling technique, by effectively combining the strengths of both under-sampling and over-sampling, achieved slightly superior performance compared to the individual methods. Furthermore, when combined with CSL (hybrid-sampling + CSL), it attained the highest performance with a Macro F2-score of 0.884 and an Average Recall of 0.875. These results indicate that integrating various sampling strategies with cost-sensitive learning enhances the detection performance for the minority class in imbalanced data scenarios compared to applying a single technique alone. This experimental outcome demonstrates the efficacy of an integrated approach combining hybrid sampling and cost-sensitive learning (CSL) as a realistic strategy for effective attack detection in real-world operational environments.
As shown in Fig. 6, the combined approach of hybrid sampling and cost-sensitive learning (CSL) achieves an overall superior F2 score compared to the baseline. Notably, significant performance improvements were observed in attack types corresponding to minority classes, such as Bot, Infiltration, XSS, and SQL Injection, suggesting that the issue of missed detections due to data imbalance has been effectively addressed. Although some DoS and DDoS attacks already exhibited relatively high performance in the baseline, the application of hybrid sampling combined with CSL yielded additional slight improvements. In addition, stable performance was maintained in classifying benign traffic, indicating a balanced learning effect in all classes. These findings demonstrate that the combination of hybrid sampling and CSL not only enhances the detection rate for the minority class in IDS environments but also preserves the characteristics of benign traffic, thereby validating this integrated approach as an effective strategy for handling imbalanced data.
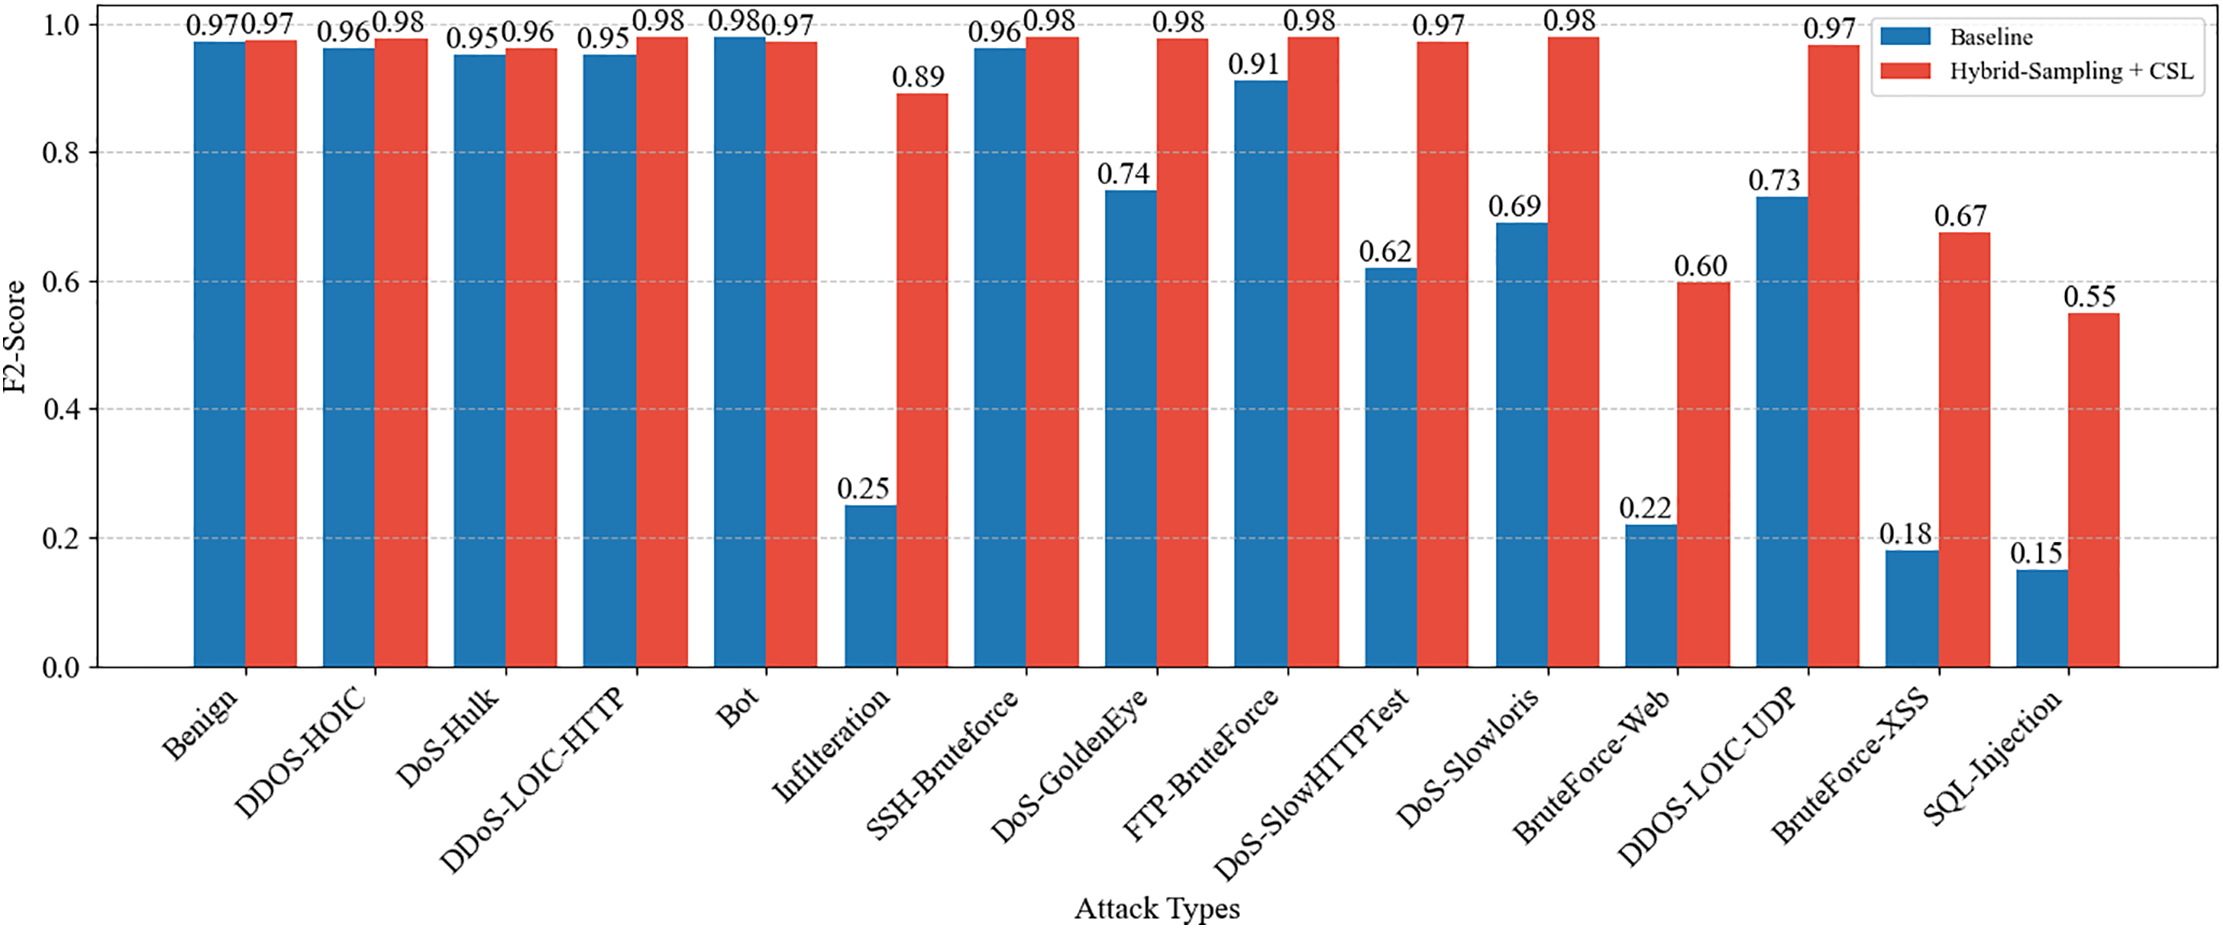
Figure 6: Class-wise F2-Scores: Baseline vs. Hybrid-sampling + CSL
4.4 Analysis of Resource Efficiency
In this study, we evaluated the feasibility of real-time inference in a network environment by assuming 5000 concurrent network requests. To simulate this scenario, we partitioned 5000 data points into batches of 100 and conducted 50 iterative inference processes to measure the total inference time. The experimental environment was designed to be applicable across various settings by utilizing relatively modest computing resources at a general desktop level. The specific configuration is as follows.
• Dataset: NF-TON-IOT-v2
• CPU: Intel Core i7-12700k
• GPU: NVIDIA GeForce RTX 4060
• RAM: DDR5-32GBytes
• Package:
Python Version 3.8.20
• TensorFlow Version: 2.13.0
• PyTorch Version: 1.13.1+cu116
• CUDA Version: 11.6
This process was repeated five times to calculate the average inference time, resulting in 225 ms for the proposed model, 820 ms for the DNN model, 220 ms for the XGBoost model, and 950 ms for the NEGSC model in Fig. 7.

Figure 7: Inference time comparison across models
The proposed model is based on GraphSAGE, which maximizes computational efficiency by efficiently aggregating neighbor node information in a graph structure. Specifically, it employs an optimized compression technique that preserves essential features while reducing the number of parameters, thereby offering faster inference speed than traditional deep learning models. Consequently, GraphSAGE not only outperforms conventional deep learning models but also demonstrates superior inference performance compared to other graph-based models, confirming that neighbor embedding aggregation and parameter optimization are critical factors in reducing inference time.
Additionally, while some latency may occur in a real-world network environment, it is expected that small-scale data requests can be processed within an average of 10 milliseconds. Even in large-scale graph analysis environments, efficient processing can be achieved with minimal computing resources, significantly enhancing overall system efficiency. In particular, GraphSAGE-based models are expected to play a crucial role in resource-constrained IoT environments and real-time security detection systems.
In conclusion, the experiments conducted in this study demonstrated that the GraphSAGE-based model can provide rapid inference performance in network environments. This enables real-time analysis without the need for high-performance hardware and suggests its potential applicability in scalable large-scale data analysis.
4.5 Edge Classification Explain Algorithm Experiment
In this paper, we propose a novel methodology for network attack detection and describe it using graph theory. Specifically, we adopted an approach that established specific regions of interest (ROIs) within each dataset and evaluated the importance of their connections to their neighbors. The key to this methodology is to selectively analyze regions of interest that are up to one hop away from the original network graph. The goal of this analysis is to extract only the most important subgraphs from the original graph to provide a clear explanation of the prediction results.
The methodology presented in this paper allows selective extraction of only the subgraphs deemed important. In Figs. 8 and 9, two-hop neighbors of a particular node from the NF-TON-IoT and NF-UNSW-NB15 datasets, respectively, were randomly selected. In these figures, the area marked in red represents the central target edge, and the relationship between this edge and the adjacent nodes and edges was closely analyzed to remove the less important connections, leaving only the highly important edges. This process resulted in the removal of more than one-third of the edges in each graph, which simplified the overall network structure while leaving only the core neighbors. This methodology allowed us to clearly identify which nodes and edges were involved in the attack. This has important implications for applications in the security field. By rapidly and accurately identifying the key components involved in a network attack, it is possible to trace the source and path of the attack and provide effective guidance in developing countermeasures to prevent similar attacks in the future.
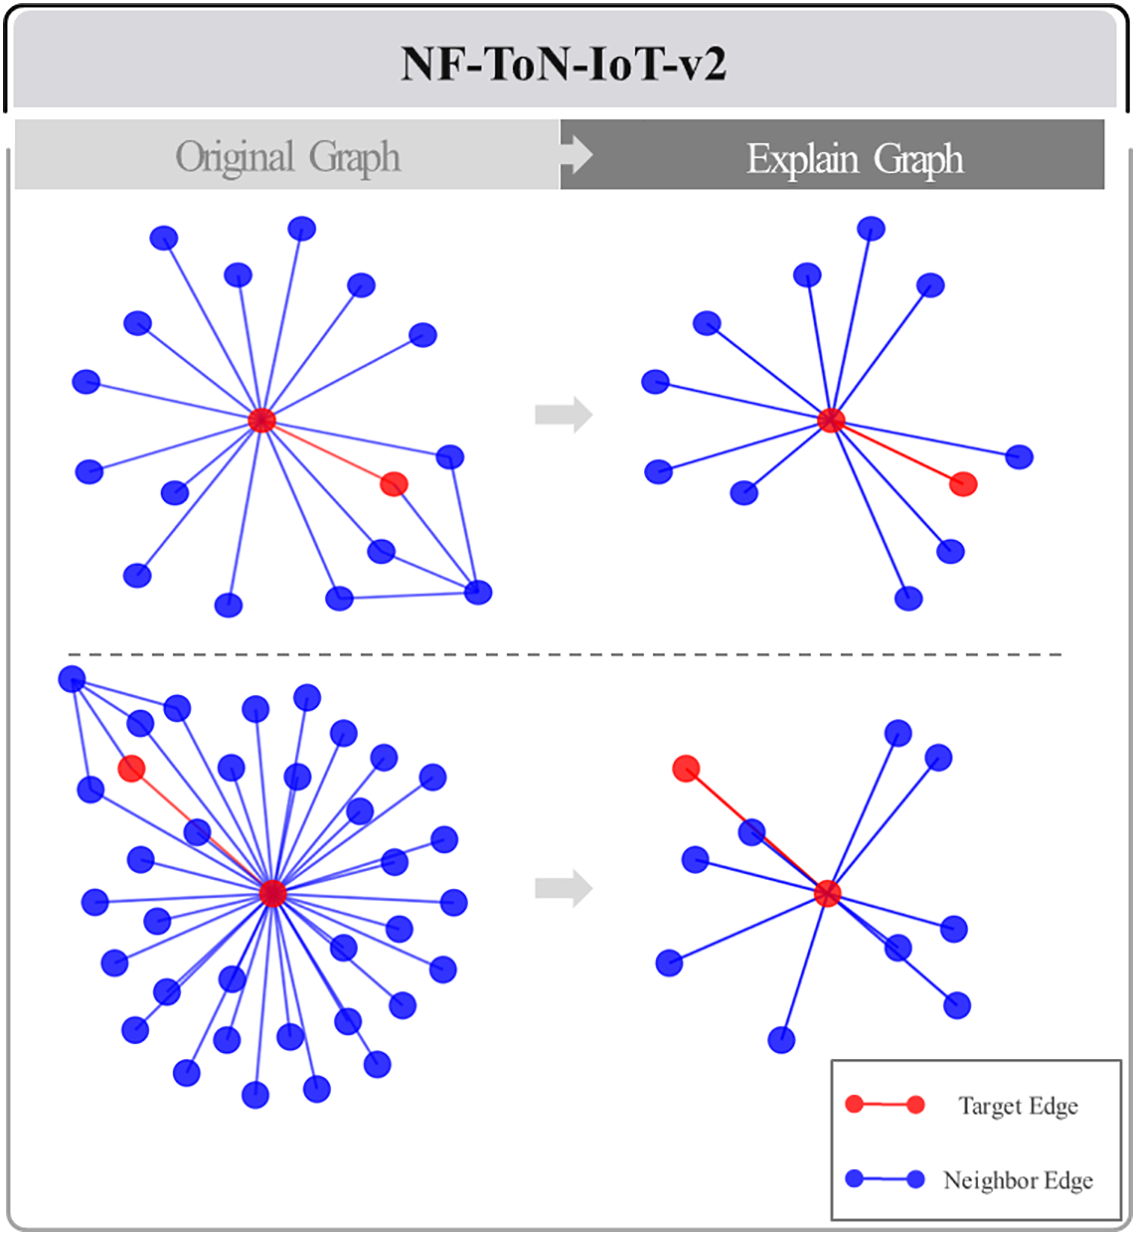
Figure 8: Extracting subgraphs from region of interest graphs from NF-ToN-IoT-v2
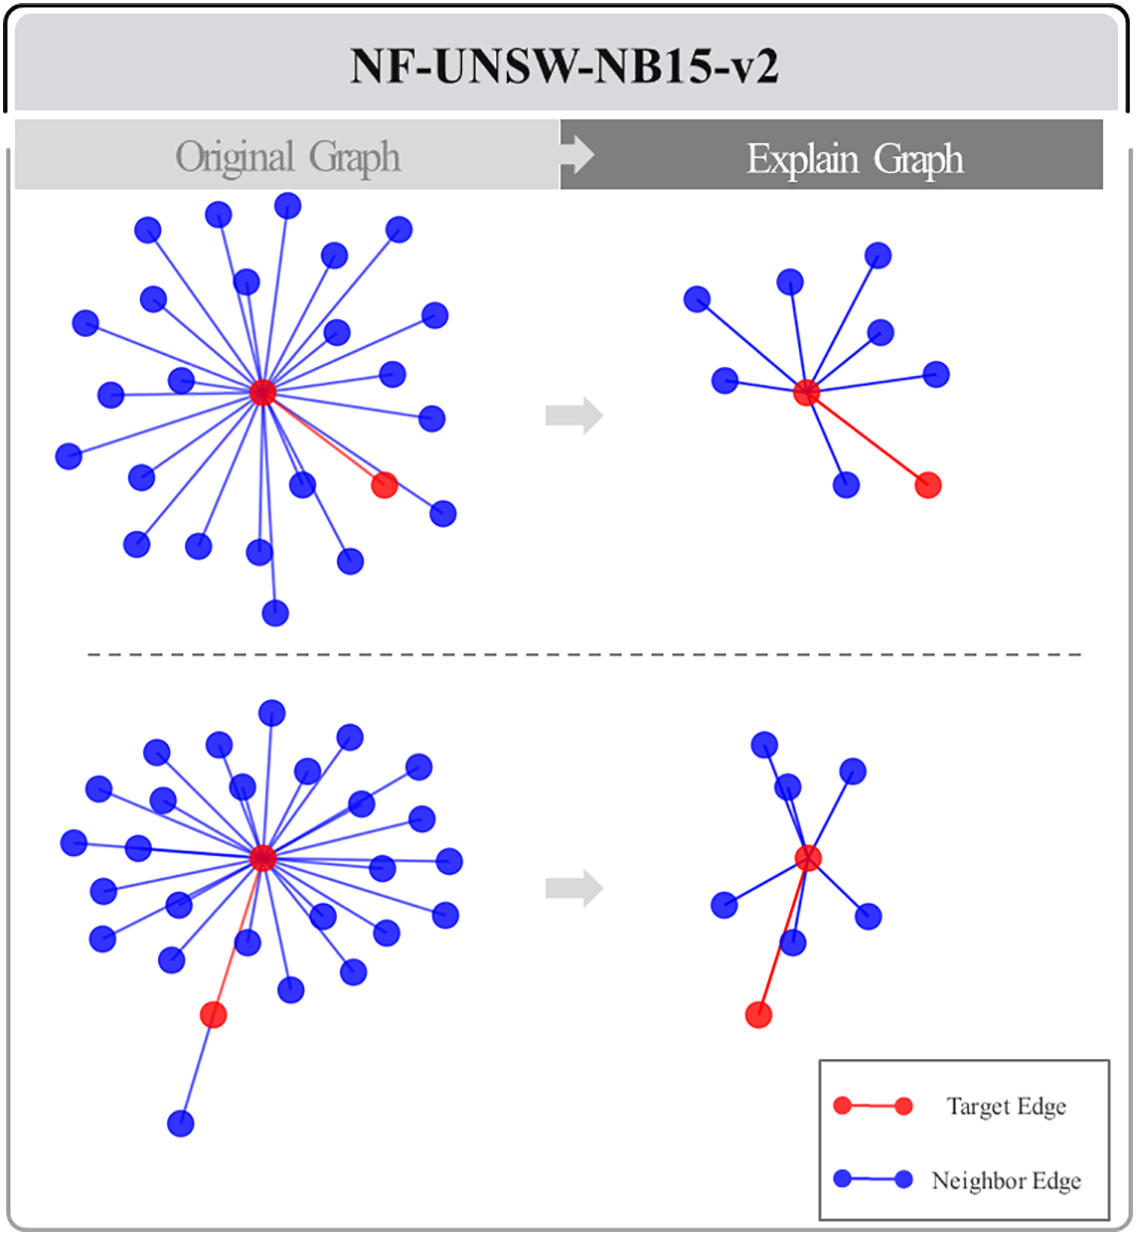
Figure 9: Extracting subgraphs from region of interest graphs from NF-UNSW-NB15-v2
To further elaborate, given a target edge
where
In conclusion, the methodology proposed in this study will serve as a useful reference for researchers in the field of network security and is expected to contribute to the development of network attack detection and defense technologies in the future.
5.1 Advanced Techniques for Mitigating Data Imbalance
In this study, we experimented with a GraphSAGE-based network attack detection model. To reduce the negative effects of data imbalance on model performance, we applied various sampling techniques and cost-sensitive learning (CSL) methods. These improved methods proved more effective than traditional approaches at reducing overall data imbalance. Moreover, combining CSL significantly boosted key performance metrics, including Recall and F2-score. However, performance gains for the minority class—representing a small portion of the data—remained limited, and the imbalance was not fully resolved. The dominance of benign traffic made it difficult to effectively train on the minority attack data, showing that conventional sampling techniques alone are not enough in real network environments.
In future research, it is essential to study ways to augment minority class data using novel data augmentation and self-supervised learning techniques. At the same time, exploring different sampling methods to develop optimal data strategies for network environments could further improve real-time traffic analysis and attack detection accuracy.
Furthermore, integrated methodologies are urgently needed to address data imbalance in large-scale network environments. Such methods should continuously monitor data distribution through real-time traffic analysis and automatically adjust sampling strategies and CSL parameters. Ultimately, this approach will maximize the accuracy and stability of minority class detection in real-world settings, thereby greatly enhancing the reliability and efficiency of security systems.
5.2 Integrating Static and Dynamic Models for Enhanced Network Intrusion Detection
In this study, we model the network environment as a static graph, representing individual packets and traffic flows as nodes and edges, to analyze their interrelationships. Conventional static graph models assume a fixed structure, enabling effective learning of overall traffic patterns and relationships between neighboring elements. Static models are expressive, computationally efficient, and stable. We apply GraphSAGE to efficiently embed neighboring node information at minimal computational cost, effectively analyzing static network conditions. Furthermore, we introduce an explainability framework analyzing edge influence to provide rationale for model predictions.
However, modern network environments are highly dynamic—with continuously changing IPs and ports and attackers adopting novel techniques—exposing the limitations of relying solely on static models. Fixed-edge classification depends on historically learned patterns, limiting detection of new attack vectors such as zero-day exploits. Spatial-temporal graph models improve IoT intrusion detection by combining spatial-temporal feature extraction with BiLSTM [42]. DIGNN-A enhances real-time detection using line graph transformation and multi-head attention [43].
While these dynamic models handle real-time data and evolving scenarios, they suffer from high computational costs, memory consumption, and instability due to noisy data. In contrast, our proposed static graph-based model offers computational efficiency, structural simplicity, and robustness to transient noise, making it well-suited for deployment in resource-constrained environments. Moreover, by introducing a novel edge-level explainability framework, our model not only ensures interpretable decision-making but also supports effective offline training and batch processing, which are essential for stable and scalable intrusion detection systems. These advantages highlight the practicality of our approach in real-world settings, particularly when rapid response and transparent reasoning are required under limited system resources.
Therefore, a hybrid approach is needed that retains static models’ efficiency and stability while integrating dynamic models’ real-time responsiveness. Such models learn static graph structure but update periodically to accommodate evolving traffic, enabling rapid response to novel threats like zero-day attacks. For example, the E-T-GraphSAGE (ETG) model [44] integrates GNNs with Transformer architectures to handle complex structures and temporal dependencies concurrently.
In the future, establishing hybrid frameworks that detect static and dynamic attack characteristics simultaneously is essential. Incorporating explainability frameworks will help security professionals quickly understand detected attack paths and features.
This study presents a neural network approach to predicting network traffic attacks using a graph-based model to effectively represent the structure and interactions within a network. GraphSAGE, a graph-based model, was adopted to capture the complex characteristics of network traffic data. The model demonstrated superior or competitive performance through extensive experiments on six public benchmark datasets, including CIC-IDS-2017 and NF-UNSW-NB15-v2, highlighting its stability and effectiveness over existing methods.
Moreover, this work introduces an innovative solution to the edge classification problem—a relatively unexplored area in current research. A new algorithm improves visualization of interconnections between network neighbors by probabilistically modeling relationships in the graph structure and quantifying the importance of each edge. The resulting neighbor list provides essential insights for identifying key nodes and edges that significantly influence classification outcomes. This approach makes prediction results more interpretable by emphasizing critical edges and visually representing those with high importance, allowing security professionals to quickly understand attack patterns and develop effective defense strategies.
The framework proposed in this study is practical and interpretable for real-world security operations and has proven effective in predicting large-scale network attacks. Although the model achieves high accuracy, practitioners should take certain real-world limitations into account. Since this work mainly considers a static model, adapting to the highly dynamic nature of real-world networks will require additional dynamic modeling. Dynamic models often pose challenges related to inference latency and resource usage, as evaluated on realistic hardware in this study. Therefore, operational deployment should consider a hybrid approach, integrating both static and dynamic detection capabilities. To further improve its applicability, especially for detecting rare attacks, the study suggests techniques such as hybrid sampling and cost-sensitive learning. These methods are particularly effective in addressing the data imbalance that commonly appears in real-world security settings.
In conclusion, this study addresses the practical aspects of network security by employing graph models for attack prediction and visualization. The approach not only demonstrates effectiveness in large-scale attack scenarios but also offers interpretable results to support security professionals. This work lays a significant foundation for future research and development in the area of network traffic attack prediction and analysis.
Acknowledgement: Not applicable.
Funding Statement: This research was supported by the MSIT (Ministry of Science and ICT), Republic of Korea, under the ICAN (ICT Challenge and Advanced Network of HRD) support program (IITP-2025-RS-2023-00259497) supervised by the IITP (Institute for Information & Communications Technology Planning & Evaluation) and was supported by Institute of Information & Communications Technology Planning & Evaluation (IITP) grant funded by the Republic of Korea government (MSIT) (No. IITP-2025-RS-2023-00254129, Graduate School of Metaverse Convergence (Sungkyunkwan University)) and was supported by the Basic Science Research Program of the National Research Foundation (NRF) funded by the Republic of Korean government (MSIT) (No. RS-2024-00346737).
Author Contributions: The authors confirm contribution to the paper as follows: Conceptualization, Jaeho Shin and Jaekwang Kim; methodology, Jaeho Shin and Jaekwang Kim; software, Jaeho Shin; validation, Jaeho Shin and Jaekwang Kim; formal analysis, Jaeho Shin and Jaekwang Kim; investigation, Jaeho Shin and Jaekwang Kim; resources, Jaeho Shin and Jaekwang Kim; data curation, Jaeho Shin and Jaekwang Kim; writing—original draft preparation, Jaeho Shin and Jaekwang Kim; writing—review and editing, Jaeho Shin and Jaekwang Kim; visualization, Jaeho Shin and Jaekwang Kim; supervision, Jaekwang Kim; project administration, Jaekwang Kim; funding acquisition, Jaekwang Kim. All authors reviewed the results and approved the final version of the manuscript.
Availability of Data and Materials: Not applicable.
Ethics Approval: Not applicable.
Conflicts of Interest: The authors declare no conflicts of interest to report regarding the present study.
References
1. Nair MM, Deshmukh A, Tyagi AK. Artificial intelligence for cyber security: current trends and future challenges. In: Automated secure computing for next-generation systems. Beverly, MA, USA: Scrivener Publishing LLC; 2024. p. 83–114. doi: 10.1002/9781394213948.ch5. [Google Scholar] [CrossRef]
2. Isong B, Kgote O, Abu-Mahfouz A. Insights into modern intrusion detection strategies for Internet of things ecosystems. Electronics. 2024;13(12):2370. doi:10.3390/electronics13122370. [Google Scholar] [CrossRef]
3. Xin Y, Kong L, Liu Z, Chen Y, Li Y, Zhu H, et al. Machine learning and deep learning methods for cybersecurity. IEEE Access. 2018;6:35365–81. doi:10.1109/access.2018.2836950. [Google Scholar] [CrossRef]
4. Rodriguez E, Otero B, Gutierrez N, Canal R. A survey of deep learning techniques for cybersecurity in mobile networks. IEEE Commun Surv Tutor. 2021;23(3):1920–55. [Google Scholar]
5. Zhou J, Cui G, Hu S, Zhang Z, Yang C, Liu Z, et al. Graph neural networks: a review of methods and applications. AI Open. 2020;1:57–81. doi:10.1016/j.aiopen.2021.01.001. [Google Scholar] [CrossRef]
6. Wu Z, Pan S, Chen F, Long G, Zhang C, Philip SY. A comprehensive survey on graph neural networks. IEEE Trans Neural Netw Learn Syst. 2020;32(1):4–24. doi:10.1109/tnnls.2020.2978386. [Google Scholar] [PubMed] [CrossRef]
7. Bilot T, El Madhoun N, Al Agha K, Zouaoui A. Graph neural networks for intrusion detection: a survey. IEEE Access. 2023;11:49114–39. doi:10.1109/access.2023.3275789. [Google Scholar] [CrossRef]
8. Wu Y, Dai HN, Tang H. Graph neural networks for anomaly detection in industrial Internet of Things. IEEE Internet of Things J. 2021;9(12):9214–31. doi:10.1109/jiot.2021.3094295. [Google Scholar] [CrossRef]
9. Arrieta AB, Díaz-Rodríguez N, Del Ser J, Bennetot A, Tabik S, Barbado A, et al. Explainable Artificial Intelligence (XAIconcepts, taxonomies, opportunities and challenges toward responsible AI. Inform Fusion. 2020;58:82–115. doi:10.1016/j.inffus.2019.12.012. [Google Scholar] [CrossRef]
10. Uccello F, Pawlicki M, D’Antonio S, Kozik R, Choraś M. A new cybersecurity approach enhanced by xAI-derived rules to improve network intrusion detection and SIEM. Comput Mater Contin. 2025;83(2):1607–21. doi:10.32604/cmc.2025.062801. [Google Scholar] [CrossRef]
11. Yuan H, Yu H, Gui S, Ji S. Explainability in graph neural networks: a taxonomic survey. IEEE Trans Pattern Anal Mach Intell. 2022;45(5):5782–99. doi:10.1109/tpami.2022.3204236. [Google Scholar] [PubMed] [CrossRef]
12. Zhou W, Xia C, Wang T, Liang X, Lin W, Li X, et al. Hidim: a novel framework of network intrusion detection for hierarchical dependency and class imbalance. Comput Secur. 2025;148:104155. doi:10.1016/j.cose.2024.104155. [Google Scholar] [CrossRef]
13. Cao Y, Shi F, Yu Q, Lin X, Zhou C, Zou L, et al. IBPL: information bottleneck-based prompt learning for graph out-of-distribution detection. Neural Netw. 2025;188:107381. doi:10.1016/j.neunet.2025.107381. [Google Scholar] [PubMed] [CrossRef]
14. Mir M, Trik M. A novel intrusion detection framework for industrial IoT: GCN-GRU architecture optimized with ant colony optimization. Comput Electr Eng. 2025;126:110541. doi:10.1016/j.compeleceng.2025.110541. [Google Scholar] [CrossRef]
15. Gowdhaman V, Dhanapal R. Hybrid deep learning-based intrusion detection system for wireless sensor network. Int J Veh Inform Commun Syst. 2024;9(3):239–55. doi:10.1504/ijvics.2024.10064580. [Google Scholar] [CrossRef]
16. Huang C, Wang Y, Jiang Y, Li M, Huang X, Wang S, et al. Flow2GNN: flexible two-way flow message passing for enhancing GNNs beyond homophily. IEEE Trans Cybern. 2024;54:6607–18. doi:10.1109/tcyb.2024.3412149. [Google Scholar] [PubMed] [CrossRef]
17. Fu C, Liu G, Yuan K, Wu J. Nowhere to H2IDE: fraud detection from multi-relation graphs via disentangled homophily and heterophily identification. IEEE Trans Knowl Data Eng. 2025;37:1380–93. doi:10.1109/tkde.2024.3523107. [Google Scholar] [CrossRef]
18. Yue M, Yan H, Han R, Wu Z. A DDoS attack detection method based on IQR and DFFCNN in SDN. J Netw Comput Appl. 2025;240:104203. doi:10.1016/j.jnca.2025.104203. [Google Scholar] [CrossRef]
19. Huang C, Gao C, Li M, Li Y, Wang X, Jiang Y, et al. Correlation information enhanced graph anomaly detection via hypergraph transformation. IEEE Trans Cybern. 2025;55:2865–78. doi:10.1109/tcyb.2025.3558941. [Google Scholar] [PubMed] [CrossRef]
20. Cheng X, Wang Y, Liu Y, Zhao Y, Aggarwal CC, Derr T, et al. Edge classification on graphs: new directions in topological imbalance. arXiv:2406.11685. 2024. [Google Scholar]
21. Hamilton W, Ying Z, Leskovec J. Inductive representation learning on large graphs. In: Advances in Neural Information Processing Systems 30: Annual Conference on Neural Information Processing Systems 2017; 2017 Dec 4–9; Long Beach, CA, USA. p. 1–11. [Google Scholar]
22. Ying Z, Bourgeois D, You J, Zitnik M, Leskovec J. Gnnexplainer: generating explanations for graph neural networks. In: Advances in Neural Information Processing Systems: Annual Conference on Neural Information Processing Systems 2019, NeurIPS 2019; 2019 Dec 8–14; Vancouver, BC, Canada. p. 1–12. [Google Scholar]
23. Luo D, Cheng W, Xu D, Yu W, Zong B, Chen H, et al. Parameterized explainer for graph neural network. Adv Neural Inform Process Syst. 2020;33:19620–31. [Google Scholar]
24. Yuan H, Yu H, Wang J, Li K, Ji S. On explainability of graph neural networks via subgraph explorations. In: The 38th International Conference on Machine Learning; 2021 Jul 18–24; Online. p. 12241–52. [Google Scholar]
25. Huang Z, Kosan M, Medya S, Ranu S, Singh A. Global counterfactual explainer for graph neural networks. In: Proceedings of the Sixteenth ACM International Conference on Web Search and Data Mining; 2023 Feb 27–Mar 3; Singapore. p. 141–9. doi:10.1145/3539597.3570376. [Google Scholar] [CrossRef]
26. Yuan H, Tang J, Hu X, Ji S. Xgnn: towards model-level explanations of graph neural networks. In: Proceedings of the 26th ACM SIGKDD International Conference on Knowledge Discovery & Data Mining; 2020 Aug 23–27; Online. p. 430–8. [Google Scholar]
27. Mohale VZ, Obagbuwa IC. A systematic review on the integration of explainable artificial intelligence in intrusion detection systems to enhancing transparency and interpretability in cybersecurity. Front Artif Intell. 2025;8:1526221. doi:10.3389/frai.2025.1526221. [Google Scholar] [PubMed] [CrossRef]
28. Galli D, Venturi A, Marasco I, Marchetti M. Evaluating explainability of graph neural networks for network intrusion detection with structural attacks. In: 2025 Joint National Conference on Cybersecurity, ITASEC and SERICS 2025; 2025 Feb 3–8; Bologna, Italy. [Google Scholar]
29. Cobo Arrniz G. Detection of nework attacks using graph neural networks [master’s thesis]. Barcelona, Spain: Universitat Politecnica de Catalunya; 2023. [Google Scholar]
30. Hoffman MD, Blei DM, Wang C, Paisley J. Stochastic variational inference. J Mach Learn Res. 2013;14(1):1303–47. [Google Scholar]
31. Sarhan M, Layeghy S, Portmann M. Towards a standard feature set for network intrusion detection system datasets. Mob Netw Appl. 2022;27:357–70. doi:10.1007/s11036-021-01843-0. [Google Scholar] [CrossRef]
32. Sharafaldin I, Lashkari AH, Ghorbani AA. Toward generating a new intrusion detection dataset and intrusion traffic characterization. In: Proceedings of the 4th International Conference on Information Systems Security and Privacy (ICISSP 2018); 2018 Jan 22–24; Madeira, Portugal. p. 108–16. [Google Scholar]
33. Moustafa N, Slay J. UNSW-NB15: a comprehensive data set for network intrusion detection systems (UNSW-NB15 network data set). In: 2015 Military Communications and Information Systems Conference (MilCIS); 2015 Nov 10–12; Canberra, ACT, Australia. p. 1–6. [Google Scholar]
34. Ashraf J, Keshk M, Moustafa N, Abdel-Basset M, Khurshid H, Bakhshi AD, et al. IoTBoT-IDS: a novel statistical learning-enabled botnet detection framework for protecting networks of smart cities. Sustain Cities Soc. 2021;72:103041. doi:10.1016/j.scs.2021.103041. [Google Scholar] [CrossRef]
35. Ciano G, Rossi A, Bianchini M, Scarselli F. On inductive-transductive learning with graph neural networks. IEEE Trans Pattern Anal Mach Intell. 2021;44(2):758–69. doi:10.1109/tpami.2021.3054304. [Google Scholar] [PubMed] [CrossRef]
36. Xu R, Wu G, Wang W, Gao X, He A, Zhang Z. Applying self-supervised learning to network intrusion detection for network flows with graph neural network. Comput Netw. 2024;248:110495. doi:10.1016/j.comnet.2024.110495. [Google Scholar] [CrossRef]
37. Vinayakumar R, Alazab M, Soman KP, Poornachandran P, Al-Nemrat A, Venkatraman S. Deep learning approach for intelligent intrusion detection system. IEEE Access. 2019;7:41525–50. doi:10.1109/access.2019.2895334. [Google Scholar] [CrossRef]
38. Chen T, Guestrin C. Xgboost: a scalable tree boosting system. In: Proceedings of the 22nd ACM Sigkdd International Conference on Knowledge Discovery and Data Mining; 2016 Aug 13–17; San Francisco, CA, USA. p. 785–94. [Google Scholar]
39. He H, Garcia EA. Learning from imbalanced data. IEEE Trans Knowl Data Eng. 2009;21(9):1263–84. doi:10.1109/tkde.2008.239. [Google Scholar] [CrossRef]
40. Chawla NV, Bowyer KW, Hall LO, Kegelmeyer WP. SMOTE: synthetic minority over-sampling technique. J Artif Intell Res. 2002;16:321–57. doi:10.1613/jair.953. [Google Scholar] [CrossRef]
41. Prasetiyo B, Alamsyah, Muslim M, Baroroh N. Evaluation performance recall and F2 score of credit card fraud detection unbalanced dataset using SMOTE oversampling technique. J Phys Conf Series. 2021;1918(4):042002. doi:10.1088/1742-6596/1918/4/042002. [Google Scholar] [CrossRef]
42. Wang X, Wang X, He M, Zhang M, Lu Z. Spatial-temporal graph model based on attention mechanism for anomalous IoT intrusion detection. IEEE Trans Ind Inform. 2023;20(3):3497–509. doi:10.1109/tii.2023.3308784. [Google Scholar] [CrossRef]
43. Liu J, Guo M. DIGNN-A: real-time network intrusion detection with integrated neural networks based on dynamic graph. Comput Mater Contin. 2025;82(1):817–42. doi:10.32604/cmc.2024.057660. [Google Scholar] [CrossRef]
44. Zhang H, Cao T. A hybrid approach to network intrusion detection based on graph neural networks and transformer architectures. In: 2024 14th International Conference on Information Science and Technology (ICIST); 2024 Dec 6–9; Chengdu, China. p. 574–82. [Google Scholar]
Cite This Article
 Copyright © 2026 The Author(s). Published by Tech Science Press.
This work is licensed under a Creative Commons Attribution 4.0 International License , which permits unrestricted use, distribution, and reproduction in any medium, provided the original work is properly cited.
 Downloads
 Citation Tools