
 Submit a Paper
 Propose a Special lssue
 Open Access
ARTICLE

A Convolutional Neural Network-Based Deep Support Vector Machine for Parkinson’s Disease Detection with Small-Scale and Imbalanced Datasets
1 School of Science and Technology, Hong Kong Metropolitan University, Hong Kong, China
2 Department of Computer Science and Information Engineering, Asia University, Taichung, 41354, Taiwan
3 Department of Medical Research, China Medical University Hospital, China Medical University, Taichung, 40447, Taiwan
4 Symbiosis Centre for Information Technology (SCIT), Symbiosis International University, Pune, 411057, India
5 Instituto Politécnico Nacional, CIC, UPALM-Zacatenco, Mexico City, 07320, Mexico
6 Management Department, College of Business Administration, Princess Nourah bint Abdulrahman University, P.O. Box 84428, Riyadh, 11671, Saudi Arabia
* Corresponding Authors: Kwok Tai Chui. Email: ; Brij B. Gupta. Email:
(This article belongs to the Special Issue: Emerging Trends and Applications of Deep Learning for Biomedical Signal and Image Processing)
Computers, Materials & Continua 2026, 86(1), 1-23. https://doi.org/10.32604/cmc.2025.068842
Received 07 June 2025; Accepted 25 September 2025; Issue published 10 November 2025
 View Full Text
 Download PDF
Abstract
Parkinson’s disease (PD) is a debilitating neurological disorder affecting over 10 million people worldwide. PD classification models using voice signals as input are common in the literature. It is believed that using deep learning algorithms further enhances performance; nevertheless, it is challenging due to the nature of small-scale and imbalanced PD datasets. This paper proposed a convolutional neural network-based deep support vector machine (CNN-DSVM) to automate the feature extraction process using CNN and extend the conventional SVM to a DSVM for better classification performance in small-scale PD datasets. A customized kernel function reduces the impact of biased classification towards the majority class (healthy candidates in our consideration). An improved generative adversarial network (IGAN) was designed to generate additional training data to enhance the model’s performance. For performance evaluation, the proposed algorithm achieves a sensitivity of 97.6% and a specificity of 97.3%. The performance comparison is evaluated from five perspectives, including comparisons with different data generation algorithms, feature extraction techniques, kernel functions, and existing works. Results reveal the effectiveness of the IGAN algorithm, which improves the sensitivity and specificity by 4.05%–4.72% and 4.96%–5.86%, respectively; and the effectiveness of the CNN-DSVM algorithm, which improves the sensitivity by 1.24%–57.4% and specificity by 1.04%–163% and reduces biased detection towards the majority class. The ablation experiments confirm the effectiveness of individual components. Two future research directions have also been suggested.Keywords
Globally, more than 10 million people have Parkinson’s disease (PD) [1]. Primary (96%) sufferers are age 50 and above, which reflects the prevalence of PD in older people, particularly the elderly. The issue of population ageing is worsening in terms of the total number of people aged 60 and above by 40% and 110%, reaching 1.4 billion and 2.1 billion (22% of the world’s population), respectively, from 1 billion in 2019 [2]. This drives the ever-growing death rates (per 0.1 million population) in various countries, such as the USA (11.6) [3], Canada (9.4) [4], and Spain (9.6) [5]. The insufficient medical staff remains severe for many decades. It is estimated that there will be slow progress on the shortfall of medical staff, from 17.4 million (2013) to 14 million (2030) [6].
With the advent of technological development of computational algorithms, various machine learning algorithms were proposed for PD detection models. Since 90% of PD sufferers experience voice disorder [7–9], voice signals could serve as inputs for the PD diagnostic model. The wide and rapid diffusion of mobile applications and systems provides a solid foundation to measure the voice signals of users. Building a large-scale dataset becomes feasible, and it is vital to provide essential knowledge to improve the performance of the machine learning models. In contrast to the assessment by medical doctors, which is costly and may take several months as the waiting time for new case booking for specialist outpatient [10,11], PD detection via a machine learning model is more applicable to support medical screening and rapid testing across the world’s population.
In this section, a literature review summarises the methodology, results, and limitations of the latest research works. This serves as the rationale for the proposed PD detection algorithm, which aims to address the limitations. The research contributions of this paper are summarized. The rest of the paper is organized as follows: Section 2 presents the materials and methods of our PD detection model. This is followed by the performance evaluation and comparison of the proposed algorithm. Finally, a conclusion and recommendations for future research directions are drawn.
Various approaches were proposed for PD detection. Traditional machine learning models are discussed in [12–14], deep learning models in [15,16], and both machine learning and deep learning models in [17–19].
In [12], three approaches, namely support vector machine (SVM), optimum path forest (OPF), and k-nearest neighbours (kNN), using speeches as inputs, were applied for performance evaluation and comparison. Results revealed that 1-nearest neighbors with Yaffe features achieved the best performance, specificity of 50.9%, and sensitivity of 71.2%. Another work [13] analyzed the performance of voice-based binary PD classification using three machine learning algorithms, SVM, kNN, and neural network (NN). Downsampling was used to ensure an equal number of samples in each class during model training. Model overfitting was observed, as evidence by the notable deviations between training and testing accuracies. The testing accuracy using SVM ranged from 82.5%–90% using different feature vectors, while that using kNN was 75%–85%, and that using NN was 82.5%–87.5%. Regarding [14], six machine learning algorithms, logistic regression (LR), decision tree (DT), extreme gradient boosting (XGBoost), SVM, kNN, and random forest (RF), were used to perform binary PD classification. The issue of an imbalanced dataset was tackled using the edited version of the synthetic minority over-sampling technique (SMOTE). The accuracy of the six models ranged from 84.3% to 96.5% (SVM was the best).
Regarding the deep learning models, various studies [15,16] confirmed the effectiveness of enhancing classification accuracy performance, provided that sufficient training samples and computational power exist. A CNN-based SVM classifier was designed for binary PD classification [15]. Four typical kernel functions were evaluated: linear, sigmoid, polynomial, and RBF kernels. The accuracy of these four configurations ranged from 68% to 75%. Another work [16] employed CNN for the problem formulations of feature extraction and classification. A challenge of biased classification was observed based on sensitivity (90%) and specificity (97%), attributable to an imbalanced dataset.
In the small-scale environment for PD datasets, some researchers analyzed and compared the performance of machine/deep learning algorithms. In [17], three machine learning algorithms, namely, SVM, kNN, and Naïve Bayes (NB), and one deep learning algorithm, CNN, were chosen to perform binary PD classifications. The selected machine learning algorithms yielded average accuracies ranging from 74% to 76%. The CNN model achieved accuracies from 53% to 82%. Another work [18] utilized kNN, DT, RF, and SVM as machine learning algorithms and a multi-layer perceptron (MLP) as a deep learning algorithm for binary PD classification. kNN was the best among the four machine learning algorithms, achieving an accuracy of 88%, whereas MLP yielded an accuracy of 90%. In addition, six machine learning algorithms, NB, LR, kNN, RF, DT, and SVM, and five deep learning algorithms, transformer, gated recurrent unit (GRU), long short-term memory (LSTM), recurrent neural network (RNN), and CNN were used for binary PD classification [19]. RF was the best (82.4%) among machine learning algorithms, and CNN (85.0%) was among deep learning algorithms. A stacked autoencoder-based deep neural network (DNN) approach was used to perform PD detection [20]. The model achieved a sensitivity of 94.9% and a specificity of 42.9%, reflecting a significant issue of biased classification. This approach was also compared with three traditional machine learning algorithms, including XGBoost, decision tree, and neural network, and outperformed them. Another work [21] proposed a parallel CNN and RNN model with a MLP for PD detection. The model achieved an AUC of 91.3%, an F1 score of 91.1%, a precision of 89.8%, a recall of 92.5%, and an accuracy of 91.1%. Ablation experiments confirmed the effectiveness of individual components. Two algorithms, RNN and GRU, were built for PD detection [22]. Identical results were shared among accuracy (87.2%), recall (75%), and F1 score (77%). In [23], cepstral coefficients were extracted and served as inputs to a deep residual network for PD detection. The model achieved an accuracy of 89.8%, a specificity of 89.3%, and a sensitivity of 90.1%. Quan et al. [24] proposed an optimized federated learning approach for PD detection with voice signals of five languages, including English, Chinese, Czech, Italian, and Spanish. The model achieved an accuracy of 72.6%, an F1 score of 68.2%, a specificity of 69.4%, and a sensitivity of 75.1% as the mean performance of five scenarios.
1.2 Limitations of the Existing Works
Here are the key limitations of the existing works discussed in Section 1.1.
(a) The performance of PD detection models using baseline features suggests that more representative features (hidden features) must be discovered.
(b) There is room for improvement where the overall accuracy of the PD detection models is less than 90% [12,13,15,17–19]. These do not align with the expectation that deep learning algorithms improve the performance of PD detection compared with traditional machine learning algorithms.
(c) The imbalanced dataset led to a biased detection model towards the majority class based on the significant deviation between the sensitivity and specificity of the models [12,15–18]. This issue commonly occurrs in medical domains with several main reasons, including costly data collection, rare cases, data privacy, access rights, and a lack of data pipelines. Some typical examples are medical time-series data [25] and medical image segmentation [26].
(d) Three types of cross-validation, namely hold-out cross-validation [12], k-fold cross-validation [14–17], and single-split (training and testing datasets) validation [13,18,19], were used for the performance evaluation of PD detection models. An investigation was not included in the selection of these approaches.
To tackle the abovementioned limitations (Section 1.2), this paper proposes a PD detection method using a convolutional neural network-based deep support vector machine (CNN-DSVM). The research contributions are summarized below.
(a) Hidden features are analyzed and used to construct a CNN-based PD detection model. By employing a continuous wavelet transform, the study converts these 1-dimensional signals into a 2-dimensional time-frequency representation. This conversion not only enhances the data’s dimensionality but also allows the CNN to decipher intricate patterns and features that might be overlooked in a traditional CNN. It also emphasizes hyperparameter tuning during backpropagation to optimize the CNN’s performance, with an adaptable range of hidden layers and neuron configurations to suit diverse benchmark datasets. The selected architecture fosters a deeper understanding of the underlying features within the voice data, thereby significantly contributing to the reliability and accuracy of PD detection. This methodology lays the groundwork for improved inputs to the subsequent DSVM, showcasing its innovative contribution to CNN customization in voice-based PD detection.
(b) Extend the SVM to deep SVM (DSVM), which takes advantage of deep learning with small-scale datasets. By contrast, common deep learning algorithms based on CNN, deep neural network (DNN), and deep belief network (DBN) require sufficient data [27,28]; the DSVM framework is designed to work efficiently with limited data. This is a major technical merit, as medical datasets are often small and imbalanced. DSVM architecture introduces a novel approach to optimizing kernel functions in PD detection by leveraging multiple kernel learning (MKL) and particle swarm optimization (PSO). It is a refined methodology for optimizing kernel functions tailored to specific datasets. This is particularly critical in medical diagnostics, where heterogeneous voice signals from PD patients can exhibit complex and nuanced patterns that traditional algorithms often struggle to capture. Unlike traditional methods that may involve exhaustive searching of parameters, this research employs a grid-search approach to efficiently (reducing computational overhead and enhancing training efficiency) customize the kernel functions across SVM blocks. By integrating six well-known kernel functions—linear, sigmoid, radial basis, polynomial, log, and powered—this architecture aims to capture the complex relationships inherent in heterogeneous voice signals from both PD patients and healthy individuals. The innovative combination of MKL and PSO not only enhances the adaptability of the model to specific PD characteristics but also streamlines the training process, offering significant potential for improved performance in voice analysis applications.
(c) Additional training data in the minority group can be generated by introducing an improved generative adversarial network (IGAN). The IGAN presents a novel integration of three established GAN frameworks: auxiliary classifier GANs, InfoGANs, and conditional GANs. It enhances the traditional GAN architecture by incorporating a conditional variable within the discriminator, adding a new network to support the classification process, and labeling all generated data. By merging these elements, IGAN optimizes the generation of specific data types, enhances transfer learning capabilities, and maximizes information retention between latent codes and generated outcomes. This approach not only increases the quality and relevance of the generated data but also significantly streamlines the process of adapting models for the PD detection problem as well as other domains, thus addressing challenges often encountered in data scarcity within minority classes. One of the key novelties of IGAN lies in its unique architecture, which incorporates a conditional variable within the discriminator. This addition enables to generation of more nuanced and targeted data, ensuring that the produced samples are not only diverse but also aligned with specific categories or labels relevant to the task at hand. Moreover, the inclusion of an auxiliary network dedicated to the classification process further refines the ability to generate high-quality samples, thereby preserving critical information during the generation phase. Additionally, IGAN’s labeling mechanism for all generated data enhances the interpretability and usability of the created datasets. This characteristic allows researchers and practitioners to better understand the generated outputs’ context and relevance, facilitating smoother integration into existing frameworks, particularly for challenges (PD detection in this research).
(d) Investigating an appropriate type of cross-validation for the PD detection problem is crucial for enhancing the reliability and validity of predictive models in this field. Three types of cross-validation, hold-out cross-validation (HOCV), k-fold cross-validation (kCV), and leave-one-subject-out cross-validation (LOSOCV) are investigated. Eight scenarios have been analyzed, including five HOCV approaches (training data of 50%, 60%, 70%, 80%, and 90%), two kCV approaches (5-fold and 10-fold), and LOSOCV. By comparing these methods, this research aims to deepen the understanding of their respective strengths and weaknesses in PD detection applications, guiding the selection of the most appropriate cross-validation strategy. This contribution advances methodological rigor and enhances the performance and generalization of predictive models in neurological research.
This section first presents the summary of the benchmark dataset. The methodology of the PD detection model comprises three parts: data generation using IGAN, feature extraction using CNN, and PD detection using DSVM.
Parkinson’s Disease Classification Data Set [14] is selected as a benchmark dataset for performance evaluation and comparison of the PD detection models. It contains a microphone signal (at 44.1 kHz) of three times repetitions of the sustained phonation of the vowel /a/ from 252 participants. It has 64 people, aged 41–82, as the control group and 188 people, aged 33–87, as the patient group. A data imbalance issue exists between the control group and the patient group. There are 756 records (252 participants × 3 repetitions), each with 754 attributes. It is worth noting that in the publicly available benchmark PD datasets (10 PD datasets will be considered in Section 3.5 in the performance comparison between the proposed work and existing works), there are issues of data scarcity and imbalanced datasets (typical issues in biomedical datasets). Among the benchmark datasets, we selected the dataset with the most samples. Other nine datasets comprise various proportions of healthy and PD samples, including (i) 35 healthy and 64 PD participants; (ii) 21 healthy and 16 PD participants; (iii) 20 healthy and 20 PD participants; (iv) 48 healthy and 147 PD participants; (v) 8 healthy and 23 PD participants; (vi) 37 healthy and 28 PD participants; (vii) 41 healthy and 40 PD participants; (viii) 36 healthy and 36 PD participants; and (ix) 50 healthy and 50 PD participants. It is noted that all available benchmark PD datasets are considered small-scale datasets, which are deemed suitable for enhancement (in terms of data distribution and PD detection performance) via IGAN. The selected benchmark PD dataset also possesses an imbalanced ratio of 2.94 (PD patient vs. healthy control), which reflects a typical and representative imbalanced dataset. Without proper design of PD detection models, it is expected that a common issue of biased classification will be seen from the significant deviation in sensitivity and specificity, which reduces the practicality of PD detection.
2.2 Data Generation Using IGAN
To mitigate the impact of the imbalanced dataset on the PD detection model, which is biased towards the majority class, downsampling the majority class (PD group) is not an appropriate approach because it sacrifices the availability of ground truth data. Here are the recommended readings on the literature review of the latest developments in algorithms for imbalanced datasets [29,30].
A more appropriate approach to generating additional data in the minority class (healthy group) is chosen. The generative adversarial network (GAN) has received attention in recent years due to its effectiveness in generating high-quality data [31,32]. Many existing research studies have revealed the effectiveness of GANs in speech synthesis, voice cloning, and enhancement of voice recordings. GANs can generate voices in multiple languages, accents, emotional tones, etc., making them suitable for a wide range of applications involving voice signals. In addition, GANs can facilitate transfer learning, where a model trained on one voice can adapt and generate voices for different speakers with minimal additional data. This significantly reduces the time and cost associated with collecting voice samples. Among the variants of GANs, three common types of GANs have been selected as the baseline models: auxiliary classifier GANs [33], InfoGANs [34], and conditional GANs [35]. Recall the foundation of GAN, which generates additional data assigned to random classes (labels), owning to the intractable relationship between the latent space and the classes. One of the earliest improved versions of GANs is conditional GANs, which use the class information in the training phase to generate specific data. Auxiliary classifier GANs further modify the structure of conditional GANs so that a new classifier is added to the discriminator to predict classes. It also supports transfer learning in classification problems. InfoGAN introduces a new term for information maximization to maximize the information between the latent code and the generated data.
To incorporate the advantages of the auxiliary classifier GANs, InfoGANs, and conditional GANs, an improved generative adversarial network (IGAN) is proposed to merge these three designs. Fig. 1 presents the architecture of the IGAN. The major modifications on the architecture are three-fold (from left to right): 1) a discriminator has a new conditional variable c, 2) a new network Nnew is added and attached to the discriminator, and 3) labels all generated data.
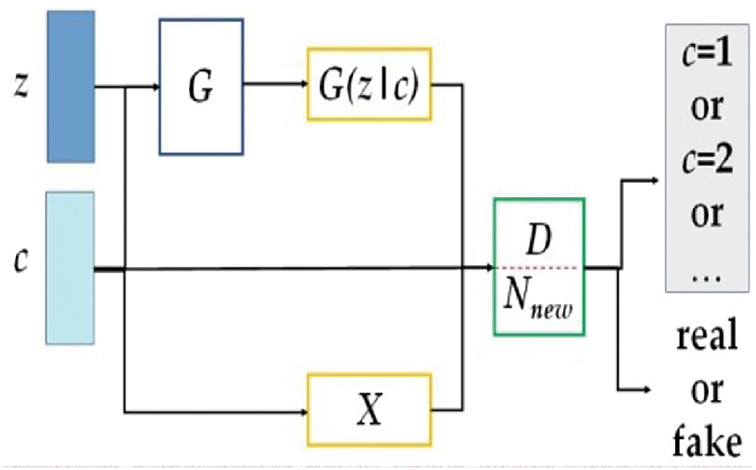
Figure 1: The architecture of the proposed IGAN
Define a noise matrix z and a conditional variable c.
The data distribution X is captured by the conditioned generator G. The additional network Nnew works along with the conditioned discriminator D to distinguish between the data sources of the input data, particularly between the raw and generated datasets. Two maximization problems are formulated for G and D using the loss function related to the raw dataset Lraw, the loss function related to the class label Lclass, and the mutual relationship between c and G(z\c).
with hyperparameter
2.3 Feature Extraction Using CNN
Inspired by the existing work, which shows that baseline and statistical features do not fully characterize the voice data for PD detection, further work should be carried out to discover the hidden pattern. Considering the advantages and disadvantages of typical deep learning algorithms presented in Table 1 [36,37], we have chosen CNN for automatic feature extraction in our research work.

Fig. 2 shows the architecture of a CNN. Since the input of CNN is generally 2-dimensional, we extend the voice signals to a 2-dimensional time-frequency representation via continuous wavelet transform. The feature extraction process has an input layer and multiple hidden layers. Each hidden layer comprises a convolution layer, a maximum pooling layer, and a rectified linear unit (ReLU). Convolution layers, pooling layers, and ReLUs are responsible for the feature extraction process. The convolution layers perform convolution operations on the inputs using various digital filters. The pooling layers carry out dimensionality reduction and decide the thresholds. Hyperparameter tuning is needed during backpropagation to minimize the connections within the CNN architecture. We have selected a typical number of hidden layers ranging from 1 to 5 for analysis and evaluation. The number of neurons and size will be determined and customized to each problem associated with the benchmark dataset. The resultant extracted features will serve as the inputs of the DSVM in the next phase (Section 2.4). An example of the CNN architecture (3-layer) in Section 3.1 is illustrated as follows. 2D inputs of size 256 × 256 composite features, the first convolutional layer of size 254 × 254 (number of filters is 32), the first maximum pooling layer of size 127 × 127 (number of filters is 32), the second convolutional layer of size 124 × 124 (number of filters is 64), the second maximum pooling layer of size 62 × 62 (number of filters is 64), the third convolutional layer of 60 × 60 (number of filters is 128), and the third maximum pooling layer of 30 × 30 (number of filters is 128).
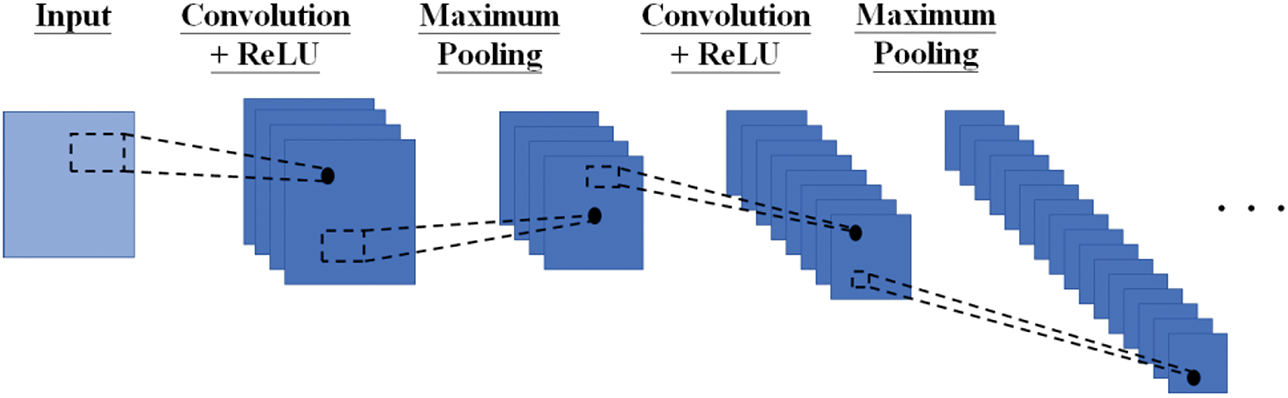
Figure 2: The architecture of the proposed CNN
The DSVM architecture is shown in Fig. 3. There are some integers L in the input layer and M, N, O, and P in the hidden layers. [x]1, [x]2, … , [x]L-1 are the features of the input layer. There are multiple hidden layers, denoted by the first layer (SVM1,1, SVM1,2, … , SVM1,M), the second layer (SVM2,1, SVM2,2, … , SVM2,N), … , the O-th layer (SVMO,1, SVMO,2, … , SVMO,P). As an illustration, with input [x]1, training the first layer (SVM1,1, SVM1,2, … , SVM1,M) will result in the output layer F1(x). As a result, the total net input to each hidden layer neuron is:
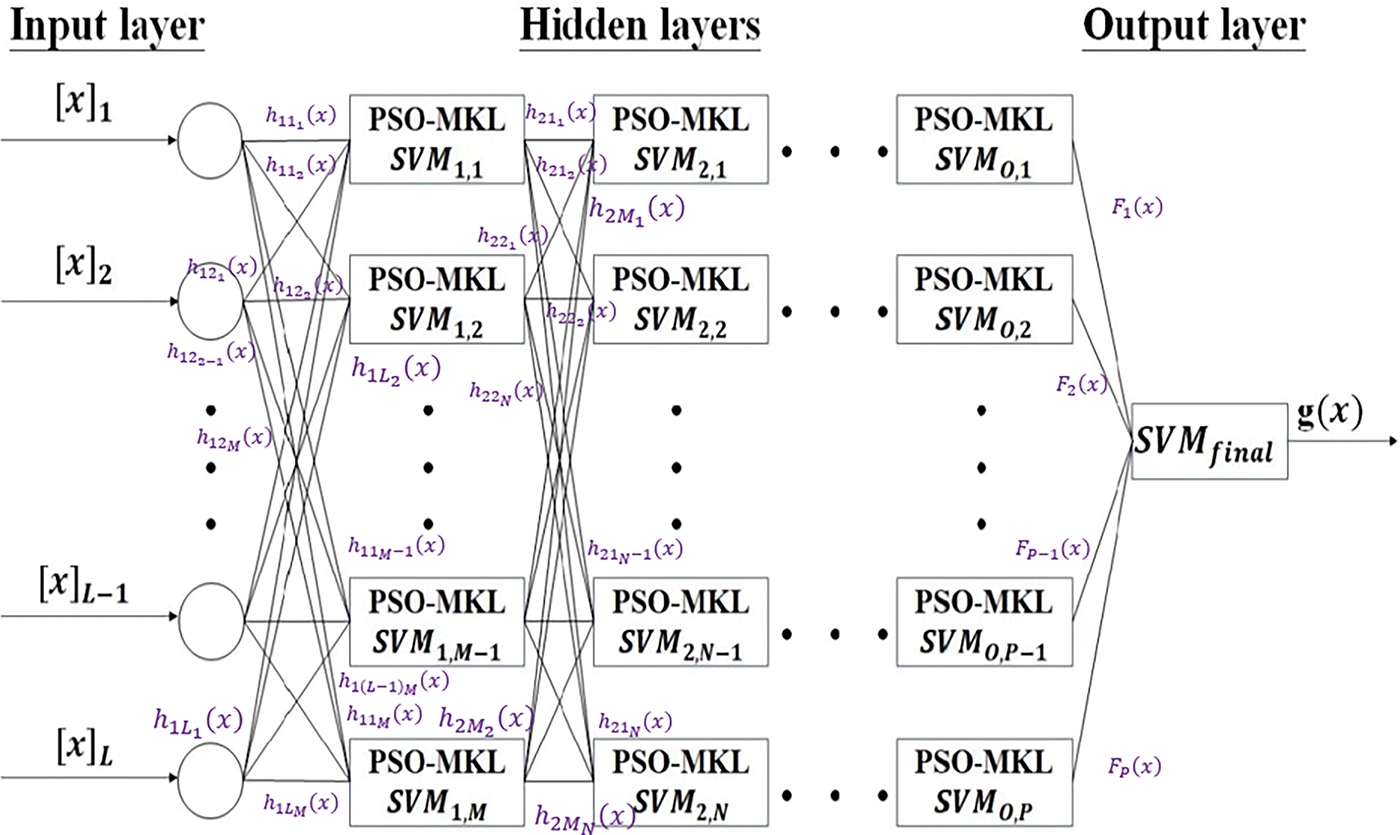
Figure 3: The architecture of the PSO-optimized MKL-based DSVM
The output (corresponding to individual input neurons) can be measured by the logistic activation function:
The output of the hidden layer is defined as:
The output is then calculated using the logistic activation function:
The error for calculating the
which needs to be minimized individually and entirely (the sum of individual errors).
A full search of the values of these integers is not feasible as it is computationally intensive. Instead, a common grid-search approach is chosen. The kernel function will be customized using multiple kernel learning (MKL) in each SVM block. The merging of kernels is solved by particle swarm optimization (PSO). An alternative and well-known optimization algorithm, i.e., genetic algorithm (GA), is not adopted because PSO usually yields less training time than GA [38], providing that many optimisation problems exist in all SVM blocks according to the deep architecture.
The foundation of the kernel in the SVM blocks is based on six common kernel functions, namely linear kernel Klin(x1, x2), sigmoid kernel Ksig(x1, x2), radial basis function kernel Krbf(x1, x2), polynomial kernel Kpoly(x1, x2), log kernel Klog(x1, x2), and powered kernel Kpow(x1, x2). These are well-known functions that could achieve good performance in various applications. MKL takes advantage of the PD detection problem. The heterogeneous voice signals of people (including PD patients and healthy individuals) can be represented using baseline kernels, which are further integrated via MKL to form a unified feature space. The feature space being created by CNN comprises complex relationships that require a strong kernel (via MKL) to capture the large and highly expressive combined feature space. This combined feature space is tailored to the specific characteristics of the PD detection problem. The formulations are defined as follows.
for some real numbers a, b, c, d, and σ, integer N, some power order
Algorithm 1 presents the pseudo-code for PSO-optimized MKL-based DSVM.

Denote N as the total number of data, Nf as the dimensionality of features, and Nsv as the number of support vectors. The computational complexity of each SVM block is
3 Performance Evaluation and Comparison
To evaluate the effectiveness of the proposed CNN-DSVM, analysis is conducted in five parts (Subsections) (i) Evaluate the performance of the CNN-DSVM; (ii) Compare the performance between IGAN with other data generation algorithms; (iii) Compare the performance of feature extraction between CNN and existing approaches; (iv) Compare the performance of kernel selection between PSO-optimized MKL and typical kernel functions in DSVM; and (v) Compare the performance between proposed work and existing works.
3.1 Performance Evaluation of the CNN-DSVM
The computational environment of the performance evaluation is based on an i7-10750H processor, 64 GB DDR4 3200 MHz SoDIMM, and NVIDIA® Quadro RTX 3000. The analysis starts with the performance evaluation of the proposed method, which comprises three modules: data generation using IGAN, feature extraction using CNN, and PD detection using PSO-optimized MKL-based DSVM. The performance evaluation metrics of the PD detection model are sensitivity (or true positive rate), specificity (or true negative rate), precision, F1 score, and area under the curve (AUC).
where TP is the true positive, FN is the false negative, TN is the true negative, and FP is the false positive.
Three types of cross-validation, namely hold-out cross-validation (HOCV), k-fold cross-validation (kCV), and leave-one-subject-out cross-validation (LOSOCV), are used for performance evaluation and investigation. These could provide a better understanding of the suitability of cross-validation approaches in PD detection problems. Eight scenarios are defined based on (i) HOCV90 with 90% of training data; (ii) HOCV80 with 80% of training data; (iii) HOCV70 with 70% of training data, (iv) HOCV60 with 60% of training data; (v) HOCV50 with 50% of training data; (vi) k5CV with k = 5; (vii) k10CV with k = 10; and (viii) LOSOCV. The scenarios for HOCV are based on a step size of 10% degradation in the percentage of training data, until it drops to 50% (equal to that in testing data).
Table 2 summarizes the sensitivity, specificity, precision, F1 score, and AUC of the PD detection model across the varying number of hidden layers (1 to 5) and eight scenarios of cross-validation. 5 times repetitions are performed on each setting, and thus, the sensitivity and specificity are the average of the repetitions. Here are the observations based on the results:
(a) Sensitivity is larger than specificity. A major reason is related to the majority class (patient group), where the model will take more advantage of the class. The PSO-optimized MKL-based kernel function in DSVM can reduce the impact on the detection bias towards the majority class.
(b) The average deviation between sensitivity and specificity across all results is 0.595%. The bias towards the majority class is significantly reduced using IGAN. The effectiveness of IGAN will be further analyzed in Section 3.2.
(c) The best performance of the PD detection model is achieved with 3 hidden layers in HOCV90, HOCV80, HOCV70, and HOCV50, and with 4 hidden layers in HOCV60, k5CV, k10CV, and LOSOCV. The best performance in HOCV90, HOCV80, HOCV70, HOCV60, HOCV50, k5CV, k10CV, and LOSOCV are (94.1, 93.4)%, (93.1, 92.5)%, (92.2, 91.8)%, (91.0, 90.7)%, (89.6, 88.9)%, (96.8, 96.2)%, (97.5, 97.1)%, and (97.6, 97.2)%, respectively. The results suggested that too few or too many hidden layers do not enhance the detection performance.

The performance of the models in eight scenarios ranks in descending order: LOSOCV, k10CV, k5CV, HOCV90, HOCV80, HOCV70, HOCV60, and HOCV50. HOCV performs a single split training and testing which is more prone to overfitting the detection model. When fewer training samples are available, the performance of the detection model deteriorates. kCV provides better cross-validation to reduce the impact of model overfitting. LOSOCV is an extreme case of kCV where k equals the total number of training samples. Although the performance of LOSOCV is generally better than that of kCV, a tradeoff in high computational power is experienced. Given that additional data is generated via IGAN, the performance is considered near-optimal in k10CV compared with LOSOCV.
3.2 Comparison between the IGAN and Other Data Generation Algorithms
Since the IGAN is an optimally joined data generation algorithm from auxiliary classifier GANs (acGANs) [33], InfoGANs [34], and conditional GANs [35], a comparison is made with these three algorithms. To evaluate the data generation algorithm, all implementations are based on the architecture with a CNN module and a PSO-optimized MKL-based DSVM module. Table 3 presents the best results of the number of hidden layers across eight cross-validation scenarios. Quantitative measures (sensitivity, specificity, precision, F1 score, and AUC) have been included across eight cross-validation approaches. In view of the combinations of scenarios, the results of t-SNE are not fully reported. The generated data closely resembles the true data distribution without deviating into regions of feature space where real samples do not exist. The main observations are drawn:
(a) Similar to Section 3.1, the first and last observations are found across different data generation algorithms. The algorithms share some common characteristics, particularly in generating reliable and additional training data to reduce the impact of biased detection.
(b) The performance in terms of sensitivity and specificity ranks in descending order is IGAN (97.6/97.3)%, acGAN+InfoGAN (94.2/93.1)%, acGAN+conditional GAN (94.0/92.9)%, InfoGAN+conditional GAN (93.8/92.8)%, acGANs [33] (93.8/92.7)%, InfoGANs [34] (93.4/92.2)%, conditional GANs [35] (93.2/91.9)%, and without GAN (88.1/84.3)%. Compared to hybrid GAN-based approaches, the percentage improvement by IGAN in sensitivity and specificity are 3.61%–4.05% and 4.51%–4.85%, respectively; likewise, compared to standalone GAN-based approaches, the improvements are 4.05%–4.72% and 4.96%–5.86%, respectively.
(c) The average deviations between sensitivity and specificity in ascending order are proposed IGAN (0.537%), InfoGAN+conditional GAN (1.08%), acGAN+InfoGAN (1.18%), acGAN+conditional GAN (1.19%), InfoGANs [34] (1.16%), conditional GANs [35] (1.25%), and acGANs [33] (1.27%). It reveals that IGAN leverages each algorithm to mitigate bias towards the majority class further. Although the sensitivity and specificity in conditional GANs are less than those in auxiliary classifier GANs and InfoGANs, they perform better in reducing the bias.

3.3 Comparison between Feature Extraction Using CNN and Other Approaches
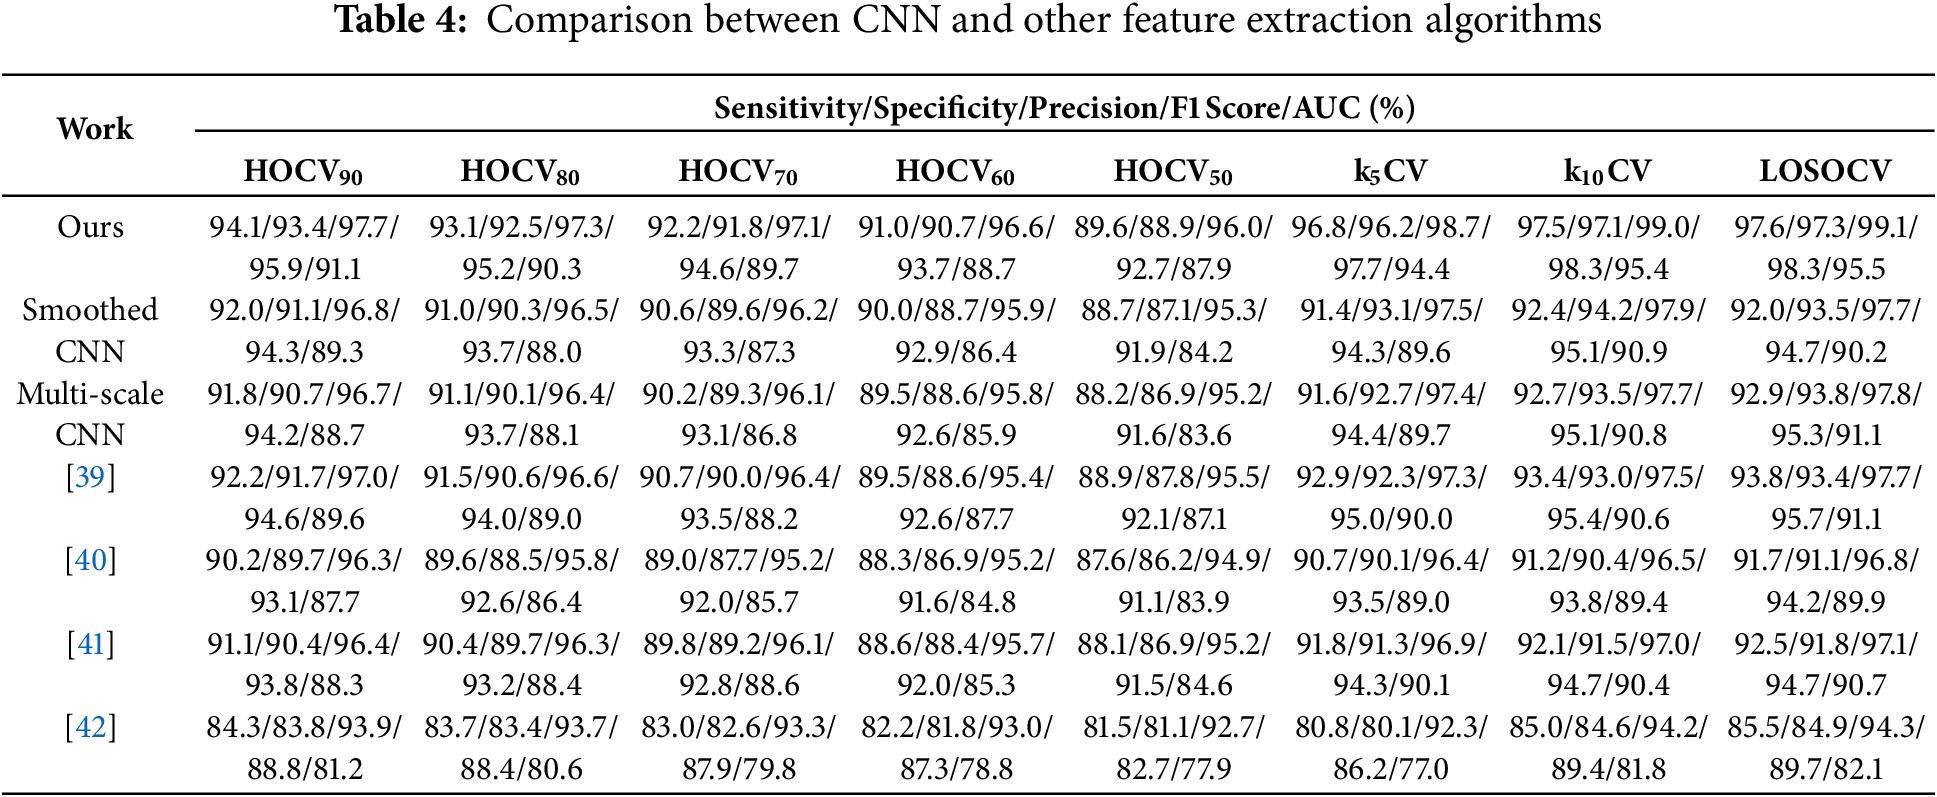
To provide a relevant comparison, existing works [39–42] that rely on the same benchmark dataset (Section 2.1) as in this research work are considered. These works utilize traditional feature extraction approaches instead of automatic feature extraction. The extracted features are: Statistics of vocal fundamental frequencies, variation in amplitude and fundamental frequency, noise-to-tonal-components ratio, non-linear measures of fundamental frequency variation and dynamical complexity, and the signal fractal scaling exponent [39]; Statistics of vocal fundamental frequencies, variation in amplitude and fundamental frequency, noise-to-tonal-components ratio, non-linear measures of fundamental frequency variation and dynamical complexity, and the signal fractal scaling exponent [40]; Tuneable Q-factor wavelet transform coefficients, Mel-frequency cepstral coefficients and baseline features [41]; and 754 features from the raw dataset [42]. Table 4 summarizes the performance of PD detection models using various CNN algorithms (proposed, smoothed CNN, and multi-scale CNN) and other approaches [39–42]. It is worth noting that only the feature extraction process was adopted in the existing works for comparison. The following observations are presented:
(a) The alignment of first and last observations with Section 3.1. The average deviations between sensitivity and specificity in ascending order are proposed IGAN (0.537%), (0.560%) [42], (0.725%) [41], (0.762%) [39], (1.09%) [40], (1.11%) (multi-scale CNN), and (1.44%) (smoothed CNN).
(b) The performance in terms of sensitivity and specificity ranks in descending order is proposed (97.6/97.3)%, (93.8/93.4)% [39], (92.9/93.8)% (multi-scale CNN), (92.5/91.8)% [40], (92.0/93.5)% (smoothed CNN), (91.7/91.1)% [41], (85.5/84.9)% [42]. The proposed work extracts hidden features via CNN that can enhance performance by 4.05%–14.2% and 4.18%–14.6% in sensitivity and specificity, respectively.
(c) The unprocessed raw data serving as a feature vector in [42] achieves the lowest sensitivity and specificity among the five approaches. This could be the first step to implementing a machine learning model in any application. Raw data is the basis that captures limited representative features. When the model is performance-oriented, more representative features should be extracted based on feature extraction techniques with domain knowledge and potentially automatic extraction via CNN without domain knowledge.
3.4 Comparison between PSO-Optimized MKL and Typical Kernel Functions in DSVM
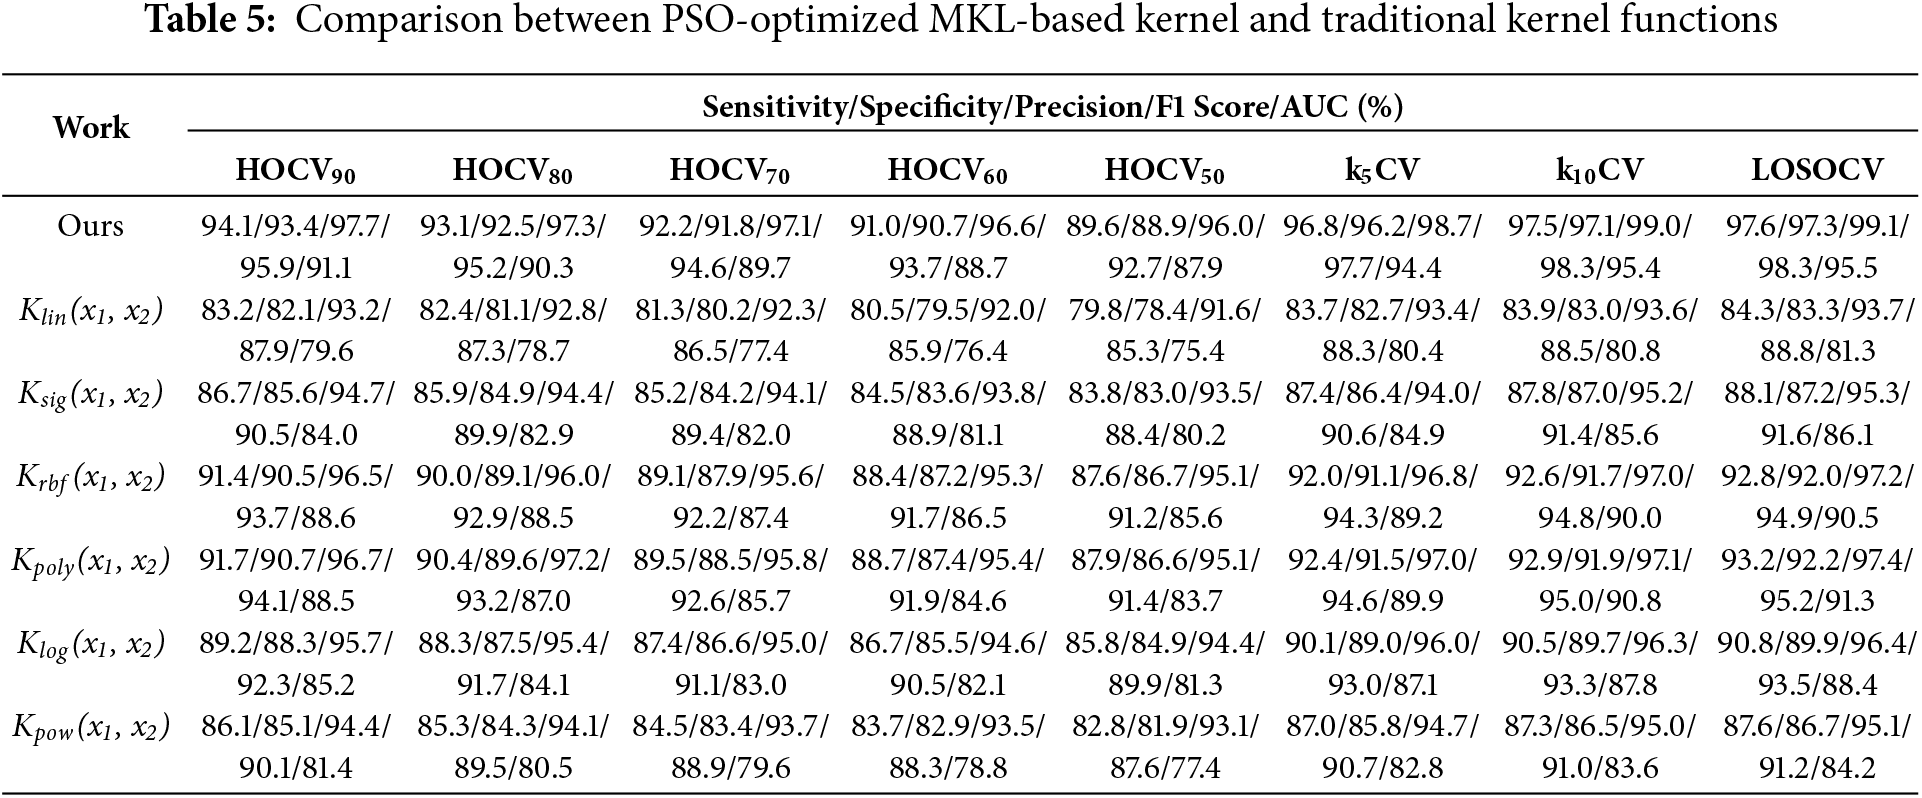
The optimal design of kernel functions in each SVM block in the DSVM architecture is important. PSO is employed to solve the optimization problem. The proposed approach is compared with six standalone kernel functions Klin(x1, x2), Ksig(x1, x2), Krbf(x1, x2), Kpoly(x1, x2), Klog(x1, x2), and Kpow(x1, x2). Table 5 summarizes the comparison of the seven kernel approaches. Key observations are discussed:
(a) The alignment of first and last observations with Section 3.1. The average deviations between sensitivity and specificity in ascending order are proposed IGAN (0.537%), Klog(x1, x2) (1.06%), Krbf(x1, x2) (1.08%), Ksig(x1, x2) (1.10%), Kpow(x1, x2) (1.14%), Kpoly(x1, x2) (1.16%), and Klin(x1, x2) (1.36%).
(b) The performance in terms of sensitivity and specificity ranks in descending order: Proposed (94.6/94.3)%, Kpoly(x1, x2) (93.2/92.3)%, Krbf(x1, x2) (92.8/92.0)%, Klog(x1, x2) (90.8/89.9)%, Ksig(x1, x2) (88.1/87.3)%, Kpow(x1, x2) (87.6/86.8)%, and Klin(x1, x2) (84.3/83.5)%. The proposed work enhances the performance by 4.88–16.4% and 5.60–17.1% in sensitivity and specificity, respectively.
(c) The deviations between sensitivity and specificity in ascending order are proposed work (0.537%), Krbf(x1, x2) (1.02%), Klog(x1, x2) (1.06%), Ksig(x1, x2) (1.10%), Kpow(x1, x2) (1.14%), Kpoly(x1, x2) (1.16%), and Klin(x1, x2) (1.36%). A major reason is attributable to the customized kernel being designed to reduce the impact of biased detection toward the majority class.
3.5 Comparison between Proposed Work and Existing Works
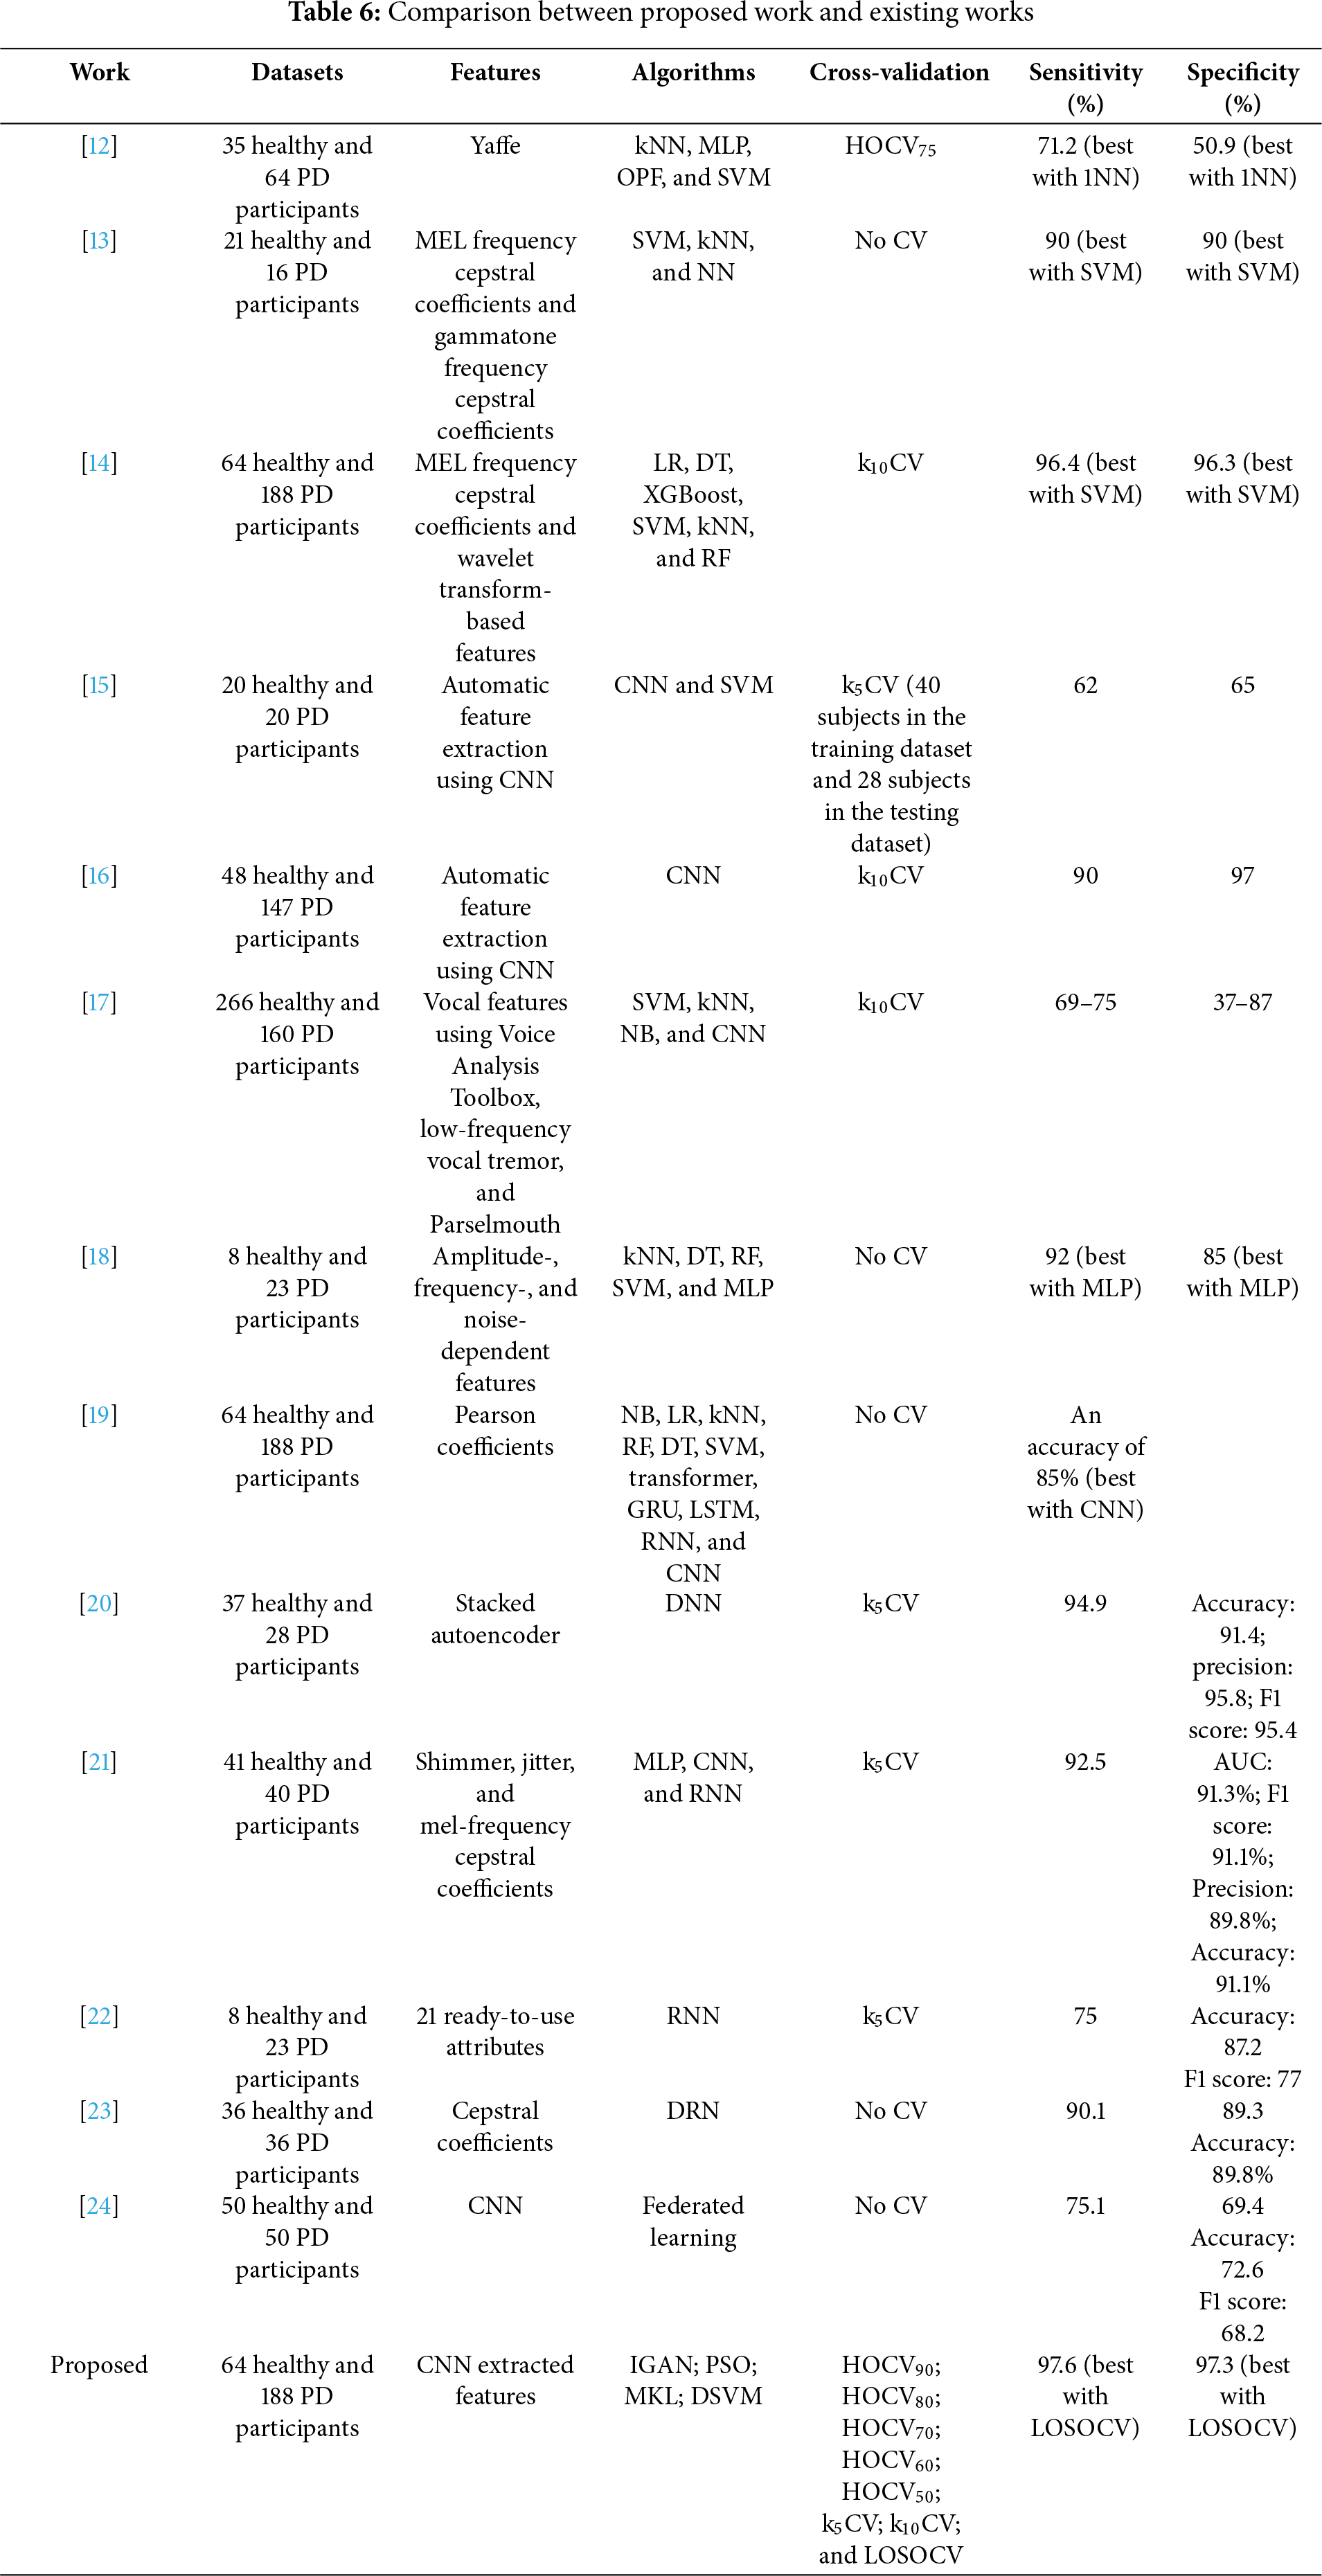
A comparison is made between the proposed work and existing works from six perspectives, including datasets, features, algorithms, cross-validation, sensitivity, and specificity. Table 6 summarizes the details. Although various benchmark datasets were used in the literature, the results should not deviate too much between datasets because the data is reliable voice data. The discussion is based on each perspective as follows:
(a) Datasets: All datasets collect voice signals from two groups of participants: the healthy group and the PD group. Imbalanced datasets are observed in [12–14,16–19] and our work. The control group size is larger than the PD group in [12,13,17]. In contrast, the PD group size is larger in [14,16,18,19] and our work. Challenges may be experienced in the formulation of the PD detection model, where the model is more prone to bias toward the majority class. This can be evaluated based on the deviations between sensitivity and specificity.
(b) Features: Two types of feature extraction approaches were employed: (i) Traditional domain knowledge-based features [12–14,17–19]; and (ii) Automatic feature extraction without domain knowledge via CNN [15,16] (and our work).
(c) Algorithms: Traditional machine learning algorithms were employed with relatively low computational requirements [12–14,17–19]. More computationally intensive deep learning-based algorithms were used in [15–19] and our work. Deep learning algorithms do not guarantee better performance than traditional machine learning algorithms.
(d) Cross-validation: Three types of cross-validation approaches were utilized in the literature (i) HOCV [12]; (ii) kCV [14–17], and (iii) single-split (training and testing datasets) validation [13,18,19]. Our work provides further analysis of these types of cross-validation, as well as LOSOCV. It suggests that LOSOCV will obtain a better, unbiased estimate of the PD detection model and, thus, generally achieve the best sensitivity and specificity. Since the computational complexity is significantly higher in LOSOCV, particularly in deep learning-based algorithms, k5CV and k10CV are good alternatives for a reliable estimate given a sufficient sample size.
(e) Sensitivity: It is noted that [19] only shared the accuracy without the breakdown into sensitivity and specificity. In the imbalanced datasets in [12,17,18] towards the PD group, biased detection is observed with a larger sensitivity value than specificity. In [16], biased control group detection is observed (a larger specificity value than sensitivity). On the other hand, biased detection is observed in the balanced dataset [15]. Our work utilizes IGAN, PSO-optimized MKL-based DSVM to reduce the impact of the imbalanced dataset. Our work improves sensitivity by 1.24%–57.4% compared with existing work.
(f) Specificity: The specificity in works [15,16] is less than the sensitivity. Our work improves the specificity by 1.04%–163% compared with existing works.
3.6 Statistical Significance between Proposed Work and Existing Works
A non-parametric Wilcoxon signed-rank test is selected to test the hypothesis that the proposed work statistically outperforms the existing works (results of Sections 3.2 to 3.4). The best results of the configurations (cross-validation type) are used in the analysis. Table 7 summarizes the results of the hypothesis testing. The proposed algorithm statistically outperforms other approaches because the p-values of all hypotheses were less than 0.05 (95% confidence interval).
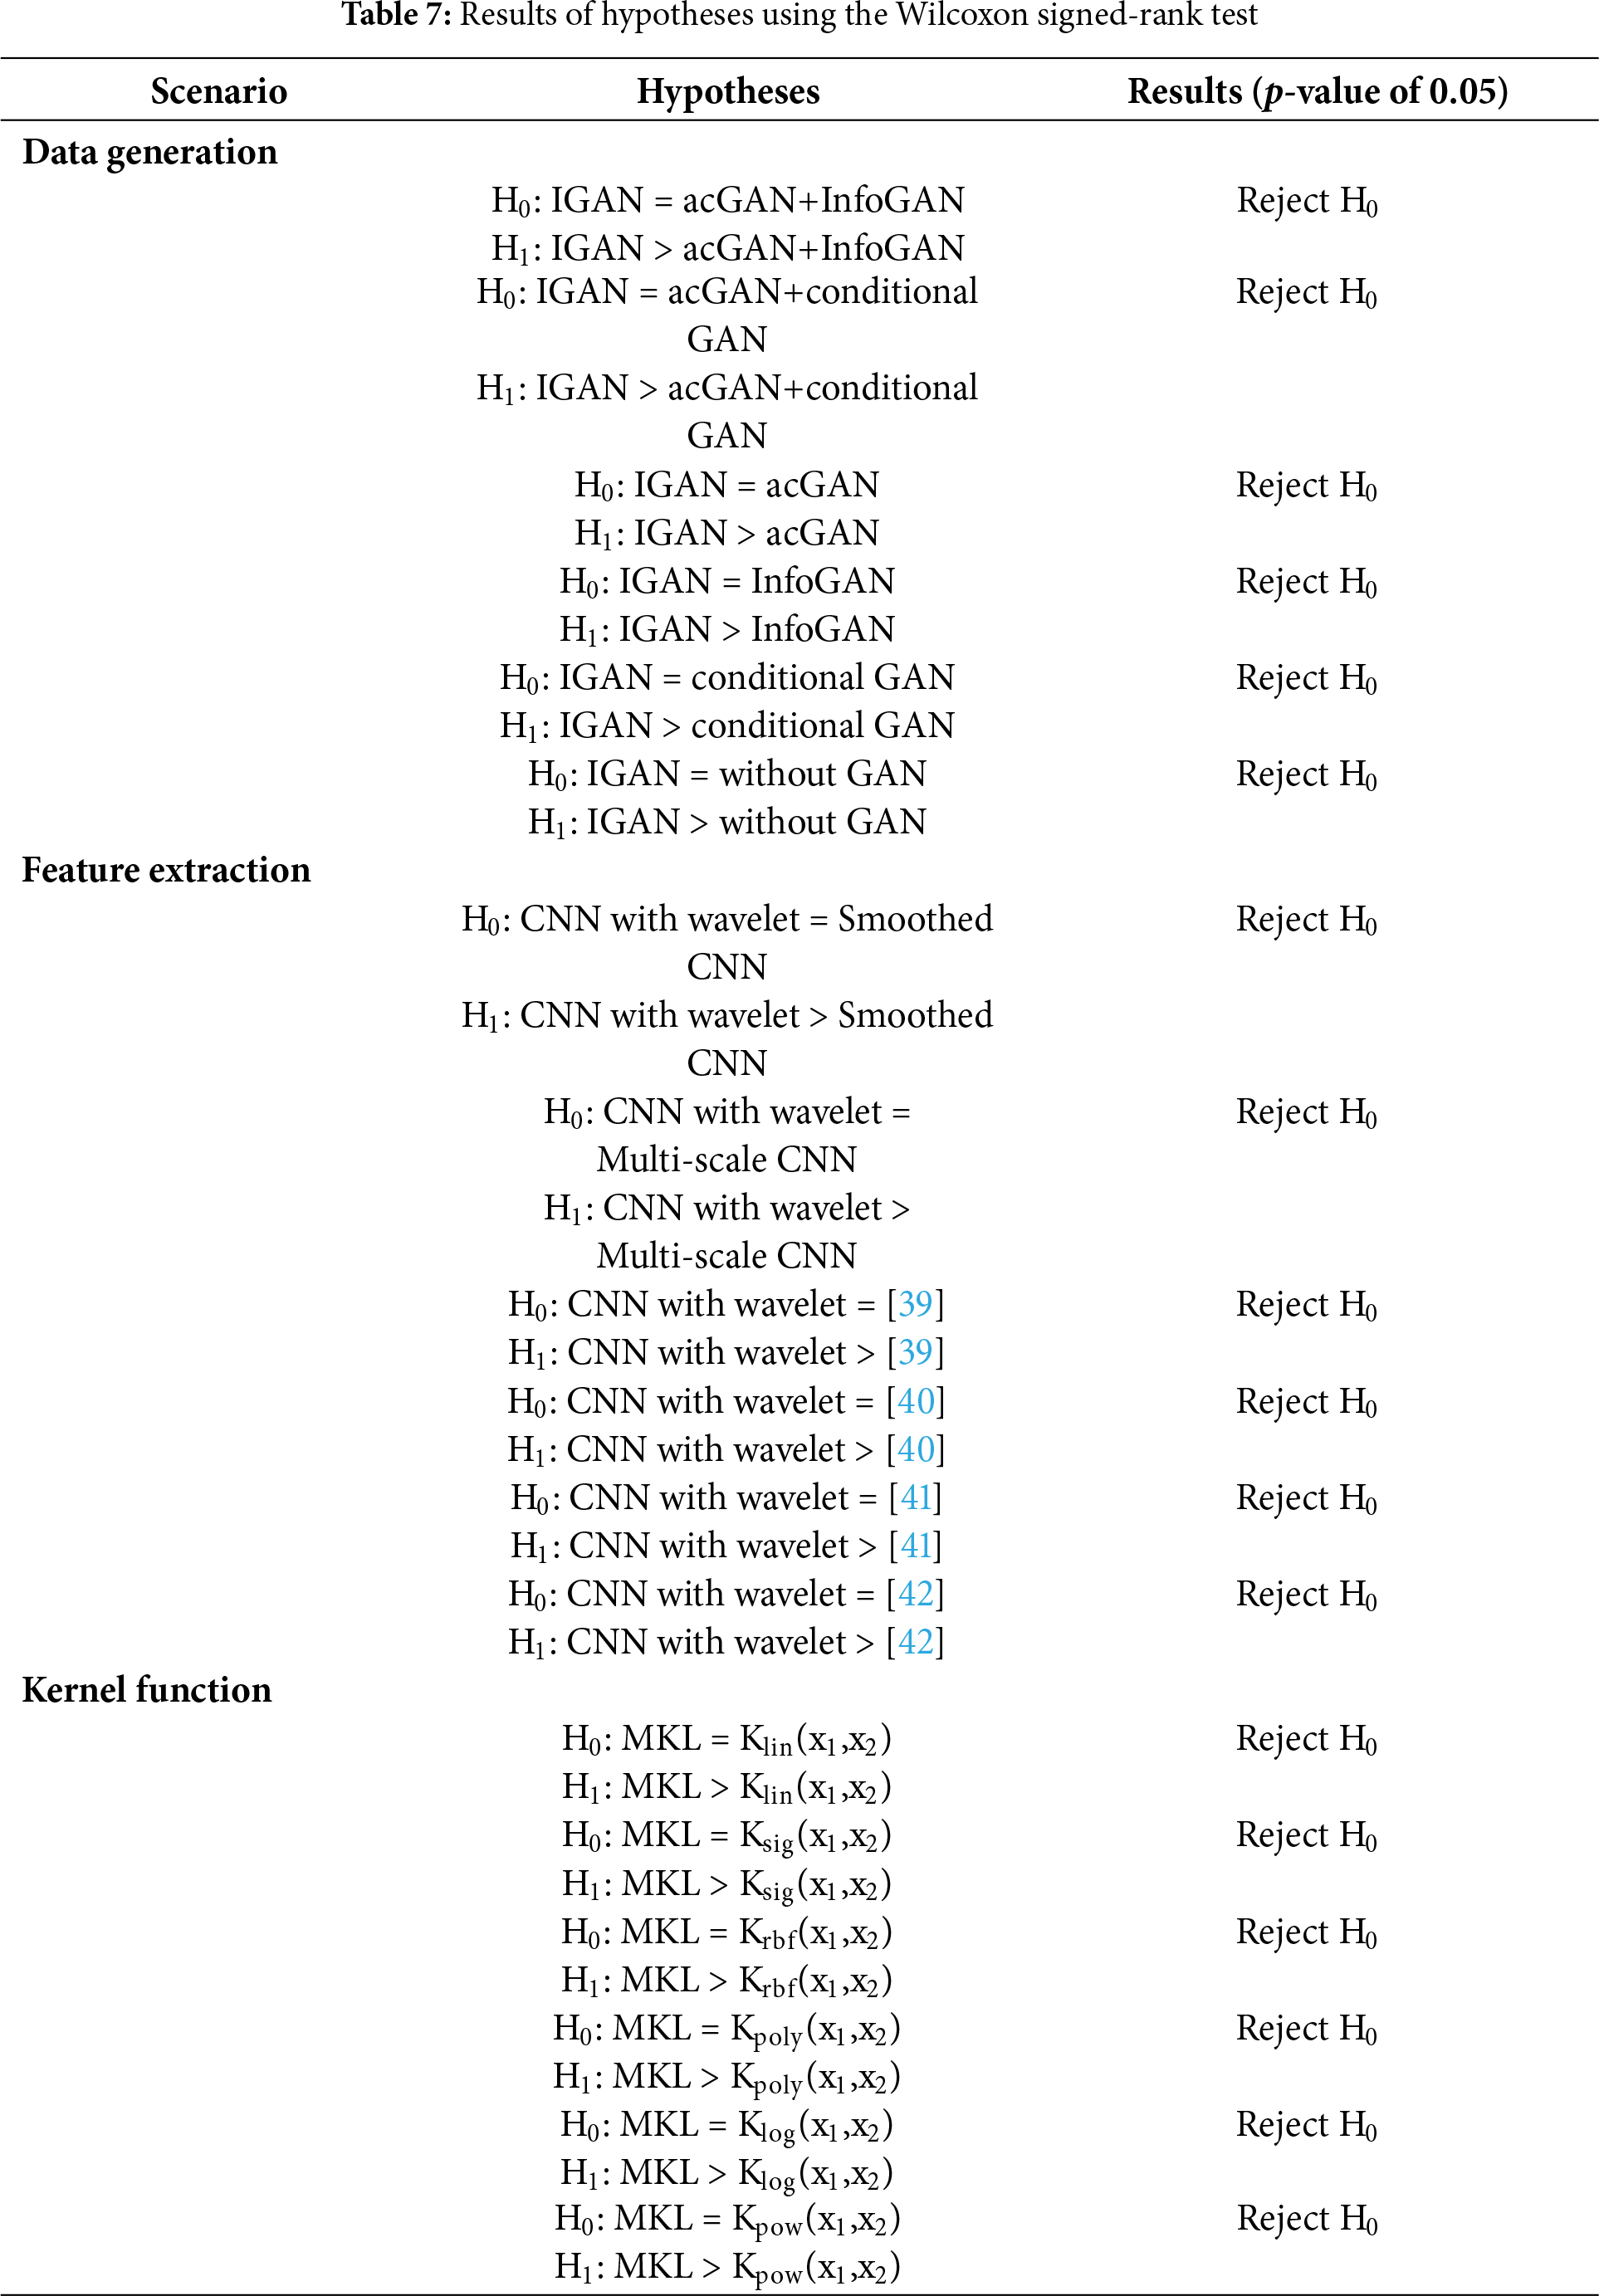
Recall the performance comparison between our work and existing works (Table 6), two of the existing works demonstrated high-performing models. The work [14] was benchmarked using the identical dataset as in our work, achieving a sensitivity of 96.4% and 96.3%, respectively. Another work was evaluated using a smaller-sized dataset (37 healthy controls and 28 patients), achieving a sensitivity of 94.9% and an accuracy of 91.4%. Our proposed work achieved a statistically better performance in PD detection and is believed to be more flexible in handling applications with biomedical data. CNN with wavelet transform facilitated a better extraction of representative features and DSVM with optimal kernel function via MKL with PSO tailored a kernel for PD detection, and IGAN generates useful data to boost the model performance. However, our research team acknowledged the key limitations that some of the deep learning processes are not fully explainable (also being a typical issue in deep learning algorithms). For example, traditional features, including vocal biomarkers, jitters, amplitude modulations, and temporal patterns, are explainable, but very high-dimensional deep features are not. The team thus conducted extensive analyses, ablation experiments, and comparisons to evaluate the performance of the proposed method.
The proposed CNN-DSVM model with IGAN represents a significant advancement in the early screening of Parkinson’s disease, offering a low-cost, non-invasive, and scalable solution. From a technical perspective, its integration into various systems can enhance clinical workflows and improve patient outcomes. In clinical settings, the model could be embedded within telehealth platforms, enabling remote consultations between general practitioners and patients. By utilizing common digital devices, such as smartphones and tablets, the model can gather screening voice data in real-time. This would facilitate a streamlined process where clinicians could efficiently assess risk factors through user-friendly interfaces, thus allowing for timely referrals to specialists if needed. Moreover, the data generated from these screenings can be collected and analyzed at scale, contributing to a richer dataset that can inform future research and clinical practices. Additionally, the incorporation of the model into mobile health applications can empower patients with self-monitoring capabilities. Users could regularly assess their symptoms and receive instant feedback, leading to increased awareness and engagement in their health management. This feature could potentially enhance the patient-provider relationship, as clinicians can track patient progress over time and adjust treatments based on empirical data. As a decision-support tool, the model can improve the diagnostic acumen of general practitioners. By analyzing patient data and identifying potential PD indicators, the tool would provide evidence-based recommendations for referral to neurologists or movement disorder specialists. This would ensure that patients receive comprehensive care without unnecessary delays, aligning with current efforts towards personalized medicine. Integrating the proposed model into existing healthcare systems highlights its potential to revolutionize early PD screening, ensuring more accessible, efficient, and informed patient care. Its implementation could significantly reduce the burden on healthcare providers while enhancing the patient experience.
Diagnosing PD via voice signal becomes a promising solution that takes advantage of easy collection and performance of machine learning models. This paper considers the limitations of existing works in four aspects: imbalanced dataset, feature extraction, types of cross-validation, and accuracy. IGAN is introduced to generate additional training data to minimize the impact of the imbalanced dataset in a biased detection model towards the majority class. A CNN module is applied to automatically extract features that feed to a PSO-optimized MKL-based DSVM module. Performance evaluation concludes (i) the proposed work achieves sensitivity and specificity of 97.6% and 97.3%, respectively; (ii) proposed IGAN improves the sensitivity and specificity by 4.05%–4.72% and 4.96%–5.86%, respectively, compared with other data generation algorithms; (iii) automatic feature extraction via CNN improves the sensitivity and specificity by 4.05%–14.2% and 4.18%–14.6%, respectively, compared with traditional feature extraction approaches; (iv) PSO-optimized MKL-based kernel function improves the sensitivity and specificity by 4.88%–16.4% and 5.60%–17.1%, respectively, compared with traditional kernel functions; and (v) proposed method improves the sensitivity and specificity by 1.24%–57.4% and 1.04%–163%, respectively, compared with existing works.
To compare the deep learning-based PD detection with clinical diagnostic approaches, deep learning takes two major advantages in (i) processing vast amounts of data and identifying complex patterns that may be difficult for clinicians to discern. In contrast, traditional methods, which often rely on clinical assessments and questionnaires, may lack the sensitivity needed to detect early-stage PD; and (ii) Traditional clinical assessments can be influenced by a clinician’s experience and subjective judgment. A deep learning model, once trained, offers a more objective analysis of patient data, potentially reducing the variability in diagnosis among different clinicians.
While deep learning can enhance diagnostic capabilities, it must be integrated into existing clinical workflows. Traditional approaches often rely on standard clinical procedures and guidelines. If the deep learning model is to be adopted, it needs to align with these practices to ensure that it complements rather than complicates clinical workflows. While deep learning models for PD detection promise enhanced accuracy and objectivity, they must address deployment challenges, integrate well with clinical practices, and demonstrate reliability in diverse settings to be considered a viable alternative or complement to traditional diagnostic approaches. Understanding the clinical implications, especially regarding varying PD stages, is vital for successful implementation.
Here are some potential future research directions to enhance the current research work. First, combining multiple benchmarks and heterogeneous datasets could increase the amount of ground truth data and thus benefit the data generation model. Second, collecting new voice data is feasible where region-wise datasets can be built up. Research could be conducted to investigate the characteristics of different groups of people.
Acknowledgement: Not applicable.
Funding Statement: The work described in this paper was fully supported by a grant from Hong Kong Metropolitan University (RIF/2021/05).
Author Contributions: The authors confirm their contribution to the paper as follows: study conception and design: Kwok Tai Chui, Brij B. Gupta; analysis and interpretation of results: Kwok Tai Chui, Varsha Arya, Brij B. Gupta, Miguel Torres-Ruiz, Razaz Waheeb Attar; draft manuscript preparation: Kwok Tai Chui, Varsha Arya, Brij B. Gupta, Miguel Torres-Ruiz, Razaz Waheeb Attar. All authors reviewed the results and approved the final version of the manuscript.
Availability of Data and Materials: Parkinson’s Disease Classification Data Set [14] was used as a benchmark dataset for performance evaluation and comparison of the PD detection models. The dataset can be accessed via: https://www.kaggle.com/datasets/porinitahoque/parkinsons-disease-pd-data-analysis (accessed on 24 September 2025).
Ethics Approval: Not applicable.
Conflicts of Interest: The authors declare no conflicts of interest to report regarding the present study.
References
1. Marras C, Beck JC, Bower JH, Roberts E, Ritz B, Ross GW, et al. Prevalence of Parkinson’s disease across North America. npj Parkinson’s Dis. 2018;4(1):1–7. doi:10.1038/s41531-018-0058-0. [Google Scholar] [PubMed] [CrossRef]
2. World Health Organization. Aging and health. Geneva, Switzerland: World Health Organization; 2024 Oct 1 [cited 2025 Jul 31]. Available from: https://www.who.int/news-room/fact-sheets/detail/ageing-and-health. [Google Scholar]
3. Statista. Parkinson’s disease death rate in the U.S. from 1999 to 2021. Hamburg, Germany: Statista; 2024 Oct 4 [cited 2025 Jul 31]. Available from: https://www-statista-com.ezproxy.lib.hkmu.edu.hk/statistics/784319/parkinsons-disease-death-rate-us/. [Google Scholar]
4. Statista. Death rate for Parkinson’s disease in Canada from 2002 to 2023. Hamburg, Germany: Statista; 2024 Dec 4 [cited 2025 May 3]. Available from: https://www-statista-com.ezproxy.lib.hkmu.edu.hk/statistics/434428/death-rate-for-parkinson-s-disease-in-canada/. [Google Scholar]
5. Statista. Number of deaths from Parkinson’s disease in Spain between 2005 and 2018. Hamburg, Germany: Statista; 2019 Dec 30 [cited 2025 May 3]. Available from: https://www-statista-com.ezproxy.lib.hkmu.edu.hk/statistics/753594/number-of-deaths-from-parkinson-in-spain/. [Google Scholar]
6. World Health Organization. Global strategy on human resources for health: Workforce 2030. Geneva, Switzerland: World Health Organization; 2016 [cited 2025 May 3]. Available from: https://iris.who.int/bitstream/handle/10665/250368/9789241511131-eng.pdf. [Google Scholar]
7. Contreras-Ruston F, Duggirala SX, Wingbermühle J, Navarra J, Kotz SA. Sensory feedback in parkinson disease voice production: a systematic review. J Voice Early Access. 2025;20:e3001742. doi:10.1016/j.jvoice.2025.02.039. [Google Scholar] [PubMed] [CrossRef]
8. Dudek M, Hemmerling D, Kaczmarska M, Stepien J, Daniol M, Wodzinski M, et al. Analysis of voice, speech, and language biomarkers of parkinson’s disease collected in a mixed reality setting. Sensors. 2025;25(8):2405. doi:10.3390/s25082405. [Google Scholar] [PubMed] [CrossRef]
9. Rahmatallah Y, Kemp AS, Iyer A, Pillai L, Larson-Prior LJ, Virmani T, et al. Pre-trained convolutional neural networks identify Parkinson’s disease from spectrogram images of voice samples. Sci Rep. 2025;15(1):7337. doi:10.1038/s41598-025-92105-6. [Google Scholar] [PubMed] [CrossRef]
10. Navas C, Wells L, Bartels SA, Walker M. Patient and provider perspectives on emergency department care experiences among people with mental health concerns. Healthcare. 2022;10(7):1297. doi:10.3390/healthcare10071297. [Google Scholar] [PubMed] [CrossRef]
11. Samartzis M, Talias MA. Assessing and improving the quality in mental health services. Int J Environ Res Public Health. 2020;17(1):249. doi:10.3390/ijerph17010249. [Google Scholar] [PubMed] [CrossRef]
12. Almeida JS, Pedro P, Filho R, Carneiro T, Wei W, Damaševičius R, et al. Detecting Parkinson’s disease with sustained phonation and speech signals using machine learning techniques. Pattern Recognit Lett. 2019;125(2):55–62. doi:10.1016/j.patrec.2019.04.005. [Google Scholar] [CrossRef]
13. Di Cesare MG, Perpetuini D, Cardone D, Merla A. Machine learning-assisted speech analysis for early detection of Parkinson’s disease: a study on speaker diarization and classification techniques. Sensors. 2024;24(5):1499. doi:10.3390/s24051499. [Google Scholar] [PubMed] [CrossRef]
14. Dhanalakshmi S, Das S, Senthil R. Speech features-based Parkinson’s disease classification using combined SMOTE-ENN and binary machine learning. Health Technol. 2024;14(2):393–406. doi:10.1007/s12553-023-00810-x. [Google Scholar] [CrossRef]
15. Khaskhoussy R, Ayed YB. Improving Parkinson’s disease recognition through voice analysis using deep learning. Pattern Recognit Lett. 2023;168(1):64–70. doi:10.1016/j.patrec.2023.03.011. [Google Scholar] [CrossRef]
16. Majidinia H, Khatib F, Seyyed Mahdavi Chabok SJ, Kobravi HR, Rezaeitalab F. Diagnosis of Parkinson’s disease using convolutional neural network-based audio signal processing on FPGA. Circuits Syst Signal Process. 2024;43(7):4221–38. doi:10.1007/s00034-024-02636-y. [Google Scholar] [CrossRef]
17. Costantini G, Cesarini V, Di Leo P, Amato F, Suppa A, Asci F, et al. Artificial intelligence-based voice assessment of patients with Parkinson’s disease off and on treatment: machine vs. deep-learning comparison. Sensors. 2023;23(4):2293. doi:10.3390/s23042293. [Google Scholar] [PubMed] [CrossRef]
18. Alshammri R, Alharbi G, Alharbi E, Almubark I. Machine learning approaches to identify Parkinson’s disease using voice signal features. Front Artif Intell. 2023;6(2023):1084001. doi:10.3389/frai.2023.1084001. [Google Scholar] [PubMed] [CrossRef]
19. Goyal P, Rani R. Comparative analysis of machine learning, ensemble learning and deep learning classifiers for Parkinson’s disease detection. SN Comput Sci. 2024;5(1):66. doi:10.1007/s42979-023-02368-x. [Google Scholar] [CrossRef]
20. Valarmathi P, Suganya Y, Saranya KR, Shanmuga Priya S. Enhancing parkinson disease detection through feature based deep learning with autoencoders and neural networks. Sci Rep. 2025;15(1):8624. doi:10.1038/s41598-025-88293-w. [Google Scholar] [PubMed] [CrossRef]
21. Shen M, Mortezaagha P, Rahgozar A. Explainable artificial intelligence to diagnose early Parkinson’s disease via voice analysis. Sci Rep. 2025;15(1):11687. doi:10.1038/s41598-025-96575-6. [Google Scholar] [PubMed] [CrossRef]
22. Aliero AS, Malhotra N. Comparative study of deep learning models for Parkinson’s disease detection. BenchCouncil Trans Benchmarks Standa Eval. 2025;5(2):100219. doi:10.1016/j.tbench.2025.100219. [Google Scholar] [CrossRef]
23. Shanmugam S, Arumugam C. Hybrid ladybug Hawk optimization-enabled deep learning for multimodal Parkinson’s disease classification using voice signals and hand-drawn images. Netw Comput Neural Syst. 2025;55(3):1–43. doi:10.1080/0954898X.2025.2457955. [Google Scholar] [PubMed] [CrossRef]
24. Quan C, Chen Z, Ren K, Luo Z. FedOcw: optimized federated learning for cross-lingual speech-based Parkinson’s disease detection. npj Digit Med. 2025;8(1):357. doi:10.1038/s41746-025-01763-3. [Google Scholar] [PubMed] [CrossRef]
25. Liu Z, Alavi A, Li M, Zhang X. Self-supervised contrastive learning for medical time series: a systematic review. Sensors. 2023;23(9):4221. doi:10.3390/s23094221. [Google Scholar] [PubMed] [CrossRef]
26. Zhang X, Wang J, Wei J, Yuan X, Wu M. A review of non-fully supervised deep learning for medical image segmentation. Information. 2025;16(6):433. doi:10.3390/info16060433. [Google Scholar] [CrossRef]
27. Li Y, Huang C, Ding L, Li Z, Pan Y, Gao X. Deep learning in bioinformatics: introduction, application, and perspective in the big data era. Methods. 2019;166(8):4–21. doi:10.1016/j.ymeth.2019.04.008. [Google Scholar] [PubMed] [CrossRef]
28. Suganyadevi S, Seethalakshmi V, Balasamy K. A review on deep learning in medical image analysis. Int J Multimed Inf Retr. 2022;11(1):19–38. doi:10.1007/s13735-021-00218-1. [Google Scholar] [PubMed] [CrossRef]
29. Kaur H, Pannu HS, Malhi AK. A systematic review on imbalanced data challenges in machine learning: applications and solutions. ACM Comput Surv. 2019;52(4):79. doi:10.1145/3343440. [Google Scholar] [CrossRef]
30. Johnson JM, Khoshgoftaar TM. Survey on deep learning with class imbalance. J Big Data. 2019;6(1):27. doi:10.1186/s40537-019-0192-5. [Google Scholar] [CrossRef]
31. Pan Z, Yu W, Yi X, Khan A, Yuan F, Zheng Y. Recent progress on generative adversarial networks (GANsa survey. IEEE Access. 2019;7:36322–33. doi:10.1109/ACCESS.2019.2905015. [Google Scholar] [CrossRef]
32. Navidan H, Moshiri PF, Nabati M, Shahbazian R, Ghorashi SA, Shah-Mansouri V, et al. Generative Adversarial Networks (GANs) in networking: a comprehensive survey & evaluation. Comput Netw. 2021;194(3):108149. doi:10.1016/j.comnet.2021.108149. [Google Scholar] [CrossRef]
33. Odena A, Olah C, Shlens J. Conditional image synthesis with auxiliary classifier gans. In: The International Conference on Machine Learning; 2017 Aug 6–11; Sydney, Australia. [Google Scholar]
34. Chen X, Duan Y, Houthooft R, Schulman J, Sutskever I, Abbeel P. Infogan: interpretable representation learning by information maximizing generative adversarial nets. Adv Neural Inf Process Syst. 2016;29:1–9. doi:10.48550/arXiv.1606.03657. [Google Scholar] [CrossRef]
35. Mirza M, Osindero S. Conditional generative adversarial nets. arXiv:1411.1784. 2014. [Google Scholar]
36. Dong S, Wang P, Abbas K. A survey on deep learning and its applications. Comput Sci Rev. 2021;40(1):100379. doi:10.1016/j.cosrev.2021.100379. [Google Scholar] [CrossRef]
37. Ren P, Xiao Y, Chang X, Huang PY, Li Z, Gupta B, et al. A survey of deep active learning. ACM Comput Surv. 2021;54(9):180. doi:10.1145/3472291. [Google Scholar] [CrossRef]
38. Gunantara N. A review of multi-objective optimization: methods and its applications. Cogent Eng. 2018;5(1):1502242. doi:10.1080/23311916.2018.1502242. [Google Scholar] [CrossRef]
39. Mostafa SA, Mustapha A, Mohammed MA, Hamed RI, Arunkumar N, Ghani MKA, et al. Examining multiple feature evaluation and classification methods for improving the diagnosis of Parkinson’s disease. Cogn Syst Res. 2019;54(1):90–9. doi:10.1016/j.cogsys.2018.12.004. [Google Scholar] [CrossRef]
40. Sakar CO, Serbes G, Gunduz A, Tunc HC, Nizam H, Sakar BE, et al. A comparative analysis of speech signal processing algorithms for Parkinson’s disease classification and the use of the tunable Q-factor wavelet transform. Appl Soft Comput. 2019;74(4):255–63. doi:10.1016/j.asoc.2018.10.022. [Google Scholar] [CrossRef]
41. Gunduz H. Deep learning-based Parkinson’s disease classification using vocal feature sets. IEEE Access. 2019;7:115540–51. doi:10.1109/ACCESS.2019.2936564. [Google Scholar] [CrossRef]
42. Masud M, Singh P, Gaba GS, Kaur A, Alroobaea R, Alrashoud M, et al. CROWD: crow search and deep learning based feature extractor for classification of Parkinson’s disease. ACM Trans Internet Technol. 2021;21(3):77. doi:10.1145/3418500. [Google Scholar] [CrossRef]
Cite This Article
 Copyright © 2026 The Author(s). Published by Tech Science Press.
This work is licensed under a Creative Commons Attribution 4.0 International License , which permits unrestricted use, distribution, and reproduction in any medium, provided the original work is properly cited.
 Downloads
 Citation Tools