
 Submit a Paper
 Propose a Special lssue
 Open Access
ARTICLE

YOLO-SDW: Traffic Sign Detection Algorithm Based on YOLOv8s Skip Connection and Dynamic Convolution
1 School of Information Engineering, Henan University of Science and Technology, Luoyang, 471000, China
2 Henan Province New Energy Vehicle Power Electronics and Power Transmission Engineering Research Center, Luoyang, 471000, China
3 School of Electronics and Information, Zhengzhou University of Aeronautics, Zhengzhou, 450046, China
* Corresponding Author: Juwei Zhang. Email:
(This article belongs to the Special Issue: Advances in Object Detection: Methods and Applications)
Computers, Materials & Continua 2026, 86(1), 1-20. https://doi.org/10.32604/cmc.2025.069053
Received 13 June 2025; Accepted 05 September 2025; Issue published 10 November 2025
 View Full Text
 Download PDF
Abstract
Traffic sign detection is an important part of autonomous driving, and its recognition accuracy and speed are directly related to road traffic safety. Although convolutional neural networks (CNNs) have made certain breakthroughs in this field, in the face of complex scenes, such as image blur and target occlusion, the traffic sign detection continues to exhibit limited accuracy, accompanied by false positives and missed detections. To address the above problems, a traffic sign detection algorithm, You Only Look Once-based Skip Dynamic Way (YOLO-SDW) based on You Only Look Once version 8 small (YOLOv8s), is proposed. Firstly, a Skip Connection Reconstruction (SCR) module is introduced to efficiently integrate fine-grained feature information and enhance the detection accuracy of the algorithm in complex scenes. Secondly, a C2f module based on Dynamic Snake Convolution (C2f-DySnake) is proposed to dynamically adjust the receptive field information, improve the algorithm’s feature extraction ability for blurred or occluded targets, and reduce the occurrence of false detections and missed detections. Finally, the Wise Powerful IoU v2 (WPIoUv2) loss function is proposed to further improve the detection accuracy of the algorithm. Experimental results show that the average precision mAP@0.5 of YOLO-SDW on the TT100K dataset is 89.2%, and mAP@0.5:0.95 is 68.5%, which is 4% and 3.3% higher than the YOLOv8s baseline, respectively. YOLO-SDW ensures real-time performance while having higher accuracy.Keywords
Amid the accelerating progress in autonomous driving systems, traffic safety issues are becoming increasingly important. Human error is the leading cause of approximately 90% of traffic accidents [1]. Autonomous driving can significantly reduce the probability of traffic accidents. However, varying lighting conditions and urban street environments still pose challenges to personal safety. For autonomous driving technology, traffic sign detection is paramount. It provides prompts based on signs such as speed or weight limits, enabling drivers to take appropriate driving actions. Supporting the driving process helps lower the risk of traffic accidents and enhances overall safety. In complex traffic scenarios, it is crucial to balance real-time processing with high detection accuracy.
At present, the mainstream target detection algorithms are mainly divided into traditional target algorithms and deep learning-based target detection algorithms. Traditional target detection algorithms heavily rely on manual design, lack versatility, and suffer from low detection accuracy. The advancement of deep learning has led to target detection algorithms based on this technology becoming the dominant approach for traffic sign recognition. Deep learning-based target detection algorithms are mainly divided into two categories: two-stage algorithms and one-stage algorithms. The most representative of the two-stage target detection algorithms is Region-based Convolutional Neural Networks (R-CNN) [2]. It segments the image into Candidate areas and employs a convolutional neural network to obtain their features. Fast R-CNN [3] treats the target detection task as a whole and adopts an end-to-end model to integrate target detection from input to output, thereby accelerating the detection process. Faster R-CNN [4] combines the Region Proposal Network (RPN) to streamline the detection pipeline and enhance speed. Mask R-CNN [5] processes the detected targets at the pixel level, generates segmentation masks, and realizes instance segmentation. Although two-stage target detection algorithms offer precise detection, their processing speed is slow, resulting in suboptimal real-time performance.
The one-stage target detection algorithm You Only Look Once (YOLO) [6] uses a prediction box mechanism and supports efficient detection, while exhibiting limited accuracy and imprecise localization. Single Shot MultiBox Detector (SSD) [7] can perform classification tasks while generating candidate boxes, which improves the detection speed. YOLOv3 [8] uses K-means clustering to generate multiple anchor boxes, which accelerates the convergence speed and detection speed. YOLOv4 [9] uses the Mosaic data enhancement method and the Complete Intersection over Union (CIoU) loss function to improve regression precision and overall detection effectiveness. YOLOv5 [10] uses a lightweight backbone network Cross-Stage Partial (CSPNet), and optimizes adaptive image scaling to further speed up the detection speed. YOLOv7 [11] introduces the Extended efficient layer aggregation networks (E-ELAN) module, uses grouped convolution to augment the computational block’s channels and cardinality, enhances the feature extraction capability, and optimizes the calculation process. The anchor-free strategy adopted by YOLOv8 [12] eliminates the need for complex anchor box designs, leading to improved detection speed. Murat Bakirci [13] was among the first to apply YOLOv8 to vehicle detection tasks in intelligent transportation systems. Compared to YOLOv5, YOLOv8 offers higher detection accuracy and stronger real-time performance, making it an efficient solution for object detection in traffic scenarios. Consequently, YOLOv8 is well-suited for traffic sign detection in complex environments and can effectively meet the accuracy and speed requirements of autonomous driving applications.
This paper adopts YOLOv8s as the basic algorithm and proposes YOLO-SDW, where S, D, and W represent the Skip Connection Reconstruction (SCR) module, the C2f module based on Dynamic Snake Convolution (C2f-DySnake), and the Wise Powerful IoU v2 (WPIoUv2) loss function.
The SCR module proposed in this paper is different from the traditional skip connection structure. It removes the C5 feature layer in the YOLOv8 feature pyramid and introduces two targeted skip connections to enhance feature fusion capabilities. In addition, the WPIoUv2 loss function integrates the advantages of the WIoU and Powerful IoU v2 (PIoUv2) loss functions and is a specific integration method that can improve positioning accuracy and generalization ability.
The main contributions of this paper are as follows:
• A feature fusion network based on the skip connection reconstruction module (SCR) is proposed to integrate the fine-grained information in the image so that the information fusion ability between the backbone and the neck network is improved.
• The C2f-DySnake module is proposed, which combines dynamic snake convolution with C2f modularity. The convolution kernel of dynamic snake convolution is variable and can flexibly adjust the receptive field information, thus strengthening feature extraction and decreasing both erroneous identifications and missed detections.
• The WPIoUv2 loss function is proposed, the gradient gain is introduced, and the dynamic non-monotonic attention function is adopted to fully exploit the benefits of gradient adjustment. The penalty term of the loss function can be dynamically adjusted to further enhance the algorithm’s detection accuracy.
The rest of the paper is arranged as follows. Section 2 discusses prior work in the area of traffic sign detection. Section 3 details the improvement strategies of this paper: SCR module, C2f-DySnake module, and WPIoUv2 loss function. Section 4 introduces the experimental settings, evaluation indicators, ablation experiments, and comparative experiments. Section 5 concludes the findings of this study and outlines potential directions for future work.
The rapid growth of the automotive industry has popularized autonomous driving technology, making traffic sign detection a critical research direction. For different traffic scenarios, the performance of traffic sign detection is greatly affected by uncontrollable factors in complex scenarios, the generalization ability is limited, and the accuracy and real-time performance face challenges. In response to the above problems, many researchers have carried out extensive work in traffic sign detection.
Wang et al. [14] introduced the bidirectional feature fusion network Res2Net to improve YOLOv5’s ability to extract multi-scale features, but the algorithm is complex and performs inference slowly. Ren et al. [15] combined the self-attention BiFormer with the Attention based Intra-scale Feature Interaction (AIFI) module in the transformer and proposed the BiFormer-AIFI (B-AIFI) module, which establishes global feature map connectivity and strengthens multi-scale feature interactions in YOLOv7. However, due to the complex calculation of BiFormer self-attention, it is not friendly in actual deployment and has high requirements for hardware equipment.
Peng et al. [16] combined the Mixed Local Channel Attention (MLCA) with the C2f module of the YOLOv8 algorithm. The MLCA attention fuses spatial with channel information and integrates local and global features, which improves the C2f module’s ability to extract target features from the complex background of the image. However, the experimental validation provided is limited, which leaves the effectiveness of the proposed algorithm insufficiently demonstrated. Zhao et al. [17] proposed the YOLO-MAM dual-branch structure, in which the Fine Refinement Module (FRM) captures context-rich information for extracting key features. The introduction of nonlinear networks in Omnidirectional State Space (OSS) and the selective scanning mechanism of Omnidirectional Selective Scanning Module (OSSM) can enhance the image receptive field extraction from multiple directions and extract deeper feature information, thereby improving YOLOv8’s ability to extract features in challenging traffic environments. However, the complexity of the algorithm and its reliance on high-performance hardware may pose challenges for real-world deployment.
Zheng et al. [18] improved on the basis of Efficient IoU (EIoU) and proposed Wise-Focaler-EIoU loss function, the weight assigned to the sample changes with the sample quality, thereby improving the detector performance. However, integrating three different loss functions introduces considerable computational overhead, which may impact the model’s efficiency in practical applications. Yu et al. [19] developed the CIoU-tune loss function by adding a scaling factor to CIoU. This approach more accurately captures the width and height deviations between the predicted and actual boxes, leading to enhanced localization performance. However, when the width-to-width and height-to-height ratios of the predicted box and the true box are linear, the scaling factor will lose its effect, and the effect of CIoU-tune will be weakened.
Although these methods for traffic sign detection have led to improved accuracy, the computational complexity is high, and it is not possible to balance the accuracy and real-time performance of the algorithm. Additionally, false positives and missed detections remain a challenge in traffic sign detection. Accordingly, this study improves YOLOv8s to enhance traffic sign detection performance and mitigate occurrences of erroneous identifications and missed detections.
In real-world traffic scenes, traffic signs make up only a small part of the visual field, and the detection difficulty varies with the size of traffic signs. To ensure both precision and real-time responsiveness in autonomous vehicle operation, this paper studies and develops a traffic sign detection algorithm, YOLOv8-SDW, as shown in Fig. 1. First, the network structure is improved, and the skip connection reconstruction module SCR is proposed to boost the network’s ability to fuse features effectively. Secondly, based on dynamic snake convolution, the C2f-DySnake module is proposed to enhance the ability to extract key feature information and alleviate occurrences of both erroneous identifications and missed detections. Finally, the WPIoUv2 loss function is introduced to enhance the algorithm’s detection accuracy and its generalization capability.
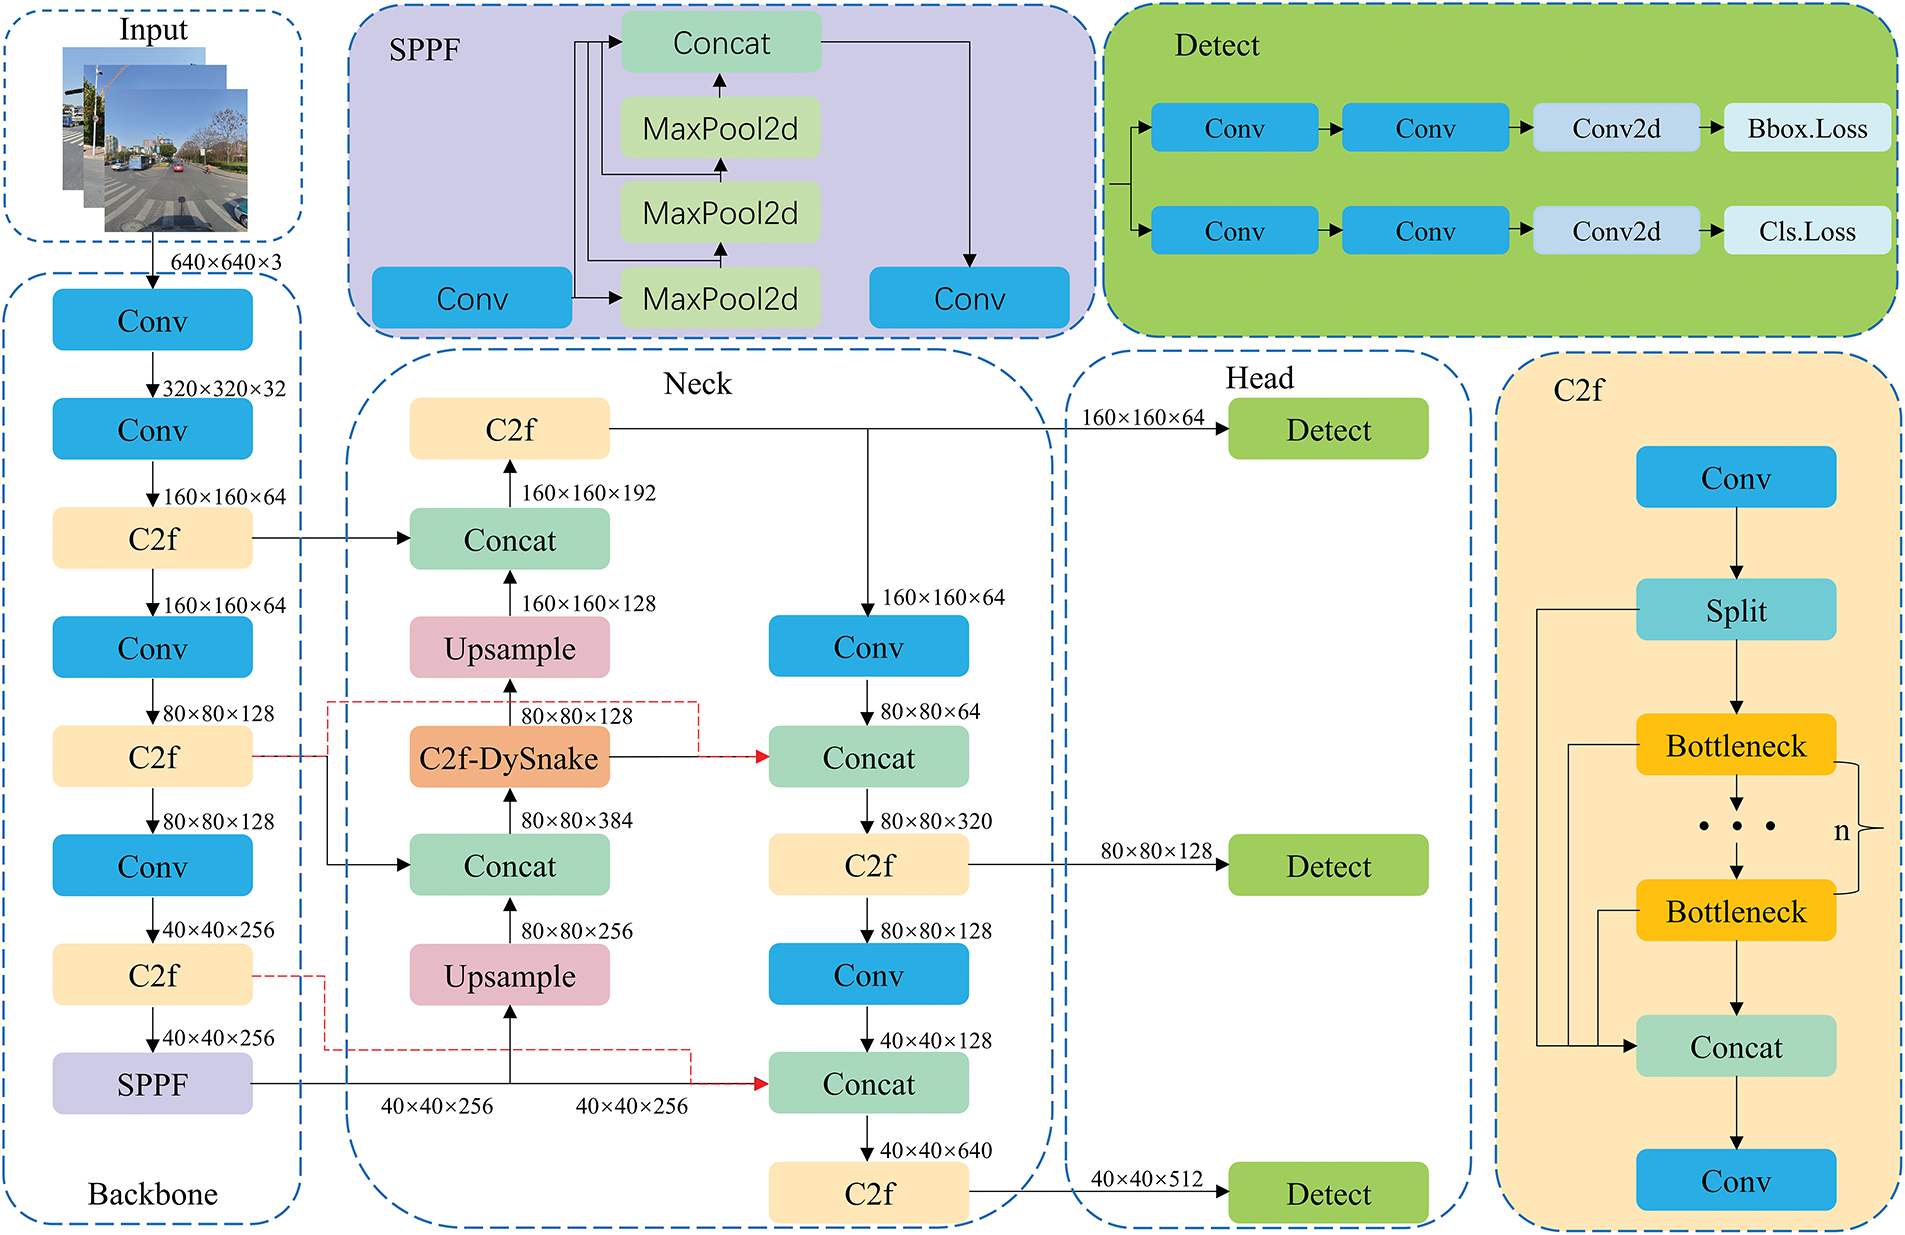
Figure 1: YOLO-SDW network structure
3.1 Skip Connection Reconstruction Module
By employing multi-stage downsampling, general target detection algorithms extract hierarchical features from feature maps, which are then used to effectively detect targets of diverse scales. However, the feature information varies across the layers of the image. The shallow layers provide detailed location information, while deep layers convey semantic features. Integrating these features effectively is essential for image object detection.
The feature pyramid network (FPN) [20] can utilize the feature information between different levels. By transferring the feature information of the shallow layer of the image to the deep layer of the image, more position information is retained, as shown in Fig. 2a. The Path Aggregation Networks (PANet) [21] adds a bottom-up fusion strategy based on FPN to supplement the semantic information in the deep layer of the image, making full use of the position information and semantic information between different levels of the image, as shown in Fig. 2b. The weighted bi-directional feature pyramid network (BiFPN) [22] proposes weighted fusion based on the different contributions of the input features of images of different resolutions to the output features. In terms of network structure, adding a connecting edge between the input nodes and output nodes of the same scale can fuse more feature information, as shown in Fig. 2c.

Figure 2: Feature pyramid network structure: (a) FPN uses a top-down pyramid structure; (b) PANet uses a pyramid structure that combines top-down and bottom-up; (c) BiFPN uses a bidirectional cross-scale connection and a weighted pyramid structure
The feature fusion network structure of YOLOv8 adopts the PAN+FPN structure. After five downsampling stages, five feature levels from shallow to deep are generated, C1 to C5. Among them, C3, C4, and C5 correspond to the output of 80 × 80, 40 × 40, and 20 × 20 feature maps, as shown in Fig. 3a. Considering that the deep resolution of the image is low, the position information is small, and the texture and edge information of the object are weak. The shallow resolution of the image is high, the position information is large, and the detailed information of the object is more obvious. Small target objects will lose more fine-grained information in low-resolution feature maps, so it is more appropriate to use high-resolution feature maps to process small targets. Therefore, this study discards the deep feature layer C5 in the YOLOv8 backbone and instead adopts a network structure based on the feature layers C2, C3, and C4, which correspond to output feature maps with resolutions of 160 × 160, 80 × 80, and 40 × 40, respectively, as illustrated in Fig. 3b.

Figure 3: Feature fusion network structure: (a) Basic structure of YOLOv8 including feature layers C1–C5; (b) Network structure of YOLOv8 after removing the C5 feature layer; (c) The Skip Connection Reconstruction structure SCR, in YOLOv8, introduces skip connections based on removing the C5 layer
The SCR module is inspired by the jump connection of BiFPN. It introduces a jump connection on the basis of abandoning the C5 feature map and adopting the C2 feature map. The structure diagram is shown in Fig. 3c. A jump connection line is added between the input and output of the C3 layer and the input and output of the C4 layer, respectively, to achieve a deeper connection between the backbone structure and the neck network, strengthen the capacity of PAN and FPN to integrate feature information from different depths of feature maps, and enhance the network’s feature fusion.
In YOLOv8, the C2f module mainly extracts detailed features of the target. Traffic signs of different categories and sizes contain different feature information and fine-grained information. When processing traffic signs in complex scenes, the feature information covered by traffic signs is relatively small. Relying solely on the original C2f module cannot effectively detect traffic signs. The fundamental reason for this problem is that the C2f module uses standard convolution with a fixed convolution kernel size, which results in a limited receptive field size. In the face of sparse feature information in complex scenes, the detection capability is limited, resulting in erroneous identifications and missed detections. Therefore, this paper proposes the C2f-DySnake module, which combines the dynamic snake convolution DySnake [23] with the C2f module to solve this problem.
Dynamic snake convolution is different from deformable convolution [24]. Deformable convolution introduces a learnable offset to make the convolution kernel variable, thereby increasing the receptive field. However, deformable convolution only introduces a learnable offset and does not constrain it, which may deviate from the target. However, dynamic snake convolution imposes constraints on the offset while introducing it. Even with some large offsets, the receptive field can be kept within the target range. The specific realization process of dynamic snake convolution is shown in Fig. 4. Taking the standard 3 × 3 convolution kernel as an example, the standard convolution kernel is pulled apart from the x-axis and y-axis directions, respectively. The formula for the position of the grid in the convolution kernel K is expressed as follows:
where the center position is

Figure 4: The specific implementation process of dynamic snake convolution. (a) The process diagram of dynamic snake convolution in the x and y directions (the red solid line indicates the direction actually selected by the dynamic snake convolution, and the dotted line indicates other optional directions); (b) The receptive field diagram of the 9 × 9 convolution kernel formed after the 3 × 3 convolution kernel is operated by the dynamic snake convolution
Expansion in the y-axis direction can be written as:
where
Fig. 5 illustrates the structure of C2f-DySnake. The input feature map first undergoes 1 × 1 convolution, and then enters the Bottleneck-DySnake module after slicing. Multiple layers of Bottleneck-DySnake are stacked to perform deeper nonlinear transformations on image features, and then the different features are spliced, and finally feature fusion is achieved through 1 × 1 convolution. The Bottleneck-DySnake module is obtained by replacing the standard convolution in Bottleneck with DySnake convolution. Due to the variability of DySnake convolution, the Bottleneck-DySnake module can process richer features, which enables the C2f-DySnake module to flexibly handle traffic signs of different sizes and constrain the offset to ensure that the algorithm does not deviate from the main target when detecting traffic signs. The introduction of dynamic snake convolution allows flexible adjustment of the receptive field, enhancing the C2f module’s ability to extract useful traffic sign features in complex scenarios.

Figure 5: C2f-DySnake structure diagram
YOLOv8 uses CIoU [25] as the loss function. It can adapt to target detection tasks of different shapes and sizes, has good performance, and can achieve faster convergence. However, when the width and height of the prediction box are linearly proportional, the aspect ratio penalty term is equal, which weakens the effect of the penalty term on CIoU Loss. The root cause of this problem is that when CIoU Loss does not consider the linear proportional change of the prediction box size, the aspect ratio penalty term remains unchanged. PIoU [26] uses a penalty term that adapts to the target size, which can effectively address the problem. The penalty term is defined as follows:
where
The PIoU loss function can be expressed mathematically as:
We add a module that combines hyperparameters and non-monotonic functions to PIoU to further improve the detection ability of the target. PIoUv2 is defined as follows:
In Eq. (6), the penalty factor is replaced by
However, when the situation shown in Fig. 6 occurs, the first prediction box is inside the target box, while the second prediction box is outside the target box, but the absolute value of the distance between the corresponding edges is the same, causing the penalty term to lose its effect. The fundamental reason for this problem is that the non-monotonic attention function introduced by PIoUv2 is static. Therefore, during the training process, prediction boxes of different qualities use the same non-monotonic attention function form. Although the PIoUv2 loss function implements the strategy of gradient adjustment with prediction boxes of different qualities, due to the fixed form of the non-monotonic function, the gradient adjustment effect is not fully utilized. Therefore, we use the WIoUv3 [27] loss function method and propose WPIoUv2 based on the dynamic non-monotonic attention function to achieve different forms of non-monotonic functions to process prediction boxes of different qualities during training and give full play to the role of gradient adjustment. The improved WPIoUv2 is shown in Eq. (9):
where
where

Figure 6: The penalty item loses its effect
The WPIoUv2 loss function combines the gradient gain with PIoUv2, replaces the static non-monotonic attention function with a dynamic non-monotonic attention function, and gives full play to the gradient adjustment function of the non-monotonic attention function, so that the WPIoUv2 loss function can achieve a more reasonable suppression of low-quality prediction frames, and impose a more reasonable degree of attention on medium-quality and high-quality prediction frames, effectively solving the problem of the loss of the penalty term in the loss function calculation process. The design of the WPIoUv2 loss function is more reasonable and effective, further enhancing the algorithm’s detection accuracy.
This paper uses the Tsinghua-Tencent 100K (TT100K) as a dataset [28]. TT100K was jointly released by Tsinghua University and Tencent Lab. It contains 100,000 images and 300,000 traffic signs, of which 10,592 images contain annotation information, covering 201 traffic sign categories, and there is a category imbalance problem. Therefore, this paper processes the dataset and filters out images with a single category number greater than or equal to 100 in the dataset. Finally, 45 categories are determined, totaling 9738 images. These images cover 92% of the images in the original dataset and reflect the actual distribution of traffic signs. The training set and test set are divided in a ratio of 8:2, and finally, 7790 images are obtained for the training set and 1948 images for the test set. Some images of the TT100K dataset are shown in Fig. 7.

Figure 7: Example of TT100K dataset images
4.2 Experimental Environment and Parameters
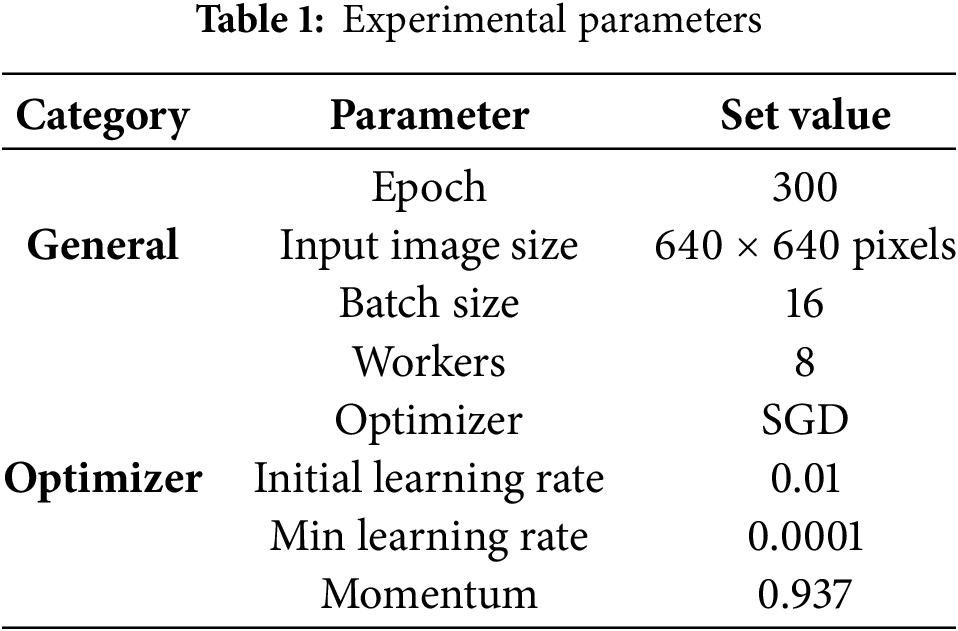
All experiments in this study were conducted on Ubuntu 20.04 with an NVIDIA RTX 4090 GPU and an Intel Xeon Gold 6248R CPU. The software framework was CUDA 11.3, and the experimental environment was built on PyTorch 1.13.1. The key experimental parameters are summarized in Table 1.
4.3 Experimental Evaluation Indicators
This paper adopts Precision (P), Recall (R), mAP@0.5, and mAP@0.5:0.95 as evaluation metrics for detection accuracy. In addition, model parameters (Params), giga floating-point operations per second (GFLOPS), and frames per second (FPS) are included to provide a comprehensive assessment of the algorithm’s performance.
Precision is the ratio of the number of correct positive samples predicted by the model to the total number of all samples detected by the model. The calculation equation is shown in the following equation:
The recall rate represents the ratio of the number of positive samples correctly predicted by the model to the total number of actual samples. The calculation equation is as follows:
where
mAP is the average of the
The specific accuracy metrics used in this paper are mAP@0.5 and mAP@0.5:0.95. mAP@0.5 represents the average mAP when the IoU threshold is 0.5; mAP@0.5:0.95 represents the average mAP when the IoU threshold is between 0.5 and 0.95. All experimental results reported in this paper are averages of multiple runs.
4.4 Experimental Results and Analysis
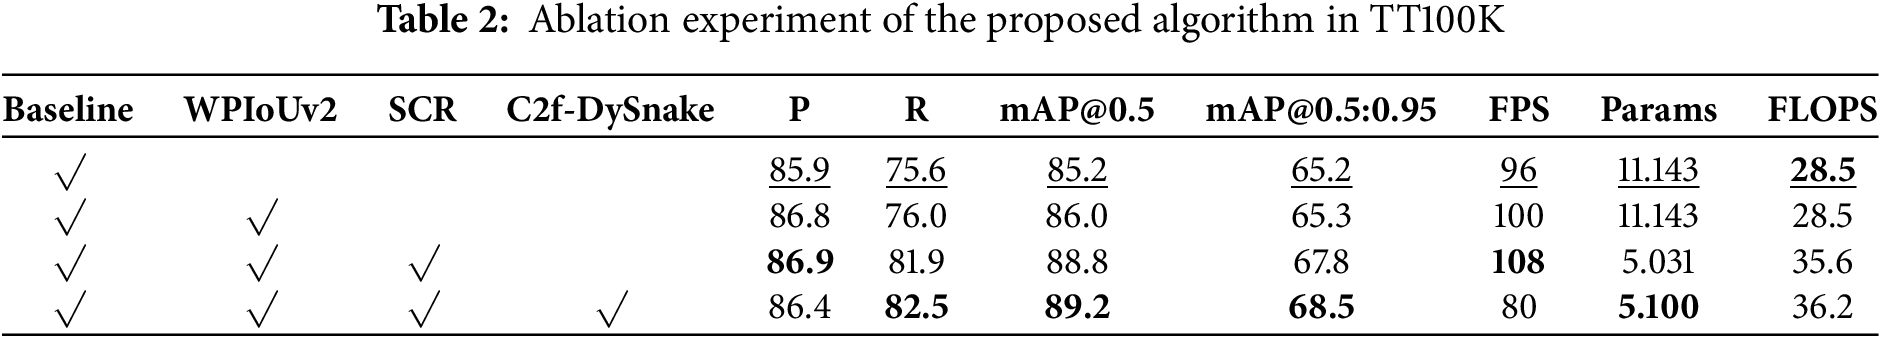
In order to verify the effectiveness of the improved module proposed in this paper in traffic sign detection, the TT100K dataset is used for ablation experiments. Experimental results are provided in Table 2, where Bold font indicates the best results of the experiment, and underlined text represents the baseline model. Compared with YOLOv8s, the mAP@0.5 of the algorithm proposed in this paper increased from 85.2% to 89.2%, an increase of 4%, and mAP@0.5:0.95 increased from 65.2% to 68.5%, an increase of 3.3%. Although the calculation speed of the algorithm has decreased to a certain extent (from 96FPS to 80FPS), the number of parameters has been reduced to half of the original. The integration of all proposed modules enhances detection accuracy while preserving real-time performance, validating the algorithm’s effectiveness.
For validation of the algorithm’s performance in rainy night scenarios, we processed the TT100K dataset, simulated the effect of a rainy night, and used the dataset for ablation experiments. Table 3 summarizes the experimental results. Relative to YOLOv8, the proposed algorithm achieves an mAP@0.5 increase from 76.6% to 82.0%, an improvement of 5.4%, mAP@0.5:0.95 increased from 57.3% to 60.5%, an increase of 3.2%. The algorithm’s effectiveness under rainy night conditions is supported by the experimental findings.

To further evaluate the effectiveness of the SCR module, we tested a model that retains only SCR on the TT100K dataset. As shown in the first and second columns of Fig. 8, YOLOv8+SCR significantly reduces missed detections for extremely small targets. The third column illustrates that YOLOv8+SCR helps alleviate false positives, while the fourth column demonstrates improved accuracy when detecting blurred small targets. These results suggest that the SCR module enhances the model’s robustness in challenging traffic sign scenarios.
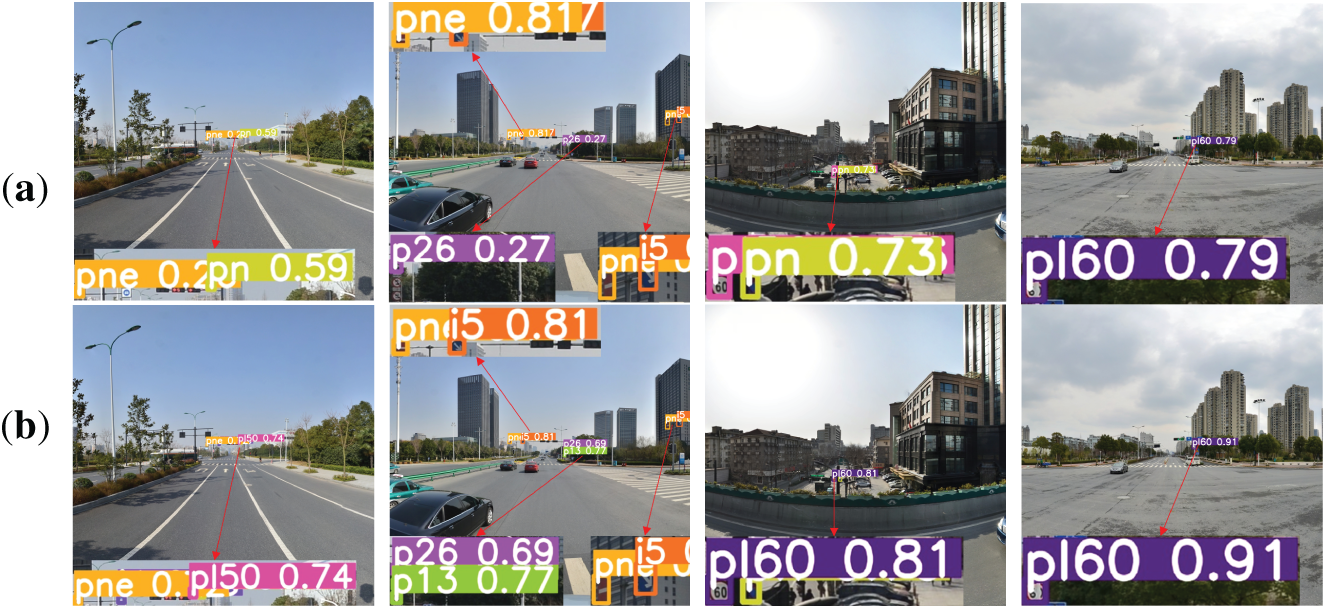
Figure 8: Detection comparison between YOLOv8 and YOLOv8+SCR on the TT100K dataset: (a) YOLOv8; (b) YOLOv8+SCR
In order to evaluate whether dynamic snake convolution or deformable convolution is more suitable for the algorithm proposed in this paper, we designed a comparative experiment between the two. The experimental results are shown in Table 4. From the table, we can see that the recall, mAP@0.5 and mAP@0.5:0.95 of the algorithm using dynamic snake convolution are higher than those using deformable convolution. Although the precision is slightly lower, it does not affect the evaluation of the overall indicators. These results show that dynamic snake convolution is more suitable for the algorithm in this paper for performing traffic sign detection tasks.

Fig. 9 is a function graph of the gradient gain as the hyperparameters

Figure 9: The mapping of outlier degree β and gradient gain r, which is controlled by the hyper-parameters α, δ
Table 5 presents the results of additional experiments conducted to explore the influence of parameters
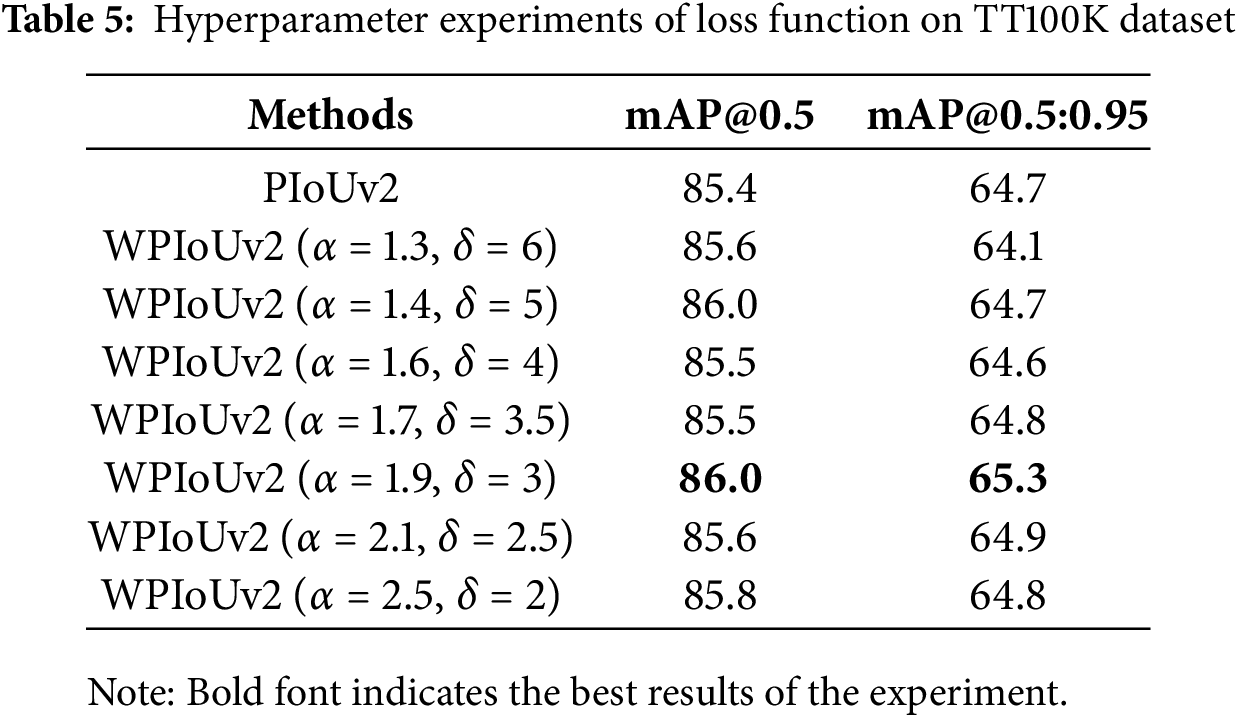
After determining the optimal hyperparameters, we further conducted comparative experiments on loss functions. Fig. 10 shows the comparison of the training process of four different loss functions, CIoU, WIoUv3, PIoUv2, and WPIoUv2, based on YOLOv8s. It can be seen that when the number of training rounds is about 260, the curve gradually stabilizes, among which WIoUv3 is at the lowest level, PIoUv2 and CIoU are relatively similar, and the curve is slightly higher, while the WPIoUv2 curve is at the highest level, significantly higher than the other three loss functions, and has the best detection accuracy.

Figure 10: Performance comparison of different loss functions
To investigate the localization performance of WPIoUv2 on hard samples, a qualitative visualization analysis using different loss functions was conducted, as shown in Fig. 11. In the figure, green boxes represent ground truth, while yellow boxes denote predicted bounding boxes. It can be observed that WPIoUv2 yields predictions with a higher degree of overlap between the yellow and green boxes, reflecting improved IoU and more accurate localization performance on difficult cases.

Figure 11: Positioning effect comparison: (a) CIoU; (b) PIoUv2; (c) WIoUv3; (d) WPIoUv2
Table 6 shows the experimental results of advanced detection algorithms on the TT100k dataset. Compared with SSD and Faster-RCNN algorithms, YOLO-SDW shows excellent detection accuracy and speed. Compared with YOLOv5s, the mAP@0.5 of the YOLO-SDW algorithm increased by 8.3%, and the mAP@0.5:0.95 increased by 9%. The number of parameters and the inference speed are comparable. Compared with YOLOv10s, the mAP@0.5 of the YOLO-SDW algorithm increased by 8.3%, and the mAP@0.5:0.95 increased by 4.7%. The number of parameters was reduced by about 30%, and the inference speed was accelerated by about 10%. Compared with YOLOV8s, although the inference speed was reduced by about 15%, the mAP@0.5 increased by 4%, the mAP@0.5:0.95 increased by 3.3%, and the number of parameters was reduced by half. The above results indicate that YOLO-SDW has balanced the problems of detection accuracy and detection speed. While maintaining detection speeds compatible with autonomous driving, the algorithm achieves a substantial improvement in accuracy.
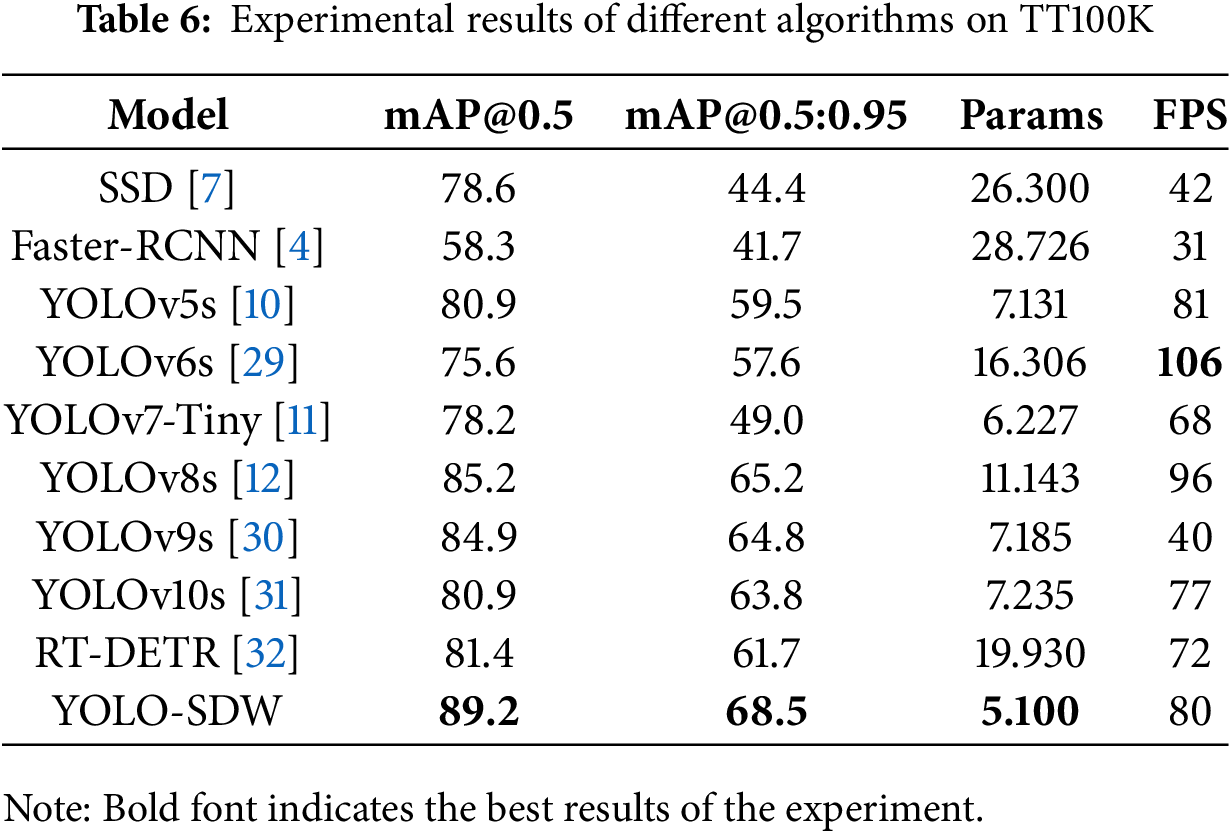
Table 7 shows the comparison of detection performance between YOLO-SDW and recent excellent algorithms in the context of traffic sign identification. Experimental results indicate that YOLO-SDW performs excellently in traffic sign detection. Considering the different hardware devices and the compatibility issues of remote computing devices, although YOLO-SDW detection speed is not the fastest, it remains capable of satisfying the real-time demands of autonomous driving In general, YOLO-SDW shows good accuracy and speed on TT100K.
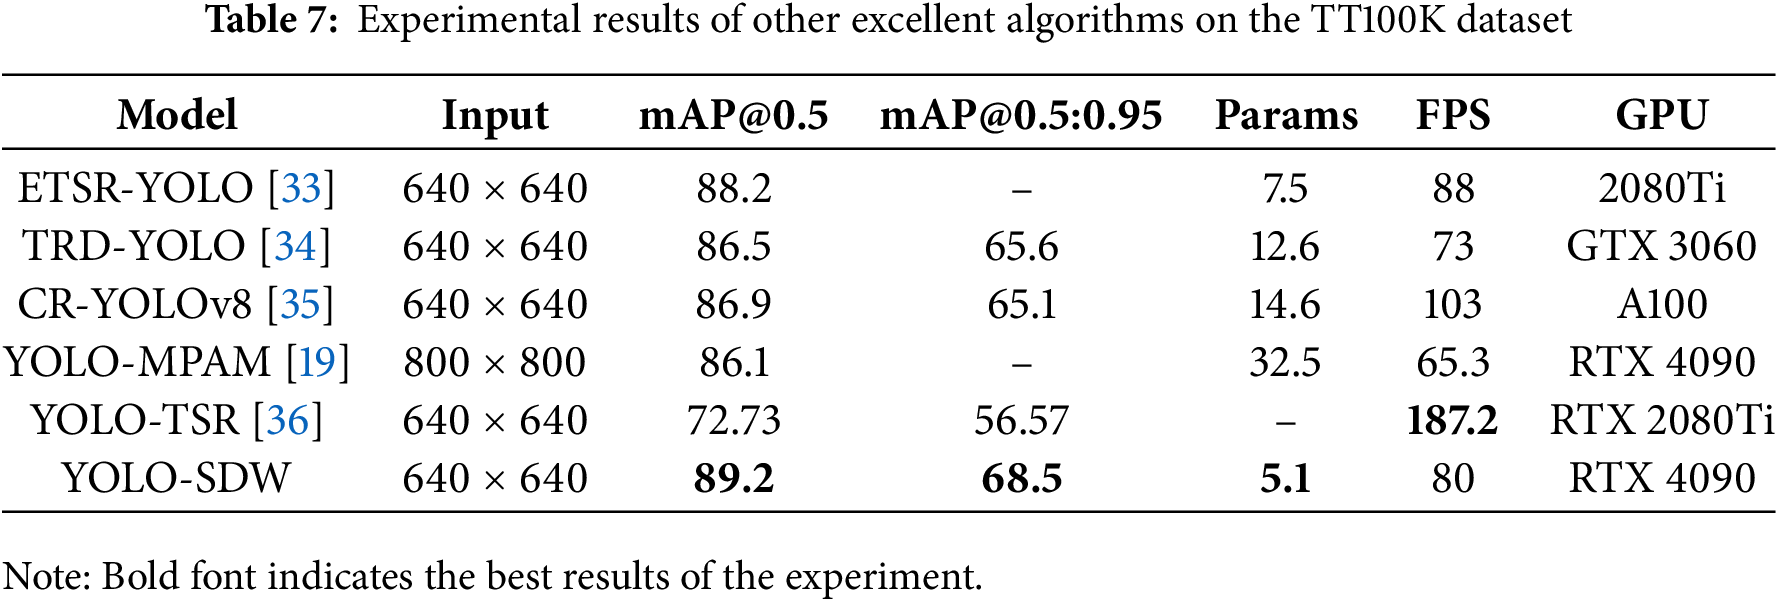
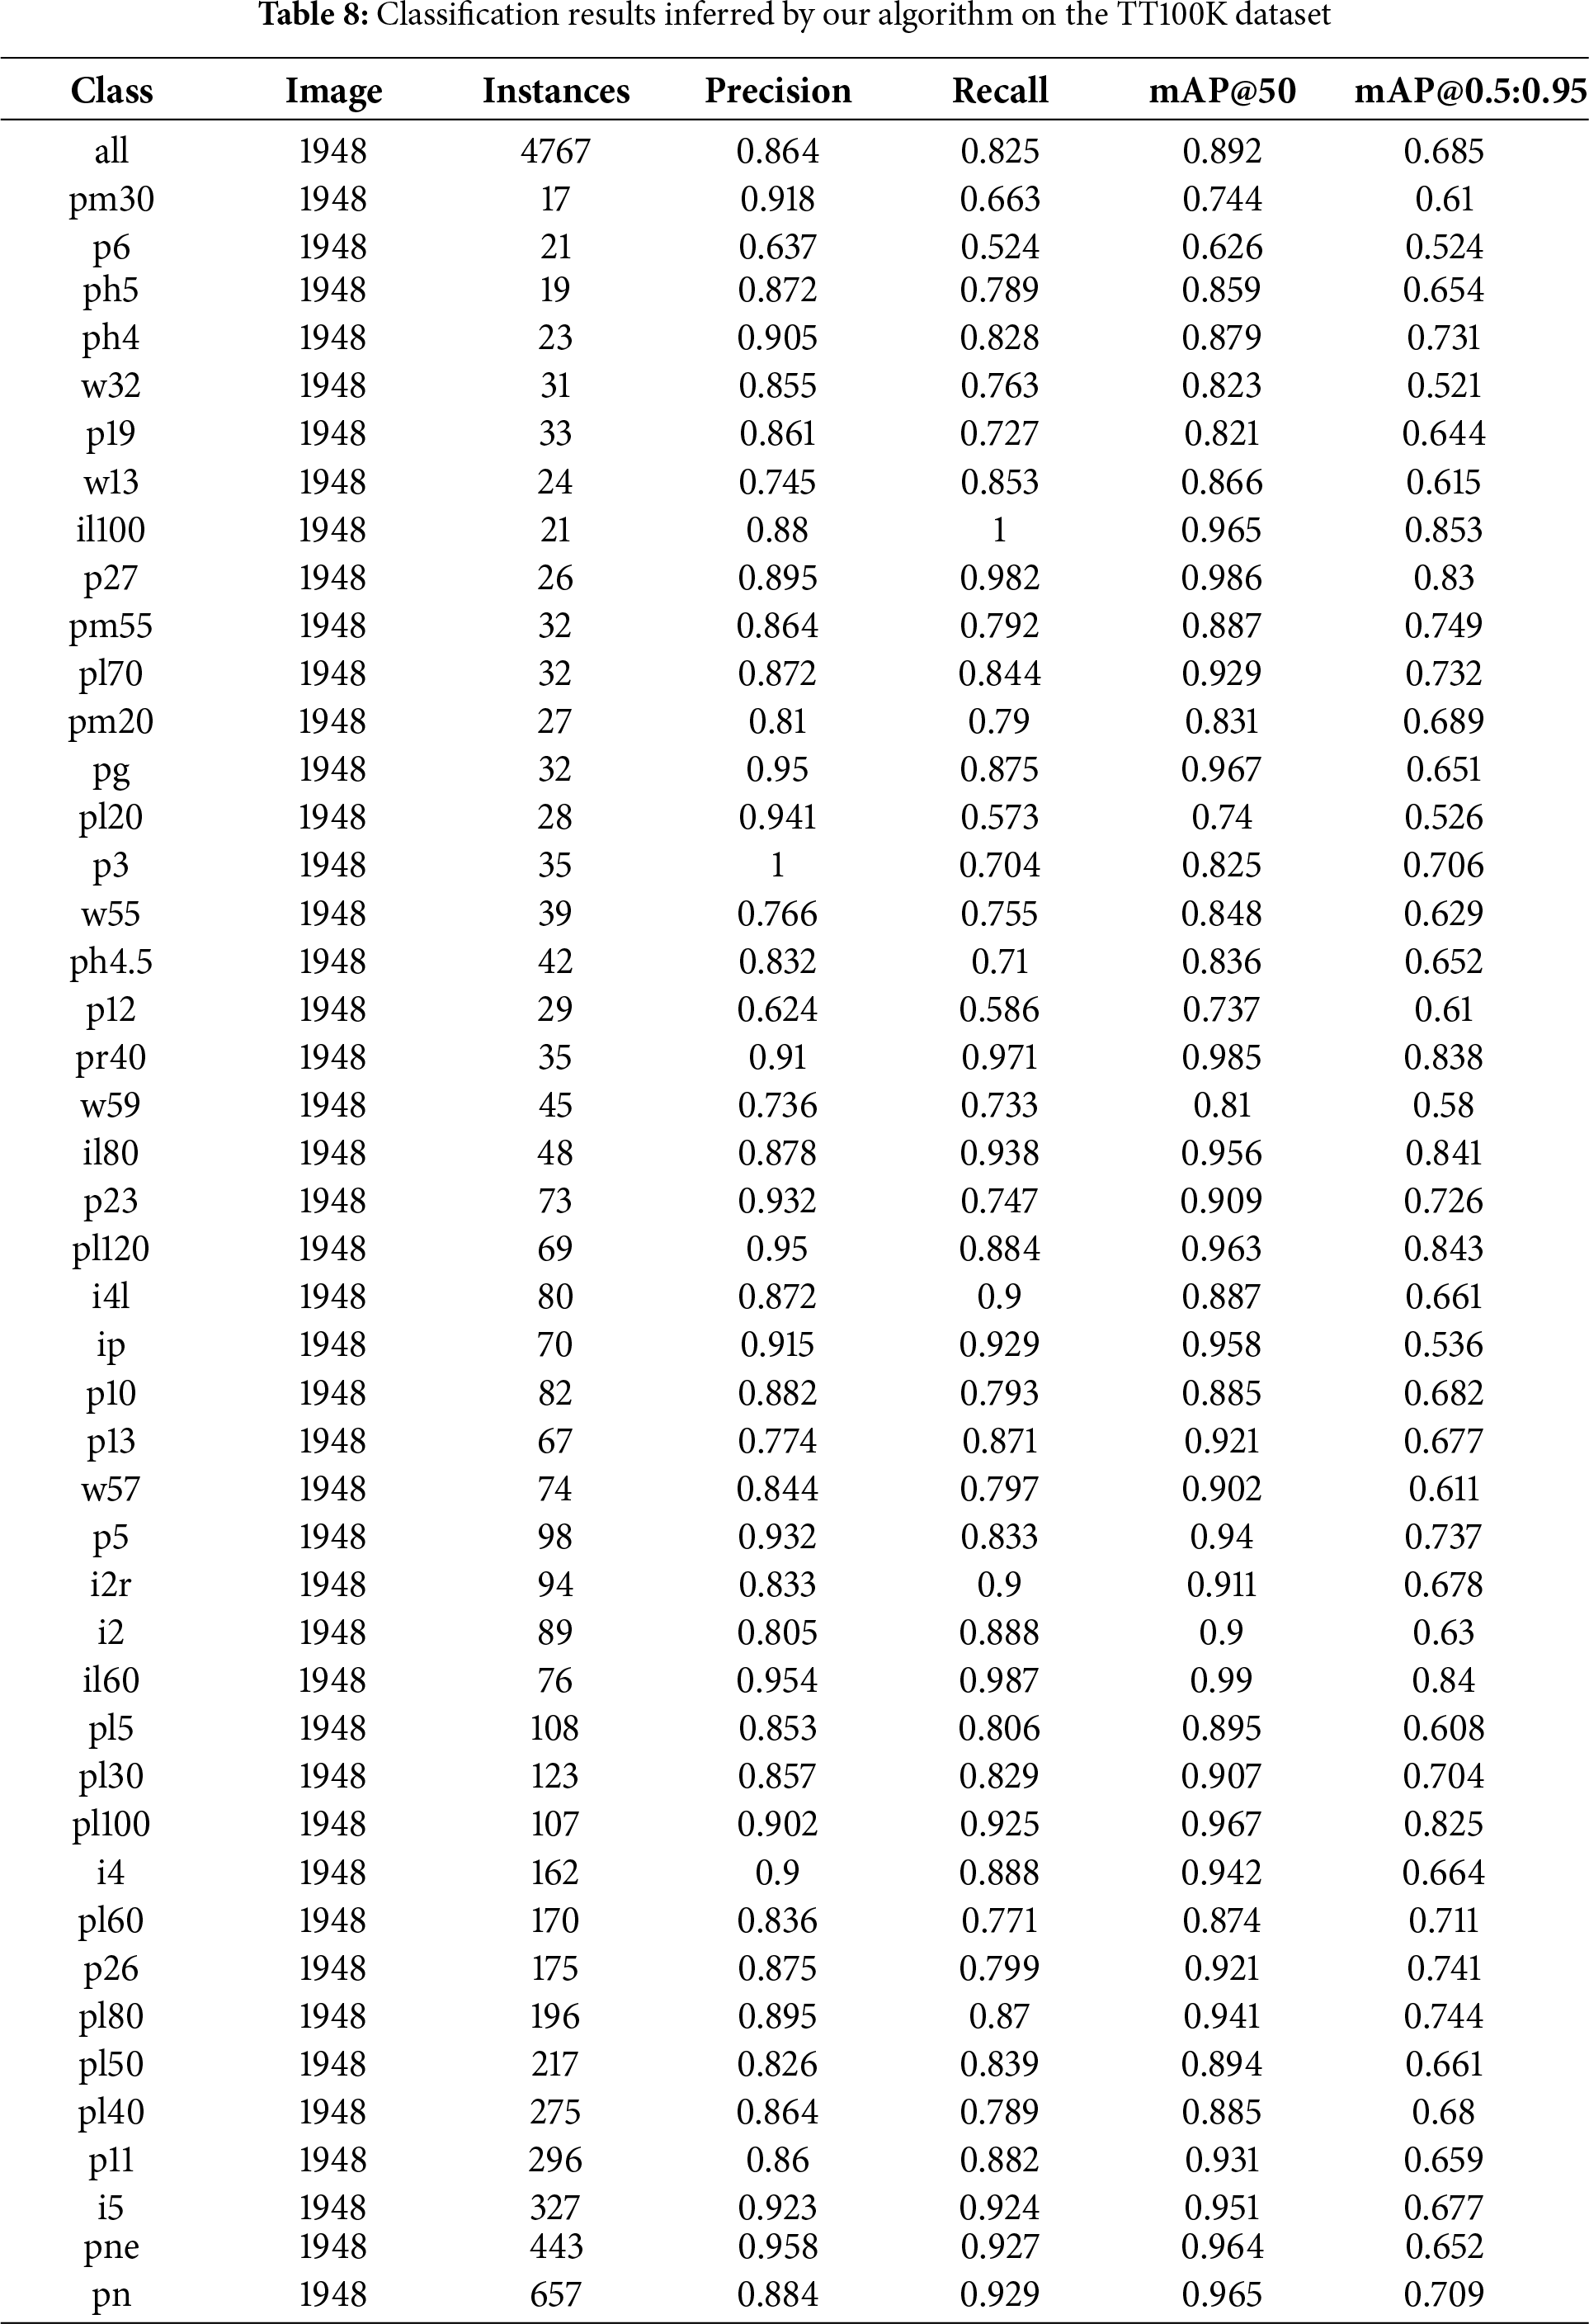
Table 8 shows the detailed experimental results for each category. The results show that YOLO-SDW achieves good performance and exhibits robust detection capabilities across different object categories.
For validating the proposed algorithm’s performance under real-world conditions, we conducted a qualitative visualization analysis, as shown in Fig. 12. The first row demonstrates that YOLOv8s produces false positives under motion blur, whereas YOLO-SDW accurately detects the object with higher confidence. The second row shows that YOLOv8s fails to detect occluded signs, while YOLO-SDW successfully identifies them with greater precision. In the third row, YOLO-SDW significantly reduces both false positives and missed detections for extremely small objects. The fourth row illustrates that YOLO-SDW is more robust in handling nighttime glare. Overall, these results indicate that YOLO-SDW achieves superior detection performance in real-world conditions such as motion blur, object occlusion, and nighttime glare, compared to the baseline YOLOv8s model.

Figure 12: Detection effects of different algorithms: (a) YOLOv8s; (b) YOLO-SDW
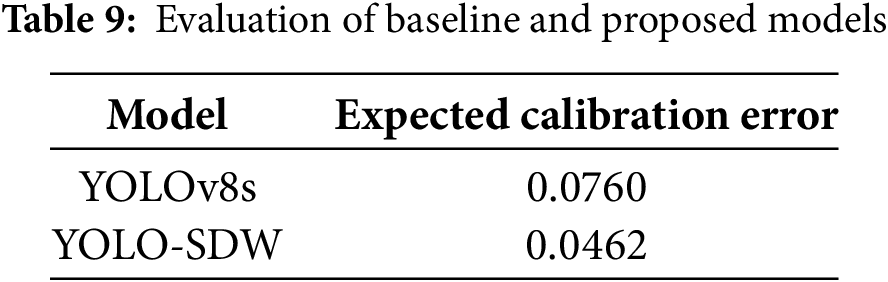
In safety-critical applications such as autonomous driving, the reliability of confidence scores is crucial. The expected calibration error (ECE) was used to evaluate the calibration performance of our model, reflecting the difference between model confidence and actual accuracy. As can be seen from Table 9, the ECE of the YOLOv8s baseline is 0.0760, while the ECE of YOLO-SDW is reduced to 0.0462, which significantly reduces the calibration error, indicating that the model’s confidence score more accurately reflects the true reliability of the prediction.
In response to false positives and missed detections and suboptimal performance in complex traffic sign detection scenarios, this study develops an improved YOLOv8s-based detection algorithm. YOLO-SDW introduces a skip connection reconstruction module to effectively improve the feature fusion capability. In addition, the dynamic snake convolution and C2f module are combined to boost the algorithm’s feature extraction capacity, significantly reducing the false positives and missed detections in traffic sign detection. Finally, the improved WPIoUv2 loss function is employed to enhance overall detection performance. Results from the ablation study on the TT100K dataset demonstrate that YOLO-SDW improves mAP@0.5 and mAP@0.5:0.95 by 4% and 3.3%, respectively, compared with the original YOLOv8s. Additionally, the inference speed of the optimized algorithm reaches 80FPS on the TT100K dataset, thus ensuring high accuracy while having a good detection speed. In addition, the comparative experiments show that compared with the most advanced traffic sign detection algorithm, YOLO-SDW attains an improved equilibrium between detection accuracy and efficiency, verifies the effectiveness of the algorithm, and the visualization results intuitively demonstrate the algorithm’s strong detection performance. The TT100k dataset contains fewer extreme samples and lacks robustness in extreme weather conditions. It is more suitable for traffic sign detection tasks in the most common road environments. In actual deployments, extreme weather conditions such as fog and snow can obscure traffic signs, reduce clarity, and limit effective feature information, impacting algorithm stability. In the future, we will focus on researching more stable modules to address these challenges and optimizing the network architecture to improve the robustness and stability of the algorithm.
Acknowledgement: None.
Funding Statement: This study was funded by Key research and development Program of Henan Province (No. 251111211200); National Natural Science Foundation of China (Grant No. U2004163).
Author Contributions: Research conceptualization and model building: Qing Guo; Experimental data preprocessing: Qing Guo, Bingyi Ren; Experiment design: Qing Guo, Juwei Zhang; Manuscript review: Qing Guo, Juwei Zhang. All authors reviewed the results and approved the final version of the manuscript.
Availability of Data and Materials: The TT100K dataset can be obtained from https://cg.cs.tsinghua.edu.cn/traffic-sign/ (accessed on 01 September 2025). The code and the outcomes of this study can be obtained from the corresponding authors upon a request.
Ethics Approval: Not applicable.
Conflicts of Interest: The authors declare no conflicts of interest to report regarding the present study.
References
1. Abdel-Aty M, Ding S. A matched case-control analysis of autonomous vs human-driven vehicle accidents. Nat Commun. 2024;15(1):4931. doi:10.1038/s41467-024-48526-4. [Google Scholar] [PubMed] [CrossRef]
2. Girshick R, Donahue J, Darrell T, Malik J. Rich feature hierarchies for accurate object detection and semantic segmentation. In: 2014 IEEE Conference on Computer Vision and Pattern Recognition; 2014 Jun 23–28; Columbus, OH, USA. p. 580–7. doi:10.1109/CVPR.2014.81. [Google Scholar] [CrossRef]
3. Girshick R. Fast R-CNN. In: 2015 IEEE International Conference on Computer Vision (ICCV); 2015 Dec 7–13; Santiago, Chile. p. 1440–8. doi:10.1109/ICCV.2015.169. [Google Scholar] [CrossRef]
4. Ren S, He K, Girshick R, Sun J. Faster R-CNN: towards real-time object detection with region proposal networks. IEEE Trans Pattern Anal Mach Intell. 2017;39(6):1137–49. doi:10.1109/tpami.2016.2577031. [Google Scholar] [PubMed] [CrossRef]
5. He K, Gkioxari G, Dollár P, Girshick R. Mask R-CNN. In: 2017 IEEE International Conference on Computer Vision (ICCV); 2017 Oct 22–29; Venice, Italy. p. 2980–8. doi:10.1109/ICCV.2017.322. [Google Scholar] [CrossRef]
6. Redmon J, Divvala S, Girshick R, Farhadi A. You only look once: unified, real-time object detection. In: 2016 IEEE Conference on Computer Vision and Pattern Recognition (CVPR); 2016 Jun 27–30; Las Vegas, NV, USA. p. 779–88. doi:10.1109/CVPR.2016.91. [Google Scholar] [CrossRef]
7. Liu W, Anguelov D, Erhan D, Szegedy C, Reed S, Fu CY, et al. SSD: single shot MultiBox detector. In: Computer vision—ECCV 2016. Cham, Switzerland: Springer International Publishing; 2016. p. 21–37. doi:10.1007/978-3-319-46448-0_2. [Google Scholar] [CrossRef]
8. Redmon J, Farhadi A. YOlOv3: an incremental improvement. arXiv:1804.02767. 2018. [Google Scholar]
9. Bochkovskiy A, Wang CY, Liao HYM. YOLOv4: optimal speed and accuracy of object detection. arXiv:2004.10934. 2020. [Google Scholar]
10. Wang Z, Jin L, Wang S, Xu H. Apple stem/Calyx real-time recognition using YOLO-v5 algorithm for fruit automatic loading system. Postharvest Biol Technol. 2022;185(2):111808. doi:10.1016/j.postharvbio.2021.111808. [Google Scholar] [CrossRef]
11. Wang CY, Bochkovskiy A, Liao HM. YOLOv7: trainable bag-of-freebies sets new state-of-the-art for real-time object detectors. In: 2023 IEEE/CVF Conference on Computer Vision and Pattern Recognition (CVPR); 2023 Jun 17–24; Vancouver, BC, Canada. p. 7464–75. doi:10.1109/CVPR52729.2023.00721. [Google Scholar] [CrossRef]
12. Aboah A, Wang B, Bagci U, Adu-Gyamfi Y. Real-time multi-class helmet violation detection using few-shot data sampling technique and YOLOv8. In: 2023 IEEE/CVF Conference on Computer Vision and Pattern Recognition Workshops (CVPRW); 2023 Jun 17–24; Vancouver, BC, Canada. p. 5350–8. doi:10.1109/CVPRW59228.2023.00564. [Google Scholar] [CrossRef]
13. Bakirci M. Utilizing YOLOv8 for enhanced traffic monitoring in intelligent transportation systems (ITS) applications. Digit Signal Process. 2024;152(2):104594. doi:10.1016/j.dsp.2024.104594. [Google Scholar] [CrossRef]
14. Wang X, Tian Y, Zheng K, Liu C. C2Net-YOLOv5: a bidirectional Res2Net-based traffic sign detection algorithm. Comput Mater Contin. 2023;77(2):1949–65. doi:10.32604/cmc.2023.042224. [Google Scholar] [CrossRef]
15. Ren B, Zhang J, Wang T. A hybrid feature fusion traffic sign detection algorithm based on YOLOv7. Comput Mater Contin. 2024;80(1):1425–40. doi:10.32604/cmc.2024.052667. [Google Scholar] [CrossRef]
16. Peng J, Mou B, Jin S, Luo Y, Li C, Chen W, et al. Traffic sign detection algorithm based on improved YOLOv8n. In: 2024 IEEE 19th Conference on Industrial Electronics and Applications (ICIEA); 2024 Aug 5–8; Kristiansand, Norway. p. 1–6. doi:10.1109/ICIEA61579.2024.10665060. [Google Scholar] [CrossRef]
17. Zhao R, Tang SH, Shen J, Supeni EEB, Rahim SA. Enhancing autonomous driving safety: a robust traffic sign detection and recognition model TSD-YOLO. Signal Process. 2024;225(1):109619. doi:10.1016/j.sigpro.2024.109619. [Google Scholar] [CrossRef]
18. Zheng X, Guan Z, Chen Q, Wen G, Lu X. A lightweight road traffic sign detection algorithm based on adaptive sparse channel pruning. Meas Sci Technol. 2025;36(1):016176. doi:10.1088/1361-6501/ad9517. [Google Scholar] [CrossRef]
19. Yu B, Li Z, Cao Y, Wu C, Qi J, Wu L. YOLO-MPAM: efficient real-time neural networks based on multi-channel feature fusion. Expert Syst Appl. 2024;252(6):124282. doi:10.1016/j.eswa.2024.124282. [Google Scholar] [CrossRef]
20. Lin TY, Dollár P, Girshick R, He K, Hariharan B, Belongie S. Feature pyramid networks for object detection. In: 2017 IEEE Conference on Computer Vision and Pattern Recognition (CVPR); 2017 Jul 21–26; Honolulu, HI, USA. p. 936–44. [Google Scholar]
21. Liu S, Qi L, Qin H, Shi J, Jia J. Path aggregation network for instance segmentation. In: 2018 IEEE/CVF Conference on Computer Vision and Pattern Recognition; 2018 Jun 18–23; Salt Lake City, UT, USA. p. 8759–68. doi:10.1109/CVPR.2018.00913. [Google Scholar] [CrossRef]
22. Tan M, Pang R, Le QV. EfficientDet: scalable and efficient object detection. In: 2020 IEEE/CVF Conference on Computer Vision and Pattern Recognition (CVPR); 2020 Jun 13–19; Seattle, WA, USA. p. 10778–87. doi:10.1109/cvpr42600.2020.01079. [Google Scholar] [CrossRef]
23. Qi Y, He Y, Qi X, Zhang Y, Yang G. Dynamic snake convolution based on topological geometric constraints for tubular structure segmentation. In: 2023 IEEE/CVF International Conference on Computer Vision (ICCV); 2023 Oct 1–6; Paris, France. p. 6047–56. doi:10.1109/ICCV51070.2023.00558. [Google Scholar] [CrossRef]
24. Dai J, Qi H, Xiong Y, Li Y, Zhang G, Hu H, et al. Deformable convolutional networks. In: 2017 IEEE International Conference on Computer Vision (ICCV); 2017 Oct 22–29; Venice, Italy. p. 764–73. doi:10.1109/ICCV.2017.89. [Google Scholar] [CrossRef]
25. Zheng Z, Wang P, Liu W, Li J, Ye R, Ren D. Distance-IoU loss: faster and better learning for bounding box regression. Proc AAAI Conf Artif Intell. 2020;34(7):12993–3000. doi:10.1609/aaai.v34i07.6999. [Google Scholar] [CrossRef]
26. Liu C, Wang K, Li Q, Zhao F, Zhao K, Ma H. Powerful-IoU: more straightforward and faster bounding box regression loss with a nonmonotonic focusing mechanism. Neural Netw. 2024;170(2):276–84. doi:10.1016/j.neunet.2023.11.041. [Google Scholar] [PubMed] [CrossRef]
27. Tong Z, Chen Y, Xu Z, Yu R. Wise-IoU: bounding box regression loss with dynamic focusing mechanism. arXiv:2301.10051. 2023. [Google Scholar]
28. Zhu Z, Liang D, Zhang S, Huang X, Li B, Hu S. Traffic-sign detection and classification in the wild. In: 2016 IEEE Conference on Computer Vision and Pattern Recognition (CVPR); 2016 Jun 27–30; Las Vegas, NV, USA. p. 2110–8. doi:10.1109/CVPR.2016.232. [Google Scholar] [CrossRef]
29. Li C, Li L, Jiang H, Weng K, Geng Y, Li L, et al. YOLOv6: a single-stage object detection framework for industrial applications. arXiv:2209.02976. 2022. [Google Scholar]
30. Wang CY, Yeh IH, Mark Liao HY. YOLOv9: learning what you want to learn using programmable gradient information. In: Computer vision—ECCV 2024. Cham, Switzerland: Springer Nature; 2024. p. 1–21. doi:10.1007/978-3-031-72751-1_1. [Google Scholar] [CrossRef]
31. Wang A, Chen H, Liu L, Chen K, Lin Z, Han J, et al. Yolov10: real-time end-to-end object detection. arXiv.2405.14458. 2024. [Google Scholar]
32. Carion N, Massa F, Synnaeve G, Usunier N, Kirillov A, Zagoruyko S. End-to-end object detection with transformers. In: Computer vision—ECCV 2020. Cham, Switzerland: Springer International Publishing; 2020. p. 213–29. doi:10.1007/978-3-030-58452-8_13. [Google Scholar] [CrossRef]
33. Liu H, Zhou K, Zhang Y, Zhang Y. ETSR-YOLO: an improved multi-scale traffic sign detection algorithm based on YOLOv5. PLoS One. 2023;18(12):e0295807. doi:10.1371/journal.pone.0295807. [Google Scholar] [PubMed] [CrossRef]
34. Chu J, Zhang C, Yan M, Zhang H, Ge T. TRD-YOLO: a real-time, high-performance small traffic sign detection algorithm. Sensors. 2023;23(8):3871. doi:10.3390/s23083871. [Google Scholar] [PubMed] [CrossRef]
35. Zhang LJ, Fang JJ, Liu YX, Hai FL, Rao ZQ, Zhao JX. CR-YOLOv8: multiscale object detection in traffic sign images. IEEE Access. 2023;12:219–28. doi:10.1109/access.2023.3347352. [Google Scholar] [CrossRef]
36. Zhang X, Wang W, Wang Q, Shan L, Yamane S, Zheng B, et al. Enhancing small traffic sign recognition based on an improved YOLOv8 algorithm. Signal Image Video Process. 2025;19(6):438. doi:10.1007/s11760-025-04032-8. [Google Scholar] [CrossRef]
Cite This Article
 Copyright © 2026 The Author(s). Published by Tech Science Press.
This work is licensed under a Creative Commons Attribution 4.0 International License , which permits unrestricted use, distribution, and reproduction in any medium, provided the original work is properly cited.
 Downloads
 Citation Tools