
 Submit a Paper
 Propose a Special lssue
 Open Access
ARTICLE

Lightweight YOLOv5 with ShuffleNetV2 for Rice Disease Detection in Edge Computing
Department of Computer Engineering, Honam University, Gwangsangu, Gwangju, 62399, Republic of Korea
* Corresponding Author: Sang-Hyun Lee. Email:
Computers, Materials & Continua 2026, 86(1), 1-15. https://doi.org/10.32604/cmc.2025.069970
Received 04 July 2025; Accepted 29 September 2025; Issue published 10 November 2025
 View Full Text
 Download PDF
Abstract
This study proposes a lightweight rice disease detection model optimized for edge computing environments. The goal is to enhance the You Only Look Once (YOLO) v5 architecture to achieve a balance between real-time diagnostic performance and computational efficiency. To this end, a total of 3234 high-resolution images (2400 × 1080) were collected from three major rice diseases Rice Blast, Bacterial Blight, and Brown Spot—frequently found in actual rice cultivation fields. These images served as the training dataset. The proposed YOLOv5-V2 model removes the Focus layer from the original YOLOv5s and integrates ShuffleNet V2 into the backbone, thereby resulting in both model compression and improved inference speed. Additionally, YOLOv5-P, based on PP-PicoDet, was configured as a comparative model to quantitatively evaluate performance. Experimental results demonstrated that YOLOv5-V2 achieved excellent detection performance, with an mAP 0.5 of 89.6%, mAP 0.5–0.95 of 66.7%, precision of 91.3%, and recall of 85.6%, while maintaining a lightweight model size of 6.45 MB. In contrast, YOLOv5-P exhibited a smaller model size of 4.03 MB, but showed lower performance with an mAP 0.5 of 70.3%, mAP 0.5–0.95 of 35.2%, precision of 62.3%, and recall of 74.1%. This study lays a technical foundation for the implementation of smart agriculture and real-time disease diagnosis systems by proposing a model that satisfies both accuracy and lightweight requirements.Keywords
Although rice cultivation has greatly improved productivity due to the development of automation technology, diseases and pests such as Rice Blast, Bacterial Blight, and Brown Spot are still major causes of crop loss. In particular, Riceblast can reduce the yield of a single crop season by up to 50% if severe [1]. To combat this, pesticides are frequently used, but this causes various side effects such as soil and water pollution, human health hazards, and food safety issues [2]. Therefore, automated intelligent detection technology can diagnose diseases and pests more accurately and in a more timely manner [3].
In the past, visual assessment by experts based on symptom recognition was the primary method, but this involved subjectivity and had limitations in real-time, large-scale applications. To solve this problem, machine learning-based automatic diagnosis technology was introduced, and decision trees, random forests, and support vector machines (SVMs) were used for disease classification based on feature extraction. Despite their initial promise, these methods were limited due to manual feature dependency, low generalization performance, and difficulty in real-time applications.
While deep learning-based object detectors like Faster Region-based Convolutional Neural Network (R-CNN) offer high accuracy, their computational complexity renders them unsuitable for resource-limited edge devices. Although lightweight networks (e.g., YOLOv5s, MobileNet) have been proposed, they often suffer from significant accuracy degradation during model compression, particularly when dealing with complex field backgrounds and small disease targets. Consequently, a major challenge remains: developing a detection model that simultaneously achieves high accuracy, low computational cost, and a small model size to meet the demands of practical edge computing environments.
To address these challenges, this study proposes a lightweight improved model based on YOLOv5, named YOLOv5-V2, for real-time edge detection of rice diseases. The main contributions of this paper are as follows:
1. We propose a novel lightweight architecture: We integrate the core modules of ShuffleNet V2 into the backbone of YOLOv5 and remove the inefficient Focus layer, significantly reducing model complexity and size while maximally preserving feature extraction capability.
2. We conduct a comprehensive experimental evaluation: We construct a rice disease dataset comprising 3234 images and perform extensive comparisons not only with the baseline model but also with state-of-the-art lightweight models like YOLOv8n and PP-PicoDet, demonstrating the superior balance of our model in terms of accuracy and efficiency.
3. We provide in-depth analysis of model practicality: We offer detailed complexity analysis (e.g., GFLOPs, parameters) and discuss the potential for deploying the model on real edge devices, providing a solid technical foundation for developing agricultural edge artificial intelligence (AI) solutions.
Deep learning-based detection technology has gained significant attention, and CNN architectures can automatically extract disease features from images, providing high accuracy [4]. Two-stage detection models such as Fast R-CNN, Faster R-CNN [5], and Mask R-CNN [6] demonstrated high accuracy; however, they are unsuitable for real-time applications due to the large amount of computation. In addition, disease areas are often small and irregular, so necessitating a detection structure optimized for small object detection. To this end, multi-resolution feature fusion technologies such as FPN, PANet, and BiFPN have been developed, and ResNet, MobileNet, and ShuffleNet V2 have been designed to secure detection performance in mobile environments through lightweight network design [7–9].
In particular, the real-time detection model of the YOLO (You Only Look Once) series shows an excellent balance in terms of speed and accuracy, and is widely used in the agricultural field [10]. From YOLOv1 to YOLOv5, improvements such as anchor boxes, residual blocks, and cross-stage structures have been added to expand practicality, but structural optimization to simultaneously satisfy real-time performance, lightweight property, and accuracy remains an essential task [11–15].
In this study, we propose two lightweight pest detection models based on the YOLOv5 structure. First, YOLOv5-V2 removes the Focus layer and applies the ShuffleNet V2 [16,17] backbone to achieve a balance between inference speed and accuracy. Second, YOLOv5-P aims to secure real-time detection performance while minimizing the model size by utilizing the high-efficiency module of PP-PicoDet [18]. In the experiment, a total of 3234 real disease image datasets, including rice blast, white leaf blight, and striped leaf blight, were used to quantitatively evaluate the detection accuracy, weight reduction effect, and real-time performance of the model.
We propose the YOLOv5-V2 model, which integrates the ShuffleNet V2 lightweight network into the YOLOv5s structure to simultaneously improve computational efficiency and real-time performance. This model was designed to reflect the removal of focus layers, application of a lightweight backbone structure, and efficient feature merging strategy to reduce computational amount and improve speed while maintaining the structural advantages of YOLOv5s.
In addition, for performance comparison and objective evaluation, we implemented the YOLOv5-P model that grafted the lightweight strategy based on PP-PicoDet, and quantitatively analyzed the structural and performance differences between the two models.
Both proposed models adopt the latest lightweight neural network structure, aiming to effectively reduce computational complexity and the number of parameters while maintaining detection accuracy. In particular, ShuffleNet V2 and PP-PicoDet-based modules provide computational optimization and multi-scale feature integration efficiency, respectively, and are designed to exhibit stable performance even on resource-constrained mobile environments or edge devices.
To clearly illustrate our proposed improvements, Fig. 1 shows the structure of the original YOLOv5s model, while Fig. 2 shows the structure of our proposed YOLOv5-V2 model.
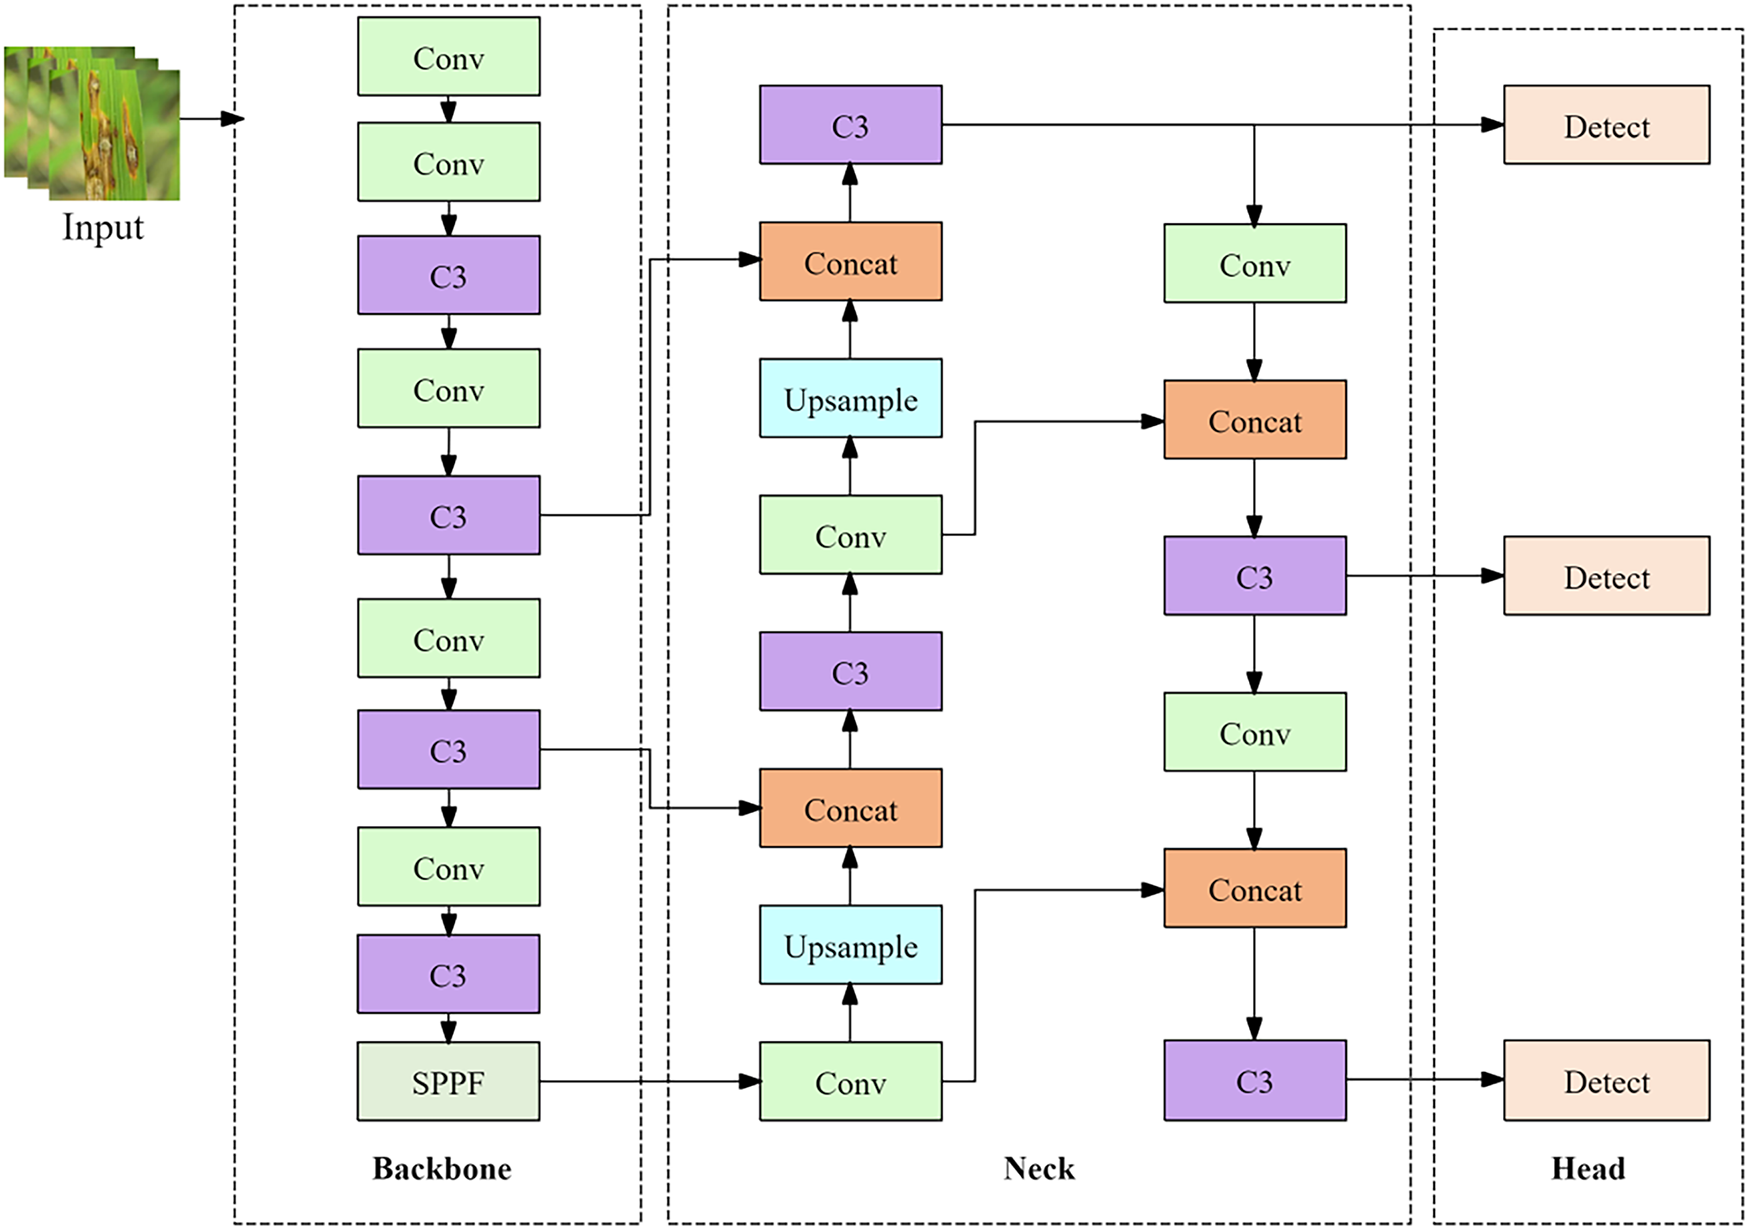
Figure 1: Structure of YOLOv5s model
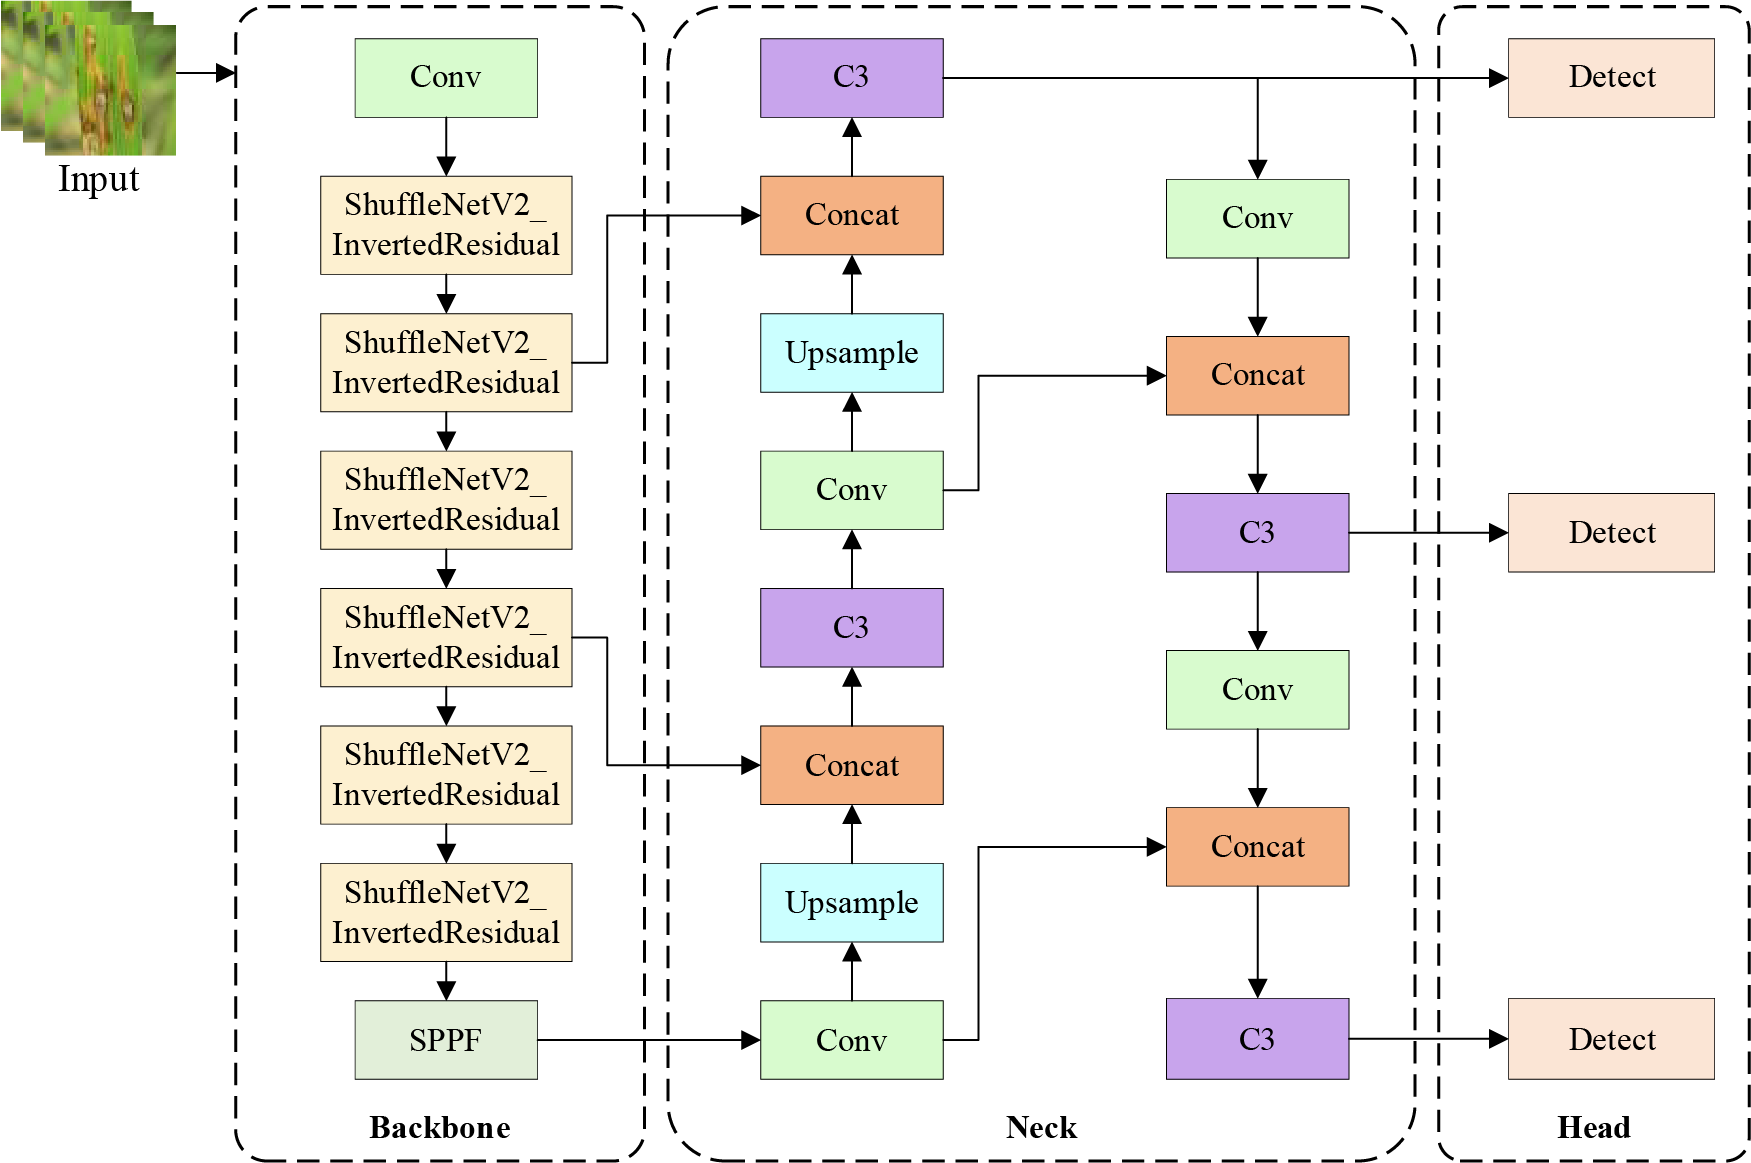
Figure 2: Structure of YOLOv5-V2 model
The YOLOv5-V2 model is an enhanced object detection model that integrates the ShuffleNet V2 lightweight network into the backbone, based on the existing YOLOv5s structure. This model is designed to achieve a balance between computational efficiency and lightweight property, while maintaining the structural advantages and detection performance of YOLOv5s, and with a focus on real-time applicability in mobile and edge environments. The overall structure, as shown in Fig. 2, comprises the Backbone, Neck, Head, and Detection modules.
The original backbone structure of YOLOv5s includes a Focus layer, which extracts features from the input image by slicing 2 × 2 adjacent pixels, expanding the number of channels fourfold, and then connecting them. While this structure improves computational efficiency and feature expressiveness in GPU environments, it can cause problems such as increased cache usage and reduced processing speed in CPU-based mobile devices. To address these limitations, YOLOv5-V2 completely removes the Focus layer and replaces it with a simple convolutional operation, thereby reducing the computational burden of input processing and simplifying the overall architecture. Another key component of YOLOv5 is the C3 layer, a simplified version of the Cross-Stage Partial (CSP) structure that balances computational efficiency and performance.
However, frequent use of this layer can result in cache bottlenecks due to depthwise separable convolutions. To overcome this issue, YOLOv5-V2 reduces the frequency of C3 usage and instead incorporates the Inverted Residual + Shuffle Block module from ShuffleNet V2 into the backbone into the backbone.
The core idea of ShuffleNetV2 is to significantly reduce computational cost (FLOPs) and latency while maintaining accuracy through channel split and channel shuffle.
2.2 Structure of YOLOv5-V2 Model
The structure of YOLOv5-V2 consists of input processing, backbone, Spatial Pyramid Pooling Fast (SPPF) module, Neck, and Head. Each step that constitutes it is systematically summarized through the pseudocode in Algorhithm 1.

The YOLOv5-V2 model follows a structure consisting of input processing, backbone, SPPF module, Neck, and Detect Head. The computational flow of each stage can be expressed in pseudocode, and the functional features of the structure can be interpreted as follows based on this.
First, the model receives the RGB input image I ∈ RH×W×C and performs 3 × 3 convolution (conv) and max pooling operations in the initial processing stage. Through this process, the first downsampling feature map F2 is generated, which reduces the computational load in the subsequent stages and provides a basis for high-level feature extraction. This process can be formulated as:
The backbone consists of modules based on ShuffleNet V2, and maximizes computational efficiency by repeatedly applying the Inverted Residual Block and Shuffle Block. In each block, channels are divided into groups, and the computational cost is reduced while minimizing information loss through depthwise convolution and channel shuffling. Through this process, multi-level feature maps such as F3, F4, and F5 are generated in stages. After that, F5 is passed to the SPPF (Spatial Pyramid Pooling Fast) module to perform parallel pooling operation using filters of various sizes. This module integrates spatial information of multiple resolutions to help the model effectively recognize objects of various sizes. The output of the SPPF module serves as the final backbone output and is passed as the input of the next Neck stage.
Neck is a PANet-based structure that repeatedly performs upsampling and concatenation operations to restore high-resolution features. For example, the SPPF output is combined with the upper-level feature F4 to generate P4, and then P3 is generated through an upsampling operation combined with F3. This process enhances multi-scale object detection by integrating high-resolution information and low-resolution information.
In the Head stage, object detection operation is finally performed based on the multi-resolution feature maps of P3, P4, and P5. In each feature map, a prediction result including the center coordinate (x, y), width (w), height (h), class probability (c), and confidence score is generated. This process is performed in parallel for each scale, and in the post-processing step, duplicate boxes are removed through non-maximum suppression (NMS) and the final detection result is produced. In this way, YOLOv5-V2 clearly defines the operation flow of each step through a pseudocode-based structure, and is designed as a lightweight object detection model that can simultaneously secure operation optimization, lightweight, and multi-resolution recognition performance.
2.3 Design of the YOLOv5-P Model
The YOLOv5-P model is based on the basic structure of YOLOv5, but focuses on significantly reducing the computational complexity and number of parameters of the entire model by introducing the core lightweight design concept of PP-PicoDet. This model consists of input processing, backbone, lightweight neck, and detection head, and focuses on securing real-time performance in edge-based applications such as pest detection. The overall structure, as depicted in Fig. 3 below, comprises input processing, backbone, SPPF module, Neck, and Detection Heads.
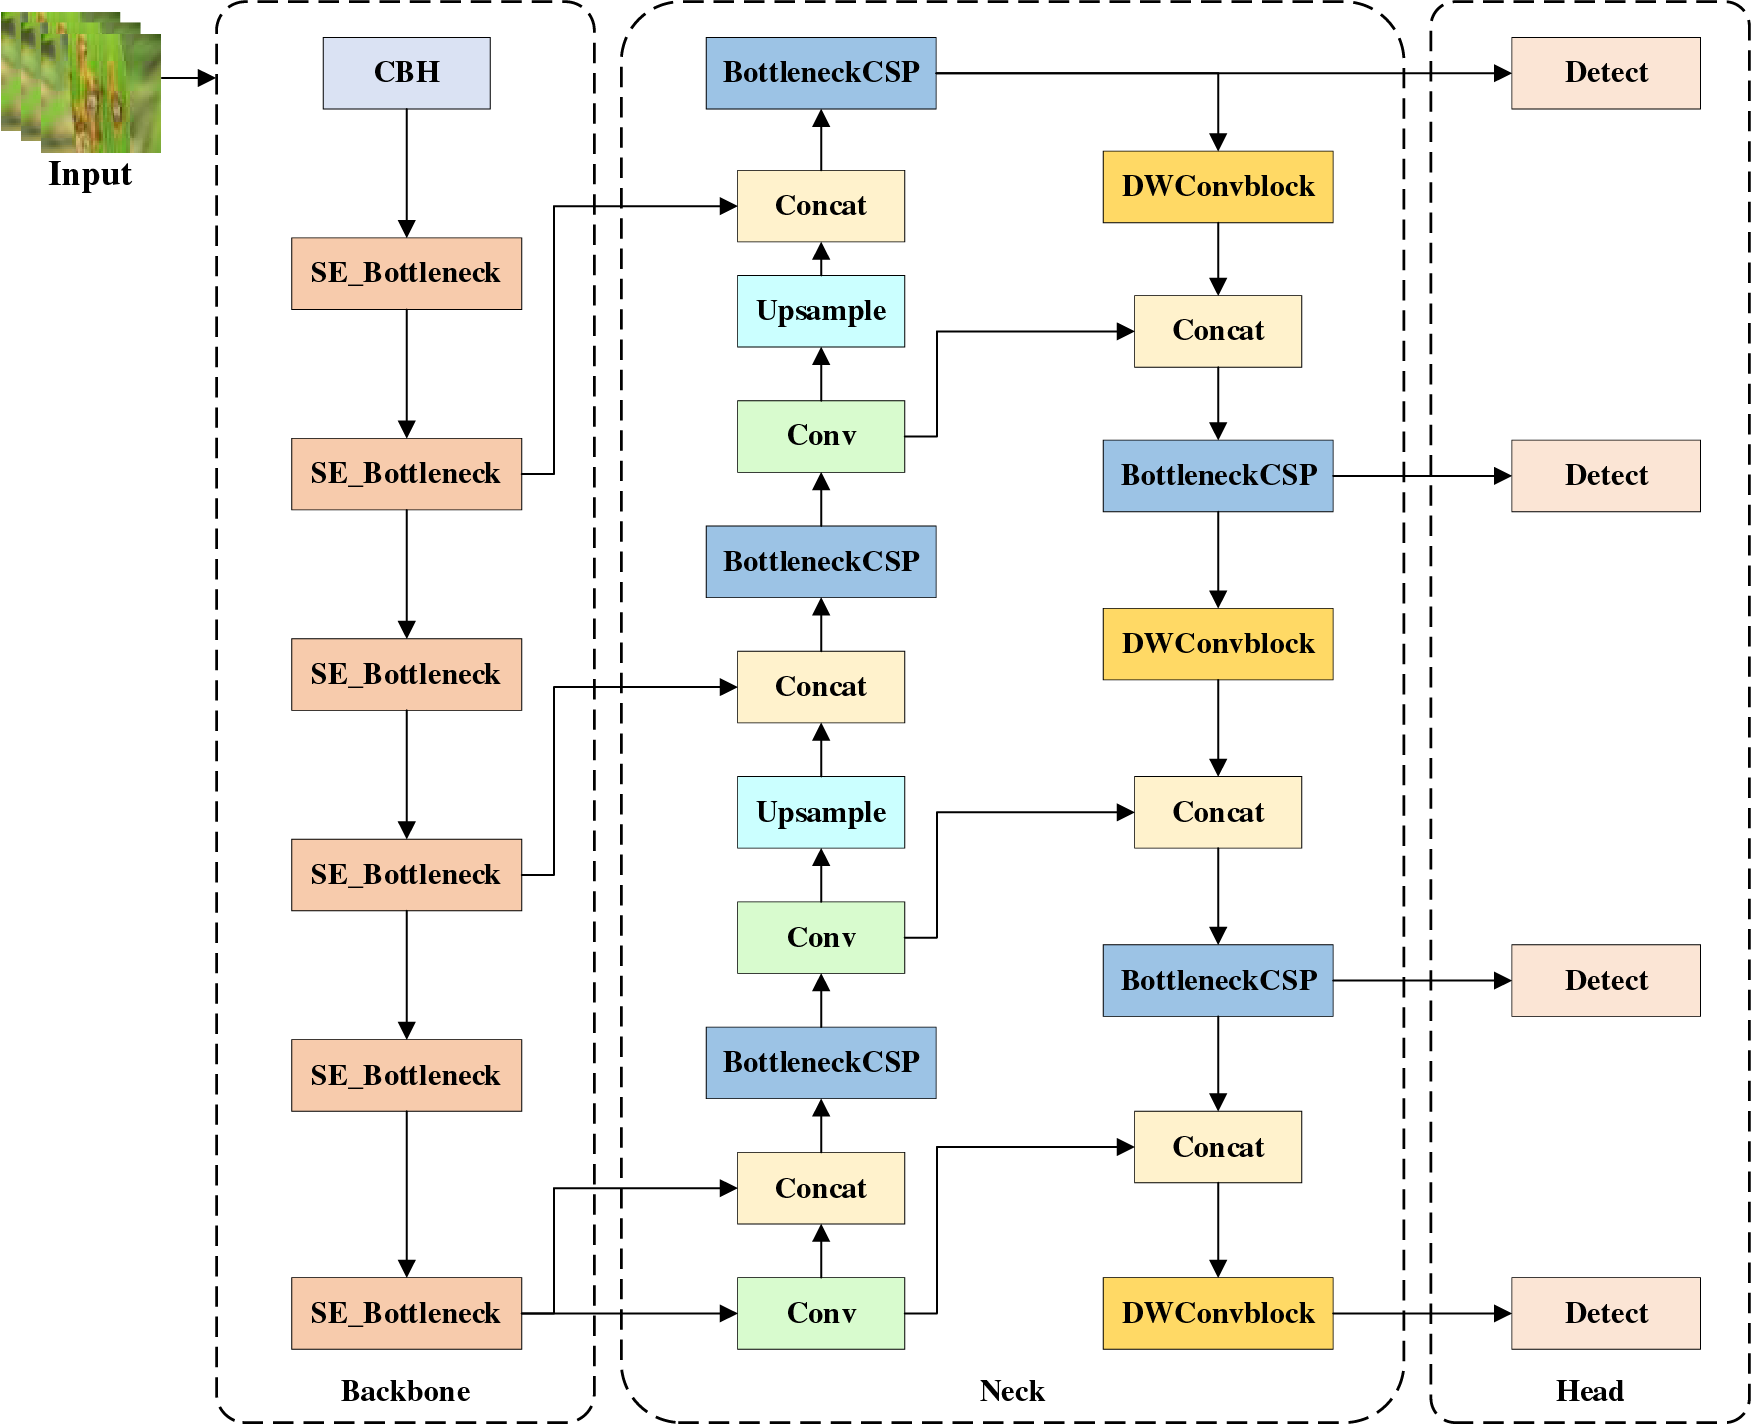
Figure 3: Structure of the YOLOv5-P model
The model begins by extracting initial features through a 3 × 3 convolution (conv) operation and downsampling with a Stride 2 for the RGB input image, and depthwise separable convolution is used to minimize the computational cost in the first operation block. In the subsequent backbone structure, lightweight modules similar to the ELAN (Enhanced Lightweight Aggregation Network) adopted in PP-PicoDet are applied, contributing to effectively extracting core information while reducing the size of the entire model.
In the backbone stage, multi-stage blocks for generating feature pyramids are repeatedly used, and each block includes depth-separated convolution with a kernel size of 3 × 3 or 5 × 5, channel merging, and skip connections. In particular, a lightweight Bottleneck structure is used to remove unnecessary duplication between channels and maintain efficient information flow, which is a key design element of PP-PicoDet’s lightweight strategy.
The Neck structure serves as a replacement or a simplified version of YOLOv5’s PANet, and integrates upper and lower level feature maps through a lightweight Path Aggregation Block. In this process, more computationally efficient additive feature fusion or depthwise convolution-based merge operations are used instead of upsampling and concatenation. This reduces memory usage while maintaining important feature information.
In the final Head stage, the position coordinates, size, class probability, and confidence score of the object are predicted using multi-resolution output feature maps (P3, P4, P5). YOLOv5-P reduces the number of output channels per layer for conciseness and lightweight prediction, and during post-processing, non-maximum suppression (NMS) is used to remove duplicate detection results to determine the final object. The overall structure of YOLOv5-P is based on the design philosophy of PP-PicoDet and is composed of a lightweight network architecture that maintains the detection performance of YOLOv5 while enabling real-time operation in mobile environments or low-spec edge devices. This model is particularly effective in significantly reducing the total number of model parameters and memory usage while maintaining detection accuracy for objects ranging from small to medium sizes such as pest detection, drone exploration, and IoT-based sensor image analysis.
2.4 Structure of the YOLOv5-P Model
The YOLOv5-P model is a detection model that actively introduces the lightweight strategy of Edge Segmentation Network (ESNet) [19] and PP-PicoDet while based on the detection structure of YOLOv5 to reduce the overall computational cost and enhance real-time processing performance. This model consists of four stages: Backbone, Head, Neck, and Detection, and the computational flow of each stage is defined according to the pseudocode in Algorithm 2.

First, in the Backbone stage, the initial feature map F2 is generated through the Convolutional Bottleneck Hybrid (CBH) module that combines the 3 × 3 convolution (Conv) operation and the HardSwish activation function for the input image. After that, four ES_Bottleneck modules are repeatedly applied to extract the intermediate feature maps from F3 to F6. These maps are connected to the corresponding resolution stages, P3 to P6 in the YOLO structure. The ES_Bottleneck module secures both computational efficiency and feature expressiveness by combining the depthwise convolution and channel shuffle techniques.
The Head stage is designed based on the CSP-PAN structure [20], and it fuses features of various resolutions and performs feature fusion and reconstruction across various resolutions. First, F7 is generated by applying ES_Bottleneck to F6 again, and blocks for each resolution are configured based on this. For example, H1 and H2 are integrated with upper-level features through upsampling and concatenation to form feature maps of P5 and P4 levels, respectively. After that, the BottleneckCSP module is applied again in stages to expand the feature map to the P3 level. This structure effectively handles object recognition across various object sizes, including small objects. In the Neck structure, the feature map of the upper resolution is downsampled again to perform deep feature representation. At this time, DWConvBlock (Depthwise Convolution Block) and BottleneckCSP are alternately arranged to compress information while preserving important spatial information. D4 to D6 generated through this correspond to P3, P4, and P5, respectively, and ultimately, a multi-scale feature map is constructed across four resolution levels.
In the detection stage, feature maps from P3 to P6 are input, and the detection results, such as the bounding box center coordinates (x, y), width w, height h, and class probability c for each location, are output. YOLOv5-P makes these predictions based on four automatically set anchors, during the post-processing stage, duplicate boxes are removed through non-maximum suppression (NMS) to produce the final detection results.
YOLOv5-P is designed to combine the latest lightweight techniques, such as depthwise convolution, shuffle, BottleneckCSP, and additive fusion in the entire structure, and has secured computational optimization performance that can be processed in real time, not only on GPUs but also on CPU-based devices and edge devices. In particular, it is expected to significantly reduce the overall number of model parameters and memory usage while maintaining detection accuracy for objects of various sizes, from small to medium-sized objects. Due to these structural features, YOLOv5-P can be utilized as a high-performance, lightweight detection model suitable for various field application environments that require both lightness and real-time performance, such as pest detection, drone-based smart agricultural image analysis, and IoT sensor-based object recognition.
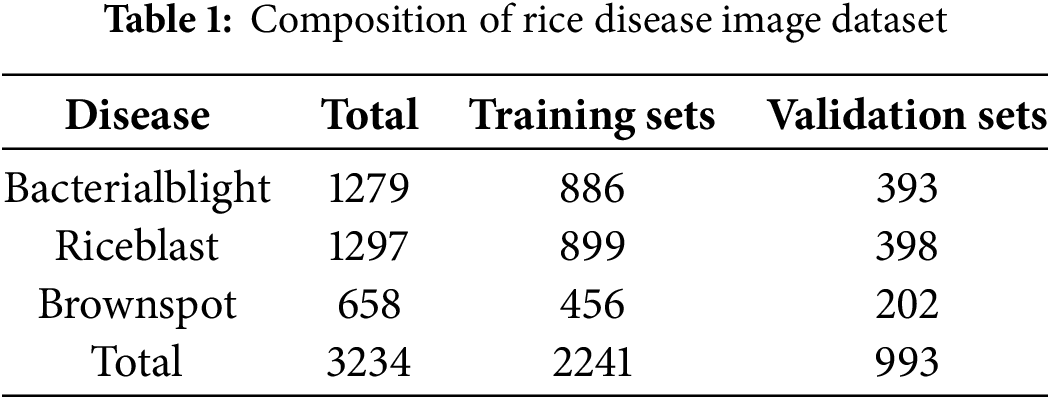
The rice pest image dataset used in this study was captured in a real-world rice field environment and consists of 3234 images in total. The dataset includes images of three typical pests that frequently appear in rice cultivation: bacterial blight, rice blast, and brown spot. It consists of 1279 images of bacterial blight, 1297 images of rice blast, and 658 images of brown spot, specifically. To enhance the generalizability of the model and simulate real-field application scenarios, the images were captured using a mobile device under natural daylight conditions in a rice field environment. The images feature a complex background and exhibit variations in shooting angle, distance, and lighting conditions, capturing diverse manifestations of the diseases on rice leaves. The labels of each pest image were distinguished based on visual symptoms, and the dataset was divided into a training set and a validation set for model evaluation. Approximately 70% of the total images, or 2241 images, were used for training, and the remaining 30%, or 993 images, were used for validation. By disease type, it was composed of white leaf blight (886 training/393 verification), blast (910/387), and striped leaf blight (445/213), and the data set was divided through random sampling. The training set accounted for 69.3% of the entire data set, and the verification set accounted for 30.7%, and stratified sampling was applied while maintaining the data ratio by disease. The detailed distribution by disease and pest is summarized in Table 1 below.
Model training and experiments were performed in a GPU server environment based on Matripool cloud, with an Ubuntu-based Linux operating system. The main software stack consisted of Python 3.10.14, PyTorch 2.3.1, and CUDA 11.8, and the hardware specifications were based on NVIDIA RTX 2080Ti GPU.
The model implementation was based on the YOLOv5 open source framework provided by Ultralytics, with modifications to lighten and improve the structure of YOLOv5s. All learning and validation processes were performed under the same settings, ensuring consistent dataset partitioning and hyperparameters for accurate performance comparison.
The input image was resized to 640 × 640 pixels and processed, and basic data augmentation techniques such as horizontal flipping and color adjustment were applied during learning. The loss function used a combination of Cross-Entropy and CIoU-Loss, model performance was evaluated using metrics such as mAP (mean Average Precision), IoU (Intersection over Union), model size, number of parameters, and inference speed (FPS). All experiments were performed with a batch size of 1, and the average FPS (Frames Per Second) indicator was also displayed to objectively measure the processing speed in a real-time inference environment.
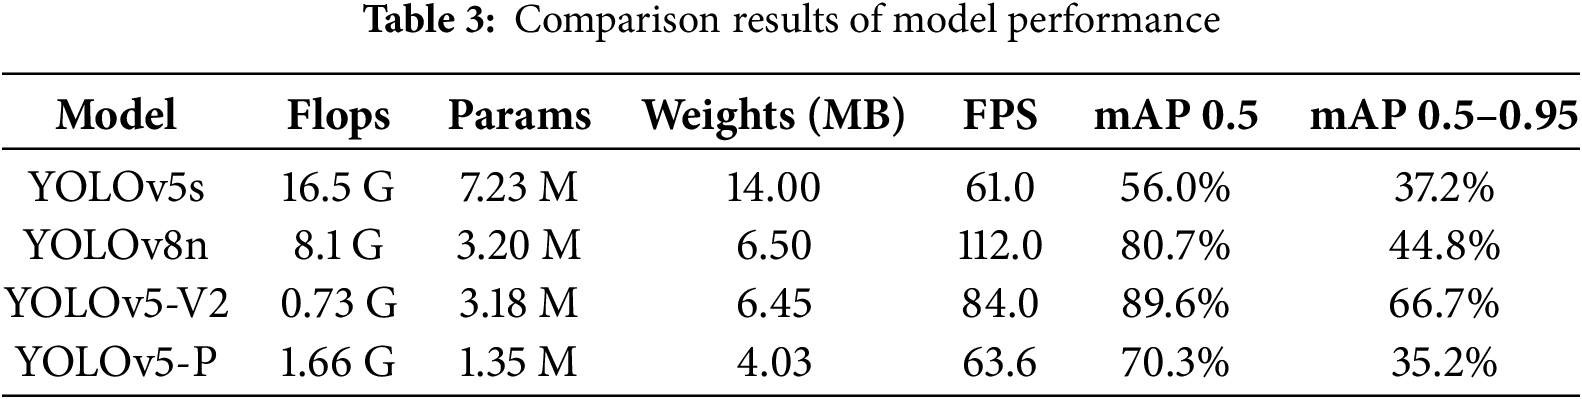
The results of the model performance comparison are summarized in Tables 2 and 3. To ensure the robustness of our results, each experiment was run 5 times with different random seeds for weight initialization and data shuffling. The reported results are the mean values from these runs. In this study, the detection accuracy, lightweight effect, and real-time processing performance were quantitatively evaluated, focusing on the proposed YOLOv5-V2 and YOLOv5-P models. YOLOv5-V2 demonstrated superior accuracy compared to YOLOv5-P, recording 89.6% at mAP: 0.5 and 66.7% at mAP: 0.5:0.95. Precision and recall also showed high values of 91.3% and 85.6%, respectively. On the other hand, YOLOv5-P showed lower performance overall with mAP 0.5 at 70.3%, mAP 0.5–0.95 at 35.2%, Precision at 62.3%, and Recall at 74.1%, but the model size was 4.03 MB, which was about 37% lighter than YOLOv5-V2 at 6.45 MB, proving its efficiency more suitable for mobile environments. Regarding real-time processing performance, YOLOv5-V2 recorded an average of 84.0 FPS, while YOLOv5-P showed a relatively slow speed of 63.6 FPS, but still capable of real-time processing. In particular, YOLOv5-V2 is judged to have a structure with overall balance in terms of model size, speed, and accuracy, and YOLOv5-P has high potential for use in application environments that prioritize ultra-lightweight and fast inference speed.
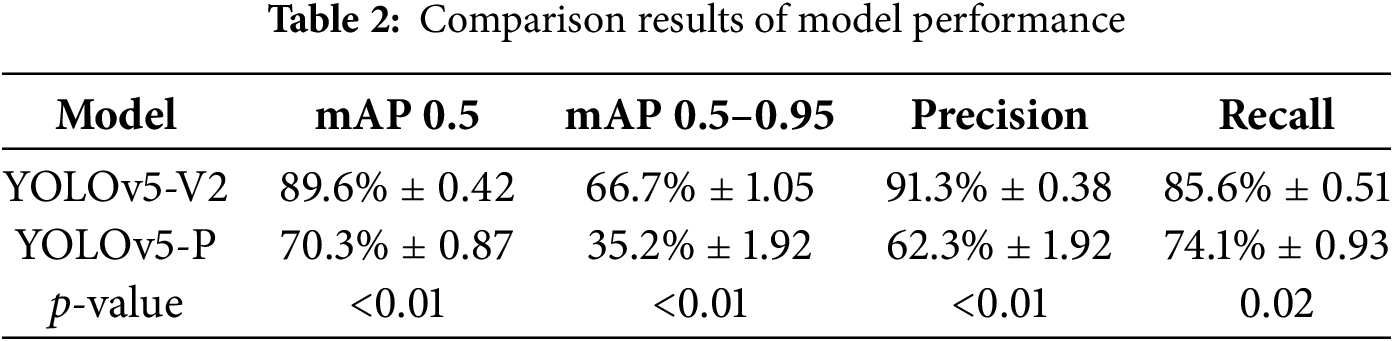
The improvements offered by YOLOv5-V2 over YOLOv5-P were statistically significant (p < 0.01) for all major metrics, as confirmed by a paired t-test performed on the results from 5 independent training runs.
To validate the advancement of the proposed model, we conducted a comprehensive comparison with the state-of-the-art YOLOv8n model. YOLOv8n is a nano-scale model from the YOLO series released by Ultralytics, renowned for its excellent lightweight design and speed-accuracy balance, making it a strong baseline model in the field of lightweight object detection.
As shown in Table 3, our proposed YOLOv5-V2 model demonstrates significant performance advantages over the advanced YOLOv8n model. Although the parameter counts of the two models are very similar (YOLOv5-V2: 3.18 M vs. YOLOv8n: 3.2 M), YOLOv5-V2 outperforms YOLOv8n by approximately 9% in mAP50 (89.6% vs. 80.7%) and 22% in mAP50–95 (66.7% vs. 44.8%). This result strongly validates that our strategy of employing a ShuffleNetV2 backbone and removing the Focus layer provides superior feature extraction capabilities for the specific task of rice disease detection compared to the architecture used by YOLOv8n.
It is noteworthy that YOLOv8n achieves higher FPS on a high-end GPU (RTX 2080Ti) (112 vs. 84), benefiting from its deeper architecture and optimized GPU inference engine. However, the computational complexity (FLOPs) of our model is significantly lower than that of YOLOv8n (0.73 G vs. 8.7 G), indicating that YOLOv5-V2 has an inherent advantage in computational efficiency. We anticipate that the speed gap between the two models will narrow or even reverse, when deployed on resource-constrained edge devices (e.g., Jetson Nano), while the accuracy advantage of YOLOv5-V2 will make it a superior choice for field deployment. This will be a key focus of our next-step validation.
In conclusion, while maintaining excellent lightweight characteristics, YOLOv5-V2 significantly surpasses the lightweight benchmark YOLOv8n in detection accuracy, achieving a better Accuracy-Complexity Trade-off, making it more suitable for agricultural edge computing scenarios with limited computational resources.
3.4 Visual Prediction Results and Performance Analysis by Disease
Table 4 compares the visual prediction results of the two models for three diseases (blight, wilt, and black scorpion). YOLOv5-V2 demonstrated excellent prediction stability, with high confidence scores (0.89–0.92) and accurate bounding box alignment for all three diseases. In contrast, YOLOv5-P showed low confidence scores (0.28~0.36) and missed detections for some diseases (especially black scorpion). This visual difference is due to the structural difference in the models, and YOLOv5-P exhibiting relatively lower feature expression capability, which is confirmed to have low detection accuracy in small lesions or ambiguous boundaries.

This trend is also evident in the quantitative performance comparison by disease in Table 5. YOLOv5-V2 showed excellent performance overall, recording mAP: 0.5 of 97.2% for Riceblast, 91.2% for Bacterialblight, and 80.3% for Brownspot, However, YOLOv5-P exhibited low accuracy, with figures of 71.0%, 63.5%, and 56.2% for the same diseases, respectively.

A limitation of this study is that the model was evaluated on a single, privately collected dataset. While the results are statistically significant, further validation on public benchmarks and datasets featuring different rice varieties and environmental conditions is necessary to fully demonstrate the generalizability of the proposed model. This will be a key focus of our future work.
In this study, in order to simultaneously achieve real-time detection and lightweight processing for rice pests and diseases, we proposed YOLOv5-V2, a new object detection model that integrates the ShuffleNet V2 module based on the YOLOv5s structure. The proposed model effectively reduces the overall computational complexity and model size by removing the Focus layer and introducing the efficient backbone of ShuffleNet V2 while maintaining the structural advantages of the existing YOLOv5s. In addition, we implemented the YOLOv5-P model based on PP-PicoDet together for performance comparison, and quantitatively analyzed the performance of both models based on the same pest image dataset. As a result of the experiment, YOLOv5-V2 demonstrated excellent detection performance, recording mAP 0.5 (89.6%), mAP 0.5–0.95 (66.7%), Precision 91.3%, and Recall 85.6% despite its lightweight model size of 6.45 MB. On the other hand, YOLOv5-P had a smaller model size but showed poorer performance in terms of detection accuracy and reliability.
In particular, YOLOv5-V2 showed excellent detection quality even when the disease boundary was ambiguous or the lesion size was small, and it confirmed the possibility of securing both real-time performance and precision even in environments with limited computational resources such as edge computing. The practicality and field applicability of the proposed model were also proven by conducting experiments on three types of diseases that frequently occur in actual agricultural fields: blast, white leaf blight, and black scorpion.
A limitation of this study is the absence of performance benchmarks on physical edge computing devices. In future work, we plan to deploy our models on platforms such as NVIDIA Jetson Nano and Raspberry Pi to comprehensively evaluate their real-world inference speed, power consumption, and thermal performance, further validating their practicality for field deployment.
Although the dataset used in this study was collected in complex outdoor environments, preliminarily demonstrating the model’s robustness to occlusions and lighting variations, it did not systematically evaluate the model’s performance under specific degradation conditions such as motion blur and sensor noise. In future work, constructing a dedicated evaluation dataset encompassing these challenging noises and conducting a comprehensive robustness benchmark test will be our top priority.
While the proposed model demonstrates excellent performance on our dataset, its translation into real-world agricultural practice presents several challenges and opportunities. Firstly, data availability and scalability remain a hurdle. Our model was trained on a specific, privately collected dataset. For broader applicability, future efforts should focus on creating large-scale, public benchmarks encompassing diverse rice varieties, disease strains, and environmental conditions. Techniques like transfer learning and few-shot learning will be crucial for adapting the model to new regions with limited data.
Secondly, regarding deployment considerations, our model’s lightweight nature (6.45 MB, 0.73 G FLOPs) makes it a suitable candidate for deployment on embedded systems like the NVIDIA Jetson Nano or even modern smartphones. However, practical factors such as power consumption optimization under continuous operation and thermal management in field conditions require further investigation.
Finally, the integration into existing workflows is key to adoption. A plausible scenario involves deploying the model as a real-time diagnostic tool within a mobile application, allowing farmers to simply take a picture of a diseased leaf for immediate analysis. Alternatively, it could be integrated into autonomous scouting drones or robots for large-scale field monitoring. Overcoming barriers such as user-friendly interface design, result interpretation for non-experts, and connectivity issues in rural areas will be essential for successful implementation.
In future studies, The immediate next step of this research is to deploy and evaluate the YOLOv5-V2 and YOLOv5-P models on real edge computing platforms (e.g., NVIDIA Jetson Nano, Raspberry Pi, and Qualcomm embedded development boards), comprehensively measuring their inference speed, power consumption, and memory usage, and conducting a rigorous comparative analysis to ultimately validate their practicality in real agricultural environments. The model can be expanded to various crop diseases and developed into a core technology for smart agricultural solutions by integrating with actual field sensor systems, implementation of an on-device inference environment, and fusion with multi-object tracking functions.
Acknowledgement: Not applicable.
Funding Statement: Not applicable.
Author Contributions: The authors confirm contribution to the paper as follows: writing—original draft preparation, Qingtao Meng; writing—review and editing, Sang-Hyun Lee; supervision, Sang-Hyun Lee. All authors reviewed the results and approved the final version of the manuscript.
Availability of Data and Materials: Not applicable.
Ethics Approval: Not applicable.
Conflicts of Interest: The authors declare no conflicts of interest to report regarding the present study.
References
1. Faizal Azizi MM, Lau HY. Advanced diagnostic approaches developed for the global menace of rice diseases: a review. Can J Plant Pathol. 2022;44(5):627–51. doi:10.1080/07060661.2022.2053588. [Google Scholar] [CrossRef]
2. Lu Y, Song S, Wang R, Liu Z, Meng J, Sweetman AJ, et al. Impacts of soil and water pollution on food safety and health risks in China. Environ Int. 2015;77:5–15. doi:10.1016/j.envint.2014.12.010. [Google Scholar] [PubMed] [CrossRef]
3. Jiang W, Liu C, Liu W, Zheng L. Advancements in intelligent sensing technologies for food safety detection. Research. 2025;8(1):0713. doi:10.34133/research.0713. [Google Scholar] [PubMed] [CrossRef]
4. Saleem MH, Potgieter J, Mahmood Arif K. Plant disease detection and classification by deep learning. Plants. 2019;8(11):E468. doi:10.3390/plants8110468. [Google Scholar] [PubMed] [CrossRef]
5. Srijakkot K, Kanjanasurat I, Wiriyakrieng N, Benjangkaprasert C. The comparison of faster R-CNN and atrous faster R-CNN in different distance and light condition. J Phys Conf Ser. 2020;1457(1):012015. doi:10.1088/1742-6596/1457/1/012015. [Google Scholar] [CrossRef]
6. Xiao F, Wang H, Xu Y, Zhang R. Fruit detection and recognition based on deep learning for automatic harvesting: an overview and review. Agronomy. 2023;13(6):1625. doi:10.3390/agronomy13061625. [Google Scholar] [CrossRef]
7. Liu Z, Cheng J. CB-FPN: object detection feature pyramid network based on context information and bidirectional efficient fusion. Pattern Anal Appl. 2023;26(3):1441–52. doi:10.1007/s10044-023-01173-9. [Google Scholar] [CrossRef]
8. Bauravindah A, Fudholi DH. Lightweight models for real-time steganalysis: a comparison of MobileNet, ShuffleNet, and EfficientNet. J RESTI (Rekayasa Sist Teknol Inf). 2024;8(6):737–47. doi:10.29207/resti.v8i6.6091. [Google Scholar] [CrossRef]
9. Hu Y, Deng X, Lan Y, Chen X, Long Y, Liu C. Detection of rice pests based on self-attention mechanism and multi-scale feature fusion. Insects. 2023;14(3):280. doi:10.3390/insects14030280. [Google Scholar] [PubMed] [CrossRef]
10. Sapkota R, Flores-Calero M, Qureshi R, Badgujar C, Nepal U, Poulose A, et al. YOLO advances to its genesis: a decadal and comprehensive review of the you only look once (YOLO) series. Artif Intell Rev. 2025;58(9):274. doi:10.1007/s10462-025-11253-3. [Google Scholar] [CrossRef]
11. Liang J. A review of the development of YOLO object detection algorithm. Appl Comput Eng. 2024;71(1):39–46. doi:10.54254/2755-2721/71/20241642. [Google Scholar] [CrossRef]
12. Redmon J, Divvala S, Girshick R, Farhadi A. You only look once: unified, real-time object detection. In: 2016 IEEE Conference on Computer Vision and Pattern Recognition (CVPR); 2016 Jun 27–30; Las Vegas, NV, USA. doi:10.1109/CVPR.2016.91. [Google Scholar] [CrossRef]
13. Redmon J, Farhadi A. YOLOv3: an incremental improvement. arXiv:1804.02767. 2018. [Google Scholar]
14. Bochkovskiy A, Wang CY, Liao HYM. YOLOv4: optimal speed and accuracy of object detection. arXiv:1804.02767. 2018. [Google Scholar]
15. Yaseen M. What is YOLOv8: an in-depth exploration of the internal features of the next-generation object detector. arXiv:2409.07813. 2024. [Google Scholar]
16. Zhang X, Zhou X, Lin M, Sun J. ShuffleNet: an extremely efficient convolutional neural network for mobile devices. In: 2018 IEEE/CVF Conference on Computer Vision and Pattern Recognition; 2018 Jun 18–23; Salt Lake City, UT, USA. doi:10.1109/CVPR.2018.00716. [Google Scholar] [CrossRef]
17. Ma N, Zhang X, Zheng HT, Sun J. ShuffleNet V2: practical guidelines for efficient CNN architecture design. In: Computer Vision—ECCV 2018; 2018 Sep 8–14; Munich, Germany. doi:10.1007/978-3-030-01264-9_8. [Google Scholar] [CrossRef]
18. Yu G, Chang Q, Lv W, Xu C, Cui C, Ji W, et al. PP-PicoDet: a better real-time object detector on mobile devices. arXiv:2111.00902. 2021. [Google Scholar]
19. Wang Y, Zhou Q, Xiong J, Wu X, Jin X. ESNet: an efficient symmetric network for real-time semantic segmentation. arXiv:1906.09826. 2019. [Google Scholar]
20. Wang CY, Liao HYM, Yeh IH, Wu YH, Chen PY, Hsieh JW. CSPNet: a new backbone that can enhance learning capability of CNN. arXiv:1911.11929. 2019. [Google Scholar]
Cite This Article
 Copyright © 2026 The Author(s). Published by Tech Science Press.
This work is licensed under a Creative Commons Attribution 4.0 International License , which permits unrestricted use, distribution, and reproduction in any medium, provided the original work is properly cited.
 Downloads
 Citation Tools