
 Submit a Paper
 Propose a Special lssue
 Open Access
ARTICLE

AT-Net: A Semi-Supervised Framework for Asparagus Pathogenic Spore Detection under Complex Backgrounds
College of Information Science and Engineering, Shandong Agricultural University, Tai’an, 271000, China
* Corresponding Author: Chao Zhang. Email:
Computers, Materials & Continua 2026, 86(2), 1-23. https://doi.org/10.32604/cmc.2025.068668
Received 03 June 2025; Accepted 03 September 2025; Issue published 09 December 2025
 View Full Text
 Download PDF
Abstract
Asparagus stem blight is a devastating crop disease, and the early detection of its pathogenic spores is essential for effective disease control and prevention. However, spore detection is still hindered by complex backgrounds, small target sizes, and high annotation costs, which limit its practical application and widespread adoption. To address these issues, a semi-supervised spore detection framework is proposed for use under complex background conditions. Firstly, a difficulty perception scoring function is designed to quantify the detection difficulty of each image region. For regions with higher difficulty scores, a masking strategy is applied, while the remaining regions are adversarial augmentation is applied to encourage the model to learn from challenging areas more effectively. Secondly, a Gaussian Mixture Model is employed to dynamically adjust the allocation threshold for pseudo-labels, thereby reducing the influence of unreliable supervision signals and enhancing the stability of semi-supervised learning. Finally, the Wasserstein distance is introduced for object localization refinement, offering a more robust positioning approach. Experimental results demonstrate that the proposed framework achieves 88.9% mAP50 and 60.7% mAP50–95, surpassing the baseline method by 4.2% and 4.6%, respectively, using only 10% of labeled data. In comparison with other state-of-the-art semi-supervised detection models, the proposed method exhibits superior detection accuracy and robustness. In conclusion, the framework not only offers an efficient and reliable solution for plant pathogen spore detection but also provides strong algorithmic support for real-time spore detection and early disease warning systems, with significant engineering application potential.Keywords
Nomenclature
| SSOD | Semi-Supervised Object Detection |
| IoU | Intersection-over-Union |
| mAP | Mean average precision |
| ARE | Adaptive region enhancement |
| GMM | Gaussian mixture model |
| ATG | Adaptive threshold generation module |
| PDA | Potato Dextrose Agar |
| NWD | Normalized Wasserstein Distance |
Asparagus stem blight is the primary disease affecting asparagus production, exerting a significant negative impact on both crop yield and quality. The problem is especially acute in plants older than three years, where the incidence rate can approach 100% [1]. Once infection occurs, the disease spreads rapidly, often causing extensive plant mortality and seriously hindering the sustainable development of the asparagus industry. Due to the unpredictable onset and rapid transmission of pathogenic spores, early detection is essential for effective disease prevention and control. Timely monitoring and intervention can greatly reduce infection rates, thereby safeguarding crop productivity.
Currently, culture-based isolation and microscopic examination are the most commonly employed methods for detecting pathogenic spores. However, these techniques are highly dependent on manual operations, resulting in lengthy detection times, a high level of required expertise, and inconsistent results. In large-scale monitoring scenarios, traditional approaches often fail to meet the real-time demands of disease prevention and control, thereby contributing to a predominantly reactive strategy in managing stem blight. Therefore, there is an urgent need for an automated detection tool that can respond quickly and deal with large-scale crop disease spread efficiently.
A core challenge in the development of such automated tools lies in the accurate classification of fungal spore species. In practical applications, spore detection remains difficult due to the tiny size of spores and their strong visual similarity to complex backgrounds, as illustrated in Fig. 1. First, spore targets are small and easily masked by background noise. Second, there is considerable morphological variation not only among different spore types but also within the same species. Third, the inherent complexity of microscopic imaging—characterized by low contrast, uneven illumination, speckle noise, and localized blurring—further complicates precise detection.
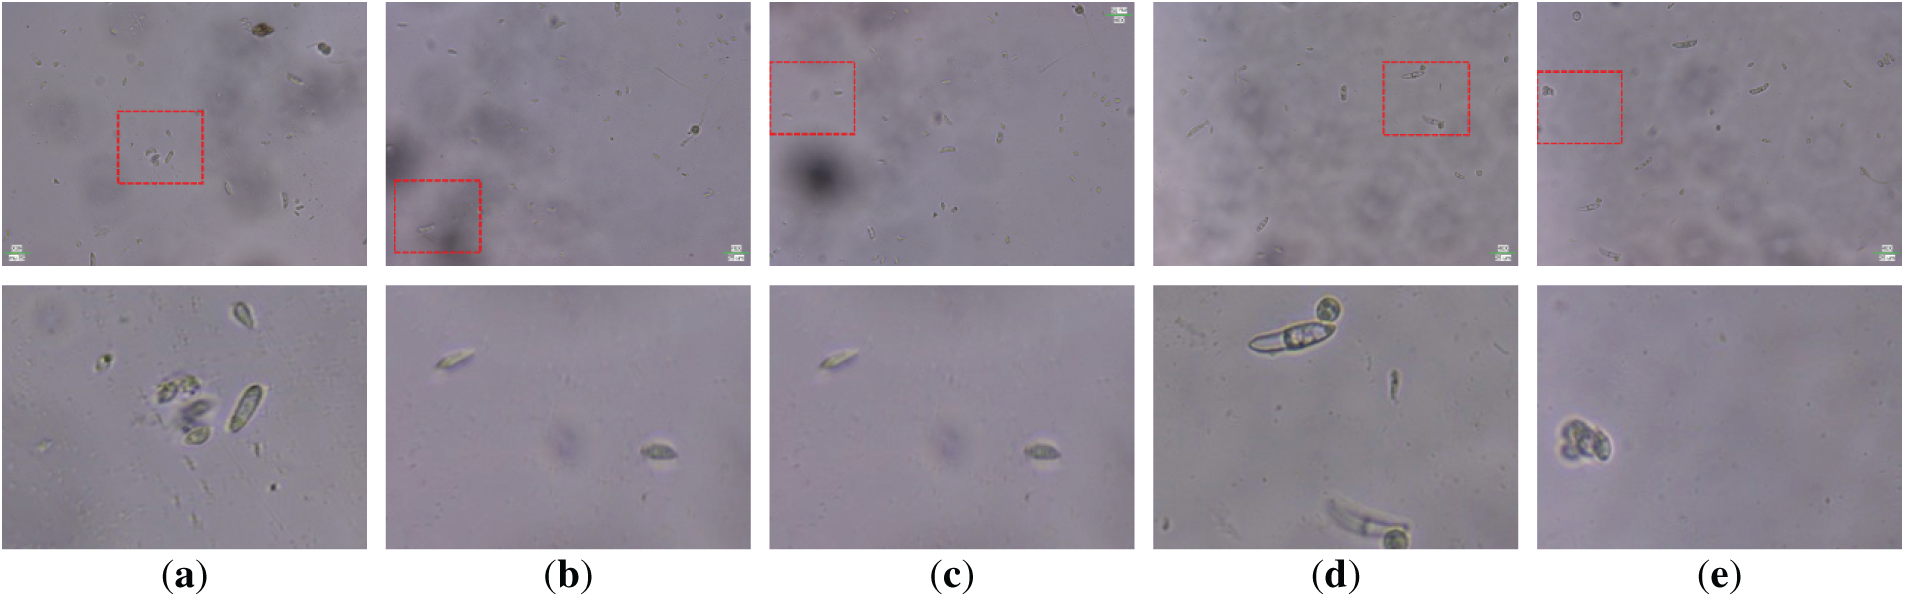
Figure 1: Typical challenges in spore detection: (a–c) low contrast between target and background, (d,e) spores with changes due to broken morphology. The top image is the original image, the bottom image is the enlarged image, and the red box is the displayed area
In traditional approaches, Lei et al. [2] employed the K-means algorithm to segment spores from the background in microscopic images, followed by morphological operations and Harris corner detection to achieve spore counting. Qi et al. [3] utilized the Canny operator to extract spore edges of Magnaporthe oryzae, proposing an automatic detection and counting method based on microscopic image processing. Zhao et al. [4] introduced a level set model guided by Signed Log Gaussian Similarity (SLGS), which enables accurate contour evolution of spores by automatically adjusting the evolution direction to ensure convergence to the correct boundary. However, these methods are generally limited to simple or controlled imaging scenarios and rely heavily on manually designed feature extractors, making them less effective in complex backgrounds.
In recent years, with the rapid advancement of deep learning [5–8], fully supervised object detection methods [9–12] have been extensively studied in the context of spore detection. However, these approaches generally assume that all regions within an image carry equal learning value during training, overlooking the significant variations in discriminative difficulty across regions, especially under complex backgrounds. This “uniform learning” strategy often causes the model to overfit to simpler regions while failing to adequately learn from more challenging areas, ultimately degrading performance in the detection of tiny spores.
To address this, researchers have proposed a variety of data augmentation methods [13–17], which have shown improvements in general object detection and image classification tasks. Nonetheless, most of these methods adopt random or global operations and fail to incorporate region-level semantic structures or localized difficulty when applying augmentation, limiting their effectiveness in complex scenarios. Furthermore, fully supervised approaches heavily rely on large-scale, high-quality annotated datasets. In microscopic spore detection, data acquisition and annotation are not only costly and expertise-intensive, but also prone to subjective inconsistency.
Therefore, it is imperative to explore detection methods that can maintain strong performance under limited annotation. Semi-supervised object detection (SSOD) methods [13,17–20] have emerged as a promising direction to alleviate the high cost of manual labeling. These methods typically adopt a teacher–student framework, where the teacher model generates pseudo-labels on unlabeled data to guide the training of the student model. Although effective, mainstream SSOD methods [18,21,22] commonly rely on fixed confidence thresholds to filter pseudo-labels, which often leads to issues such as label inconsistency and high noise sensitivity.
To mitigate these problems, some studies have introduced lightweight ensemble strategies to improve pseudo-label quality, achieving moderate success. However, these strategies are generally designed for targets with low inter-class similarity and minimal intra-class variation. For spore images—where inter-class similarity is high and intra-class morphological diversity is substantial—pseudo-label assignment remains unreliable. Moreover, spore images typically feature densely packed and tiny targets, where even correctly assigned instances may be mistakenly discarded during non-maximum suppression (NMS) or threshold-based filtering, resulting in critical information loss.
Therefore, directly applying existing SSOD methods to spore detection in complex microscopic environments still faces the following key challenges that remain insufficiently addressed:
(1) Interference from complex backgrounds and weakened small-object features: Microscopic spore images often contain noise artifacts, uneven illumination, and background tissue structures, which make pseudo-labels generated with limited annotations more susceptible to noise, reducing their accuracy and consistency.
(2) High sensitivity of pseudo-label assignment to localization: Given the tiny size and diverse morphology of spores, conventional IoU-based pseudo-label assignment strategies are highly sensitive to slight bounding box offsets, which can easily cause training instability and negatively affect box regression accuracy.
(3) Insufficient learning of complex regions: Most existing methods assume that all image regions share similar learning difficulty, overlooking the fact that regions with complex backgrounds are often more challenging to fit. This leads the model to overfit on simple regions while failing to effectively mine discriminative features from complex regions, ultimately degrading overall detection performance.
It is worth noting that recent methods such as FlexiMo [23] and UrbanSAM [24] have demonstrated strong transferability and adaptability in complex backgrounds and cross-domain tasks. Although these general-purpose foundation models primarily target large-scale remote sensing or urban segmentation applications, their design concepts in feature generalization, structural adaptability, and region-aware modeling provide valuable insights for spore detection. Specifically, even under limited labeled data, introducing region perception and adaptive feature modeling strategies can further enhance detection robustness and generalization performance in challenging background conditions. In this study, asparagus stem blight spores and associated diseases were selected as the primary research focus, and an adaptive semi-supervised detection network for tiny objects in complex backgrounds was proposed. The proposed model, termed AT-Net. Experimental results demonstrate that AT-Net achieves significantly superior detection performance compared to baseline methods on our self-constructed microscopic image dataset of Asparagus stem blight spores, even when trained with only 10% of annotated data. Compared with existing semi-supervised detection methods, the main technical contributions of this study are summarized as follows:
(1) Adaptive Region Enhancement: This work designs an improved region hardness scoring function that integrates four-dimensional indicators to perform fine-grained image partitioning and scoring, proactively guiding the model to focus on regions with higher discrimination difficulty and mitigating the risk of overfitting to simple backgrounds. Experiments demonstrate that this mechanism significantly improves the accuracy of spore detection and enhances robustness under complex backgrounds and target adhesion scenarios, showing strong adaptability to challenging conditions.
(2) Generation of Pseudo-Label Thresholds Using a Gaussian Mixture Model: Unlike existing methods that rely on fixed thresholds or simple linear ramp-up strategies, this study employs a Gaussian Mixture Model to model the prediction confidence distributions for different classes and dynamically adjust the pseudo-label filtering thresholds, thereby achieving adaptive optimization of the pseudo-supervision signals. This strategy effectively alleviates issues such as mis-removal and noise under static thresholds, consistently maintains higher pseudo-label quality and training stability across varying annotation ratios and complex backgrounds, and ultimately improves overall detection performance and model generalization.
(3) Wasserstein Distance-Based IoU Optimization: This study models bounding boxes as 2D Gaussian distributions and introduces the Wasserstein distance into the IoU metric to measure the spatial distribution discrepancy between predicted and ground-truth boxes, enabling more precise optimization of small object boundaries. Experimental results show that this method achieves better convergence and higher localization accuracy compared to mainstream regression losses such as GIoU and DIoU, demonstrating its superiority for small-object detection tasks.
Stem blight is the primary pathogen responsible for asparagus stem blight. Pathogen isolation, spore preparation, and data collection were conducted in the laboratory of the College of Plant Protection, Shandong Agricultural University, following standard protocols.
To simulate real field conditions and increase the complexity of the dataset, a series of morphologically similar spore species were introduced in this study. These include Fusarium solani, Alternaria alternata, Bacillus anthracis, and Bacillus verruciformis. Although these hybrid spores resemble asparagus stem blight spores in overall morphology, they exhibit subtle differences in color, size, and shape. Their inclusion enhances the diversity of the experimental dataset and improves its applicability to real-world scenarios.
Specifically, all strains were purified on potato dextrose agar (PDA) medium and incubated at 28°C in the dark for 7 days. Subsequently, the purified strains were transferred to fresh PDA plates to induce spore production. To simulate varying levels of disease severity under field conditions, the spore suspensions were mixed and diluted with sterile water to produce different concentrations. This strategy was designed to ensure the diversity and comprehensiveness of the experimental data.
The dataset used in this study comprises mixed spore images. The construction process consists of four main stages: spore image acquisition, data augmentation, data partitioning, and data annotation. The overall workflow of the dataset generation is illustrated in Fig. 2.
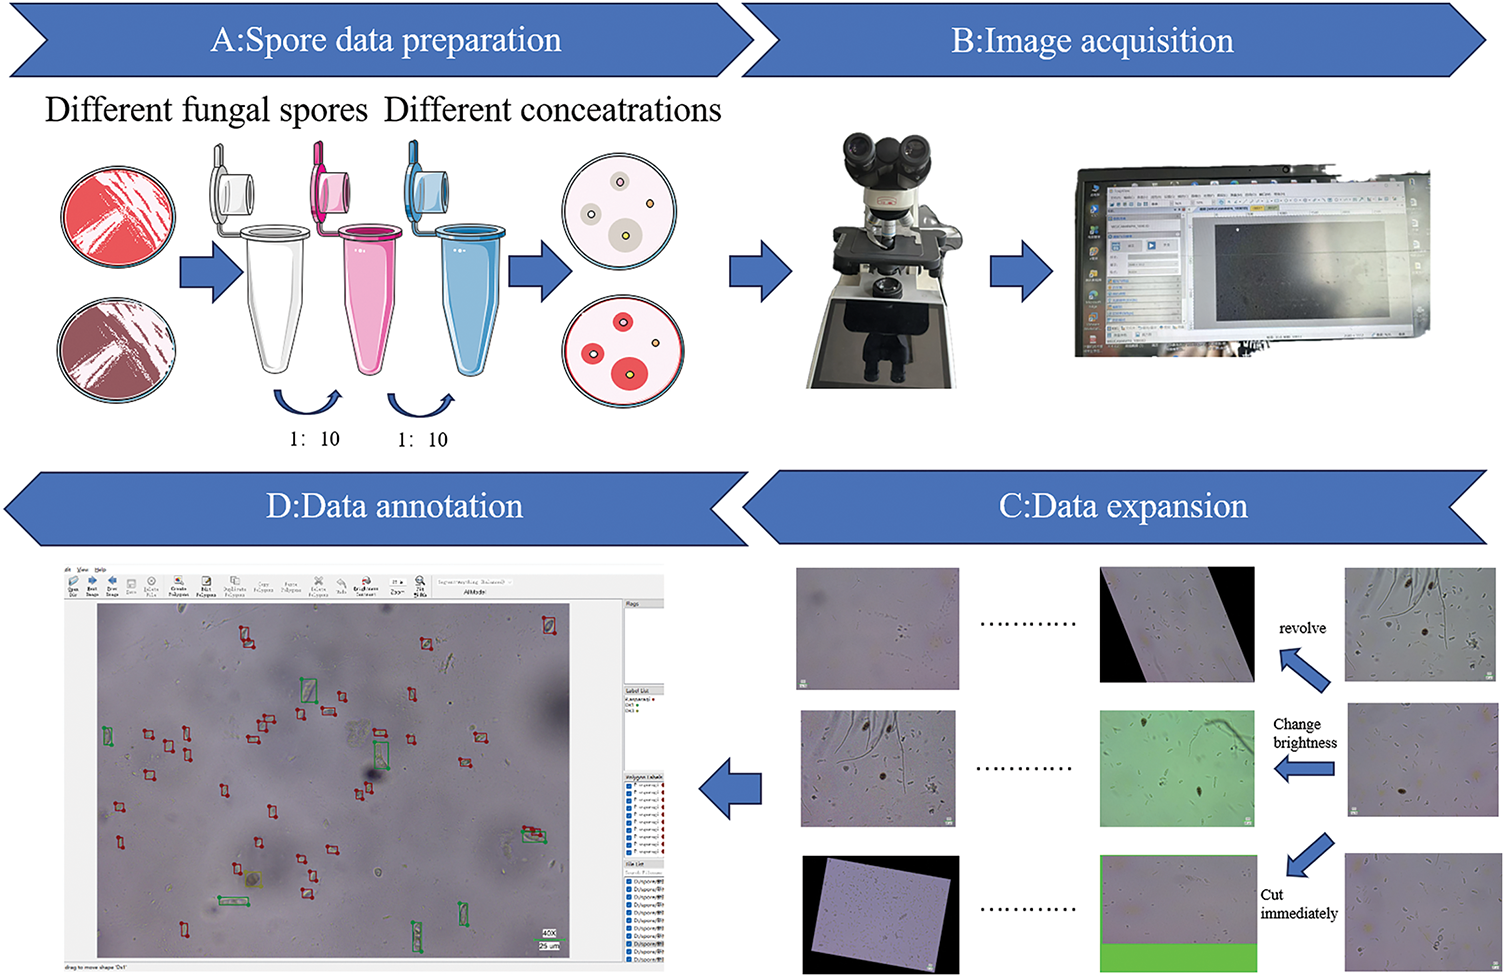
Figure 2: Dataset construction flow chart: (A) preparation of mixed spore suspensions with varying concentrations; (B) acquisition of microscopic spore images using digital microscope; (C) application of various data augmentation techniques to enhance the acquired images; and (D) annotation of different spore types using labeling software
(1) Data acquisition
A sterile dropper was used to extract a small quantity of spore suspension, which was then placed at the center of a glass slide and covered with a coverslip. Spore images were captured using a DN-117M digital microscope. A low-magnification lens was initially employed to locate the target region, followed by switching to a high-magnification lens to adjust the focus and exposure, ensuring image clarity. High-quality images were captured using ScopeImage 9.0 software and saved in JPG format. A total of 2071 mixed spore images with varying densities were successfully collected.
(2) Data augmentation
To prevent overfitting during model training and enhance generalization capability, data augmentation techniques were applied. These included Gaussian noise addition, cropping, horizontal flipping, and brightness variation simulation. As a result, the total number of spore images increased to 10,254.
(3) Data partitioning
The dataset was divided into training, validation, and test sets according to a pre-defined ratio. The training set contained both labelled and unlabeled images. The labelled portion was further subdivided into four subsets representing 1%, 2%, 5%, and 10% of the total annotations, while the remaining images were considered unlabeled and used for semi-supervised learning. Notably, to prevent category imbalance in the 1% labelled dataset, a simple random assignment method was deemed unsuitable. Instead, a balanced category distribution was ensured by manually including a fixed number of images for each class, followed by randomly sampling the remainder. The final dataset composition is detailed in Table 1.
(4) Data annotation
The Labelme software was utilized for manual annotation of the spore images within the labelled subset. This ensured precise bounding box annotations for each spore instance, thereby providing high-quality training data for the detection model.
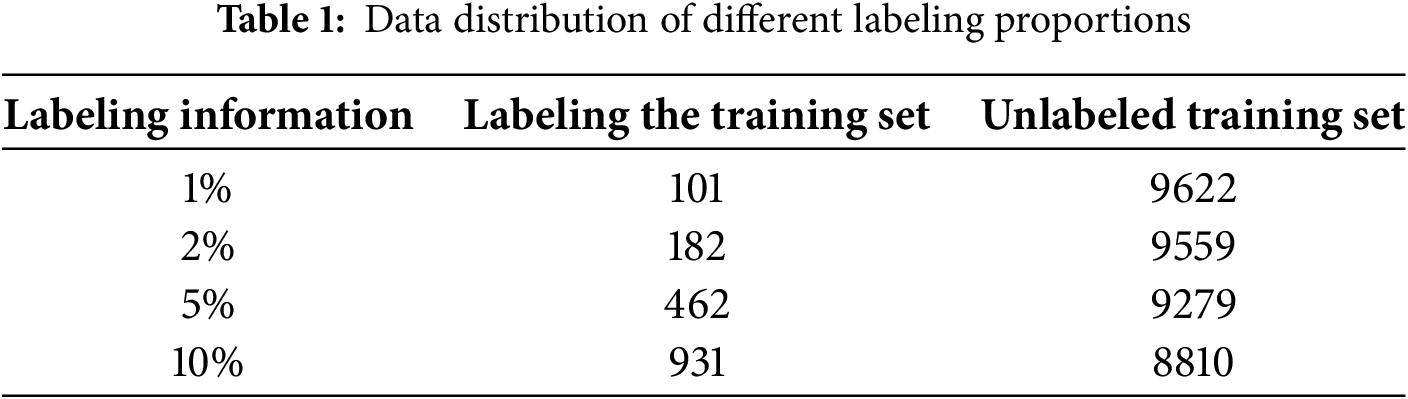
The overall architecture of the proposed AT-Net is illustrated in Fig. 3. Similar to previous teacher–student frameworks, AT-Net consists of two detection networks with identical configurations: a student model and a teacher model. In this study, we adopt Efficient-Teacher [25] as the baseline semi-supervised learning framework, and YOLOv5 as the underlying object detection network.
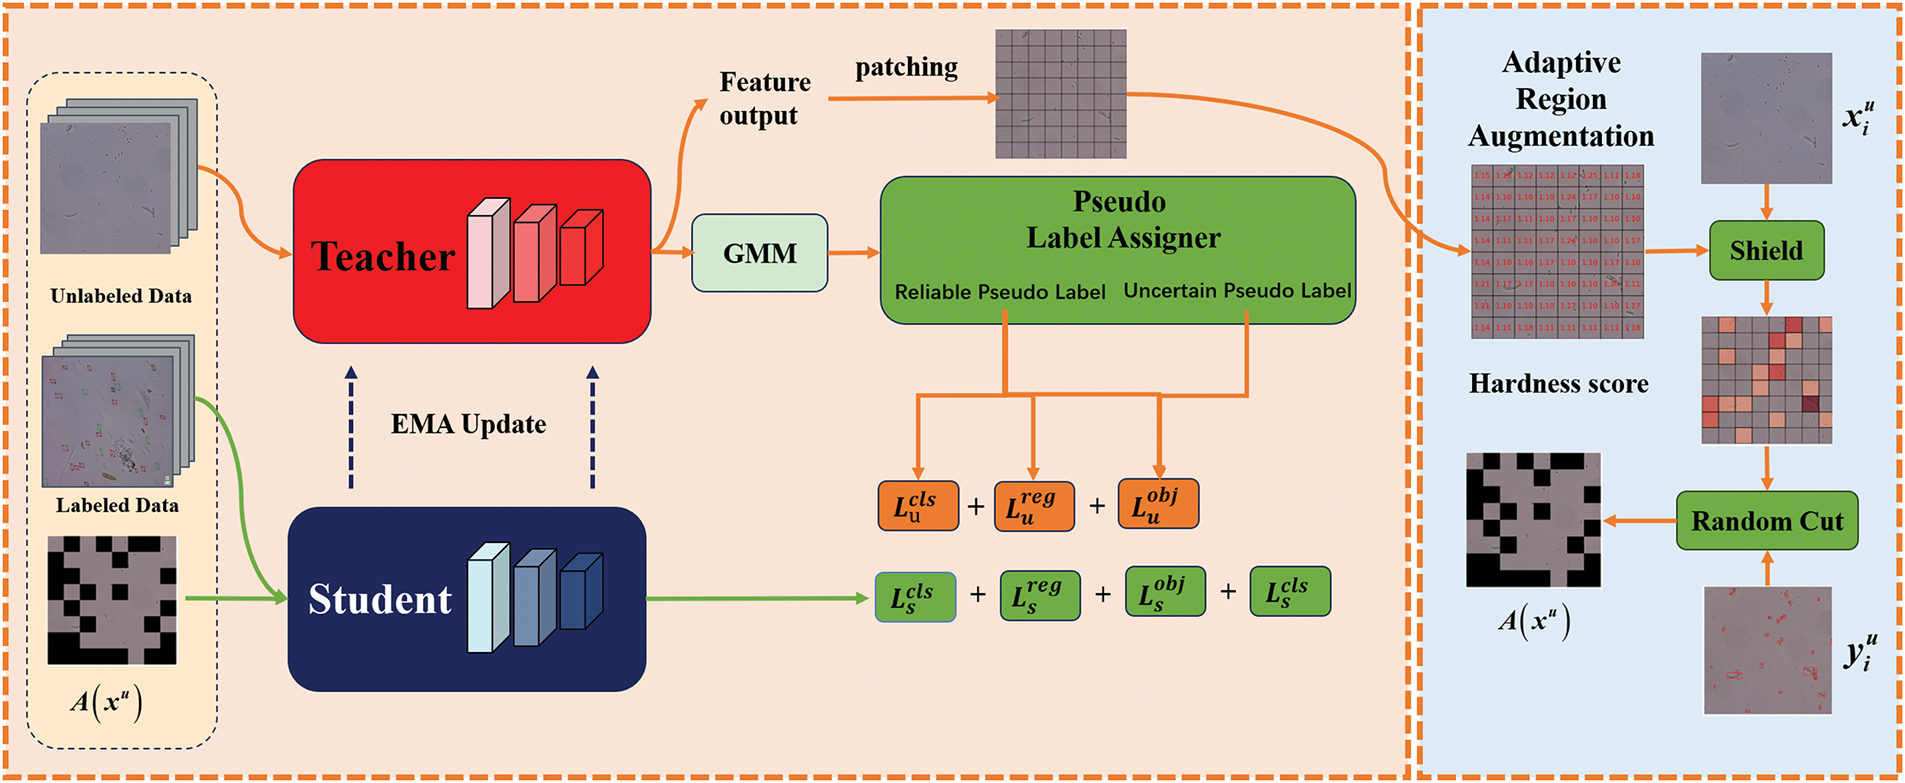
Figure 3: The general framework of the proposed AT-Net, which is based on a teacher–student architecture. The teacher model is utilized to generate pseudo-labels for unlabeled images and to produce an adaptive threshold via a Gaussian Mixture Model (GMM) for optimizing pseudo-label assignment. Concurrently, an Adaptive Region Enhancement (ARE) module is introduced to calculate the region hardness score. High-difficulty regions are subsequently masked and randomly occluded. The enhanced images, together with the labelled images, are then passed to the student model for supervised training.
2.3.1 Adaptive Region Enhancement
Traditional data augmentation methods [14–17,26] are typically based on uniform random masking strategies, which tend to overlook structured variations within the internal distribution of target regions. As shown in Fig. 1, the morphological diversity and contextual complexity of spore targets lead to considerable differences in learning difficulty across image regions. When identical augmentation strength is applied to both difficult and easy regions, the model’s ability to extract discriminative features is compromised. To address this, each image is divided into multiple regions, as illustrated in Fig. 4. Smaller regions are found to be more effective at capturing fine-grained details of the target and its surrounding background. Inspired by PH-Net [27], this study proposes a method called ARE (Adaptive Region Enhancement), as shown in Fig. 3. This module dynamically evaluates the discriminative difficulty of image regions and applies targeted enhancement to high-difficulty areas, thereby guiding the model to focus on more challenging visual features. While PH-Net is primarily designed for single-class segmentation tasks in medical ultrasound imaging, its architecture and objectives differ significantly from the multi-class small-object detection task addressed in this study. Moreover, PH-Net relies on a single difficulty metric, making it susceptible to class imbalance and background noise.
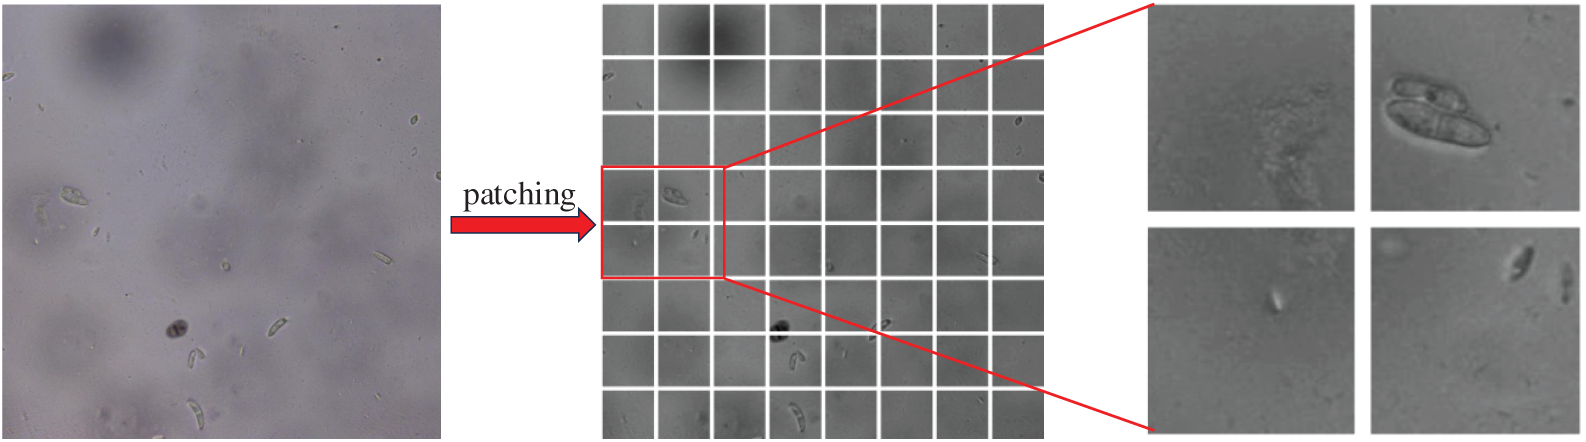
Figure 4: Detail map of region division: Small regions can capture the information of the target and background more clearly
In contrast, the proposed ARE module integrates multiple indicators closely related to object detection [28,29] enabling a more robust and comprehensive hardness scoring mechanism. Specifically:
Region Hardness Score: The model prediction probability is first divided into regions of a specified size, and the hardness score for each region is calculated as described below:
where
Adaptive region mask: Regions with high hardness scores are challenging to predict with high confidence, necessitating their further utilization in model training. To achieve this, a threshold mask sampler is developed, through which regions are sorted based on their hardness scores. Subsequently,
2.3.2 Generation of Pseudo-Label Thresholds Using a Gaussian Mixture Model
In the existing semi-supervised object detection, the static confidence threshold strategy is often used for pseudo-label screening, but this method has significant limitations. On the one hand, the distribution of prediction scores of different categories is quite different, and it is difficult to effectively screen all kinds of targets with a fixed threshold. On the other hand, as the training progresses, the feature representation ability of the model evolves, and the prediction confidence shows dynamic changes. Static thresholds are difficult to adapt to this change process.
This problem is particularly prominent in spore detection scenarios, where complex background noise, image artifacts, and annotation sparsity lead to significant fluctuations in pseudo-label quality. Too high a threshold will filter out some effective real targets with low confidence, while too low a threshold will easily introduce noise labels, which will affect the convergence and performance stability of the model.
In order to solve the above problems, inspired by the work of Consistency Teacher [30], this study improves a GMM-based category adaptive dynamic threshold method for modeling and filtering the pseudo-label confidence distribution. The proposed method has the characteristics of simple structure, high computational efficiency, and easy integration with existing detection frameworks, which is especially suitable for the deployment requirements of semi-supervised detection in real agricultural application scenarios. The core idea is to model the prediction confidence scores for each category as a bimodal Gaussian mixture distribution, where the low-confidence component is primarily influenced by background noise or false predictions, while the high-confidence component corresponds mainly to true positive targets. During training, the prediction scores are fitted using a GMM, and the pseudo-label filtering threshold for each category is dynamically adjusted based on the characteristics of its distribution, thereby enabling adaptive and fine-grained optimization. The implementation of this mechanism consists of the following key steps:
Probability density modeling: For the predicted score set
where,
Parameter optimization: Eq. (8), the EM algorithm is used to maximize the log-likelihood function to optimize the parameter g, and the posterior probability
Dynamic threshold calculation: Define the distribution of positive samples as
where,
Fig. 5 illustrates the clustering results across different rounds, based on the pseudo-label thresholds generated using the Gaussian Mixture Model. It is observed that as the number of rounds increases, the proportion of positive samples rises progressively. Through this adaptive threshold mechanism, the model is enabled to accurately distinguish between positive and negative samples, thereby enhancing the accuracy of pseudo-labels and the stability of the training process.
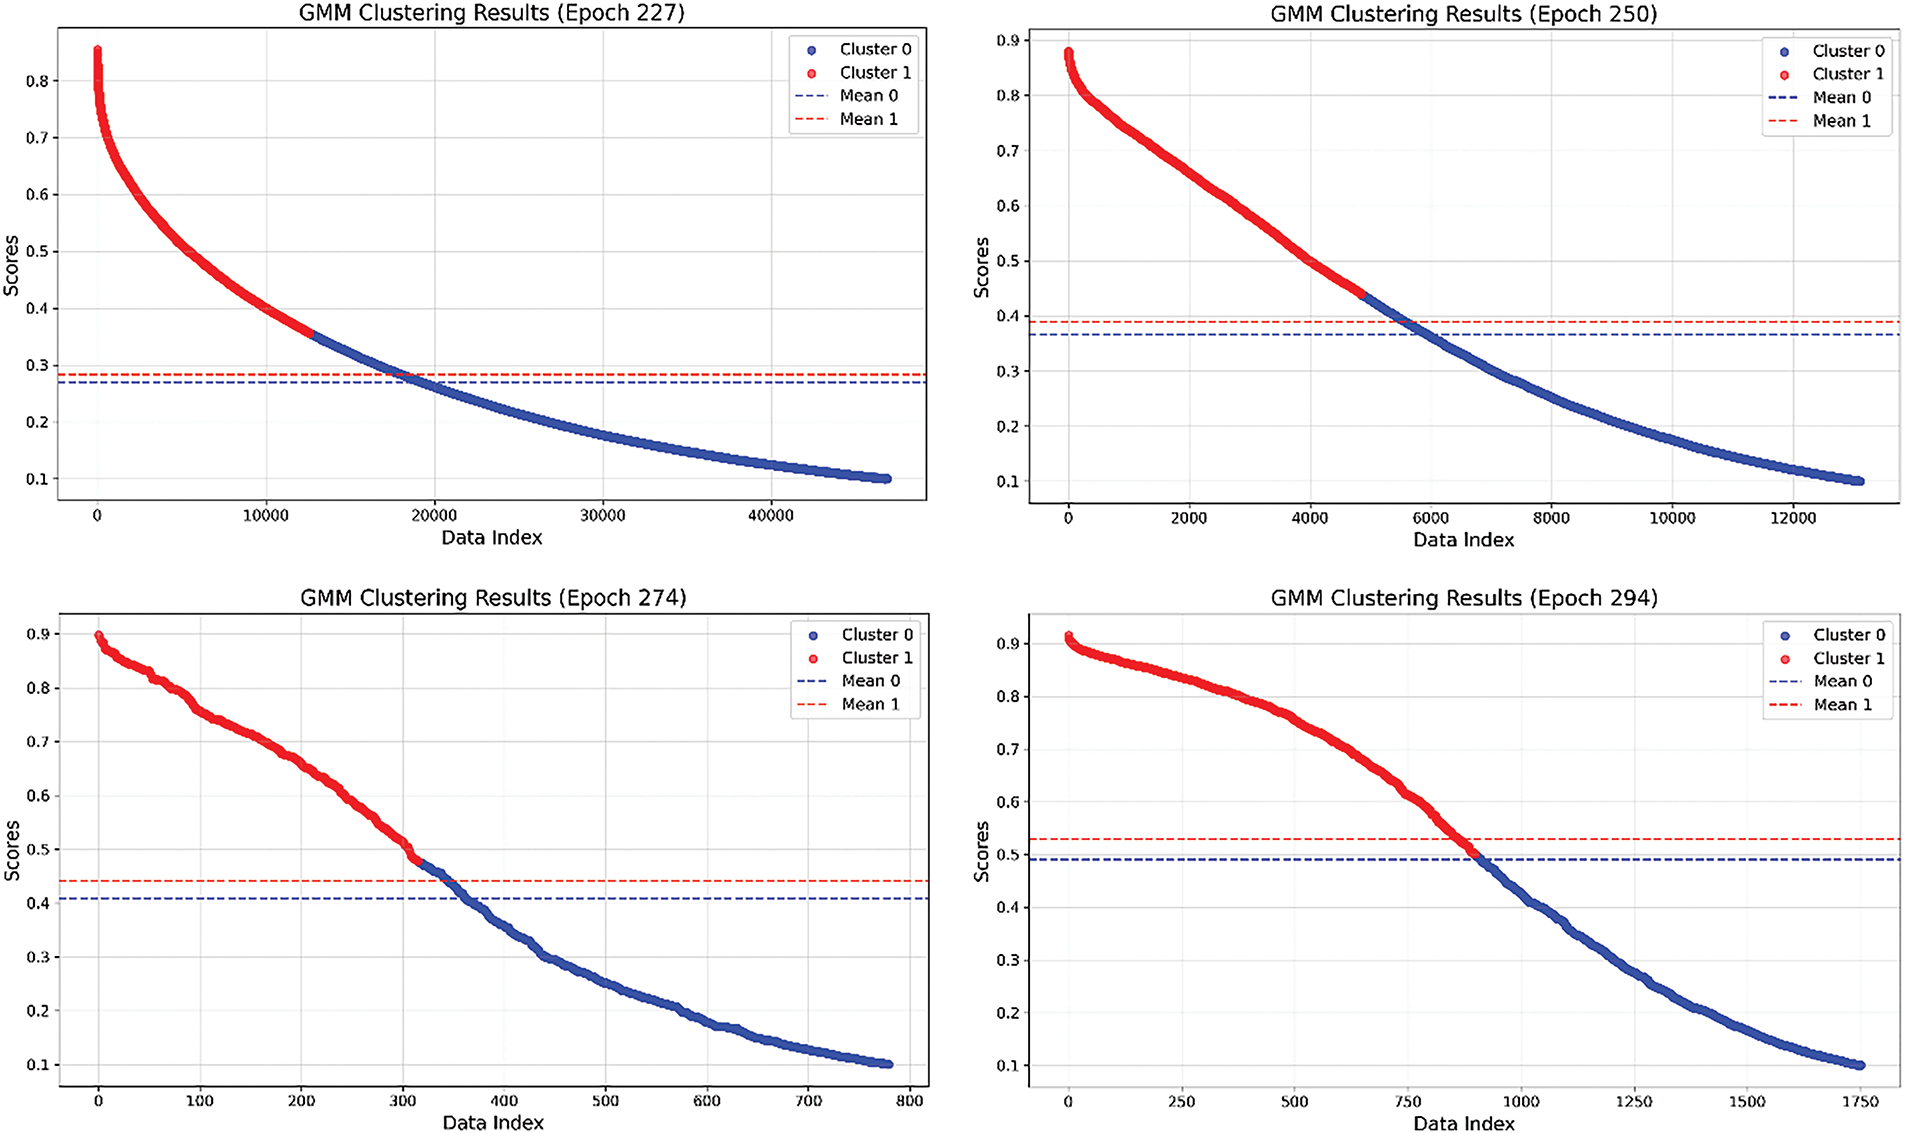
Figure 5: Changes of cluster distribution of model confidence scores for different rounds of GMM. In the figure, blue and red represent prediction scores with low and high confidence, respectively, and the mean value of each cluster is marked
This approach facilitates inter-class adaptive threshold learning through lightweight GMM modelling, with different threshold intervals being applied to distinct loss calculations. Consequently, the utilization efficiency of pseudo-labels is significantly improved, and the reliability of pseudo-labels is enhanced.
2.3.3 Wasserstein Distance-Based IoU Optimization
To gain a deeper understanding of the challenging nature of the spore detection task, the size distribution of targets in the dataset was analyzed in detail in this study. As illustrated in Fig. 6, the average absolute size of the targets in the dataset is 18.14 pixels, and the average relative size is 0.0279, indicating that most of the targets belong to the category of tiny targets. Compared with the distribution of objects in public datasets, traditional datasets usually contain a large number of medium and large size objects, while the proportion of small objects is low. In practice, we observe that a large number of prediction boxes inevitably contain part of the background region, which is especially prominent in small object detection. Since the object itself has few pixels, the foreground pixels are mostly concentrated in the center of the bounding box, while the background pixels are distributed in the edge region of the box. Therefore, the pixel importance of the target shows a structural distribution decreasing from the center to the edge.
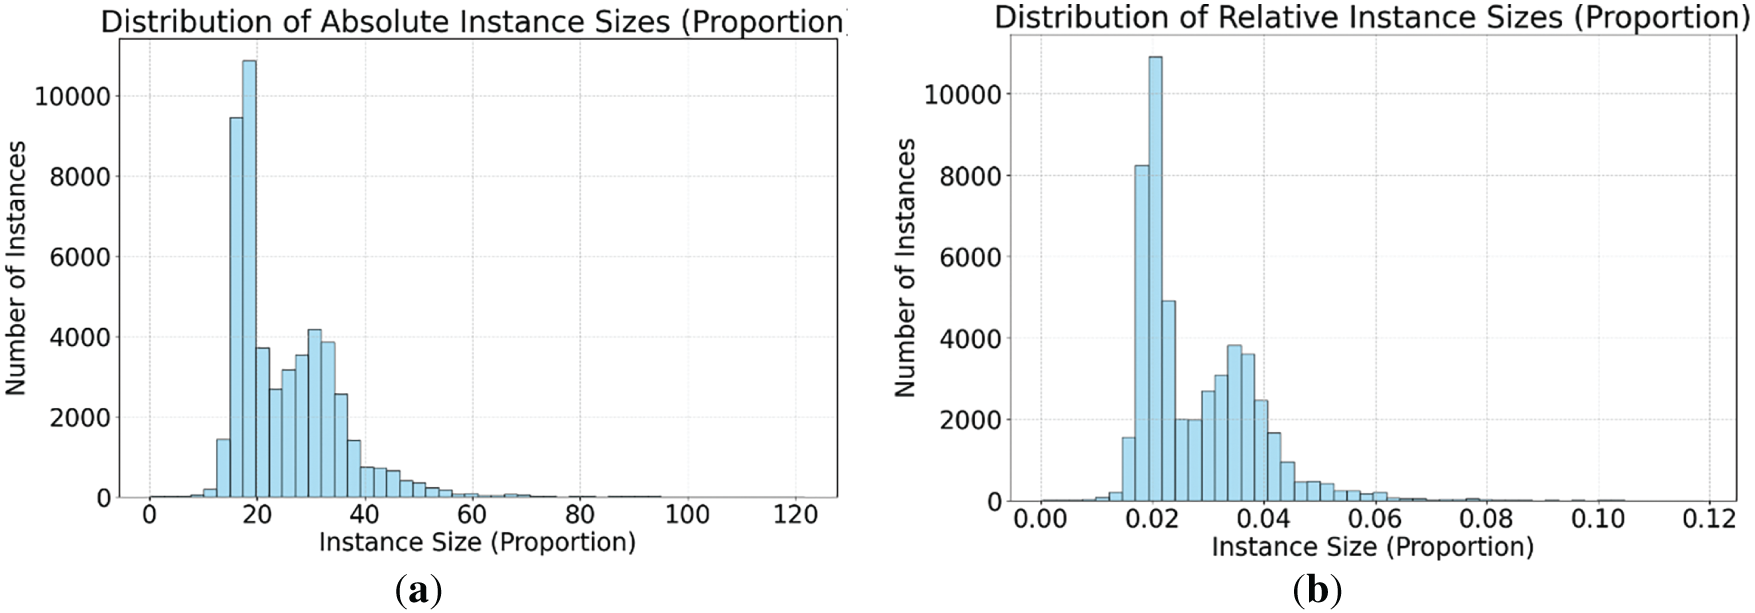
Figure 6: Analysis of the target size of the dataset. (a) Histogram of absolute dimensions. (b) Histogram of relative dimensions
In this case, the IoU commonly used in existing methods as a target box matching metric exposes significant deficiencies in small target scenarios. As shown in Fig. 7, the experimental comparison shows that in our self-built dataset, when the target size is small, the tiny coordinate offset of the bounding box may lead to drastic fluctuations in the IoU value. This instability makes the training process extremely sensitive to the position of the tiny box, which affects the learning stability and regression accuracy of the model on small targets. More importantly, this instability will also directly affect the generation and assignment of pseudo-labels in semi-supervised learning. When the pseudo box results in too low IoU due to only small deviations, it is highly likely to be wrongly screened out, thus losing high-quality supervision signals and further limiting the effectiveness of pseudo labels in small object detection. This problem is particularly prominent in spore image scenes, which has become an important bottleneck restricting the detection performance of semi-supervised learning.
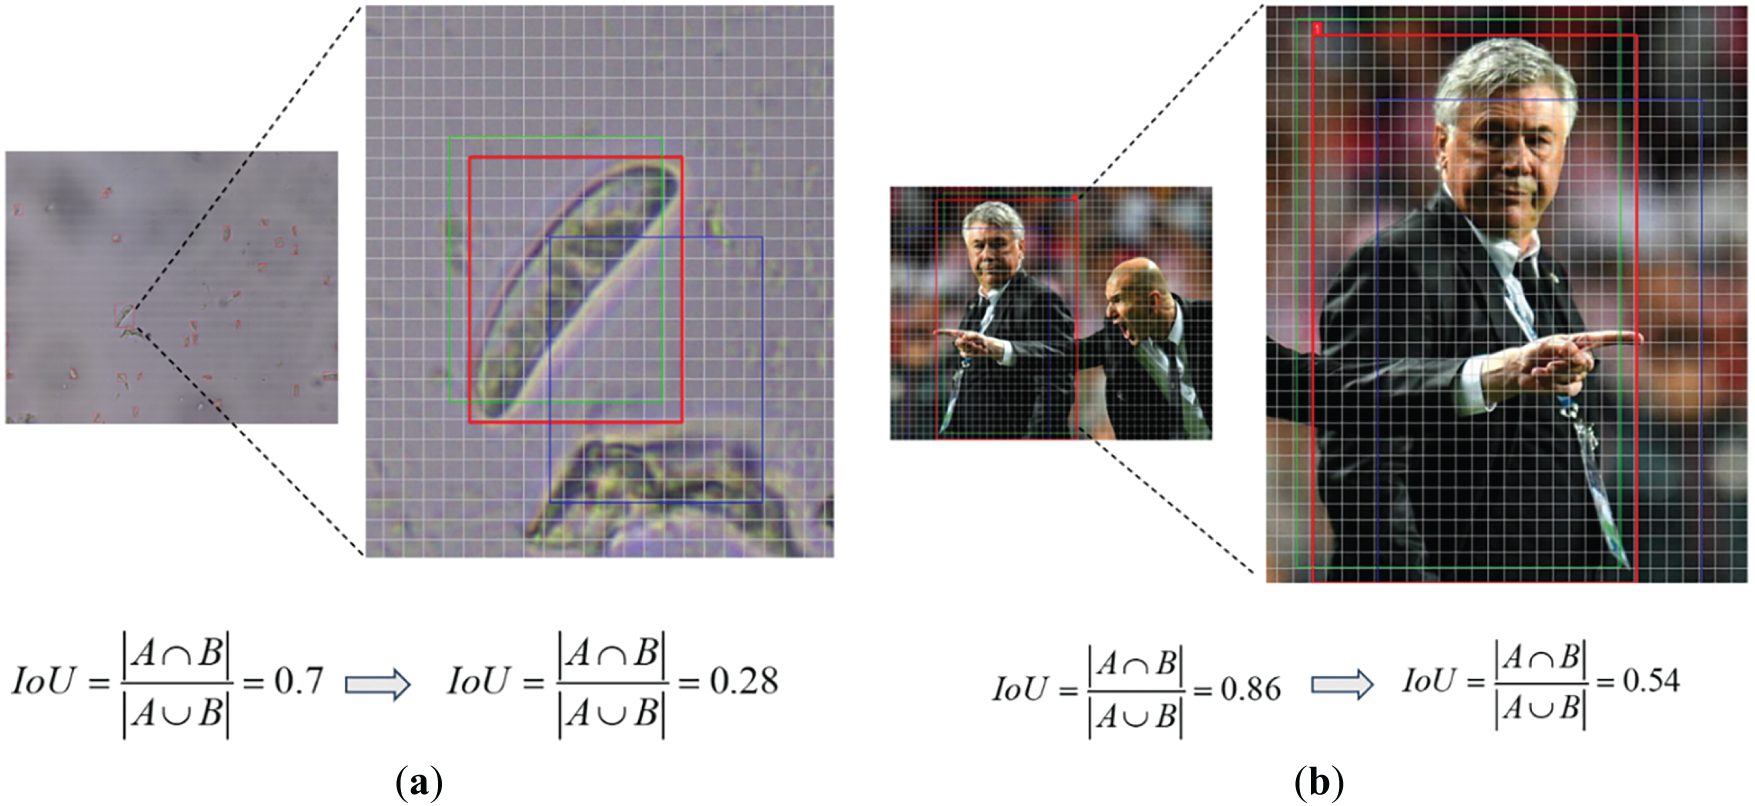
Figure 7: Sensitivity analysis of IoU to tiny targets and normal-sized targets. (a) Tiny scale object. (b) Normal scale object Here, each grid represents a pixel, the red box is the true annotated box, and the green and blue boxes represent the predicted bounding boxes with pixel deviations of 1 and 4 pixels, respectively
To address the aforementioned issues, the semi-supervised framework is enhanced in this study through the introduction of the Wasserstein distance [31], which is grounded in optimal transport theory. The Wasserstein distance accounts for both the positional disparity at the center and the dimensional variation of the bounding box, thereby effectively mitigating the sensitivity issues associated with conventional IoU-based metrics in small object detection. Specifically, the bounding box is modelled as a two-dimensional Gaussian distribution, with its inscribed ellipse representing the density profile of this distribution. For the bounding box
where,
The two-dimensional Gaussian distributions of the target and prediction boxes are
Finally, the exponential is used to normalize the Wasserstein distance, and the normalized Wasserstein distance is obtained as follows.
where,
where,
In this section, this study is first evaluated on a series of SSOD benchmark models, and then the effectiveness of each component is verified through extensive ablation experiments.
To ensure a fair comparison, all experiments were conducted using an NVIDIA GeForce GTX 4060 Ti GPU. The model was optimized using the SGD optimizer, with an initial learning rate of 0.01, momentum of 0.937, and weight decay of 0.0005. The training process comprised 300 cycles with a batch size of 16. For exponential moving average (EMA), the momentum parameter was set to 0.999.
3.1.1 Addressing Insufficient Learning of Challenging Samples
To evaluate the impact of ARE on difficult samples, a comparison of detection results between the baseline model and AT-Net on representative challenging samples is presented in Fig. 8. The baseline model exhibited extensive missed detections in regions containing dense spores. In contrast, AT-Net demonstrated significantly improved detection performance in dense spore regions through its hardness perception mechanism. Visual comparison clearly reveals enhanced recognition capability for aggregated spore targets, along with effective reduction of false detections caused by abnormally shaped spores.
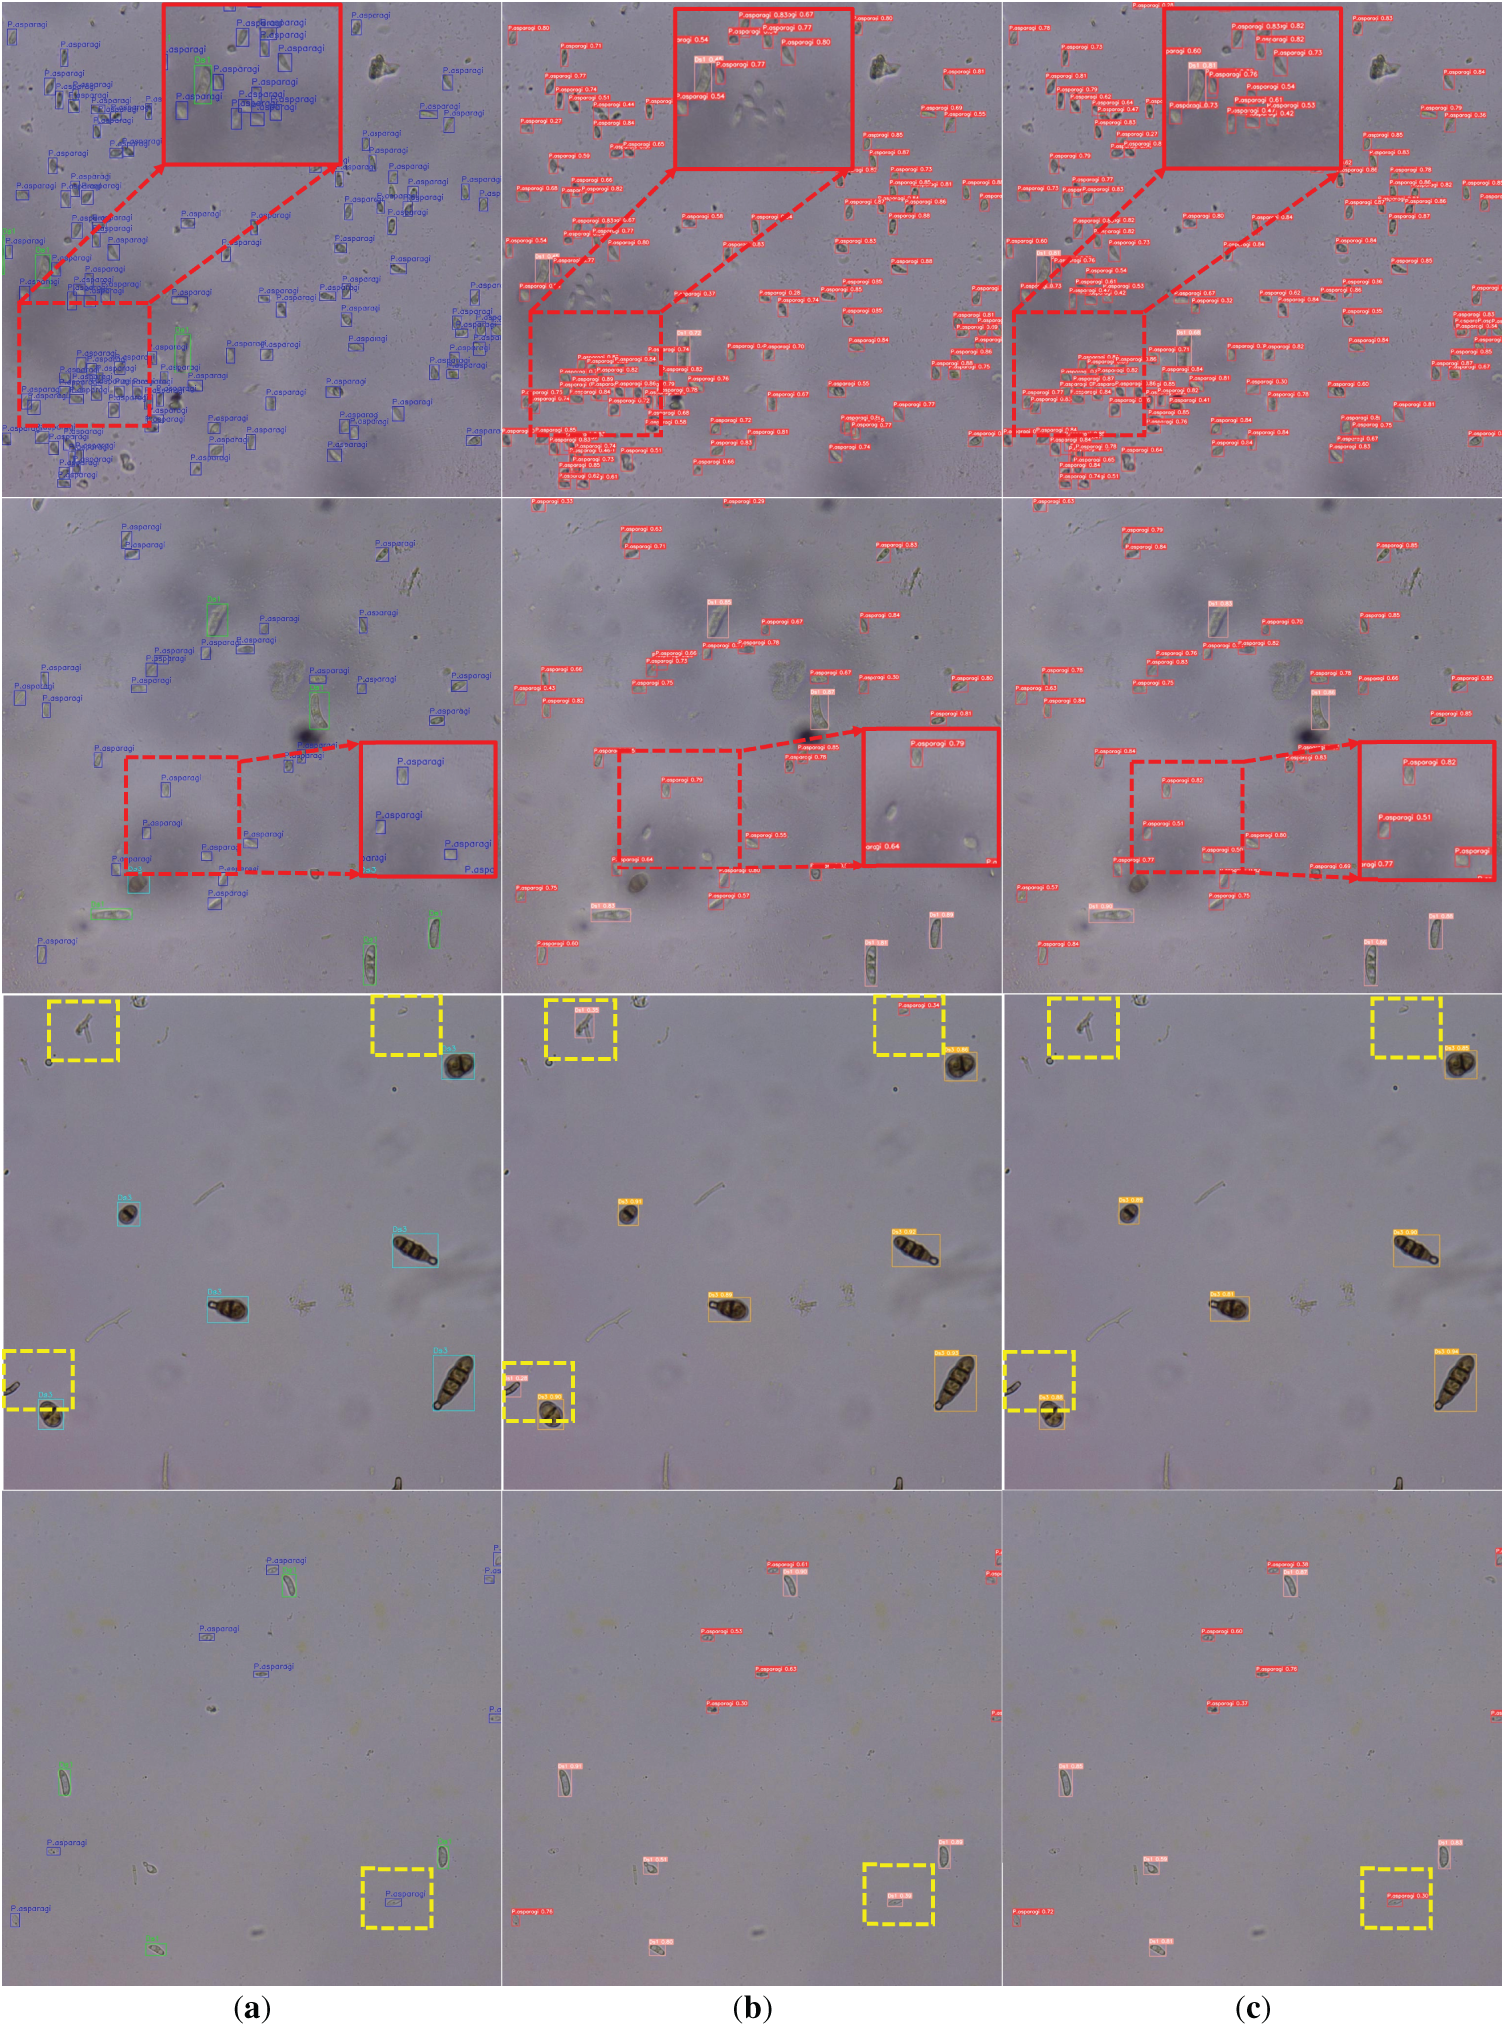
Figure 8: Comparison of recognition effect of difficult areas. (a) Ground truth. (b) Baseline detection results. (c) AT-Net detection results. The red dashed box represents the case of missed detection, and the yellow dashed box represents the case of false detection
Furthermore, the distribution differences between the baseline model and AT-Net across samples with varying confidence levels were analyzed. As illustrated in Fig. 9, the blue region is predominantly concentrated in areas of low confidence and low IoU, suggesting that the baseline model is more likely to generate low-quality detection results (e.g., false or missed detections) under these conditions. AT-Net was observed to substantially reduce such errors. These results confirm the effectiveness of the proposed method in learning from challenging samples, demonstrating its capability to enhance the model’s perception of low-confidence targets.
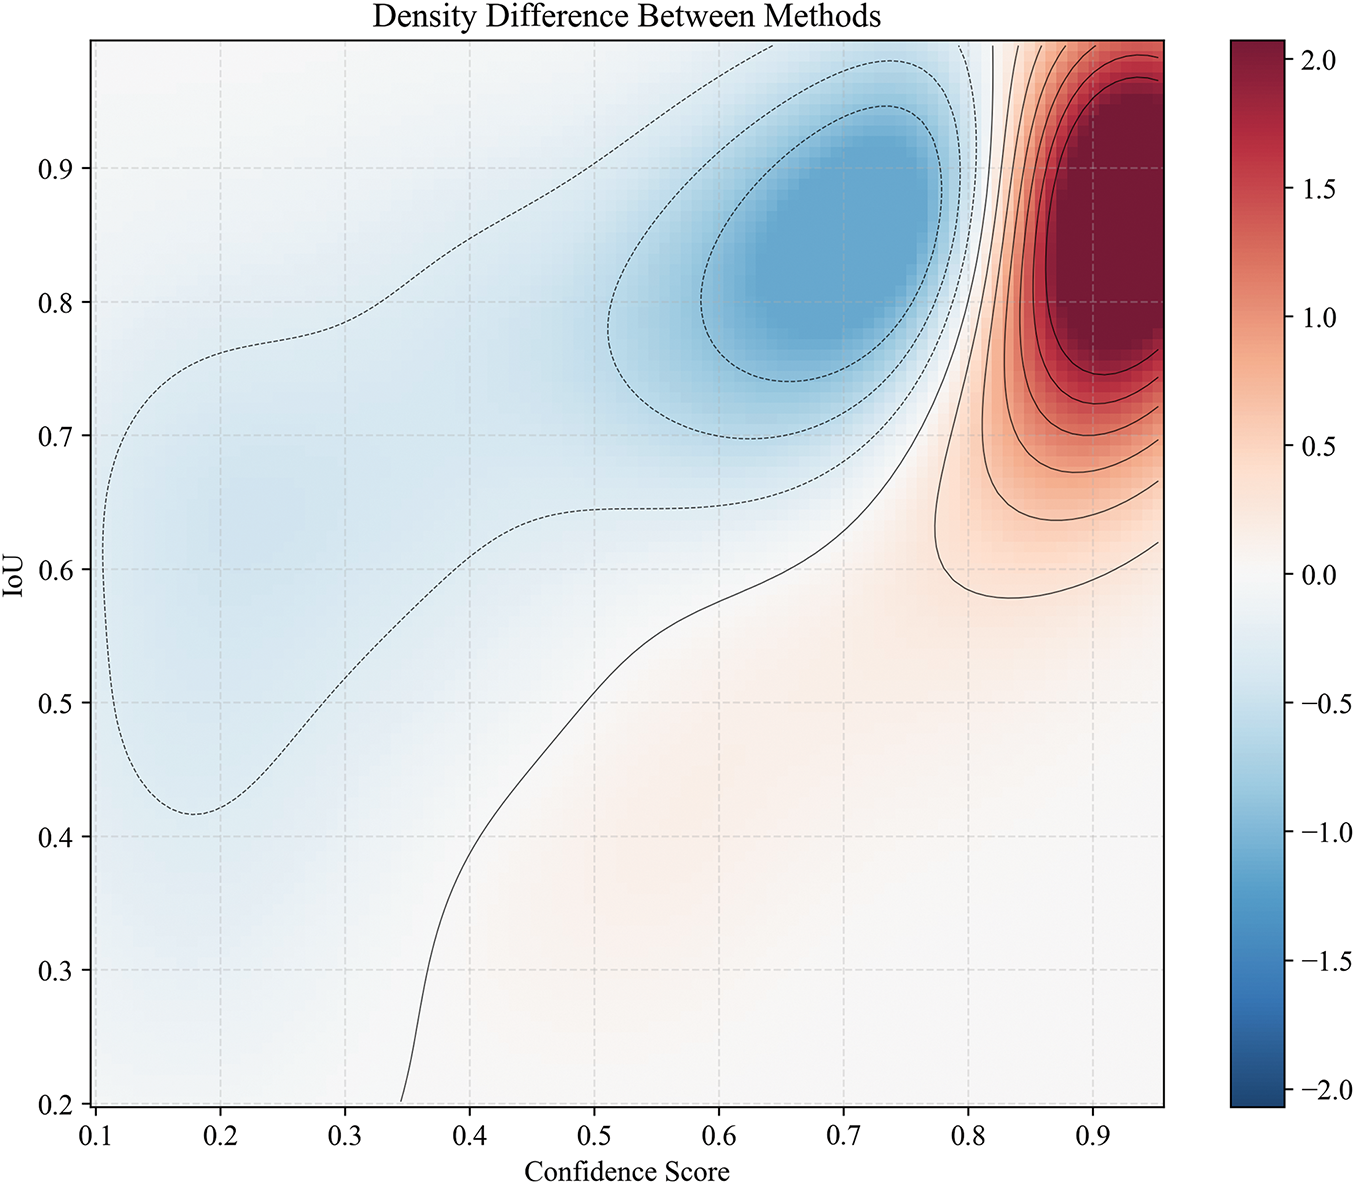
Figure 9: Differences in density distributions for different confidence and IoU scores between baseline and AT-Net. The red area represents the density increment of AT-Net compared to the baseline, and the blue area represents the density reduction
3.1.2 Addressing Pseudo-Label Inconsistency
To verify the effectiveness of the ATG module in the pseudo-label screening process, we compare it with three pseudo-label generation strategies under different fixed thresholds, and the results are shown in Fig. 10. It can be seen from the figure that the strategy with fixed thresholds of 0.6 and 0.7 rapidly introduces a large number of pseudo-labels in the early stage of training, but there are also obvious fluctuations, indicating that there are many low-quality pseudo-labels mistakenly introduced in the screening process, which may lead to training instability. However, although the 0.8 threshold strategy has good stability, the overall pseudo label utilization is low, which limits the learning potential of unlabeled data. In contrast, the proposed ATG method can dynamically adapt to the confidence distribution predicted by the model during the training process, steadily and effectively gradually introduce more high-quality pseudo-labels, improve the utilization efficiency of supervision signals, and show better pseudo-label screening ability and training stability. Furthermore, Fig. 11 shows the evolution trend of the threshold under different labeling proportions calculated by GMM. The results show that the higher the proportion of labeled data, the higher the overall threshold calculated by GMM and the faster the convergence speed, which reflects its good adaptability to the amount of supervision information. At low labeling ratio, ATG can still dynamically adjust the pseudo-label screening strategy, effectively alleviate the problem of insufficient supervision signal, and achieve stable training. On the other hand, Fig. 12 further reveals the superiority of this strategy in selecting the threshold. The threshold of each category gradually increases and tends to be stable with the training iteration, because the detection difficulty of different categories, the convergence speed of sample distribution and the final threshold level are obviously different. This result verifies the effectiveness of the proposed dynamic threshold adjustment strategy in the semi-supervised object detection task.
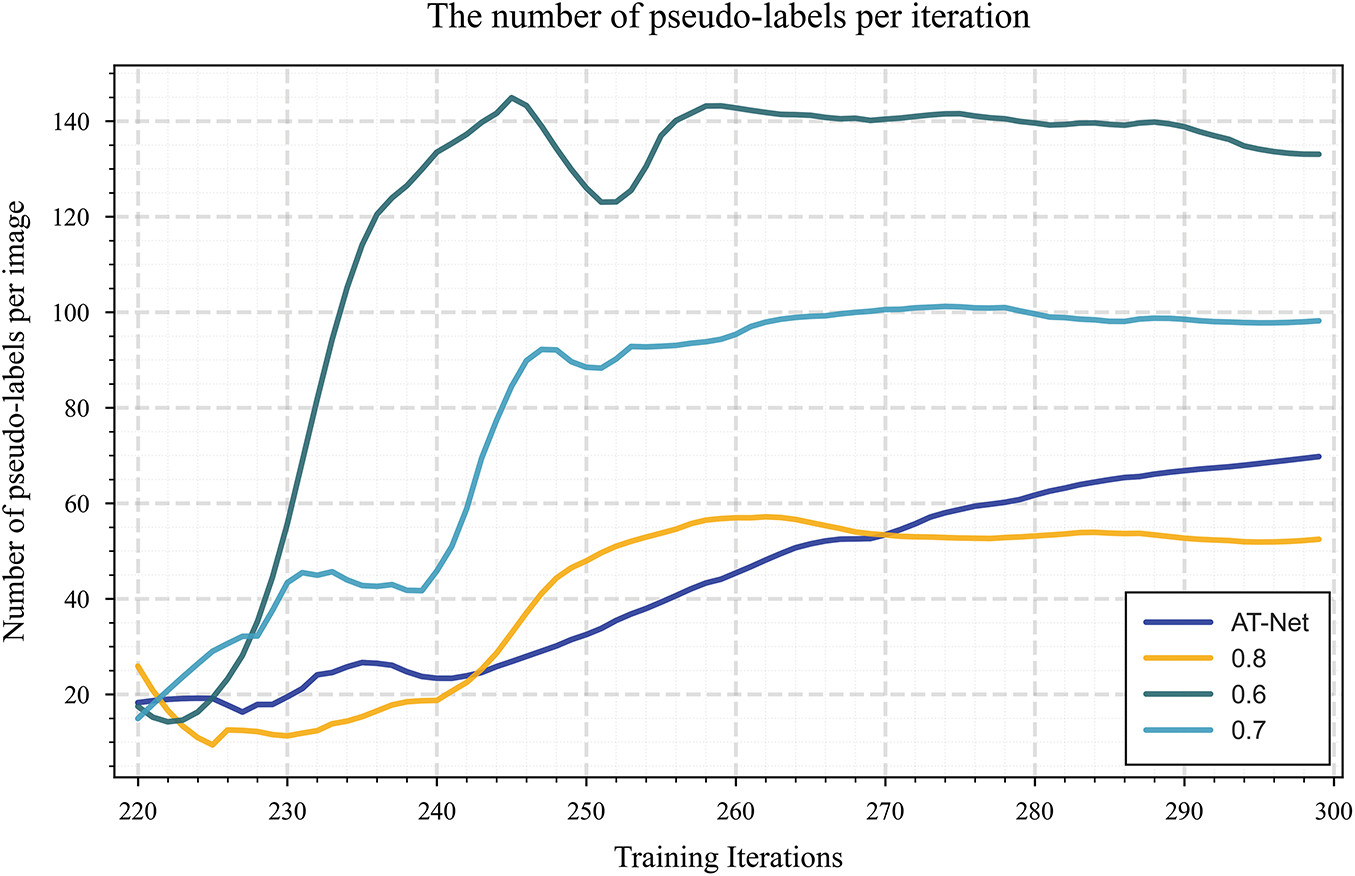
Figure 10: Comparison of the number of pseudo-labels generated in each training round. The horizontal axis represents the number of training iteration rounds, and the vertical axis represents the number of pseudo-labels generated in each round
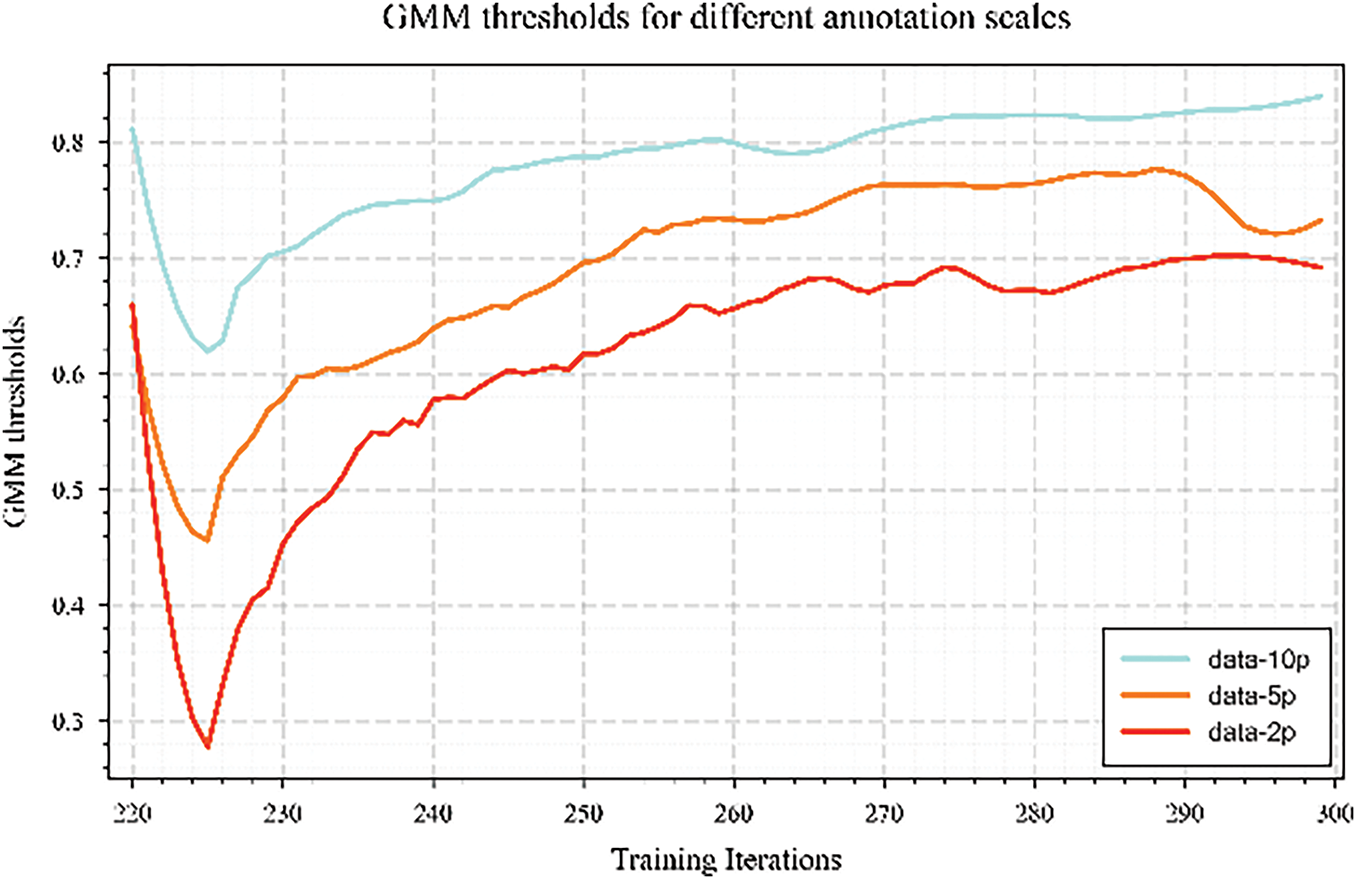
Figure 11: The trend of threshold variation under different labeling ratios
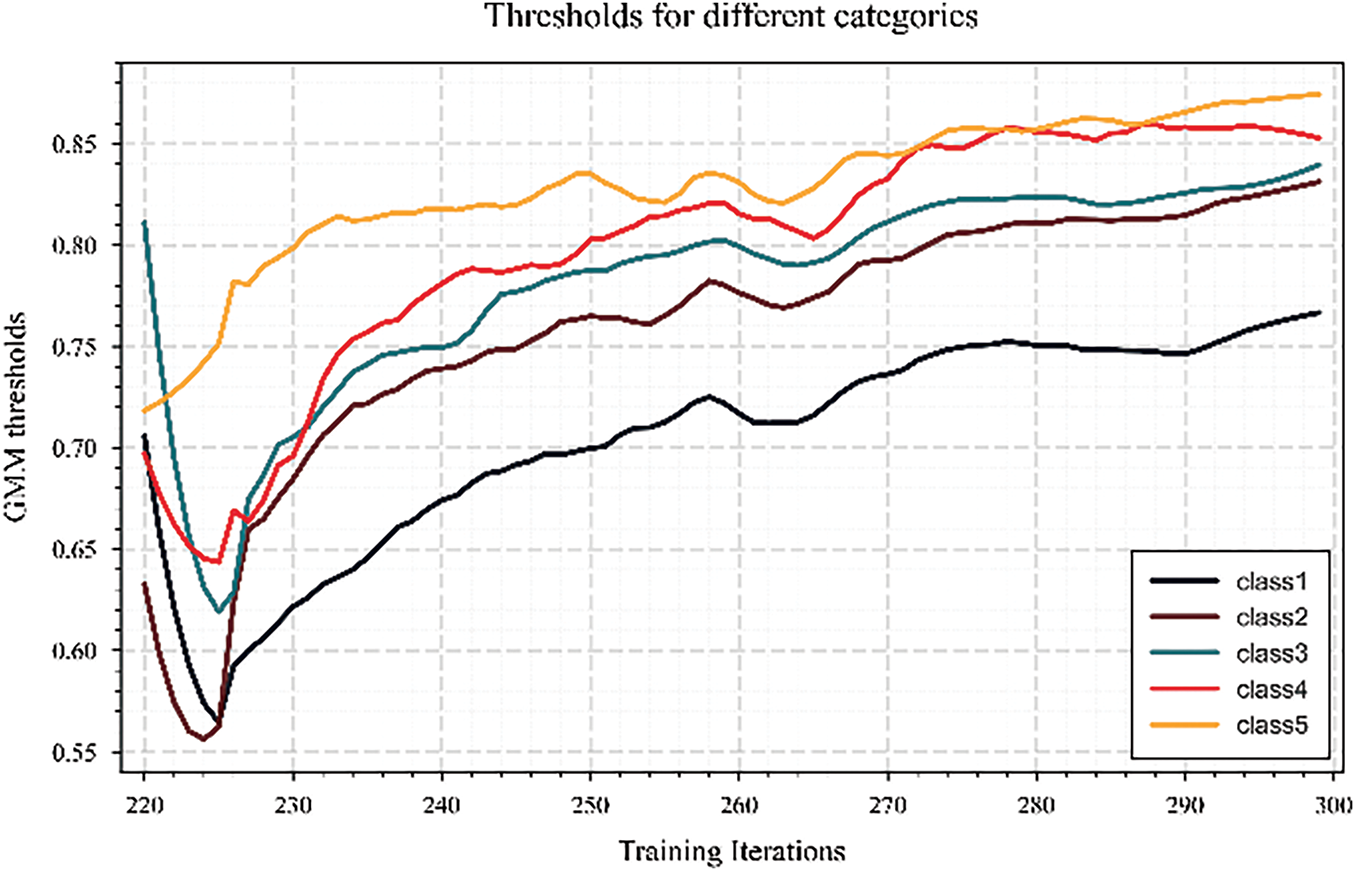
Figure 12: Variation trend of threshold values for different categories
3.1.3 Solving the IoU Instability Problem of Small Targets
The mean average precision (mAP) was evaluated across targets of varying scales, with comparative results detailed in Table 2. The proposed Wasserstein distance metric achieved a 3.6% mAP improvement for small targets (<32 px2) and a 5.9% enhancement for medium targets (32–96 px2) relative to conventional IoU methods, while maintaining comparable performance for large targets (>96 px2). Fig. 13 illustrates the clustered spore detection performance during the inference phase. Compared with the traditional method, our improved strategy performs better in the separation of touching objects, the accuracy of detection boxes and the boundary handling. These findings substantiate the effectiveness of the Wasserstein distance framework in stabilizing detection performance for clustered objects and improving overall measurement reliability.
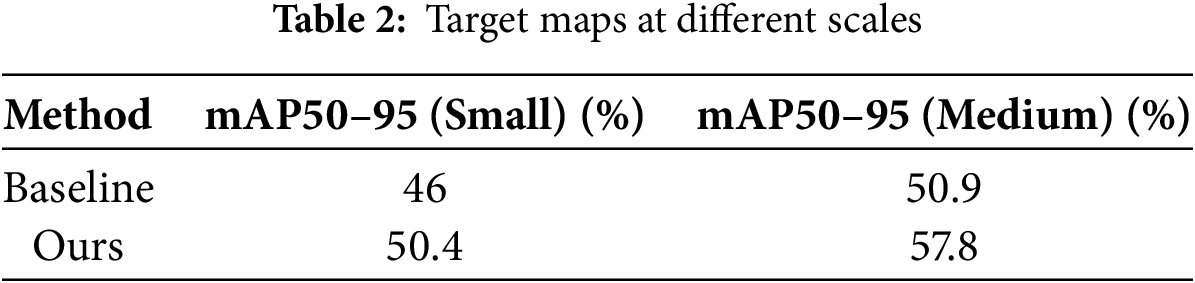
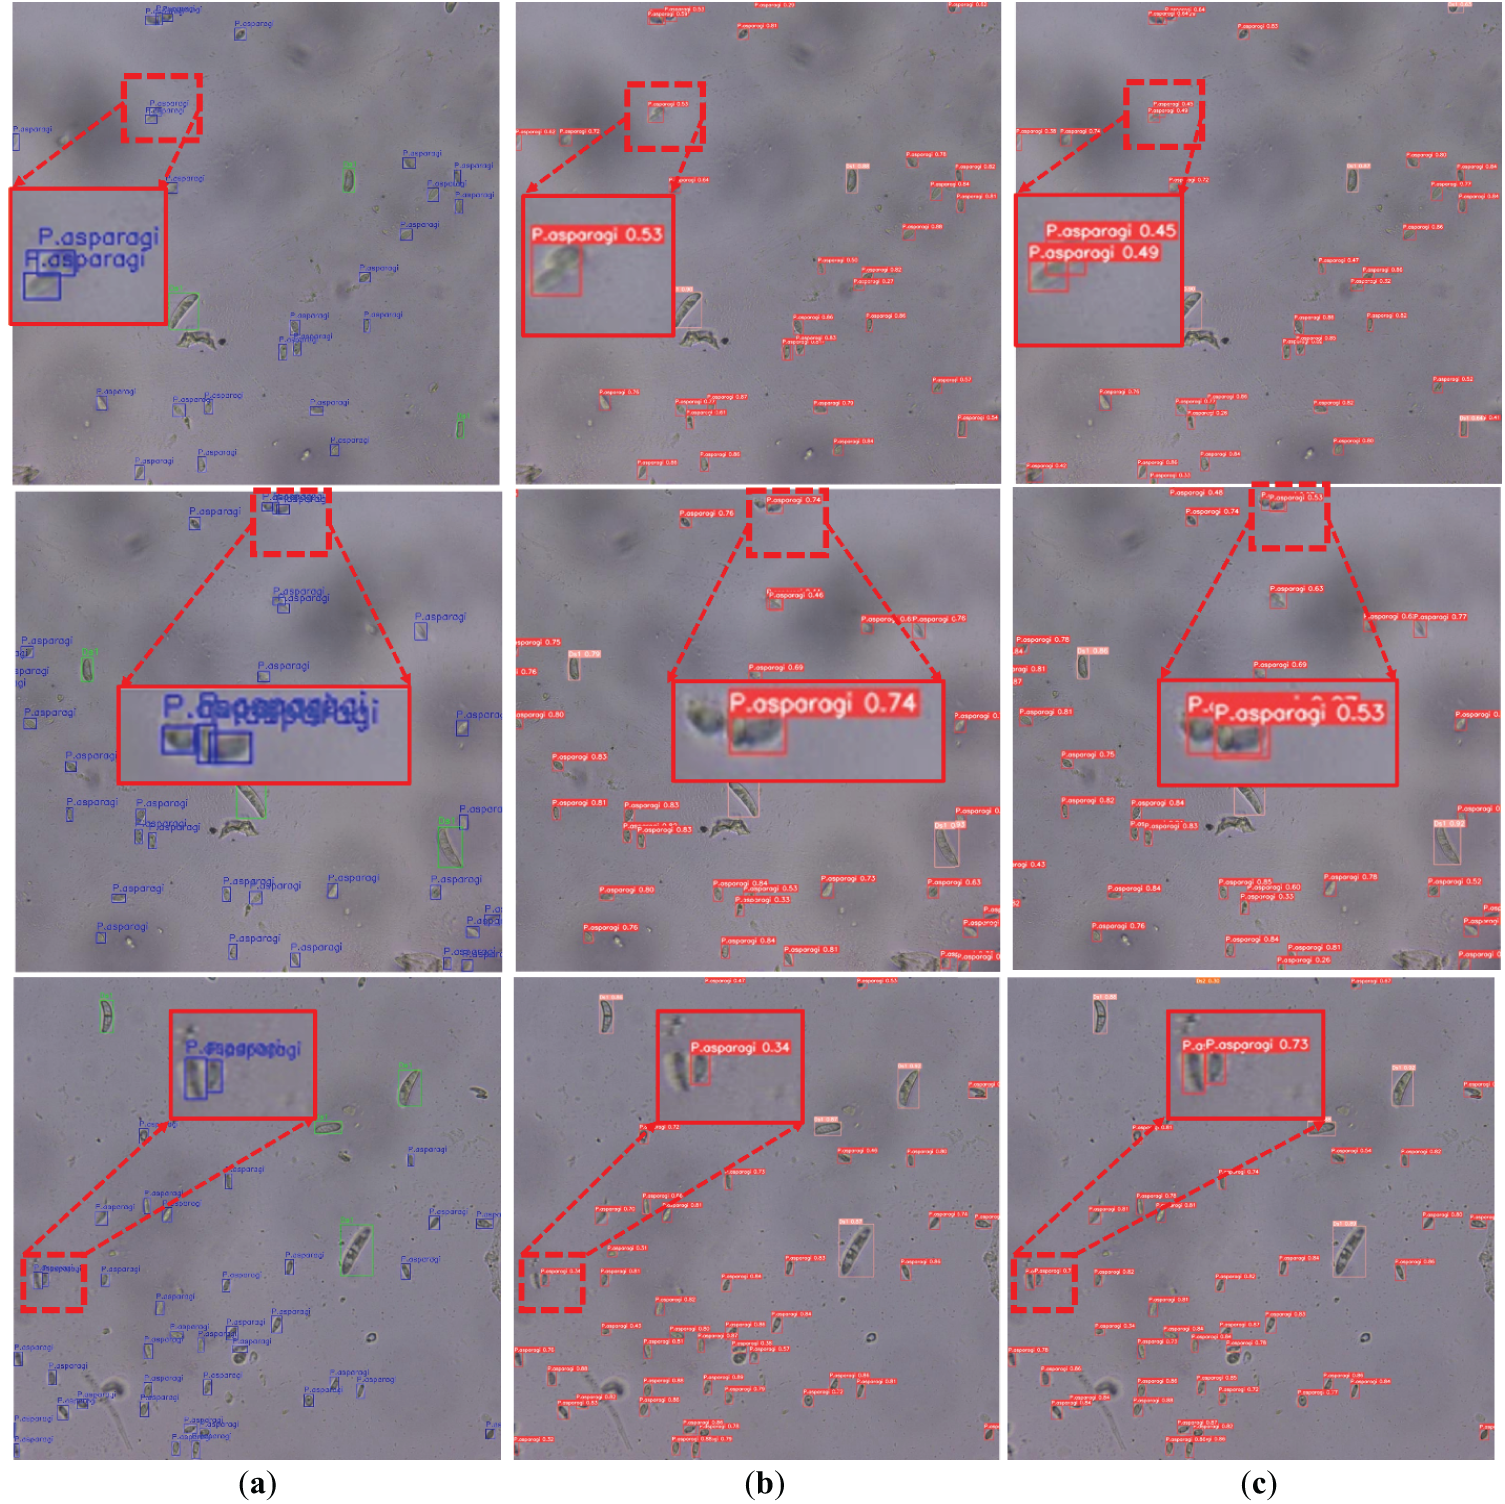
Figure 13: Recognition effect of adherent spores. (a) Ground truth. (b) Baseline detection results. (c) AT-Net detection results
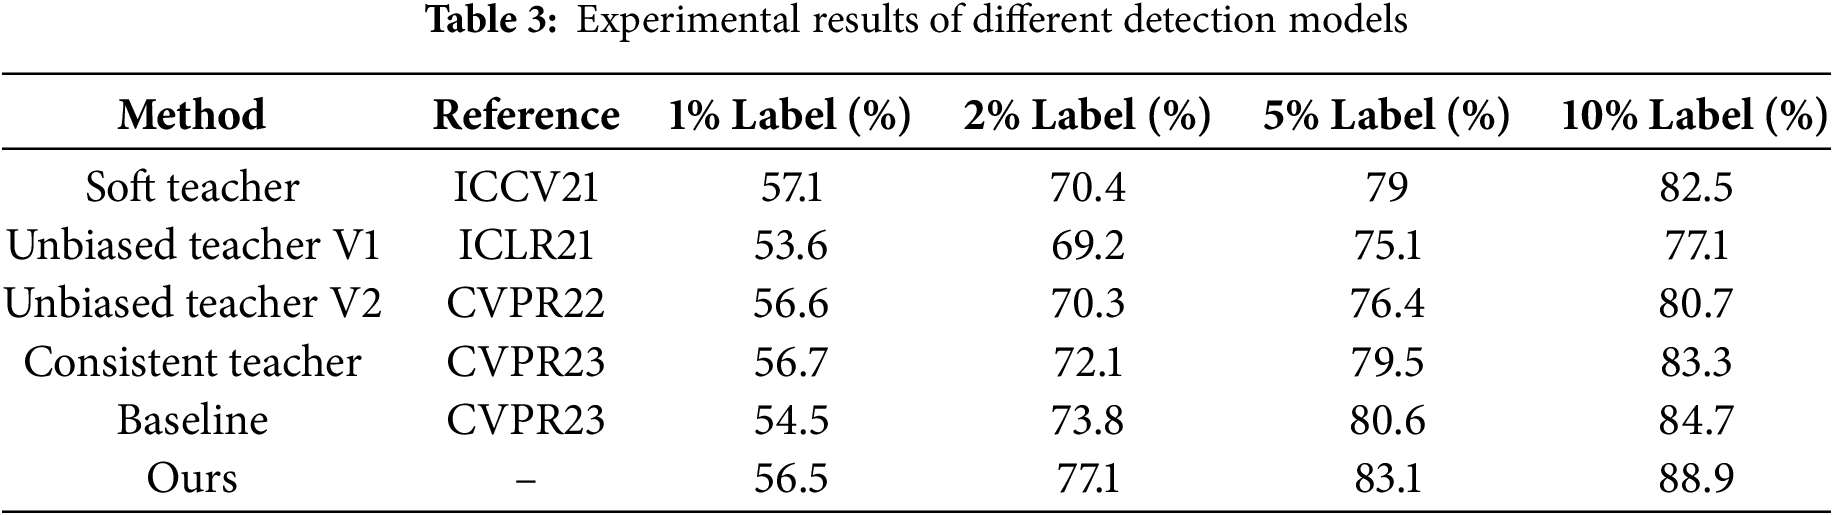
AT-Net was compared with established semi-supervised object detection methods (Soft Teacher, Unbiased Teacher v1, and v2) through systematic evaluation. Table 3 presents the mAP50 comparison across methods trained with 1%, 2%, 5%, and 10% labelled data, demonstrating consistent superiority of the proposed approach. At 10% labelled data, the achieved 88.9% mAP represents significant improvements of 6.4%, 11.8%, and 8.2% over Soft Teacher, Unbiased Teacher-v1, and Unbiased Teacher-v2, respectively, along with a 4.2% increase over the baseline. These results conclusively validate the method’s effectiveness under limited labelled data conditions.
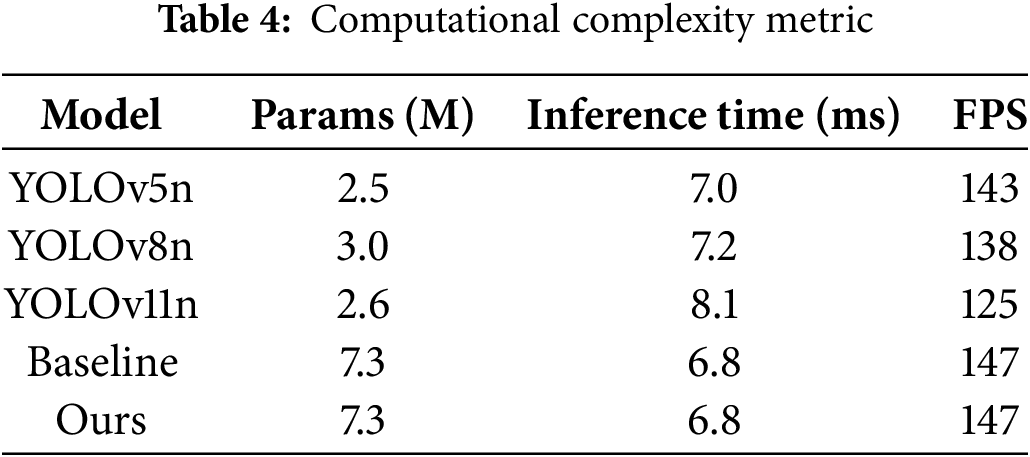
To evaluate the adaptability of the proposed AT-Net in real-world deployment scenarios, we measured its key computational efficiency metrics and compared them with mainstream YOLO algorithms. All tests were conducted on a single NVIDIA RTX 4060Ti GPU with an input image resolution of 640 × 640 and a batch size of 1. As shown in Table 4, since AT-Net does not alter the network architecture, its computational efficiency metrics remain consistent with the baseline, with only a 15% increase in training time. In addition, from the perspective of algorithm design, Table 4 shows that the ARE module only introduces random masking and adversarial perturbations to selected regions during training, which incurs almost no extra computational overhead during inference. The ATG module relies on a simple Gaussian Mixture Model, which adds negligible parameters and computational cost. The use of the Wasserstein distance replaces the conventional IoU loss only in the regression branch, without increasing inference time. Therefore, AT-Net maintains high computational efficiency while enhancing detection performance, making it well-suited for practical deployment on resource-constrained edge devices or integration with spore capture systems.
In order to verify the effectiveness of our method, this study conducted extensive ablation experiments on the research dataset.
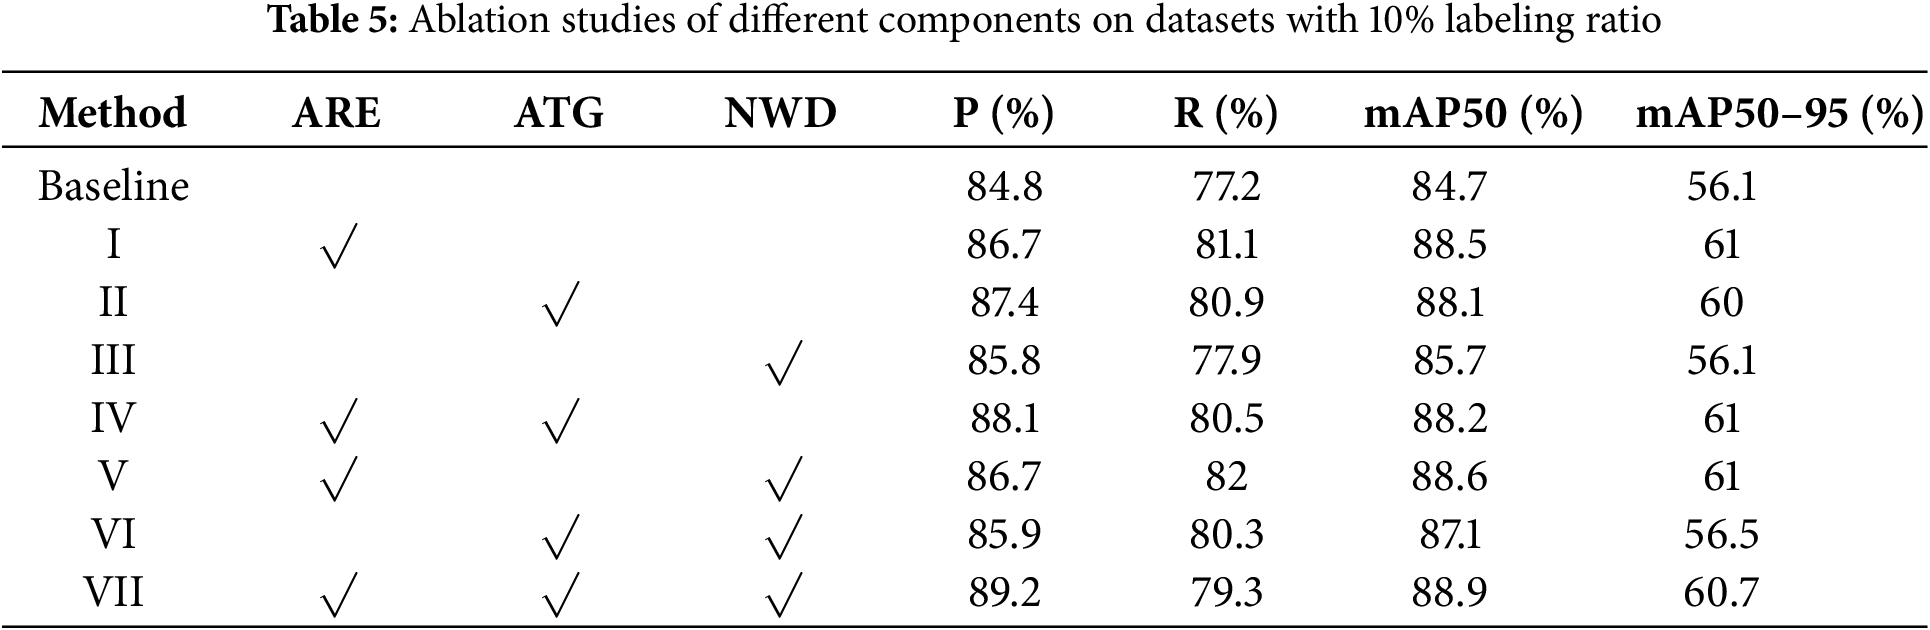
Component effectiveness: To verify the effectiveness of each component of the proposed method, adaptive region enhancement, an adaptive threshold generation module, and the Wasserstein distance were individually integrated into the baseline model to optimize object localization. Their respective impacts on detection performance were evaluated. Furthermore, the combined effect of all three components within the final integrated framework was also assessed.
The experimental results are presented in Table 5. Compared with the baseline method, the introduction of adaptive region enhancement alone effectively improves the model’s learning capability on difficult samples, resulting in a 3.8% increase in mAP50. The adaptive threshold generation module enhances the quality of pseudo-labels, leading to a 3.4% improvement in mAP50. The application of the Wasserstein distance further refines the localization accuracy for small objects, contributing an additional 1% gain in mAP50. From the results of different combinations, any two modules combined outperform each individual module alone, and the full integration of all three modules achieves the best overall performance, with mAP50 improved by 4.2% and mAP50–95 increased by 4.6%, while the recall rate also rises to 79.3%. These results further demonstrate the complementary effects and synergistic benefits of each module at different stages of the detection pipeline.
Adaptive region enhancement: As shown in Table 6, we compared our method with several common data augmentation techniques, including random occlusion (Cutout) and Mixup. The results indicate that the baseline model, without region enhancement, achieves an mAP50 of 84.7%. Incorporating Cutout and Mixup slightly improves performance to 86.2% and 85.9%, respectively, though the gains are limited. In contrast, our proposed method increases the mAP50 to 88.5%, a 3.7% improvement over the baseline, outperforming other augmentation strategies. This demonstrates that our region difficulty-aware enhancement strategy is more effective than traditional random augmentation approaches. Furthermore, we analyzed the impact of different region masking strategies on performance. The best results were obtained when masking high-scoring regions while applying random occlusion to other areas. These findings confirm that our Adaptive Region Enhancement (ARE) method effectively mitigates the limitations of traditional models in handling challenging regions during training. In addition, as shown in Fig. 14, the impact of different region sizes on model performance was evaluated. The best performance was observed when a patch size of 8 × 8 was used, confirming that regions that are either too large or too small may fail to capture sufficient local information.
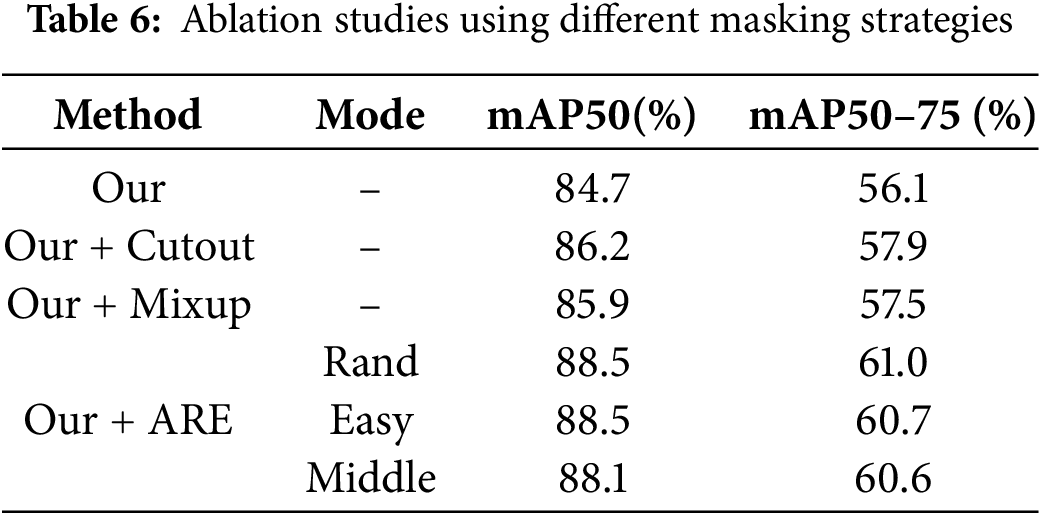

Figure 14: Ablation comparison of different patch sizes
Dynamic thresholding: The impact of the Gaussian Mixture Model (GMM) thresholding strategy on model performance was evaluated. A comparison was conducted between fixed thresholding and the proposed adaptive thresholding method. In the experiment, the lower confidence threshold was fixed at 0.3, while different upper threshold strategies were applied. As illustrated in Fig. 15, the best performance under the fixed threshold setting was achieved at a value of 0.8.
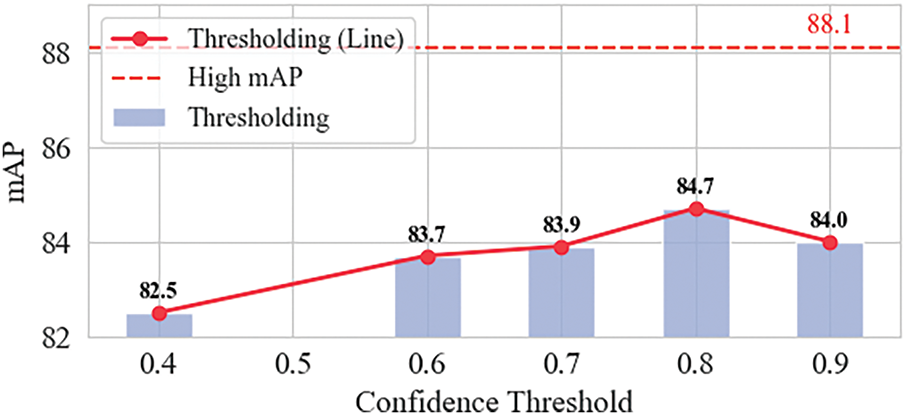
Figure 15: Ablation studies with different confidence thresholds. Each value represents a mAP with different thresholds
In contrast, the GMM-based thresholding strategy not only automatically adapts to varying object classes and training stages—thereby eliminating the need for manual threshold adjustment—but also improves detection accuracy and enhances model stability. Under the condition of only 10% labelled data, the proposed method achieved an mAP of 88.1%, which is 3.4% higher than the best-performing fixed threshold strategy.
Furthermore, as shown in Fig. 16, the adaptive GMM thresholding consistently outperformed the fixed threshold model (0.8) across different proportions of labelled data, further demonstrating its effectiveness and robustness.
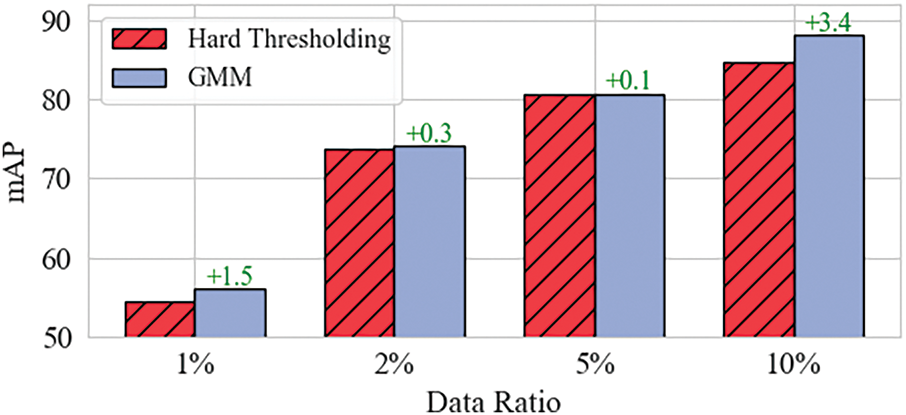
Figure 16: GMM ablation at different labeling ratios. The model is compared to a baseline with a hard threshold of 0.8
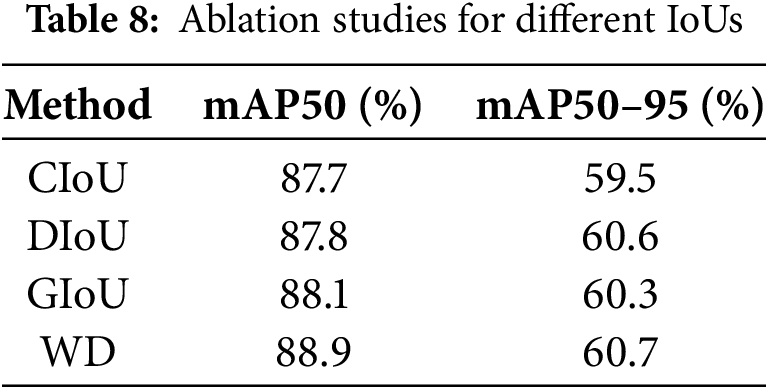
Wasserstein distance optimization: To investigate the effect of different weight settings on model performance, comparative experiments were conducted using various values of the weighting parameter defined in Eq. (14), as summarized in Table 7. The experimental results indicate that the best performance was achieved when the weight was set to 0.6, with an mAP of 85.7%. This setting was found to provide a better balance between localization accuracy and matching quality compared to other parameter configurations. In addition, to further verify the effectiveness of the proposed Wasserstein distance for small-object localization tasks, we conducted comparative experiments with commonly used IoU-based bounding box loss functions. As shown in Fig. 17, the loss curve with Wasserstein distance optimization remains smoother and exhibits less fluctuation throughout the training process, indicating improved training stability. Table 8 further demonstrates that incorporating the Wasserstein distance into IoU calculation enhances the model’s tolerance to minor positional deviations, resulting in more stable regression performance overall. Consequently, the final mAP50 shows a clear improvement compared to other IoU variants, confirming the advantage of this approach for precise small-object detection.
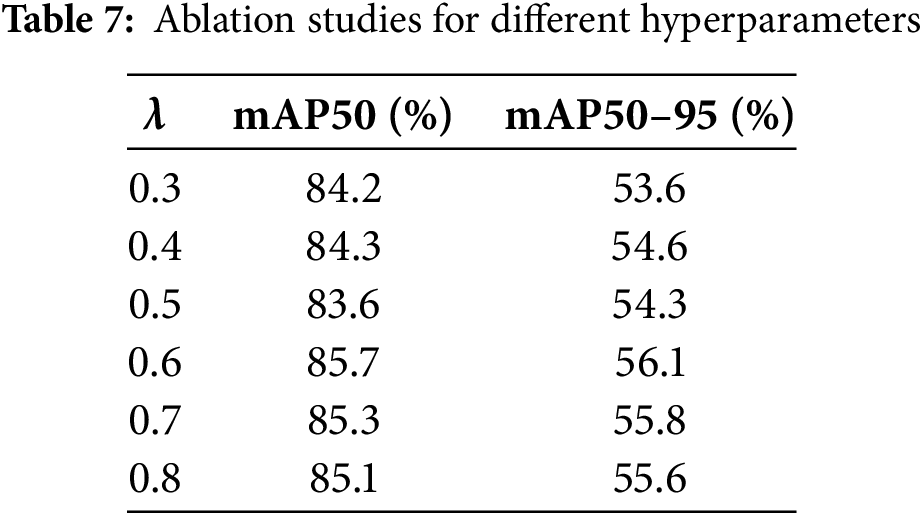

Figure 17: Comparison of bounding box loss for different IoU
In this study, an adaptive semi-supervised learning framework, termed AT-Net, was proposed for the detection of tiny fungal spore targets in complex microscopic environments. The proposed approach was designed to address key challenges in spore detection, including complex backgrounds, noisy pseudo-labels, and unstable localization of small objects. Through the incorporation of a hardness perception mechanism, AT-Net was able to selectively enhance complex regions and improve model adaptability in challenging environments. Simultaneously, the ATG dynamically adjusted the confidence threshold of pseudo-labels, thereby enhancing the reliability of the supervision signal. Furthermore, the Wasserstein distance was utilized to optimize the IoU calculation, allowing more precise localization of tiny targets. Experimental results demonstrated that AT-Net achieved 88.9% mAP50 and 60.7% mAP50–95 on the spore detection task, representing improvements of 4.2% and 4.6%, respectively, over the baseline method, while using only 10% of the labelled data. These findings verify the potential of semi-supervised learning in the early detection of crop diseases, offering an efficient and scalable solution for agricultural disease monitoring while reducing dependence on large-scale annotated datasets and maintaining high detection accuracy.
In future work, we plan to further enhance the AT-Net framework from multiple perspectives. First, although the current hardness-aware mechanism based on multi-dimensional statistical indicators has shown promising results in complex microscopic environments, we intend to incorporate learning-based difficulty estimation and dynamic modeling strategies to better align hardness assessment with the actual training complexity. Second, for the pseudo-label filtering stage, we will explore integrating complementary techniques such as uncertainty modeling, confidence calibration, and teacher-guided learning to improve the stability and robustness of pseudo-label selection. Third, considering the practical demands of agricultural production for detection efficiency and deploy ability, we aim to further optimize the model architecture and inference speed to enable efficient deployment on resource-constrained edge devices, supporting real-time monitoring and early warning in field environments. Additionally, we plan to extend the framework to broader crop disease detection scenarios and combine it with multimodal techniques to enhance the model’s generalization capability and practical value across crops and varying environments, ultimately promoting a sustainable and scalable solution for intelligent agricultural disease monitoring.
Acknowledgement: Not applicable.
Funding Statement: This research is supported by Development of asparagus price database based on agricultural big data (381724).
Author Contributions: The authors confirm contribution to the paper as follows: study conception and design: Jiajun Sun, Chao Zhang; data collection: Jiajun Sun, Shunshun Ji; analysis and interpretation of results: Jiajun Sun, Shunshun Ji, Chao Zhang; draft manuscript preparation: Jiajun Sun; supervision and funding acquisition: Chao Zhang. All authors reviewed the results and approved the final version of the manuscript.
Availability of Data and Materials: The data that support the findings of this study are available from the Corresponding Author, Chao Zhang, upon reasonable request.
Ethics Approval: Not applicable.
Conflicts of Interest: The authors declare no conflicts of interest to report regarding the present study.
References
1. Yang YQ, Sun Q, Li CM, Chen HF, Zhao F, Huang JH, et al. Biological characteristics and genetic diversity of Phomopsis asparagi, causal agent of asparagus stem blight. Plant Dis. 2020;104(11):2898–904. doi:10.1094/PDIS-07-19-1484-RE. [Google Scholar] [PubMed] [CrossRef]
2. Lei Y, Yao Z, He D. Automatic detection and counting of urediniospores of Puccinia striiformis f. sp. tritici using spore traps and image processing. Sci Rep. 2018;8(1):13647. doi:10.1038/s41598-018-31899-0. [Google Scholar] [PubMed] [CrossRef]
3. Qi L, Jiang Y, Li Z, Ma X, Zheng Z, Wang W. Automatic detection and counting method for spores of rice blast based on micro image processing. Trans Chinese Soc Agric Eng. 2015;31(12):186–93. (In Chinese). doi:10.11975/j.issn.1002-6819.2015.12.025. [Google Scholar] [CrossRef]
4. Zhao Y, Liu S, Hu Z, Bai Y, Shen C, Shi X. Separate degree based Otsu and signed similarity driven level set for segmenting and counting anthrax spores. Comput Electron Agric. 2020;169(1):105230. doi:10.1016/j.compag.2020.105230. [Google Scholar] [CrossRef]
5. Peng J, He H, Zhang D. YOLOv8s-DroneNet: small object detection algorithm based on feature selection and ISIoU. Comput Mater Contin. 2025;84(3):5047–61. doi:10.32604/cmc.2025.066368. [Google Scholar] [CrossRef]
6. Liu Z, Zhu H. RC2DNet: real-time cable defect detection network based on small object feature extraction. Comput Mater Contin. 2025;85(1):681–94. doi:10.32604/cmc.2025.064191. [Google Scholar] [CrossRef]
7. Li M, Li X, Zhao M. A method for small target detection and counting of the end of drill pipes based on the improved YOLO11n. Comput Mater Contin. 2025;85(1):1917–36. doi:10.32604/cmc.2025.067382. [Google Scholar] [CrossRef]
8. Gao C, He B, Guo W, Qu Y, Wang Q, Dong W. SCS-YOLO: a real-time detection model for agricultural diseases—a case study of wheat fusarium head blight. Comput Electron Agric. 2025;238(12):110794. doi:10.1016/j.compag.2025.110794. [Google Scholar] [CrossRef]
9. Li K, Zhu X, Qiao C, Zhang L, Gao W, Wang Y. The gray mold spore detection of cucumber based on microscopic image and deep learning. Plant Phenomics. 2023;5(21):0011. doi:10.34133/plantphenomics.0011. [Google Scholar] [PubMed] [CrossRef]
10. Cheng T, Zhang D, Gu C, Zhou XG, Qiao H, Guo W, et al. YOLO-CG-HS: a lightweight spore detection method for wheat airborne fungal pathogens. Comput Electron Agric. 2024;227:109544. doi:10.1016/j.compag.2024.109544. [Google Scholar] [CrossRef]
11. Farooq MU, Ullah Z, Gwak J. Residual attention based uncertainty-guided mean teacher model for semi-supervised breast masses segmentation in 2D ultrasonography. Comput Med Imaging Graph. 2023;104(5):102173. doi:10.1016/j.compmedimag.2022.102173. [Google Scholar] [PubMed] [CrossRef]
12. Qiao C, Han M, Gao W, Gao W, Li K, Zhu X, et al. Quantitative detection of cucumber downy mildew spores at multi-scale based on faster-NAM-YOLO. Trans Chinese Soc Agric Mach. 2023;54(2):288–99. (In Chinese). doi:10.1016/j.inpa.2024.05.002. [Google Scholar] [CrossRef]
13. Chen C, Dong S, Tian Y, Cao K, Liu L, Guo Y. Temporal self-ensembling teacher for semi-supervised object detection. IEEE Trans Multimed. 2022;24:3679–92. doi:10.1109/TMM.2021.3105807. [Google Scholar] [CrossRef]
14. Zhong Z, Zheng L, Kang G, Li S, Yang Y. Random erasing data augmentation. Proc AAAI Conf Artif Intell. 2020;34(07):13001–8. doi:10.1609/aaai.v34i07.7000. [Google Scholar] [CrossRef]
15. Seo JW, Jung HG, Lee SW. Self-augmentation: generalizing deep networks to unseen classes for few-shot learning. Neural Netw. 2021;138(12):140–9. doi:10.1016/j.neunet.2021.02.007. [Google Scholar] [PubMed] [CrossRef]
16. Yun S, Han D, Chun S, Oh SJ, Yoo Y, Choe J. CutMix: regularization strategy to train strong classifiers with localizable features. In: Proceedings of the 2019 IEEE/CVF International Conference on Computer Vision (ICCV); 2019 Oct 27–Nov 2; Seoul, Republic of Korea. doi:10.1109/iccv.2019.00612. [Google Scholar] [CrossRef]
17. Xu L, Li Y, Li J. Improved regularization of convolutional neural networks with point mask. arXiv:1708.04552. 2017. [Google Scholar]
18. Chen B, Chen W, Yang S, Xuan Y, Song J, Xie D, et al. Label matching semi-supervised object detection. In: Proceedings of the 2022 IEEE/CVF Conference on Computer Vision and Pattern Recognition (CVPR); 2022 Jun 18–24; New Orleans, LA, USA. doi:10.1109/CVPR52688.2022.01398. [Google Scholar] [CrossRef]
19. Xu M, Zhang Z, Hu H, Wang J, Wang L, Wei F, et al. End-to-end semi-supervised object detection with soft teacher. In: Proceedings of the 2021 IEEE/CVF International Conference on Computer Vision (ICCV); 2021 Oct 10–17; Montreal, QC, Canada. doi:10.1109/ICCV48922.2021.00305. [Google Scholar] [CrossRef]
20. Tang P, Ramaiah C, Wang Y, Xu R, Xiong C. Proposal learning for semi-supervised object detection. In: Proceedings of the 2021 IEEE Winter Conference on Applications of Computer Vision (WACV); 2021 Jan 3–8; Waikoloa, HI, USA. doi:10.1109/WACV48630.2021.00234. [Google Scholar] [CrossRef]
21. Liu YC, Ma CY, Kira Z. Unbiased teacher v2: semi-supervised object detection for anchor-free and anchor-based detectors. In: Proceedings of the 2022 IEEE/CVF Conference on Computer Vision and Pattern Recognition (CVPR); 2022 Jun 18–24; New Orleans, LA, USA. doi:10.1109/CVPR52688.2022.00959. [Google Scholar] [CrossRef]
22. Liu YC, Ma CY, He Z, Kuo CW, Chen K, Zhang P, et al. Unbiased teacher for semi-supervised object detection. arXiv:2102.09480. 2021. [Google Scholar]
23. Li X, Li C, Ghamisi P, Hong D. FlexiMo: a flexible remote sensing foundation model. arXiv:2503.23844. 2025. [Google Scholar]
24. Li C, Hong D, Zhang B, Li Y, Camps-Valls G, Zhu XX, et al. UrbanSAM: learning invariance-inspired adapters for segment anything models in urban construction. arXiv:2502.15199. 2025. [Google Scholar]
25. Xu B, Chen M, Guan W, Hu L. Efficient teacher: semi-supervised object detection for YOLOv5. arXiv:2302.07577. 2023. [Google Scholar]
26. Yoo J, Ahn N, Sohn KA. Rethinking data augmentation for image super-resolution: a comprehensive analysis and a new strategy. In: Proceedings of the 2020 IEEE/CVF Conference on Computer Vision and Pattern Recognition (CVPR); 2020 Jun 13–19; Seattle, WA, USA. doi:10.1109/cvpr42600.2020.00840. [Google Scholar] [CrossRef]
27. Jiang S, Wu H, Chen J, Zhang Q, Qin J. pH-net: semi-supervised breast lesion segmentation via patch-wise hardness. In: Proceedings of the 2024 IEEE/CVF Conference on Computer Vision and Pattern Recognition (CVPR); 2024 Jun 16–22; Seattle, WA, USA. doi:10.1109/CVPR52733.2024.01085. [Google Scholar] [CrossRef]
28. Xu S, Zheng S, Xu W, Xu R, Wang C, Zhang J, et al. HCF-net: hierarchical context fusion network for infrared small object detection. In: Proceedings of the 2024 IEEE International Conference on Multimedia and Expo (ICME); 2024 Jul 15–19; Niagara Falls, ON, Canada. doi:10.1109/ICME57554.2024.10687431. [Google Scholar] [CrossRef]
29. Zhang Z, Li Y, Cao Y, Wang Y, Guo X, Hao X. MTSC-Net: a semi-supervised counting network for estimating the number of slash pine new shoots. Plant Phenomics. 2024;6(3):0228. doi:10.34133/plantphenomics.0228. [Google Scholar] [PubMed] [CrossRef]
30. Wang X, Yang X, Zhang S, Li Y, Feng L, Fang S, et al. Consistent-teacher: towards reducing inconsistent pseudo-targets in semi-supervised object detection. In: Proceedings of the 2023 IEEE/CVF Conference on Computer Vision and Pattern Recognition (CVPR); 2023 Jun 17–24; Vancouver, BC, Canada. doi:10.1109/CVPR52729.2023.00316. [Google Scholar] [CrossRef]
31. Wang J, Chang X, Yang W, Yu L. A normalized Gaussian Wasserstein distance for tiny object detection. arXiv:2110.13389. 2021. [Google Scholar]
Cite This Article
 Copyright © 2026 The Author(s). Published by Tech Science Press.
This work is licensed under a Creative Commons Attribution 4.0 International License , which permits unrestricted use, distribution, and reproduction in any medium, provided the original work is properly cited.
 Downloads
 Citation Tools