
 Submit a Paper
 Propose a Special lssue
 Open Access
ARTICLE

Atomistic Simulation Study on Spall Failure and Damage Evolution in Single-Crystalline Ta at Elevated Temperatures
1 Sichuan Provincial Engineering Research Center of Thermoelectric Materials and Devices, Chengdu, 610041, China
2 Postdoctor Innovation and Practice Base, Chengdu Polytechnic, Chengdu, 610041, China
3 School of Civil Engineering, Changsha University of Science and Technology, Changsha, 410114, China
* Corresponding Author: Yuzhu Guo. Email:
Computers, Materials & Continua 2026, 86(2), 1-26. https://doi.org/10.32604/cmc.2025.071624
Received 08 August 2025; Accepted 17 October 2025; Issue published 09 December 2025
 View Full Text
 Download PDF
Abstract
This investigation utilizes non-equilibrium molecular dynamics (NEMD) simulations to explore shock-induced spallation in single-crystal tantalum across shock velocities of 0.75–4 km/s and initial temperatures from 300 to 2000 K. Two spallation modes emerge: classical spallation for shock velocity below 1.5 km/s, with solid-state reversible Body-Centered Cubic (BCC) to Face-Centered Cubic (FCC) or Hexagonal Close-Packed (HCP) phase transformations and discrete void nucleation-coalescence; micro-spallation for shock velocity above 3.0 km/s, featuring complete shock-induced melting and fragmentation, with a transitional regime (2.0–2.5 km/s) of partial melting. Spall strength decreases monotonically with temperature due to thermal softening. Elevated temperatures delay void nucleation but increase density, expanding spall regions and enhancing structural disorder with reduced BCC recovery. For micro-spallation, melting exacerbates damage, causing smaller voids and intensified atomic ejection, which increases with temperature. Free surface velocity profiles indicate damage: in classical spallation, first drop marks nucleation, and pullback signals spall layers. In micro-spallation, the first drop is irrelevant, but remains valid. Temperature delays pullback signals and weakens Hugoniot Elastic Limit. This study clarifies temperature-shock coupling in Ta spallation, aiding failure prediction in high-temperature shock environments.Keywords
Tantalum (Ta) is a critical engineering material valued for its exceptional properties—including high ductility, density, melting point, thermal conductivity, and impact resistance—making it indispensable in shock protection and extreme environment applications [1]. A major obstacle to its application is shock-induced spallation—a dynamic fracture phenomenon triggered by the propagation and interaction of shock waves during hypervelocity impacts, which ultimately dictates material failure in events such as explosive detonations or high-velocity collisions [2]. Comprehending spallation requires analyzing the coupled processes of rapid elastic–plastic deformation and irreversible thermal rise. Notably, the temperature increase during shock loading may induce solid–liquid phase transitions (i.e., shock-induced melting) before fracture, which defines an exceptional regime termed “micro-spallation” [3,4]. Unlike classical spallation (characterized by periodic surface velocity oscillations), micro-spallation involves microscale ejecta at the free surface and irregular velocity profiles. Thus, temperature effects are pivotal to a comprehensive understanding of shock-induced spallation in Ta.
Experimental investigations have laid foundational insights into temperature-dependent spallation. Kanel et al. [5] observed that preheated Al and Mg exhibit a sharp drop in spall strength near their melting points, with strength nearly vanishing at the liquidus. In contrast, single-crystal and polycrystalline Al retain high spall strength even under shock-induced melting, highlighting material-specific behavior [6,7]. For Ta, Ashitkov et al. [8] reported a 6-fold difference in spall strength between solid (27 GPa) and liquid (4.4 GPa) phases at strain rates ~109 s−1, while Hahn et al. [9] confirmed that in both phases, temperature effect causes spall strength decrease, fitting a power-law in the solid state. However, inconsistencies across metals (e.g., Sn and Zn retain strength near their melting points, while Li exhibits a 3-fold drop in strength) reveal no universal temperature-dependent law, emphasizing the need for mechanistic clarity [10].
Wang et al. [11] proposed a dynamic fracture toughness prediction model for nickel-based alloys, with NEMD molecular multi-scale numerical simulations with machine learning; the optimized artificial neural network (ANN) model achieved high accuracy, providing insights for nickel-based alloy design. Building on relevant alloy spallation studies, Yang et al. [12] investigated the atomic-scale interplay between impact spallation and micro-emission from single-crystal (SC) to nanocrystalline (NC) Al. These studies highlight that molecular dynamics (MD) simulations complement experimental approaches by capturing atomic-scale processes inaccessible in laboratory settings. Focusing on tantalum (Ta), Hahn et al. [13] linked orientation-dependent spall strength in single-crystal Ta to twin volume fraction using NEMD simulations, while Wang et al. [14] emphasized that in Ta bicrystals grain boundary was one of the causes which effects on deformation and dynamic failure. Tang et al. [15] and Tramontina et al. [16] further clarified how shock loading paths and duration modulate dislocation dynamics and flow stress in nanocrystalline Ta. Despite these advances, molecular dynamics investigations into temperature-dependent spallation behavior remain limited: Li et al. [17] explored 3C-SiC at only two discrete temperatures, and studies on Ta have focused on spallation at ~5000 K but under a specific strain rate. These efforts lack systematic analysis of temperature effects across a range of shock intensities, creating critical gaps in understanding how initial temperature couples with shock velocity to regulate spallation mechanisms.
Although previous research has yielded valuable insights into temperature-dependent shock-induced spallation in metals, studies focusing on single-crystalline Ta remain constrained by three critical gaps: (1) Hahn et al. [13] and Wang et al. [14] only investigated spallation behavior at near-ambient temperatures (~300 K) and lacked analysis of how elevated temperatures (≥1000 K) modulate damage evolution; (2) Li et al. [17] explored temperature effects on shock-induced failure in ceramic materials but only at two discrete temperatures, while Ta-specific studies [8] focused on extreme temperatures (~5000 K) under fixed strain rates, failing to capture the continuous temperature-shock velocity coupling across engineering-relevant ranges; (3) prior molecular dynamics (MD) works on Ta [15,16] emphasized shock loading paths or dislocation dynamics but did not establish quantitative links between initial temperature, spallation mode transitions, and free-surface velocity signatures—key for validating experimental observations.
Given the inherent complexity of shock-induced spallation, where temperature, shock intensity, and microstructural evolution are mutually coupled and the practical demand for Ta-based components in high-temperature shock environments, a systematic investigation into how initial temperature influences Ta’s spall response under varying shock intensities remains necessary to fill these gaps. To address this, the present study employs non-equilibrium molecular dynamics (NEMD) simulations to comprehensively examine the effect of initial temperature on the shock response of single-crystalline Ta. The simulations span a broad, engineering-relevant parameter space: shock velocities of 0.75–4.0 km/s (covering micro-meteoroid impacts to explosive detonations) and initial temperatures of 300–2000 K (matching typical extreme service conditions of Ta). The core objectives of this work are threefold: (1) characterize the structural and dynamic features distinguishing classical spallation, transitional partial-melting, and micro-spallation regimes in Ta; (2) quantify the temperature-dependent plastic deformation mechanisms and their correlation with spall strength degradation; (3) establish regime-specific relationships between free-surface velocity profiles and underlying damage mechanisms to enable experimental inference of spall modes.
2 Simulation Framework and Methodological Approach
2.1 Model Setup and Configuration
All molecular dynamics simulations in this work were conducted using LAMMPS [18]. This EAM potential is validated for the present shock simulations using the study’s original data [19]: At Up = 1.0 km/s and T0 = 300 K, the simulated shock pressure is 77.28 GPa (Table 1), which deviates by only 2.9% from the experimental value (79.67 GPa). Additionally, it reproduces Ta’s BCC-FCC phase transition pressure (~130 GPa), consistent with in situ XRD data (~128 GPa) from [20], confirming its ability to capture Ta’s mechanical and phase behaviors under shock loading.
The computational cell consisted of a single-crystal body-centered cubic (bcc) lattice, measuring 40 × 40 × 300 = unit cells. The unit cell axes are aligned with the x-, y-, and z-directions, corresponding to physical dimensions of approximately 132, 132, and 990 Å, respectively. The [100], [010], and [001] crystallographic orientations were aligned with the x-, y-, and z-axes. Shock compression was applied along the [001] axis. The model contained roughly two million atoms. To mitigate boundary artifacts, free surface to avoid artificial wave reflections that would distort shock propagation along the z-direction, X/Y-directions: Periodic boundaries to simulate infinite planar shock loading, consistent with the large-scale Ta components in engineering scenarios, as shown in Fig. 1.
Figure 1: Schematic diagram of the simulation mode, BCC structure
Before initiating shock loading, the system was equilibrated in the NPT ensemble. At the same time, fully periodic boundaries at T0 for 50 ps were configuration, ensuring negligible residual stress. Following equilibration, NEMD simulations were processed. A virtual piston technique was conducted to simulate impact condition, the periodic boundary condition along the z-axis was substituted with a “shrink-wrap” boundary. A planar shock front was induced by means of a flat, infinite-mass reflective wall translated along the z-axis. This arrangement effectively established uniaxial strain conditions. For clarity, the surface of the target in contact with the wall is termed the rear surface, whereas the opposing surface is designated as the free surface. The wall was set to move at a constant velocity V0, and atoms in direct contact with the wall were constrained to move at the same velocity.
To get a steady shock impact, the shock event lasted 12 ps. The removal initiated the release of a rarefaction wave from the rear surface, which propagated toward the free surface. Upon interaction with the free surface, the shock wave reflected as a counter-propagating rarefaction wave. If the shock amplitude was sufficiently high, the intersection of these two release waves generated spall failure. By adjusting V0, different shock intensities were obtained. This methodology is consistent with previously validated approaches for simulating shock-induced spallation [17,21].
The parameter ranges are selected for engineering relevance: (1) Shock velocities (0.75–4.0 km/s) cover typical extreme scenarios for Ta components—1–3 km/s and 3–5 km/s; (2) Initial temperatures (300–2000 K) match Ta’s service environments, including nuclear reactor components (800–1200 K) and hypersonic vehicle heat shields (1500–2000 K), ensuring the study’s findings are applicable to practical failure prediction.
The virial stress was determined according to the following formulation [22]
here, α and β are Cartesian components;
The pressure (P) was calculated using Eq. (3) [9]
Temperature was evaluated following the energy partition law in [9]
In Eq. (4), v denotes the velocity components of atom i; kb represents Boltzmann’s constant; m represents atomic mass, in this study Ta is 180.95 u. Z-axis is the shock direction, the local center-of-mass velocity in each bin must be subtracted during temperature calculation. Eq. (4) was reformulated into a two-dimensional expression, in order to minimize errors caused by the binned center-of-mass, as shown as Eq. (5) [17]
Binning analysis was then employed to monitor spatially resolved and statistical physical quantities during the impact simulation. From the binning analysis, mass density, particle velocity, pressure during the simulation could be recorded [24]. Each bin had a thickness equal to twice the lattice constant (6.6 Å). OVITO software [25] was used for visualization, incorporating adaptive common neighbor analysis (ACNA) [26], the dislocation extraction algorithm (DXA) [27], surface mesh construction [28], and coordination analysis to characterize spallation behavior under impact duration. The molten phase was analysis via radial distribution functions (RDFs) [29].
3.1 Impact-Induced Spallation Response
During the impact, as the piston moves, a compressive stress wave propagates through the specimen. Upon arriving at the model free surface, this wave undergoes reflection and interacts with the unloading wave, which is generated by the removal of the piston subsequent to shock loading. This interaction gives rise to a tensile zone within the material [2]. Spallation takes place when the maximum tensile stress in this zone exceeds a critical threshold. The shock data of tantalum (Ta) at different loading velocities and temperatures are listed in Table 1, encompasses velocity, stress, and strain rate.
Two techniques are applied to evaluate spall strength: direct and indirect approaches. In molecular dynamics simulations, binning analysis is used to obtain stress–time histories along shock direction. The maximum tensile stress during spallation, defined in Eq. (6) [30], yields the direct spall strength. As given in Eq. (7) [17], which calculated by free-surface velocity change, the indirect spall strength could be got. via Eq. (8) [2], the bulk sound speed Cb could be calculated. Superscripts “d” and “i” refer to values from the direct and indirect methods, respectively. The strain rate during impact simulation is calculated from Eq. (9) [17] using the free-surface velocity. To better illustration both approaches, shock speed Up = 2.0 km/s as an example, as shown in Fig. 2.

Figure 2: (a) Pressure profile at the onset of spallation; (b) Schematic of free surface profile (Up = 2.0 km/s)
In Eqs. (6)–(9), ρ0 represents the initial density; Z represents the coordinate along shock direction; t represents time;
In Fig. 3, temperature effect are analyzed at Up = 1.0 km/s and t = 12 ps. Up = 1.0 km/s is intentional to eliminate the interference of shock velocity and exclusively highlight the effect of initial temperature on atomic structure and shock wave propagation. The model structure change and atom velocity are shown. The shock front—defined as the location where the particle velocity decreases to less than 95% of the shock velocity—is indicated by red dashed lines [29]. As shown in Fig. 3a, the width of this front gradually decreases with increasing shock velocity and disappears entirely when the velocity surpasses 2.5 km/s. This effect results from stronger plastic wave perturbations at higher shock speeds, which produce pronounced discontinuities in the velocity distribution. Fig. 3b illustrates that the compression wave travels along the z-axis, leading to substantial densification of the sample and partial transformation of the BCC lattice into FCC, HCP, and amorphous arrangements. Temperature increase from 300 to 2000 K, a larger fraction of atoms undergo structural phase changes (Fig. 3c,d). The emergence of HCP and disordered phases reflects defect formation associated with plastic deformation [32]. Consequently, after shock wave passing a plastically deformed zone appears with dislocations and stacking faults, which also findings from earlier investigations [33].

Figure 3: (a) Shock profiles under various impact velocities. (b) Shock wave characterization under Up = 1 km/s, T0 = 300 K. (c) Shock wave characterization under Up = 1 km/s, T0 = 1000 K. (d) Shock wave characterization under Up = 1 km/s, T0 = 2000 K. Atomic configurations are distinguished via Adaptive Common Neighbor Analysis (ACNA): blue = BCC, red = HCP, green = FCC, white = disordered phase
The free-surface velocity, one of the fundamental parameter in experimental investigations of shock-induced spallation, offering crucial information about the dynamic response of materials. Fig. 4 presents the velocity profiles of tantalum subjected to different shock intensities and initial temperatures. The compression wave reaches the free surface, shock velocity rises abruptly from 0, remains steady for one short duration, and then gradually declines. For Up = 3.0 km/s, this decline reaches a first minimum, followed by a notable “jump-up”, which referred to so called pull-back signal. This signal marks the initiation of spall fracture [2]. Subsequent oscillations in velocity are attributed to multiple reflections of compression waves and their interactions within the spall zone. As illustrated in Fig. 4, the pull-back effect is pronounced for impact velocities between 0.75 and 2.5 km/s, but progressively weakens at higher velocities. At Up = 4.0 km/s, the pull-back feature nearly disappears due to shock-induced melting, which results in micro-spallation, aligning with prior research observations [34].
Figure 4: Temporal evolution of free surface velocity under varying shock loading conditions and initial temperatures: (a) 300 K, (b) 1000 K, and (c) 2000 K
To examine how the initial temperature affects free-surface velocity, profiles from 1.0 to 3.0 km/s are compared across various starting temperatures, as shown in Fig. 5. The Hugoniot Elastic Limit (HEL), which represents yield strength under uniaxial compressive strain—marks the point below which the material deforms elastically, and is indicated by black arrows in Fig. 5a. Due to thermal softening, both the magnitude and clarity of the HEL decrease as the initial temperature rises [17]. Increasing shock velocity further attenuates the HEL signal, promoting earlier elastic deformation. This tendency is presumably attributed to the diminished separation of the elastic precursor from the plastic wave under conditions of elevated initial temperatures and higher shock velocities—a phenomenon that has also been observed in metallic materials like aluminum [29].
Figure 5: Free surface profiles under various loading scenarios from 300 to 2000 K: (a) Up = 1.0 km/s, (b) Up = 2.0 km/s, and (c) Up = 3.0 km/s
Initial temperature also impacts the onset of the pull-back signal. As shown in Fig. 5b,c, higher starting temperatures delay this onset, with the delay becoming more pronounced at greater shock velocities. At Up = 1.0 km/s, the timing difference between 300 and 2000 K is approximately 0.3 ps, whereas at Up = 3.0 km/s it increases about 4 ps. These results indicate that the influence of initial temperature on spallation timing intensifies with increasing shock velocity.
These findings address a key gap in prior single-crystalline Ta research by defining a three-regime spallation framework—a refinement of the two-regime models reported in [8,13]. Leveraging the study’s existing pressure profiles, free-surface velocity curves, and radial distribution function (RDF) signatures, we distinguish three distinct modes: classical spallation Up ≤ 1.5 km/s, solid-state with retained BCC long-range order, a previously unreported transitional partial-melting regime 2.0 ≤ Up ≤ 2.5 km/s, characterized by RDF dual peaks and mixed solid-liquid phases, and micro-spallation Up ≥ 3.0 km/s, complete melting with featureless RDF. Consistent with thermal softening, spall strength decreases monotonically with temperature: as shown in Table 1, at Up = 1.0 km/s, direct spall strength reduces from 19.60 (300 K) to 15.49 GPa (2000 K), extending the temperature range of existing experimental observations [8] to engineering-relevant conditions.
3.2 Microstructural Damage Evolution under Shock
Based on the material response during spallation, two primary regimes are generally recognized: classical spallation and micro-spallation [2]. In the classical mode, the substance remains solid but fractures into separate fragments. Under shock loading, temperature rise is a prominent effect and is closely tied to the shock velocity Up. When Up reaches materials limitation, shock induced temperature rise may cause material partial or complete melting. It may also caused micro-spallation [29,30]. In this study, the radial distribution function (RDF) is employed to distinguish between these spallation regimes, as it is a reliable indicator of structural phase transitions and melting phenomena [29]. The RDF describes the likelihood of locating an atom at a distance r from a reference atom at r = 0. In crystalline solids, RDF curves display sharp, regularly spaced peaks due to long-range order, whereas in liquids, only short-range order persists, producing broader and less intense peaks [21]. As shown in Fig. 6, RDFs were evaluated for all simulation configurations at 0, 8, and 16 ps, which represent shock initial, shock compressed and shock released. Furthermore, atomic arrangements at different times for shock velocities from 0.75 to 4.0 km/s were examined using adaptive common neighbor analysis (ACNA), with shown in Fig. 7.
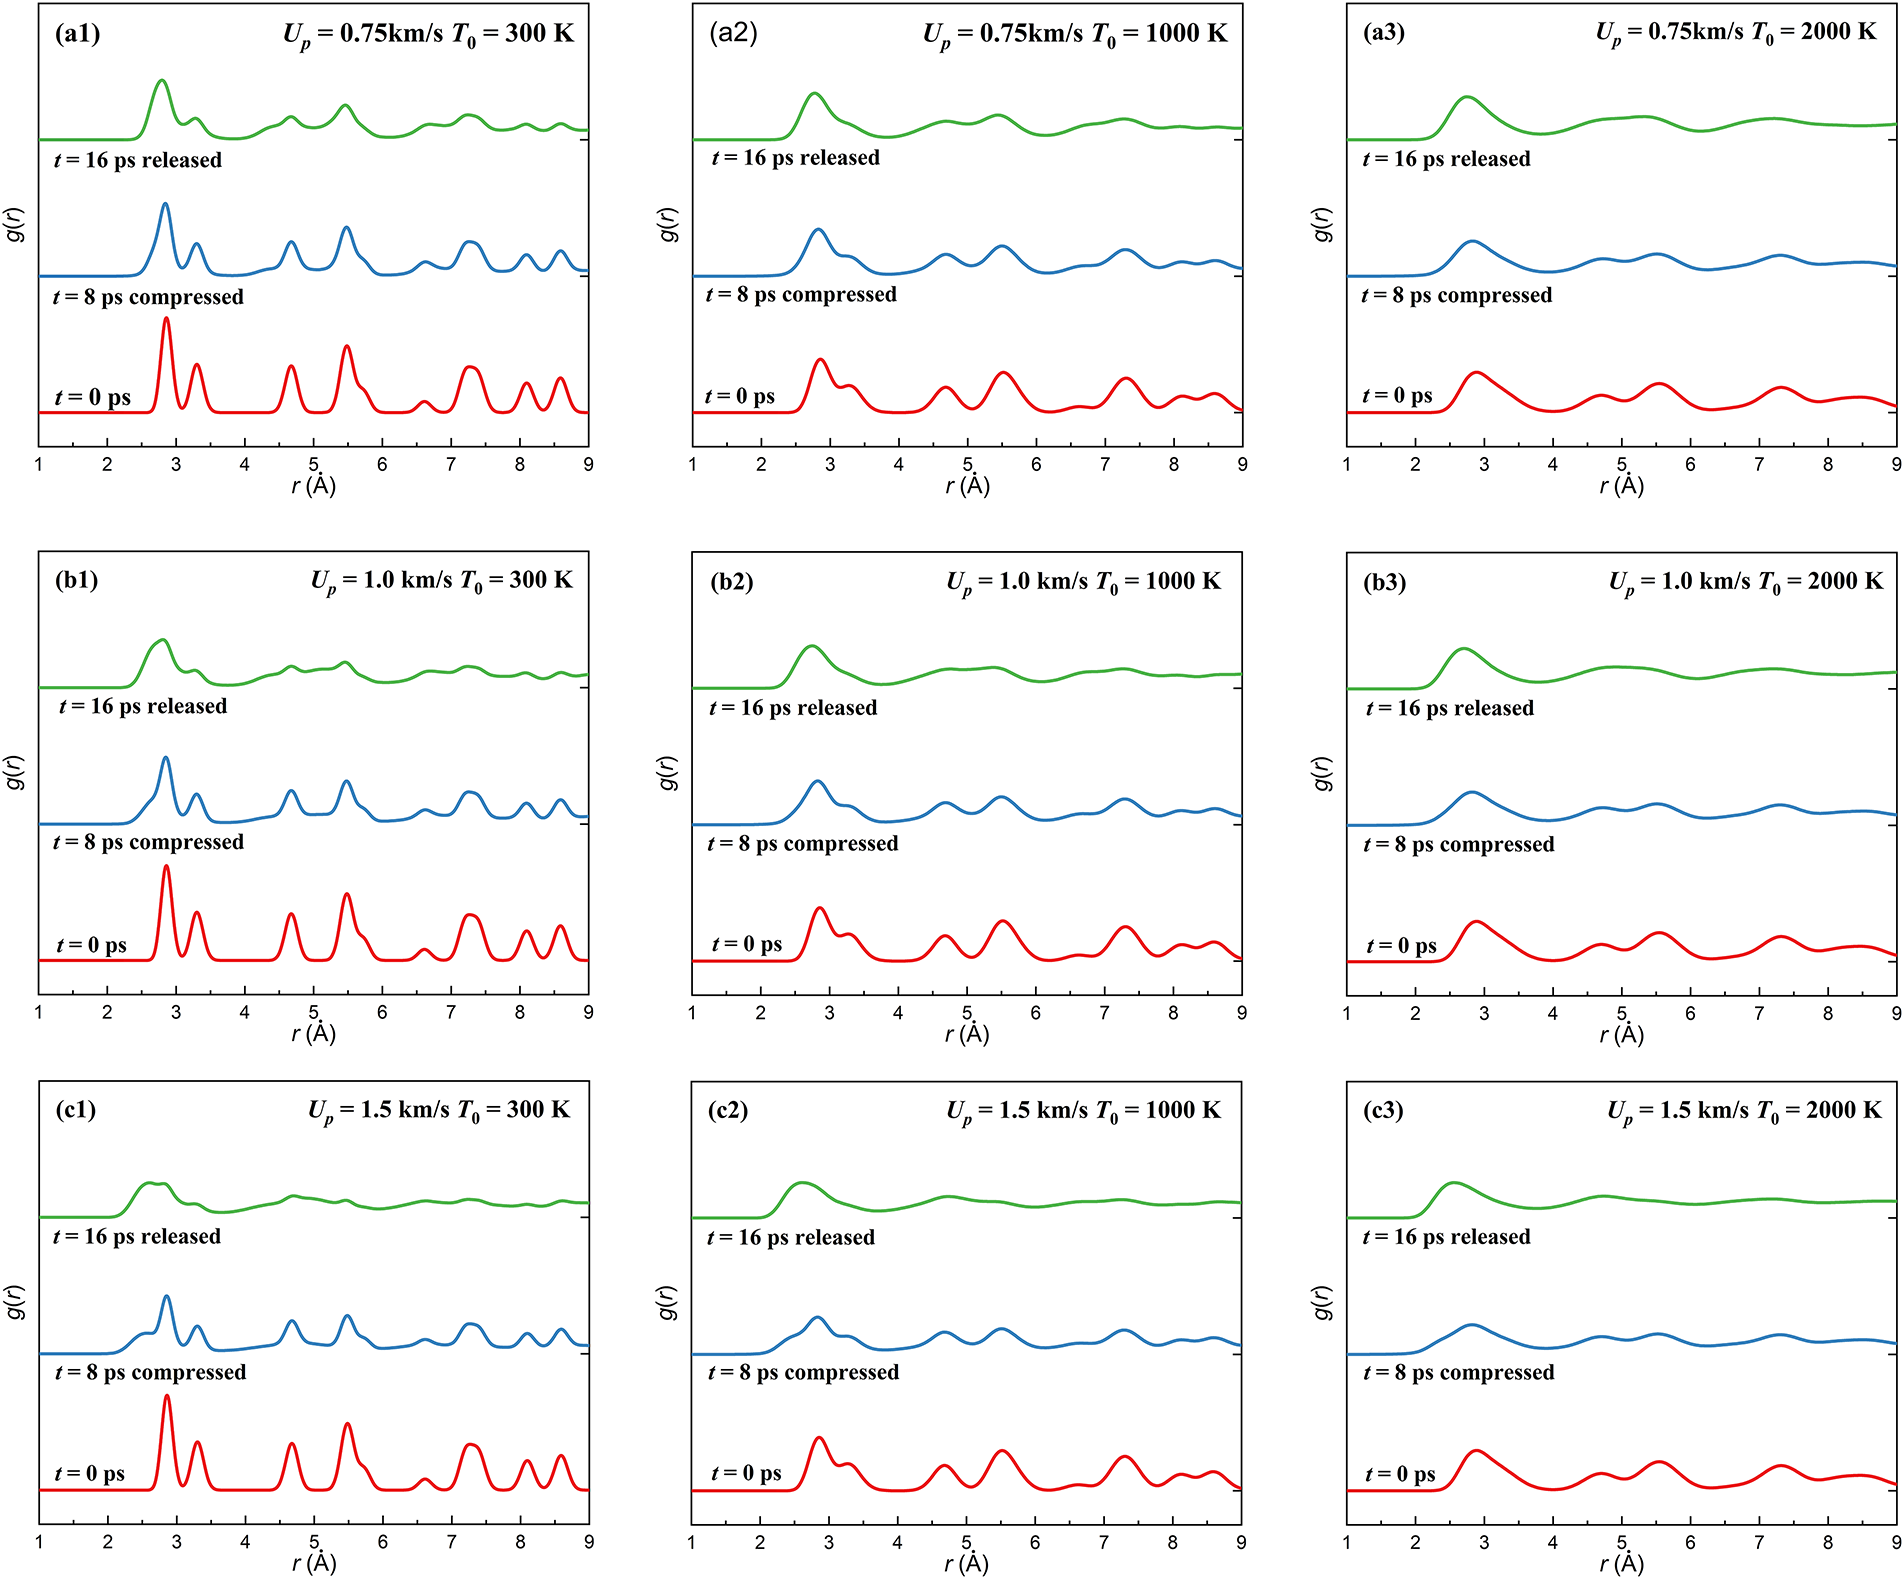

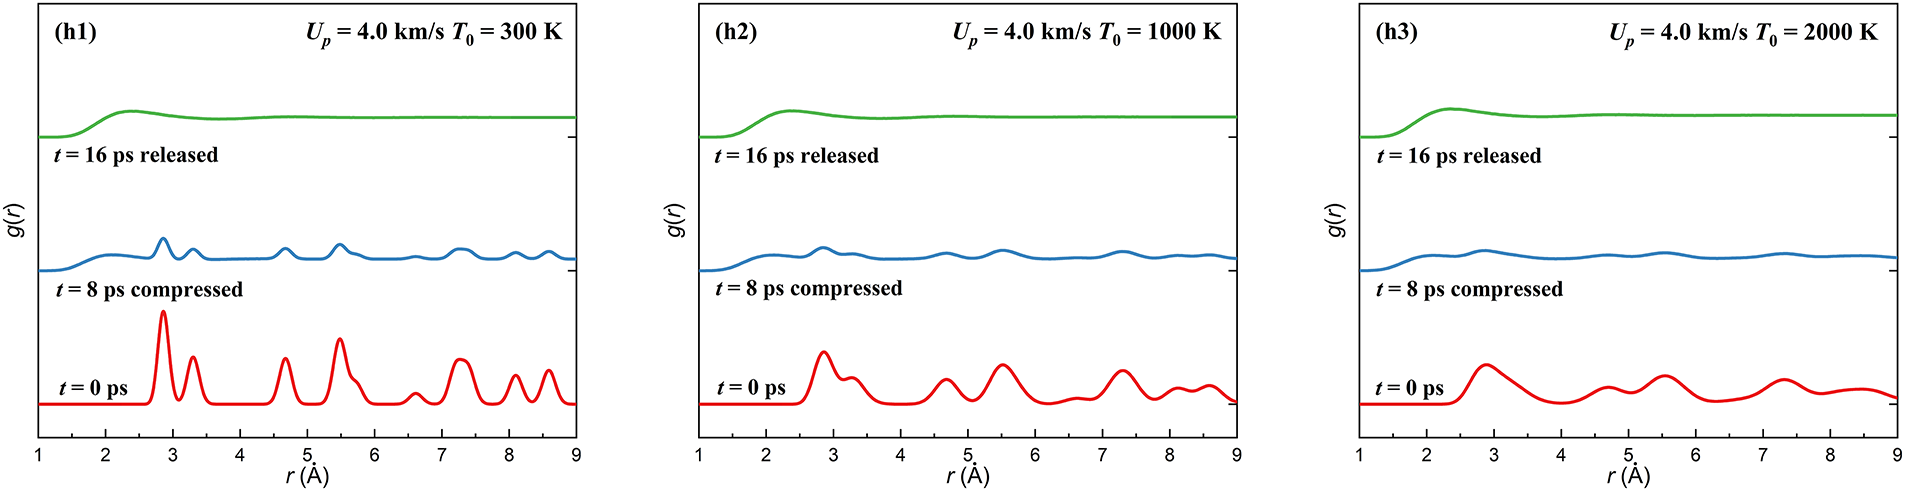
Figure 6: Radial distribution functions (RDFs) of the single-crystal Ta simulation system under different shock velocities (Up from 0.75 to 4.0 km/s) and initial temperatures (T0 from 300 to 2000 K), used to distinguish solid-liquid states and spallation regimes
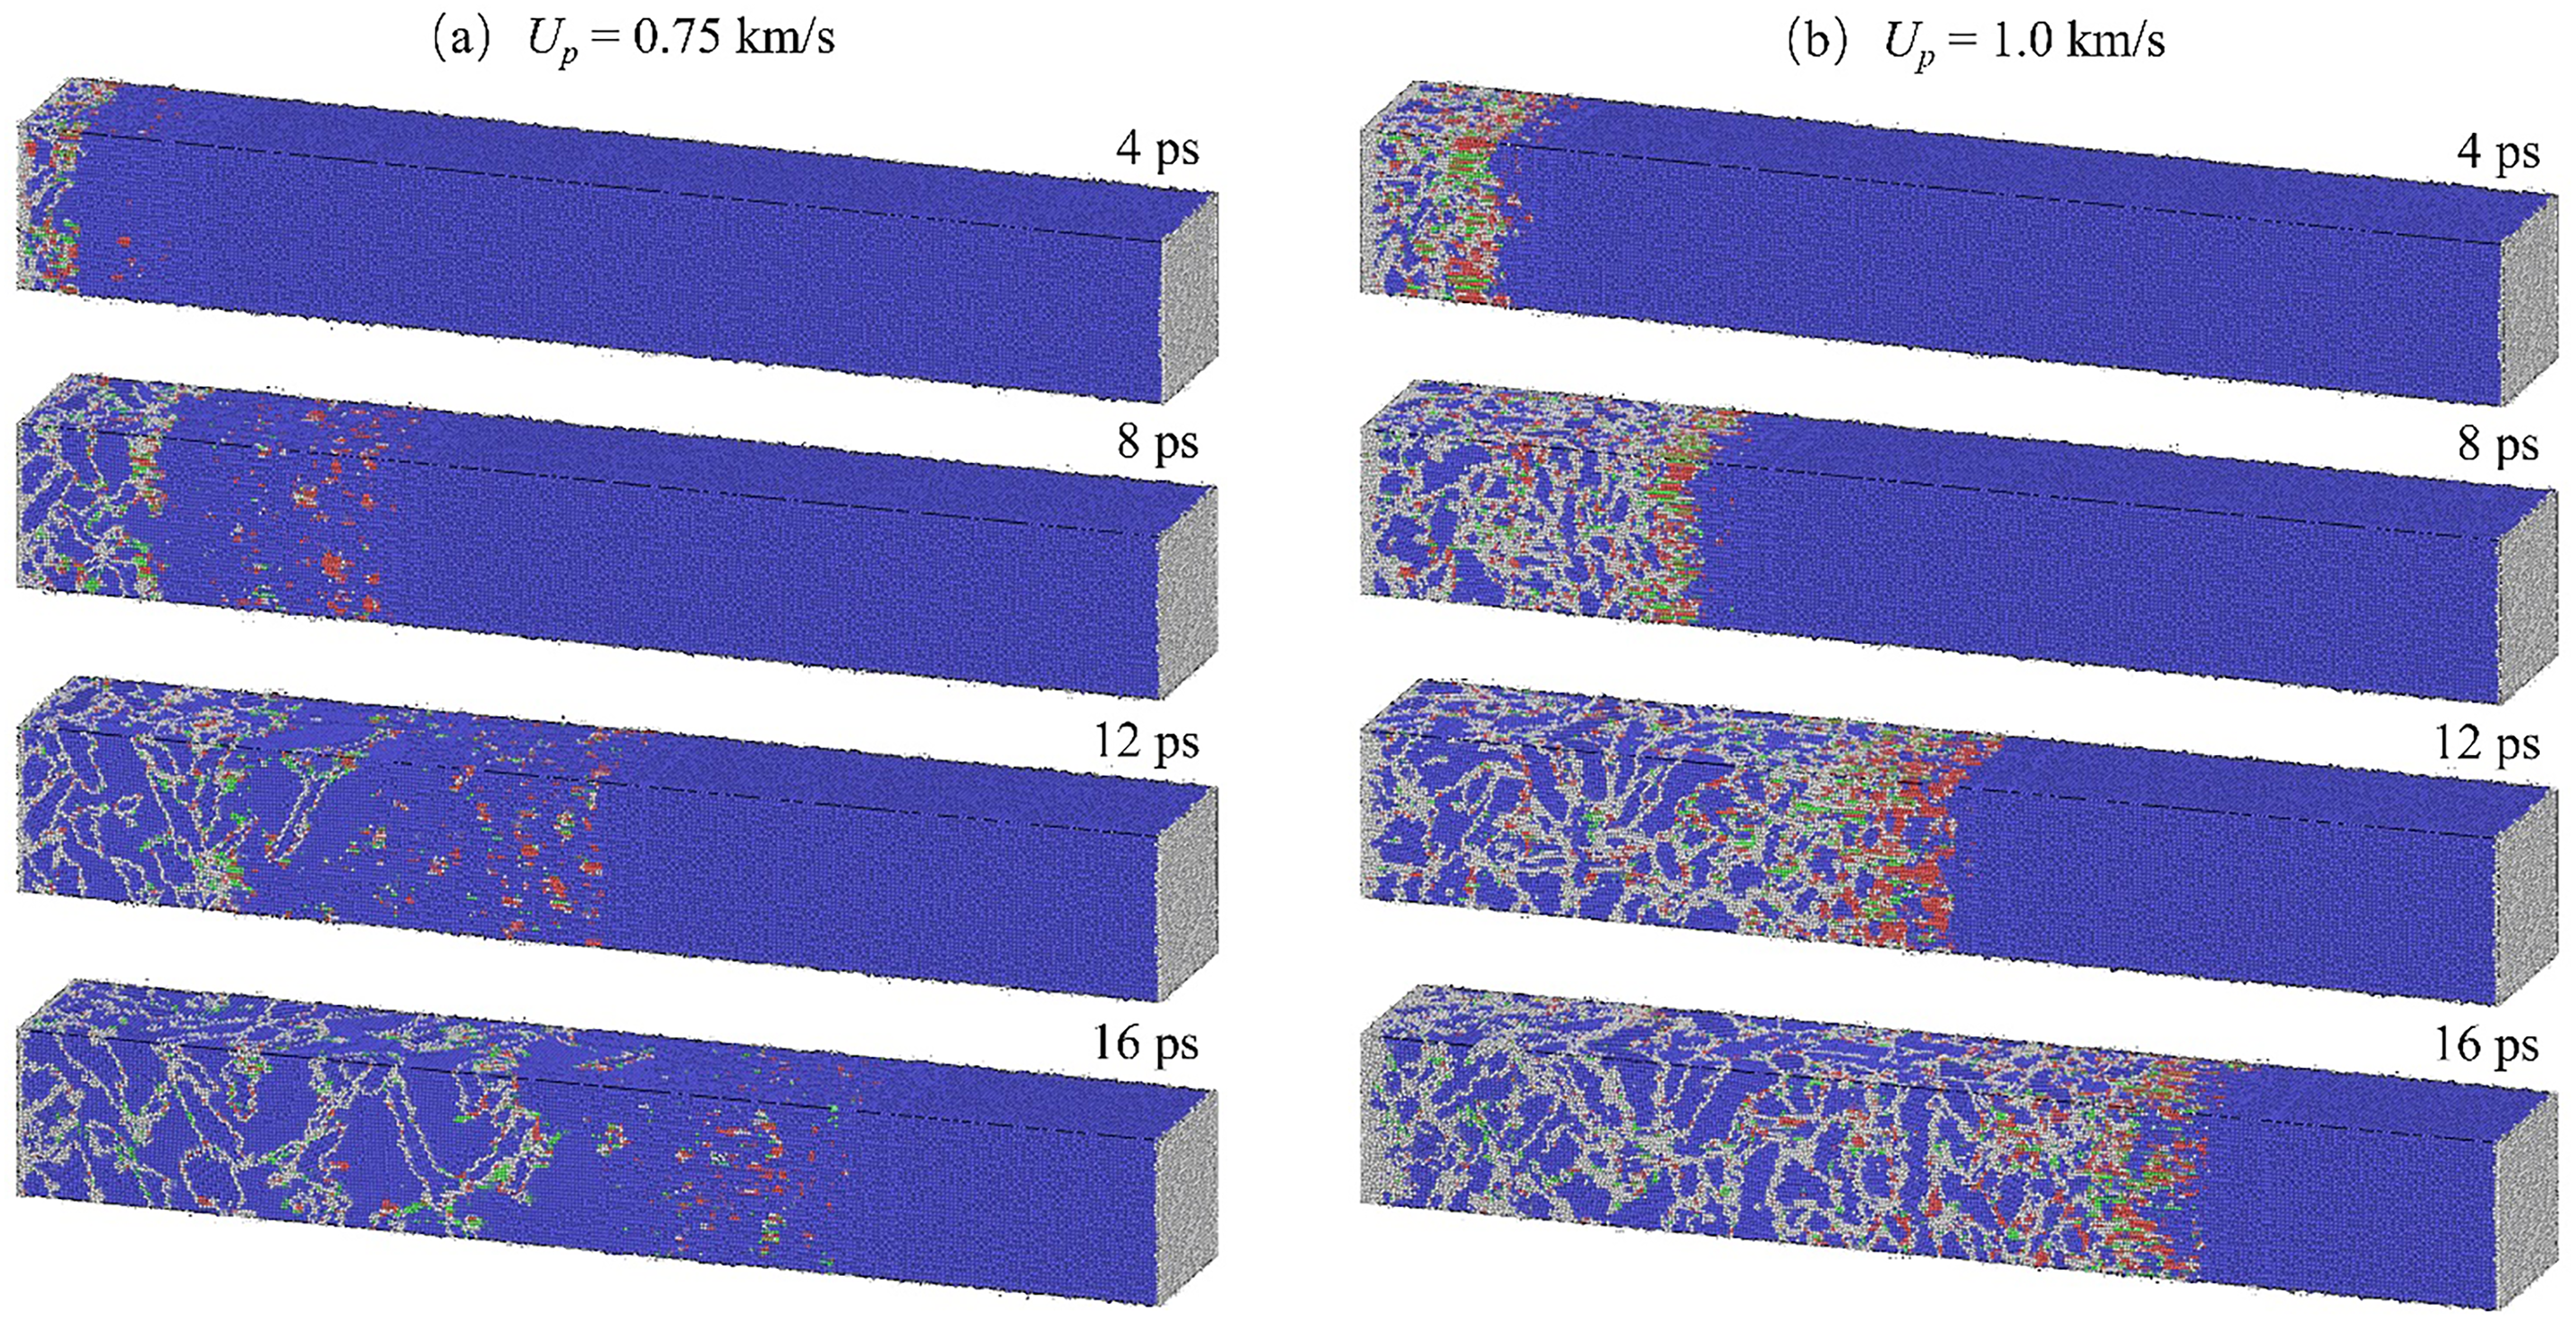
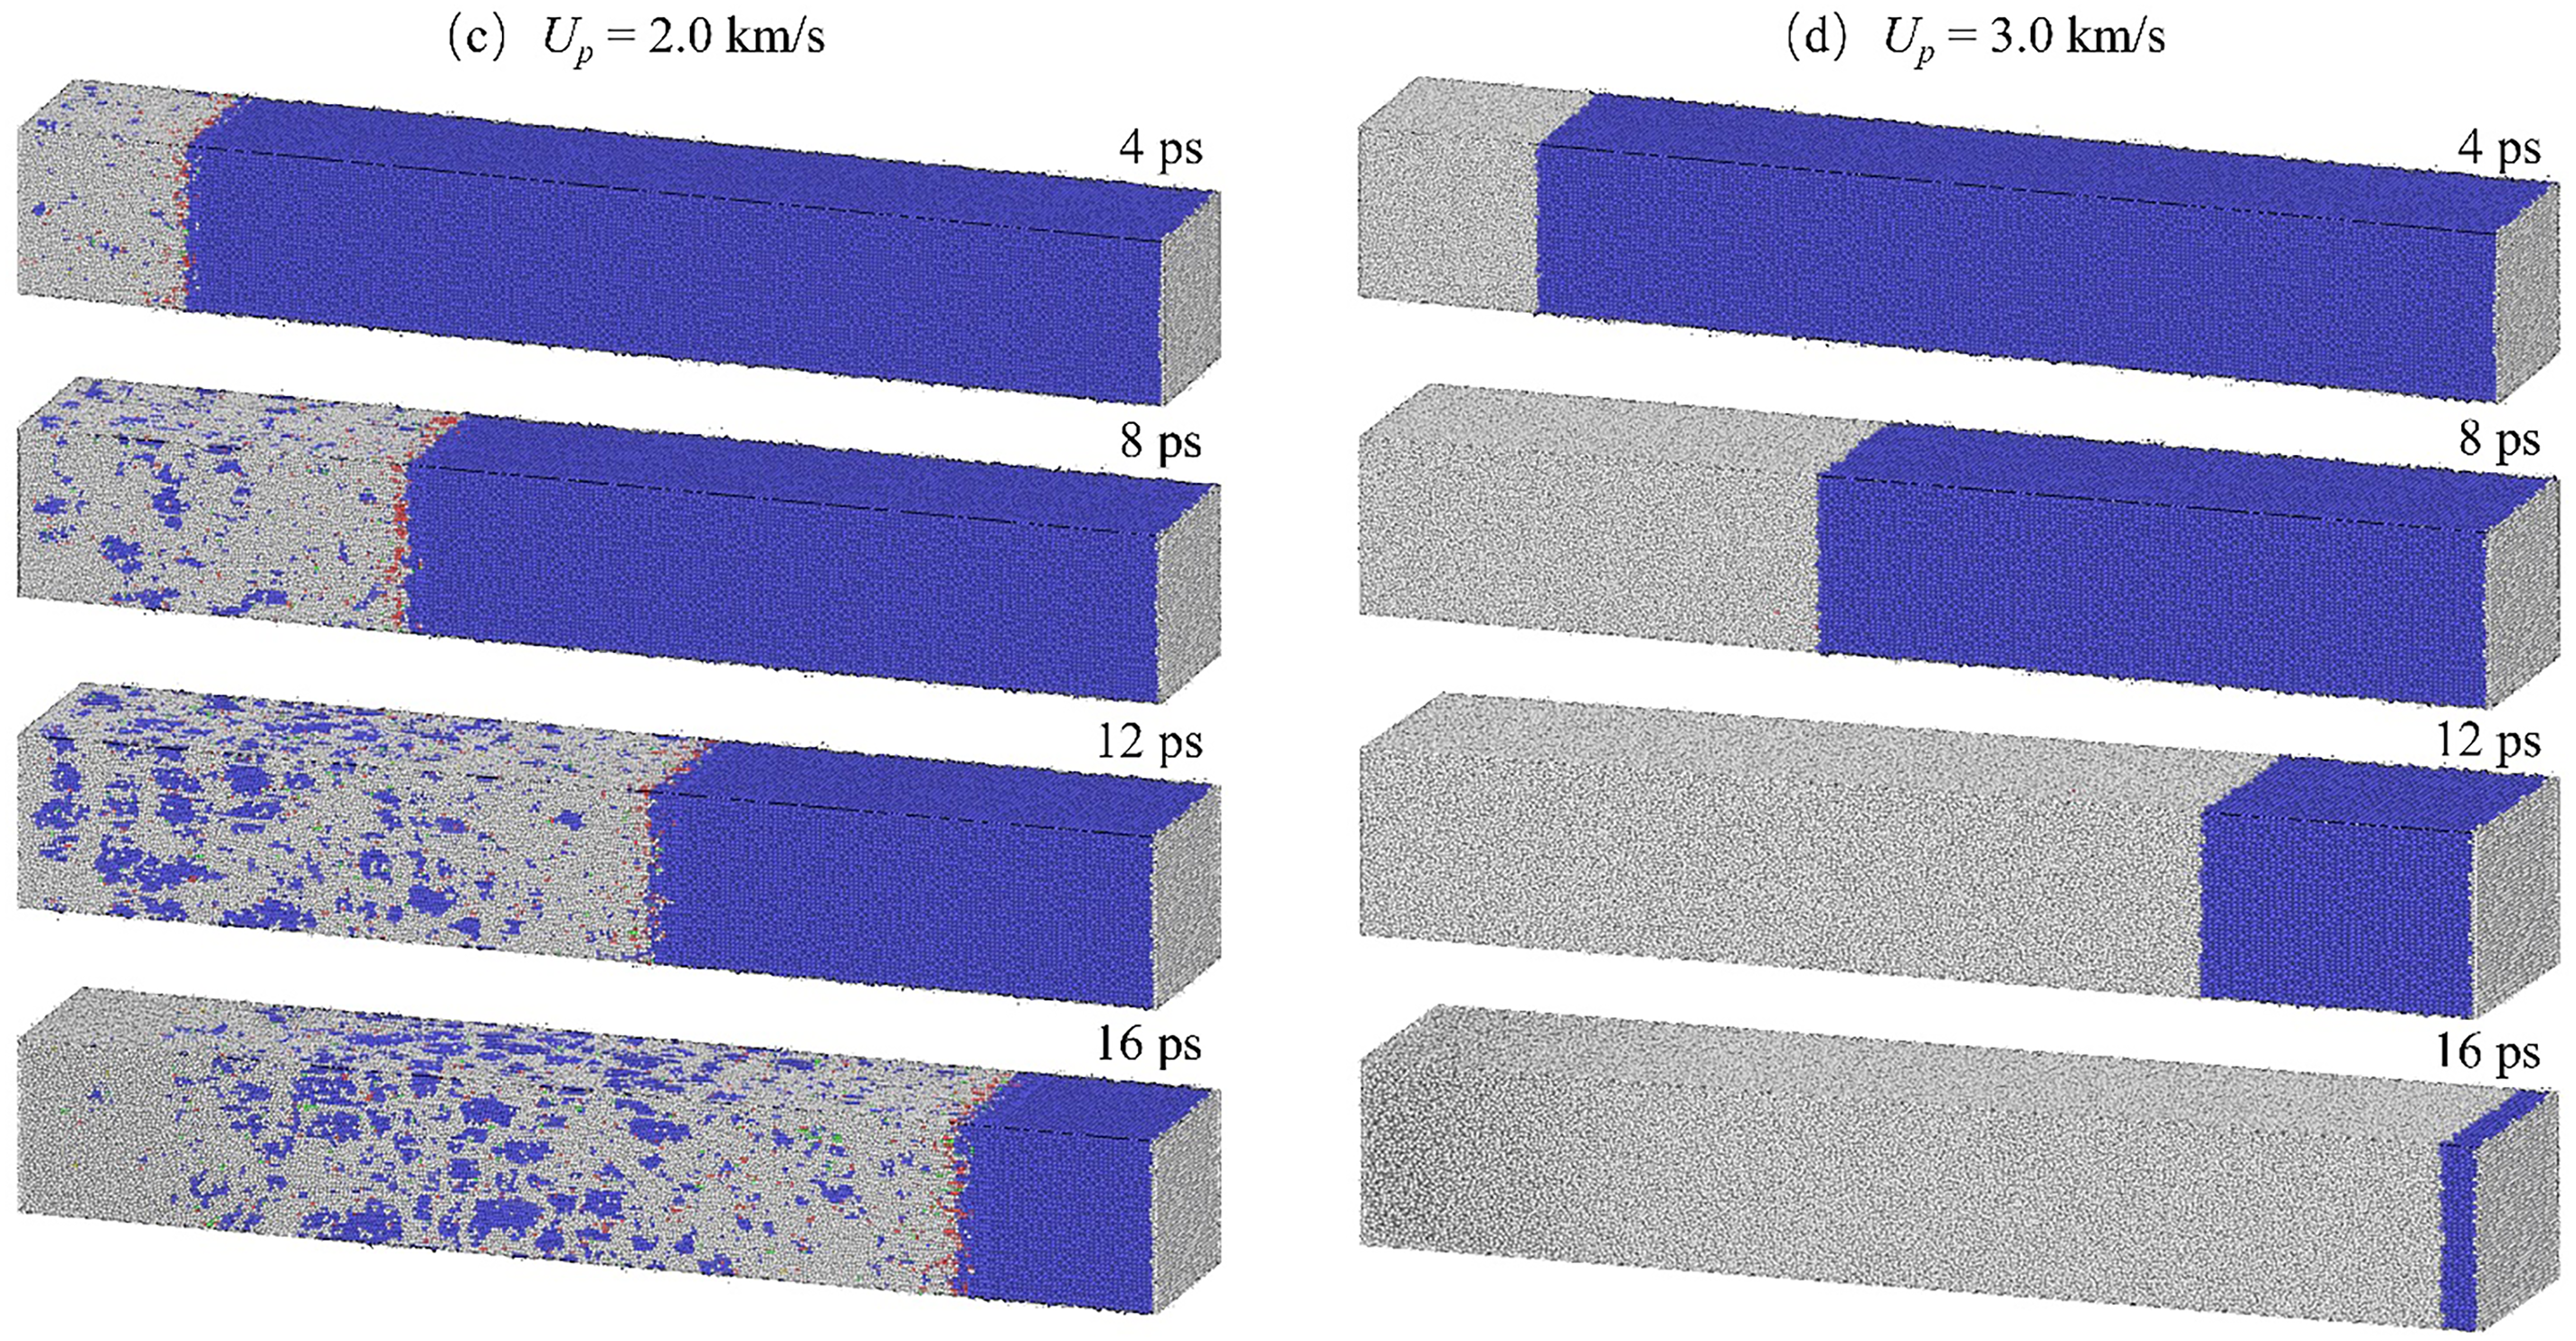
Figure 7: Crystal configurations of single-crystal Ta (T0 = 300 K) at representative time points under different shock velocities (Up), determined via ACNA. Representative time points and their physical meanings: 4 ps (initial shock loading stage), 8 ps (peak shock compression stage), 12 ps (shock unloading stage), 16 ps (post-spallation stage). (a) Up = 0.75 km/s, (b) Up = 1.0 km/s, (c) Up = 2.0 km/s, (d) Up = 3.0 km/s. Atom colors denote structural types: blue = BCC, red = HCP, green = FCC, white = disordered phase
As shown in Fig. 6, the amplitude of RDF oscillations progressively diminishes with increasing shock velocity. Elevated initial temperatures also attenuate RDF oscillations, as they promote the solid–liquid transition. For shock velocities in the range Up = 0.75 to 1.5 km/s (Fig. 6a–c), wave propagation induces moderate modifications in the RDF profiles: peak intensities decrease, positions shift toward shorter interatomic distances, and several peaks fade, reflecting underlying structural changes. The ACNA analysis in Fig. 7a,b corroborates the emergence of stacking faults and dislocations during shock compression. At Up = 0.75 km/s, parts of the BCC lattice transiently transform into HCP or FCC phases as the compression front advances; after unloading, most of these regions revert to BCC, though localized disorder remains. At Up = 1.0 km/s, a greater fraction of atoms undergo phase transformation (Fig. 7b). For these velocities, the RDF curves partially regain their original oscillatory structure upon release (Fig. 6a–c), suggesting the material largely retains its solid phase, with no evidence of melting at Up = 1.0 km/s.
For the intermediate regime (2.0–2.5 km/s, Fig. 6d,e)—a critical transition between classical and micro-spallation—partial melting is clearly distinguishable via combined RDF and ACNA analysis (consistent with the original analytical framework in Section 2.2). From an RDF perspective, this regime exhibits a unique “dual-peak signature” that differs from both classical and micro-spallation: residual sharp peaks at ~2.8 Å (corresponding to the BCC lattice, indicating unmolten solid regions) coexist with broadened, low-intensity peaks at 3.0–3.2 Å (characteristic of molten regions). As shock velocity increases from 2.0 to 2.5 km/s, the intensity of the broadened molten peak gradually strengthens, while the residual BCC peak weakens—directly reflecting a gradual increase in the molten fraction. This differs from classical spallation (Up ≤ 1.5 km/s), where RDF curves only exhibit sharp BCC peaks without broadened features, and micro-spallation Up ≥ 3.0 km/s, where RDF curves are completely featureless with no lattice peaks Fig. 6f–h.
ACNA analysis (referenced in Fig. 7c), which depicts crystal configurations a Up = 2.0 km/s further validates the partial melting nature of this intermediate regime: the fraction of disordered atoms (non-BCC/FCC/HCP structures) ranges from 30% to 60%—a middle ground between classical spallation (<10%/disordered atoms, Fig. 7a,b) and micro-spallation (>90% disordered atoms, Fig. 7d). This disordered atom fraction also increases with initial temperature: at Up = 2.5 km/s, disordered atoms account for ~45% at 300 K but rise to ~60% at 2000 K, confirming that elevated temperatures exacerbate partial melting in the transition range.
Fig. 8 compares crystal structures at T0 from 300 to 2000 K for Up = 1.0 km/s. At 1000 K, shock-induced transitions from BCC to HCP/FCC are similar to those at 300 K, but post-shock recovery to BCC is incomplete, with a larger fraction of disordered structures remaining. At 2000 K, BCC-to-FCC/HCP transitions are less pronounced, and post-shock recovery is minimal, leaving most regions disordered. This indicates that while Ta maintains comparable shock response at 1000 to 300 K, elevated temperatures (e.g., 2000 K) significantly alter structural transformation behavior during shock loading.
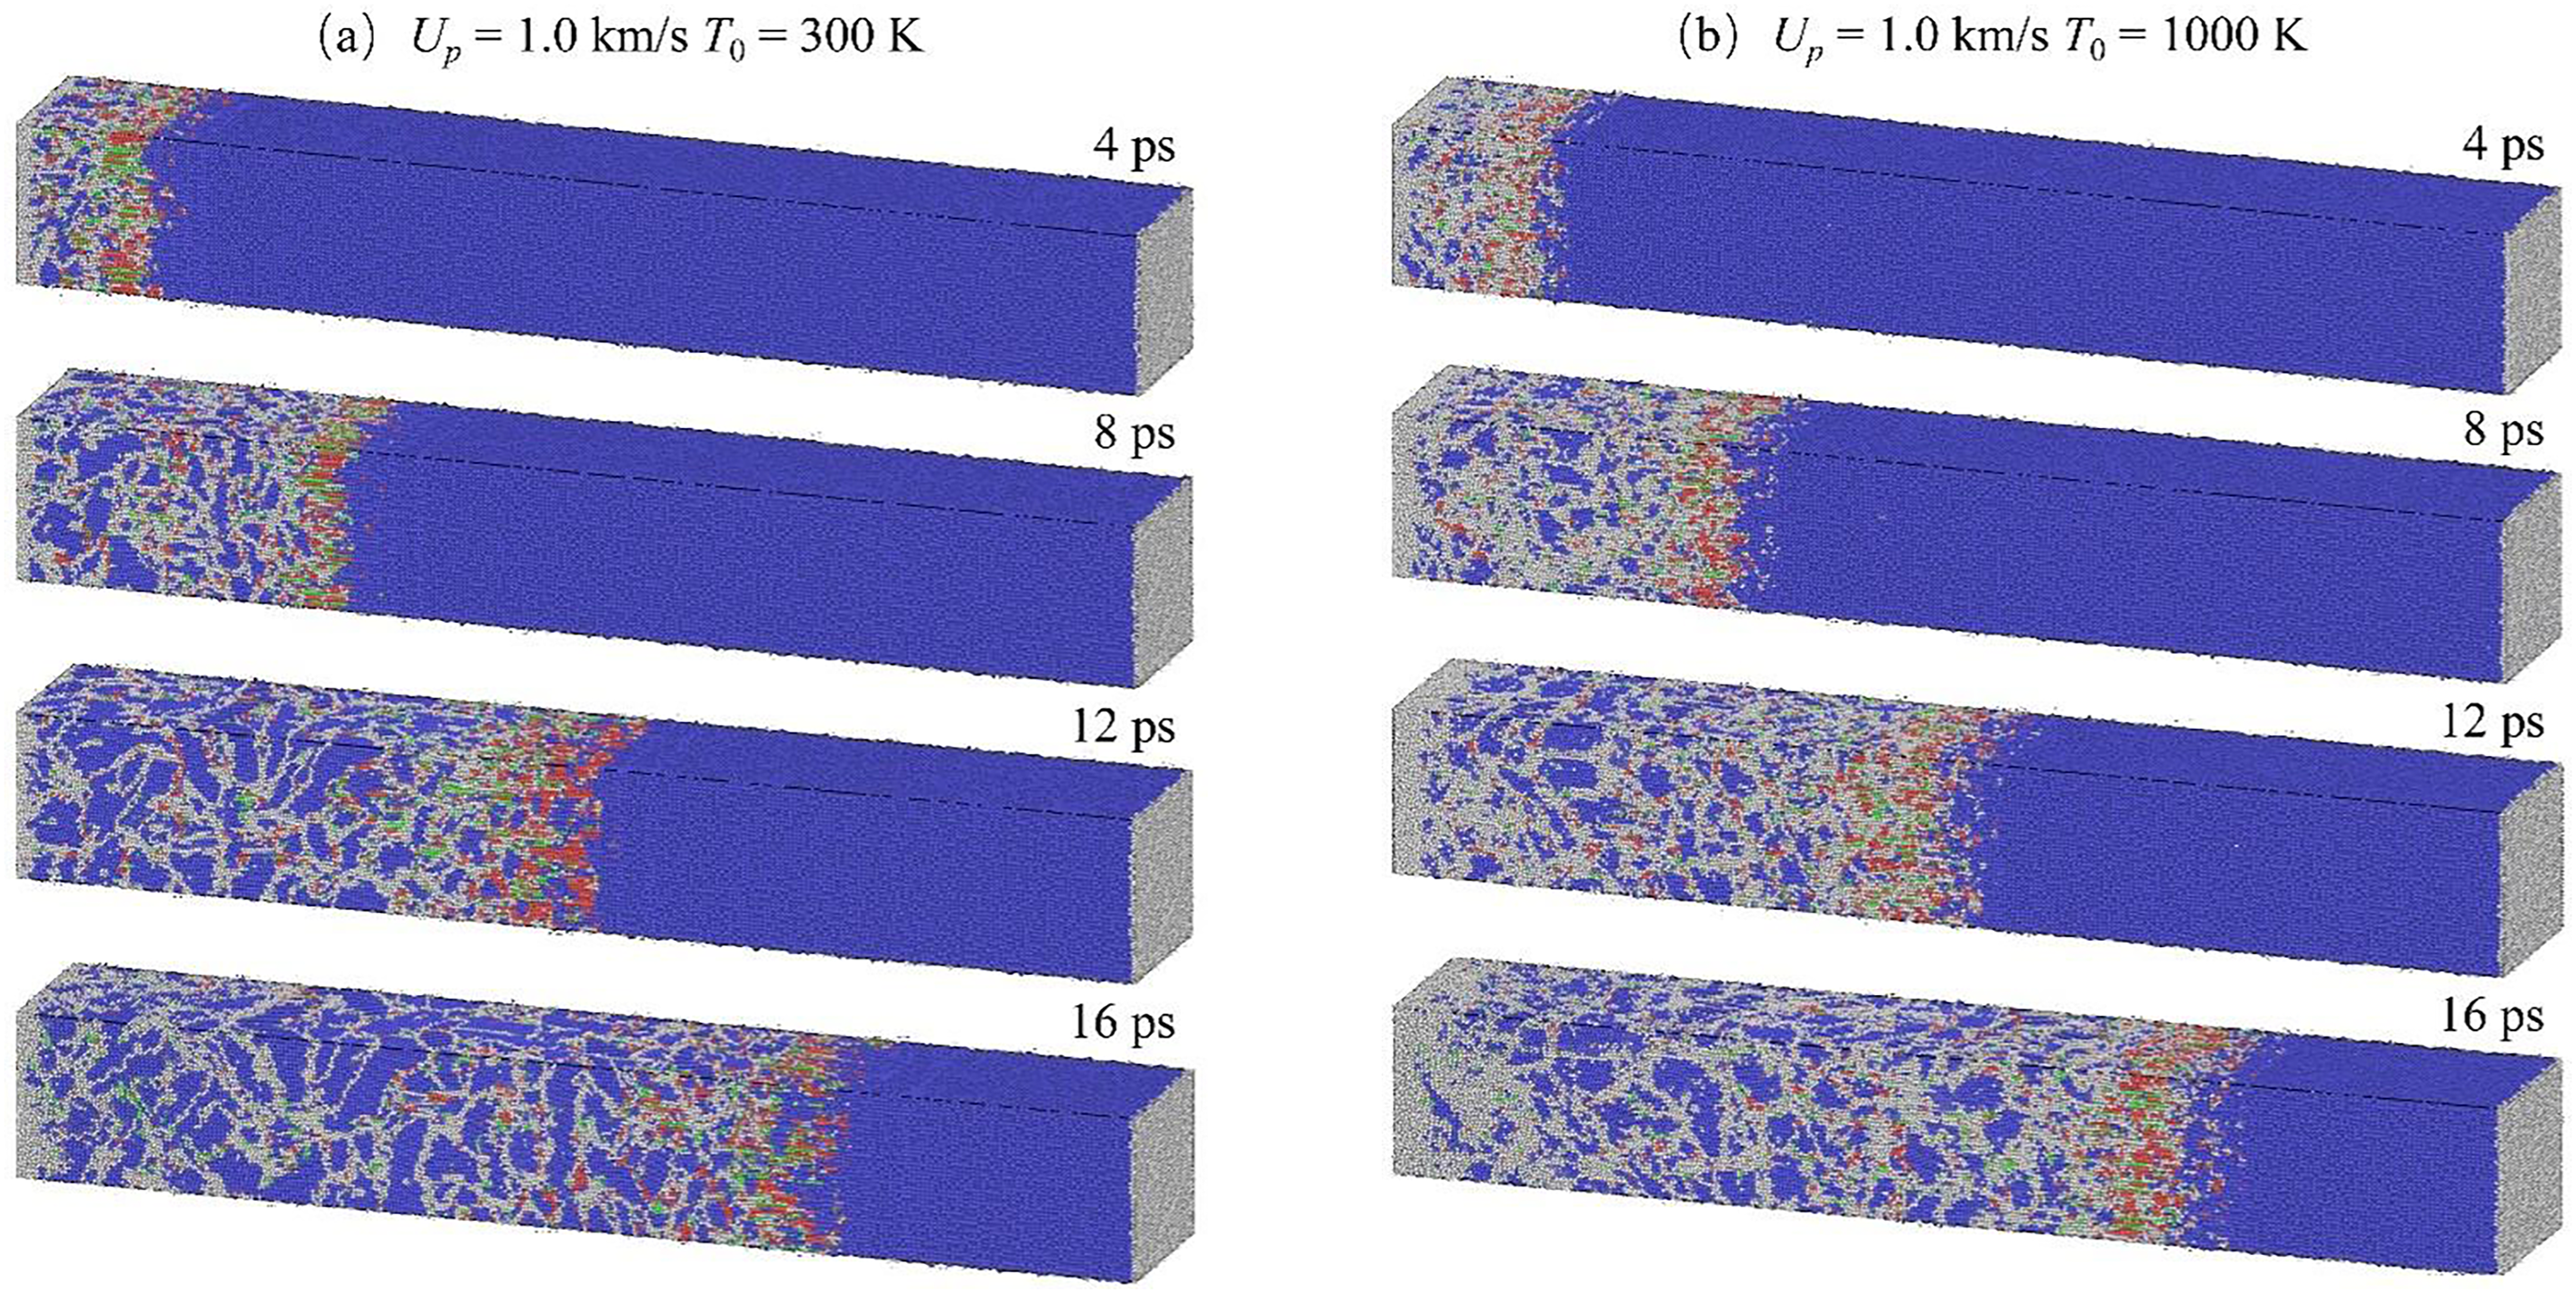
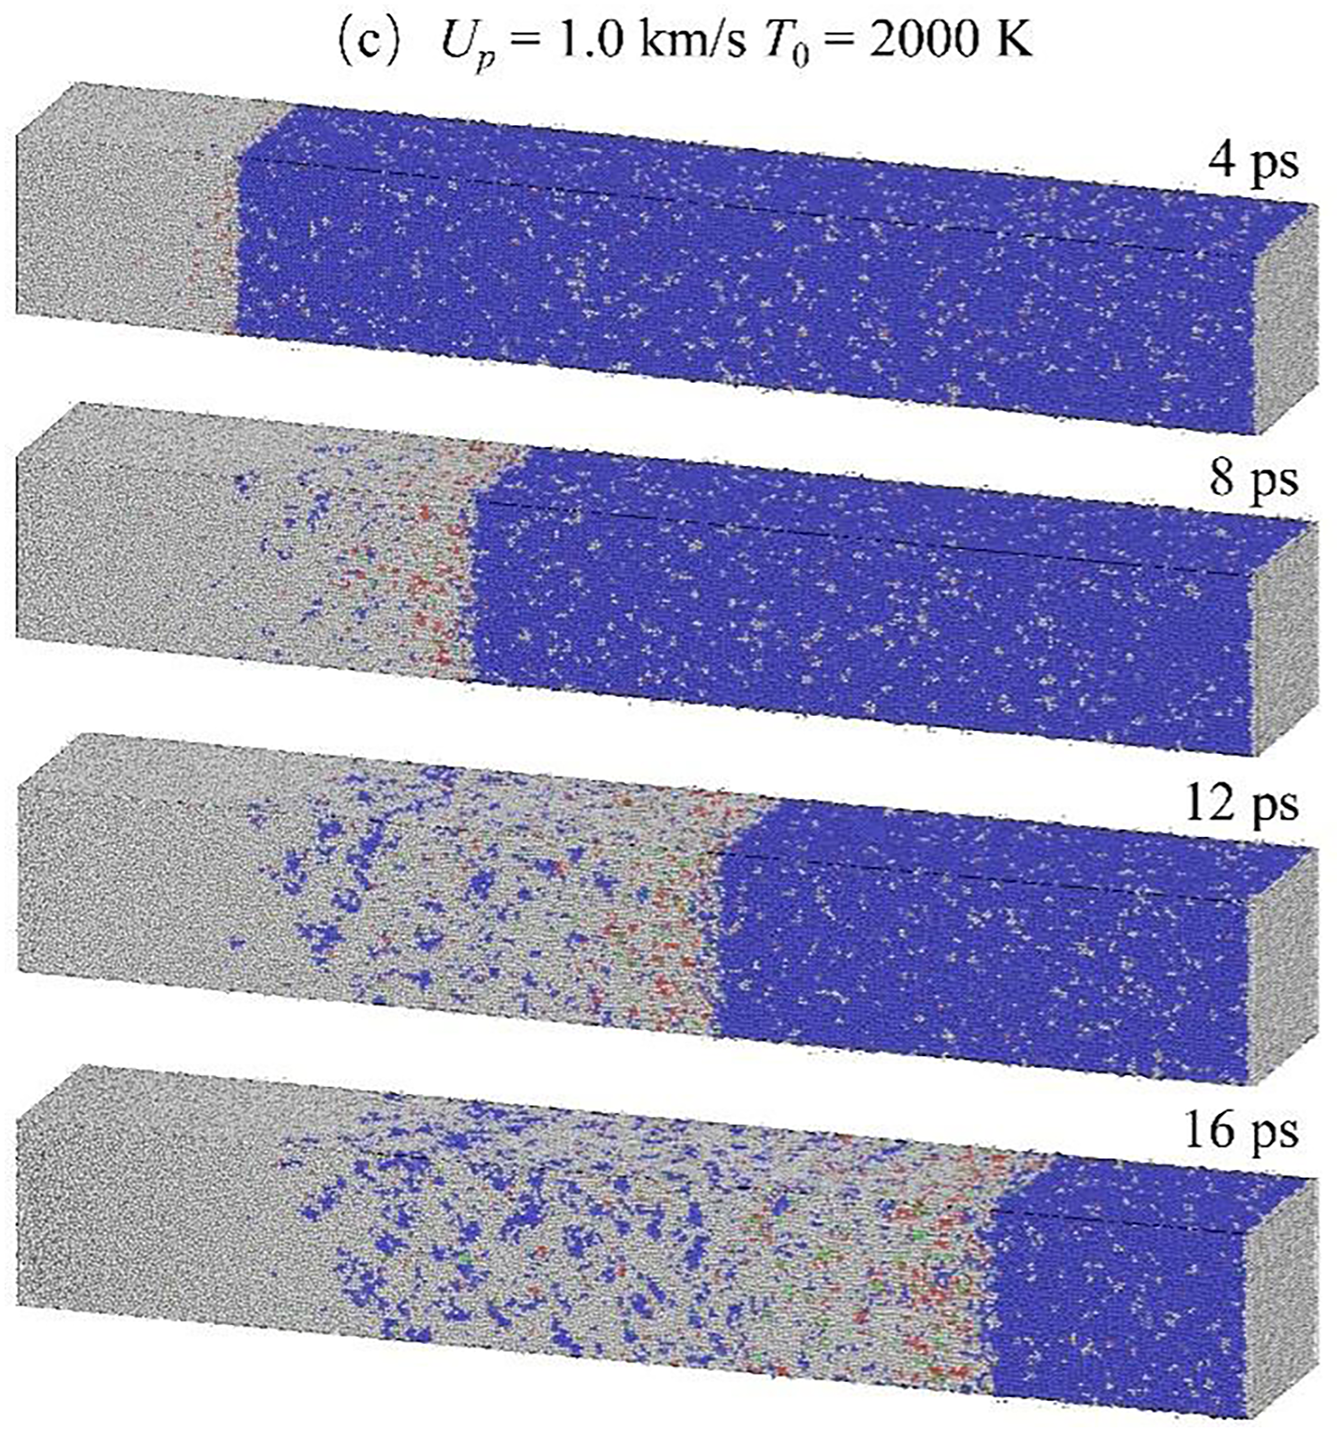
Figure 8: Crystal configurations of single-crystal Ta (Up = 1.0 km/s) at representative time points under different shock velocities (Up), determined via ACNA. Representative time points and their physical meanings: 4 ps (initial shock loading stage), 8 ps (peak shock compression stage), 12 ps (shock unloading stage), 16 ps (post-spallation stage). (a) T0 = 300 K, (b) T0 = 1000 K, (c) T0 = 2000 K. Atom colors denote structural types: blue = BCC, red = HCP, green = FCC, white = disordered phase
For Up = 2.0 km/s, shock front propagation induces BCC-to-FCC transitions, with minimal post-shock recovery to BCC and widespread disordered structures (Fig. 7c). As shown in Fig. 6d,e, RDF profiles fail to revert to their initial solid-state features during release, instead resembling liquid-phase RDFs, indicating partial melting. At Up = 3.0 km/s, RDF profiles exhibit liquid-like characteristics (Fig. 6f–h), with complete transformation of BCC structures to disordered phases (Fig. 7d), confirming full melting. These observations enable classification of spallation modes: classical spallation dominates for Up
Under shock wave moving, the displacement of the piston along shock direction triggers a compressive wave. The compressive wave converts into a rarefaction wave upon reflection from the free surface. The interplay between the reflected rarefaction wave and unloading wave leads to the formation of a high-tensile stress region within the specimen. When the shock intensity reaches a sufficient level, gradual damage accrues, eventually culminating in spallation. The developmental process of spall damage during the simulation can be examined via the position–time distributions of mass density and pressure (Figs. 9 and 10). The equilibrium mass densities of tantalum (Ta) are determined to be 16.65 g/cm³ at 300 K, 15.59 g/cm³ at 1000 K, and 16.48 g/cm³ at 2000 K.

Figure 9: Position–time profiles illustrating density variations for Up = 1.0 km/s from 300 to 2000 K
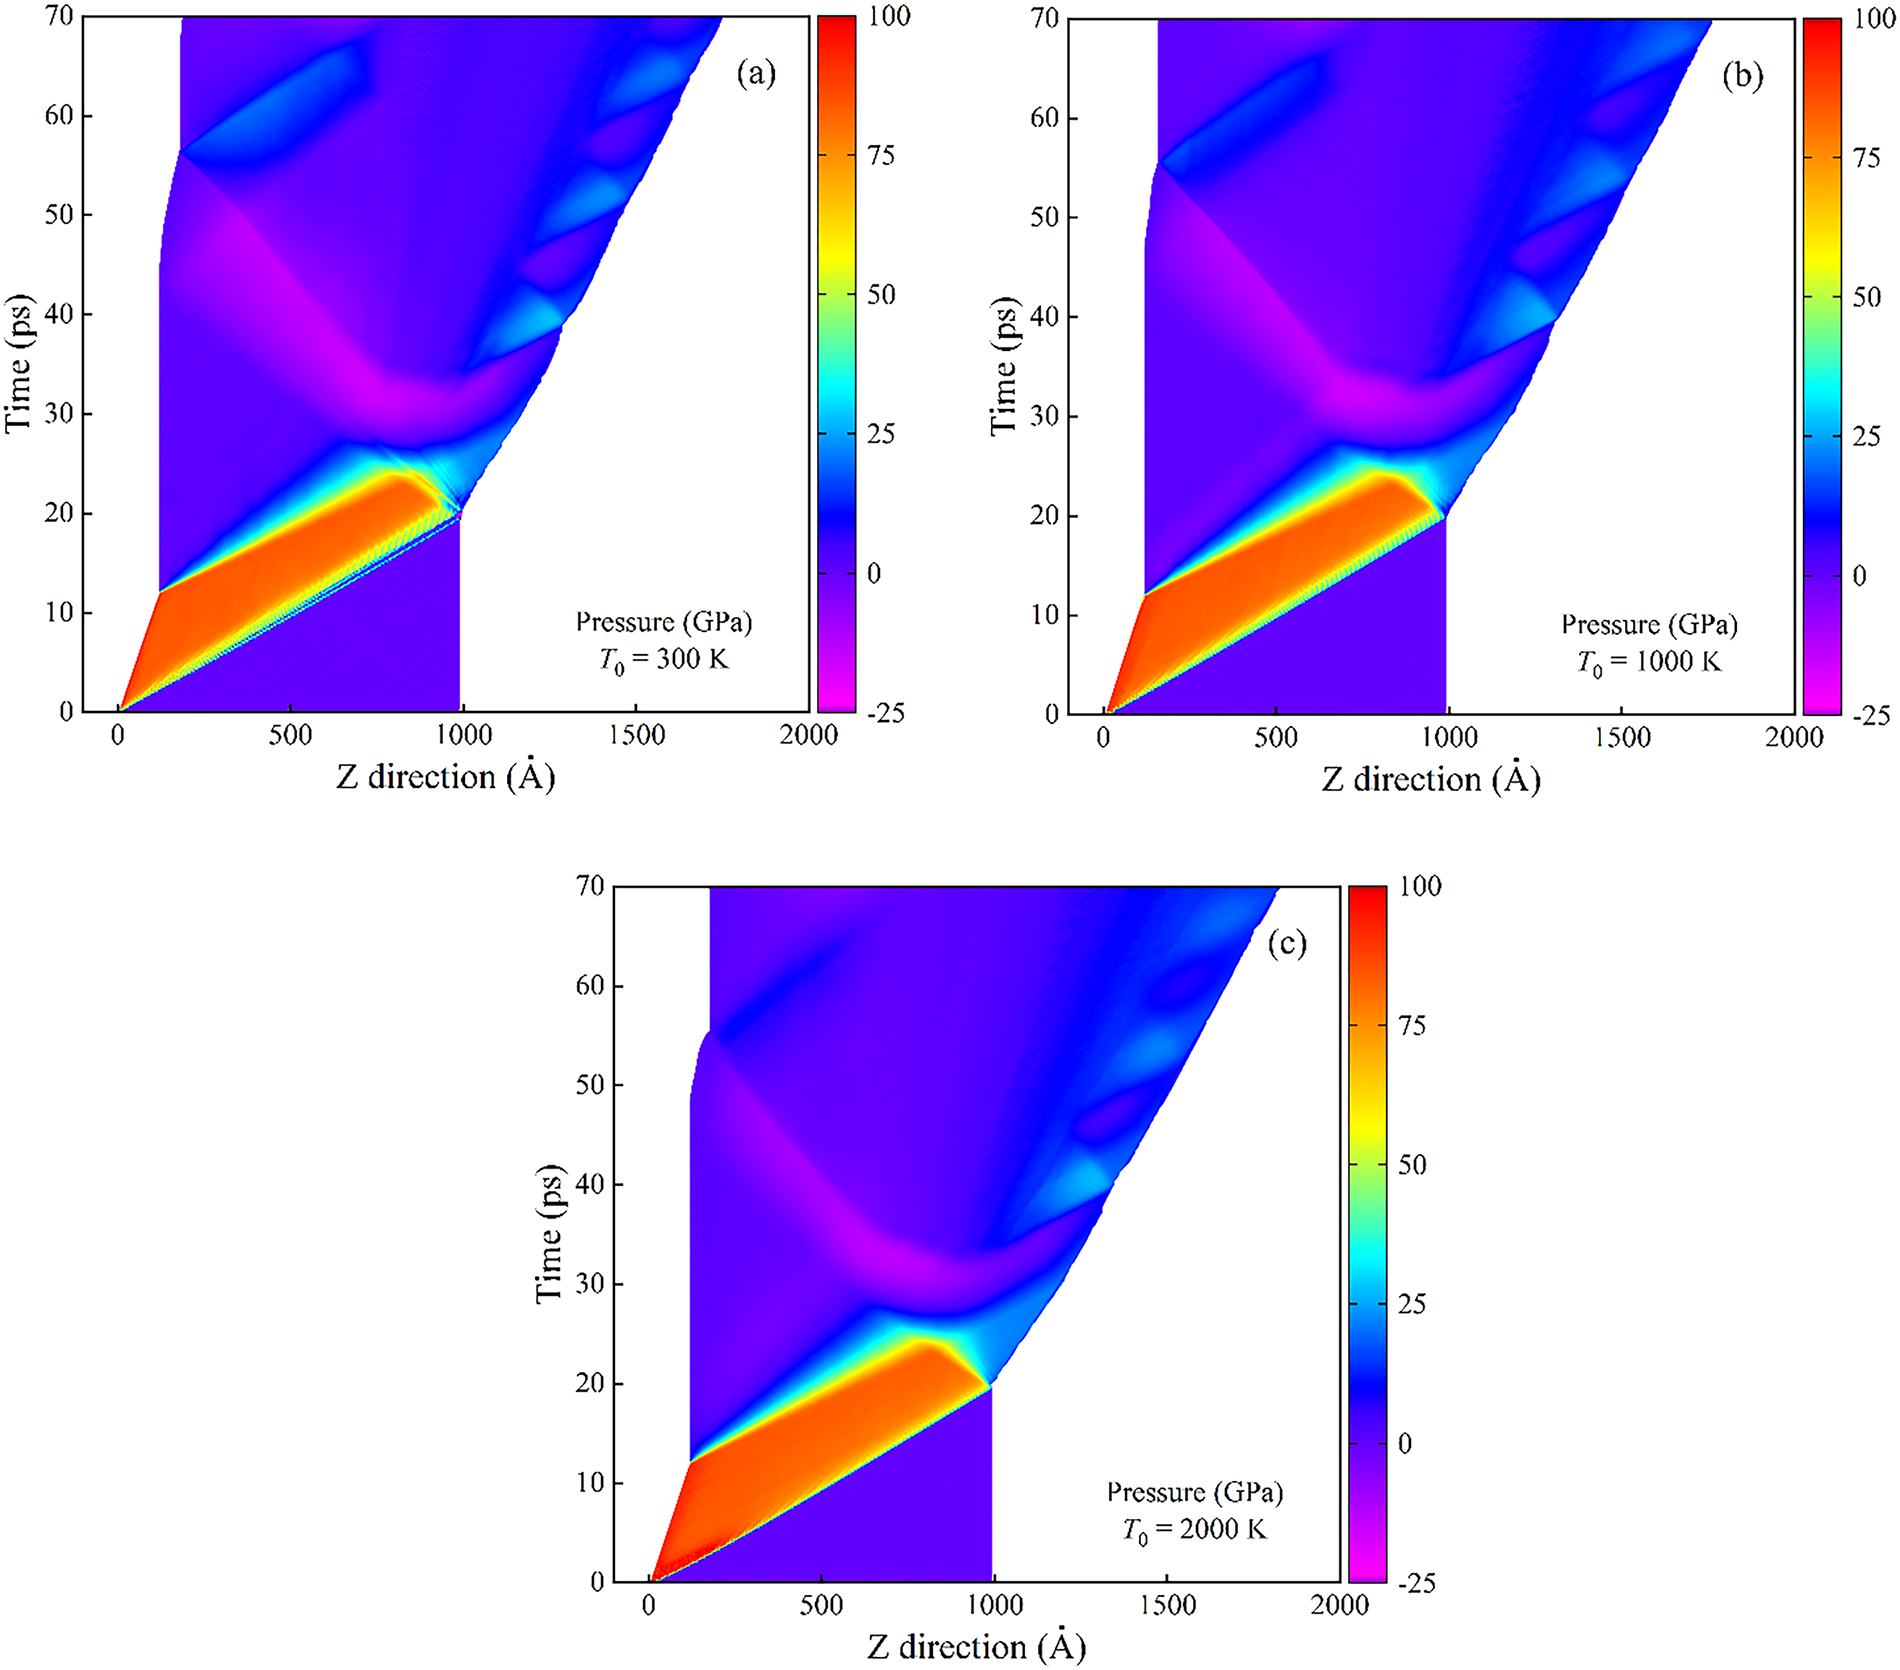
Figure 10: Position–time profiles illustrating pressure variations for Up = 1.0 km/s from 300 to 2000 K
In Fig. 9a, the compressive shock wave moves from the piston shock side to the free surface; upon reaching the free surface, it reflects and propagates backward, reducing compression magnitude. Fig. 10a highlights a tensile region (marked in the color corresponding to low pressure/tensile state, as indicated in the figure legend) formed by interacting rarefaction waves, initiating at ~28 ps without immediate spallation. Spallation onset occurs at ~34 ps as tensile stress intensifies, with the spall region expanding due to ongoing rarefaction wave interactions. Near-zero density in the spall region (Fig. 9a, pink) indicates complete separation of the sample, with multiple spall layers visible. Post-spallation, periodic oscillations in separated regions arise from stress wave reflections between free surfaces, consistent with free surface velocity oscillations post-pull-back (Fig. 5).
Increasing initial temperature widens the spall region and increases fragment count (Fig. 9b,c), attributed to thermal softening reducing spall strength, rendering the material more susceptible to spallation at identical shock intensities. Fig. 10b,c shows that higher initial temperatures slightly accelerate precursor wave propagation but reduce pressure magnitudes (consistent with Table 1). Stress oscillations in left segments exhibit similar periods, while right segments display delayed oscillations due to later spall onset at elevated temperatures.
To further elucidate classical spallation dynamics, void evolution at Up = 1.0 km/s under T0 from 300 to 2000 K is shown in Fig. 11. Top frames display atomic configurations colored by potential energy (PE); bottom frames visualize void evolution via surface mesh analysis (red, sphere radius = 0.5 nm [10]). In Fig. 11a, void nucleation initiates in the tensile region near the free surface at ~30 ps. As tensile stress increases, voids proliferate and expand by 32 ps, with distinct voids visible by 34 ps. By 36 ps, void growth leads to micro-crack formation, and subsequent coalescence results in complete sample separation by 60 ps.

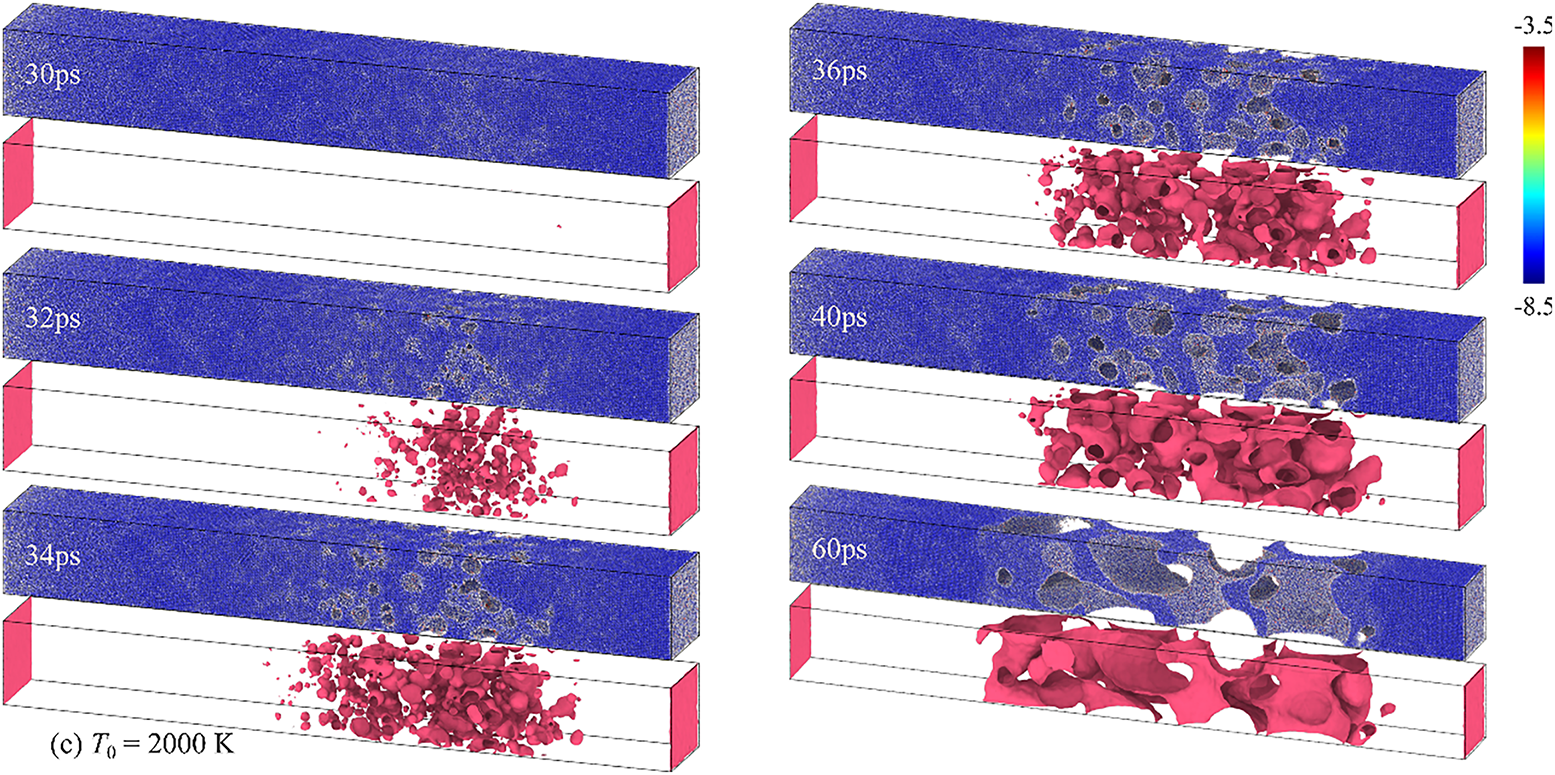
Figure 11: Evolution of classical spallation at Up = 1.0 km/s for T0 from 300 to 2000 K. The upper panels display atomic configurations colored by potential energy, while the lower panels depict void development obtained from surface mesh analysis (sphere radius = 0.5 nm)
Elevated initial temperatures alter spall dynamics (Fig. 11b,c):
(1) Void nucleation is delayed (e.g., three voids at 1000 K vs. one at 2000 K by 30 ps), consistent with later tensile region formation (Fig. 10).
(2) Void count increases with temperature, the number of voids is ~120 at 300 K, ~160 at 1000 K and ~220 at 2000 K, due to reduced spall strength facilitating more nucleation events under identical shock intensities.
Micro-spallation dynamics at Up = 2.0 km/s is shown in Fig. 12. Fig. 13 shows micro-spallation of Up = 3.0 km/s. Unlike classical spallation with countable voids, micro-spallation features extensive void nucleation. In Fig. 12a, voids nucleate at ~25 ps, proliferating rapidly to fill the spall region by 29 ps. By 31 ps, voids grow and coalesce, with surface separation evident by 35 ps; by 60 ps, coalescence results in fragmentation into small debris. Higher initial temperatures enhance void density and nucleation area (Fig. 12b,c), increasing fragmentation.
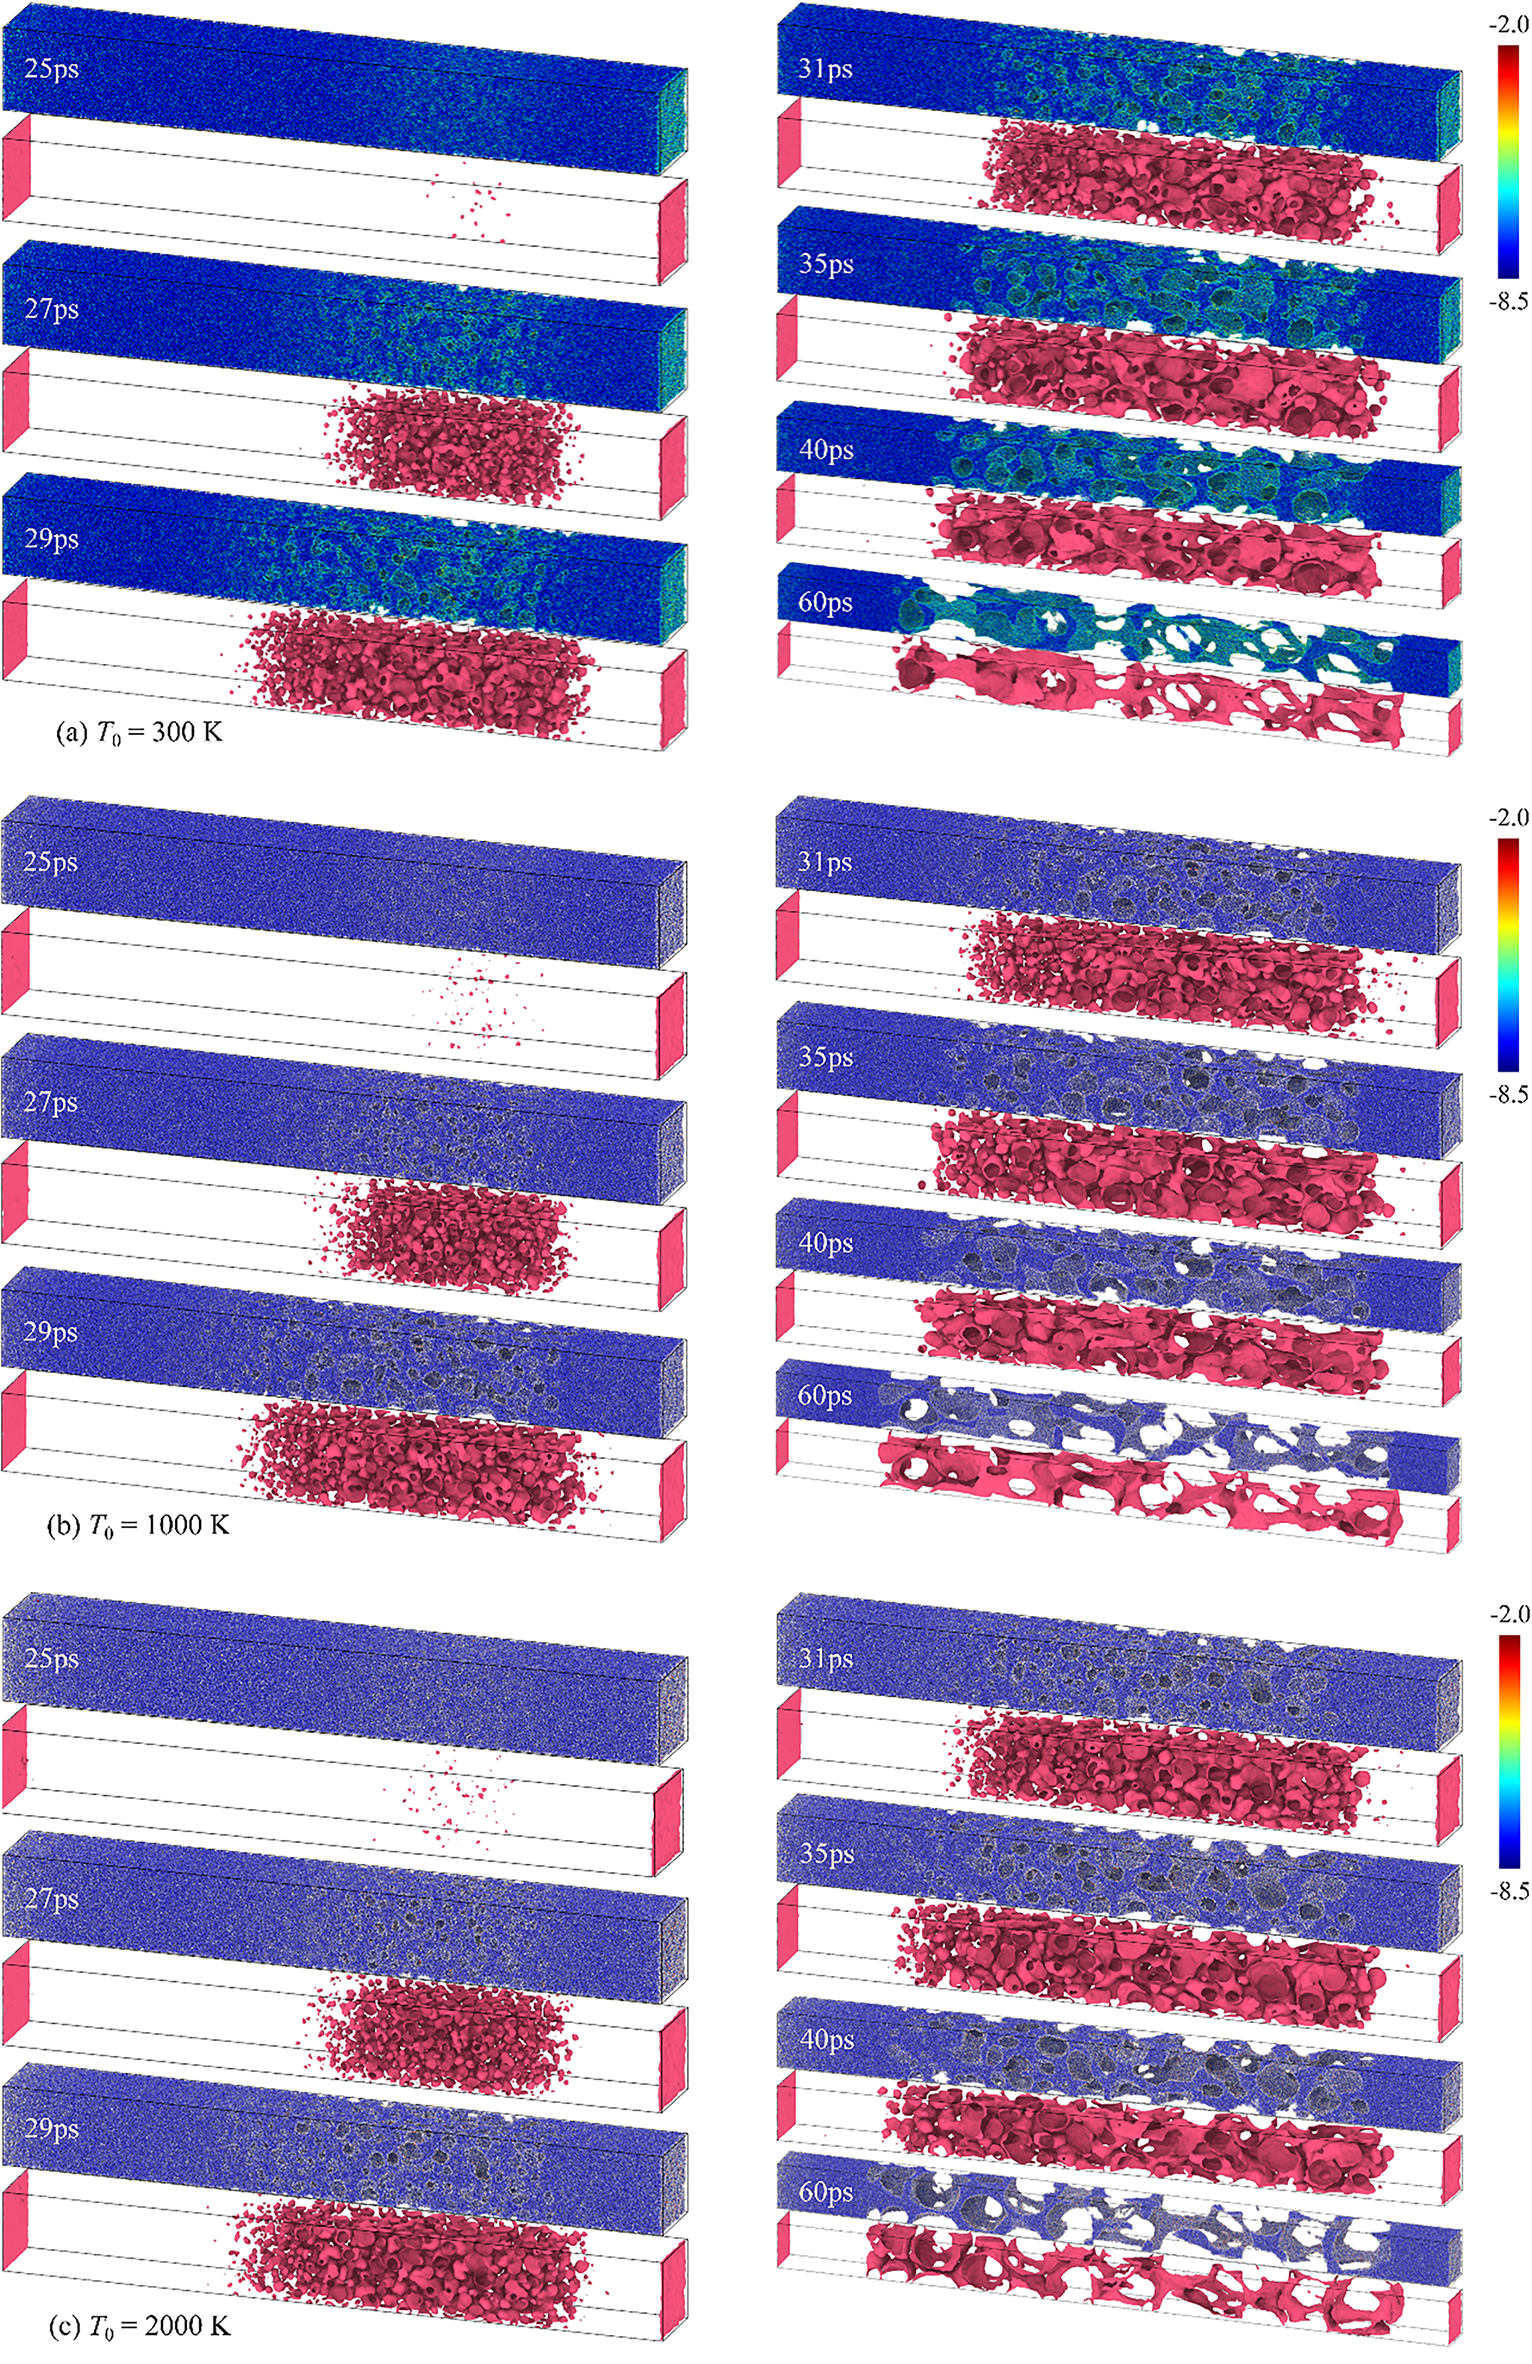
Figure 12: Evolution of micro-spallation for Up = 2.0 km/s for T0 from 300 to 2000 K. Top frames: atomic configurations (PE-colored); bottom frames: void evolution via surface mesh analysis (sphere radius = 0.5 nm)
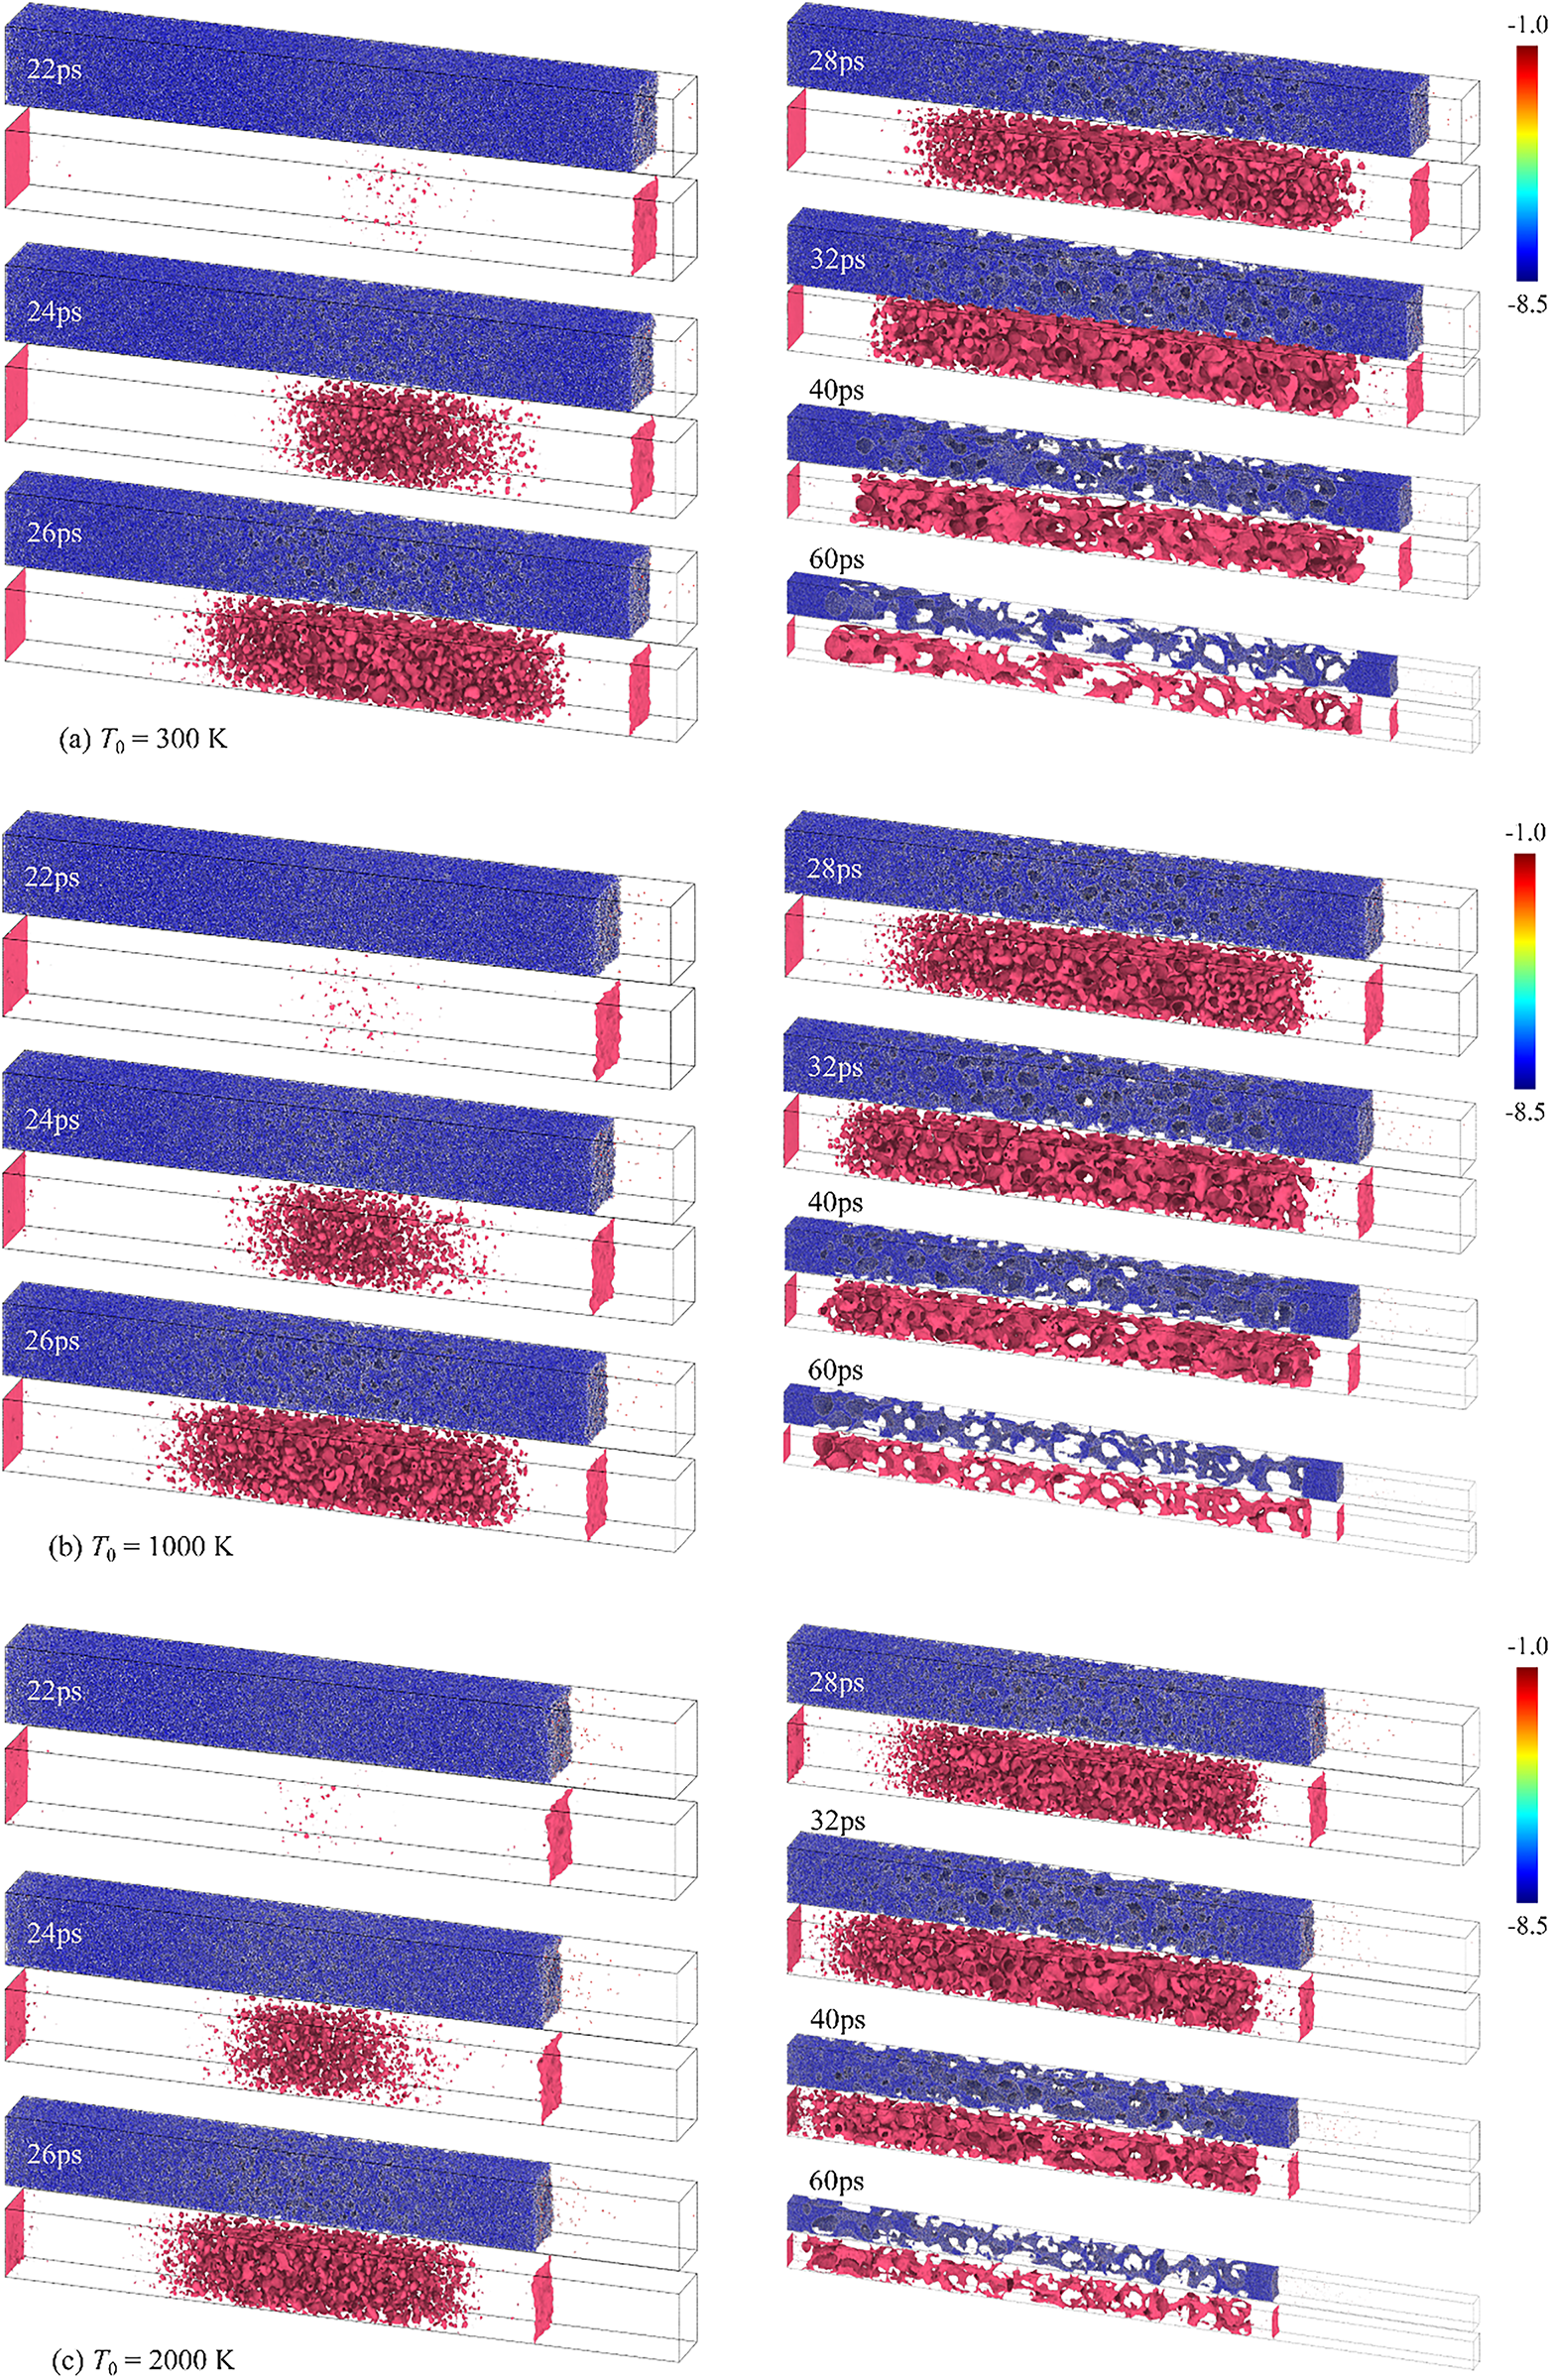
Figure 13: Evolution of micro-spallation for Up = 3.0 km/s T0 from 300 to 2000 K. Top frames: atomic configurations (PE-colored); bottom frames: void evolution via surface mesh analysis (sphere radius = 0.5 nm)
At Up = 3.0 km/s (Fig. 13a), it is shown that region caused by spall expands further than at 2.0 km/s. Void dynamics resemble those at 2.0 km/s but with smaller, more numerous nucleation sites. Shock-induced melting exacerbates damage, with the spall region nearly permeating the sample. A key distinction is atomic ejection from the free surface upon shock arrival, observable by 25 ps (Fig. 13a–c). Ejection intensifies with shock velocity, as shown in Fig. 14. At 30 ps, Up = 4.0 km/s exhibits increased ejecta count with initial temperature.
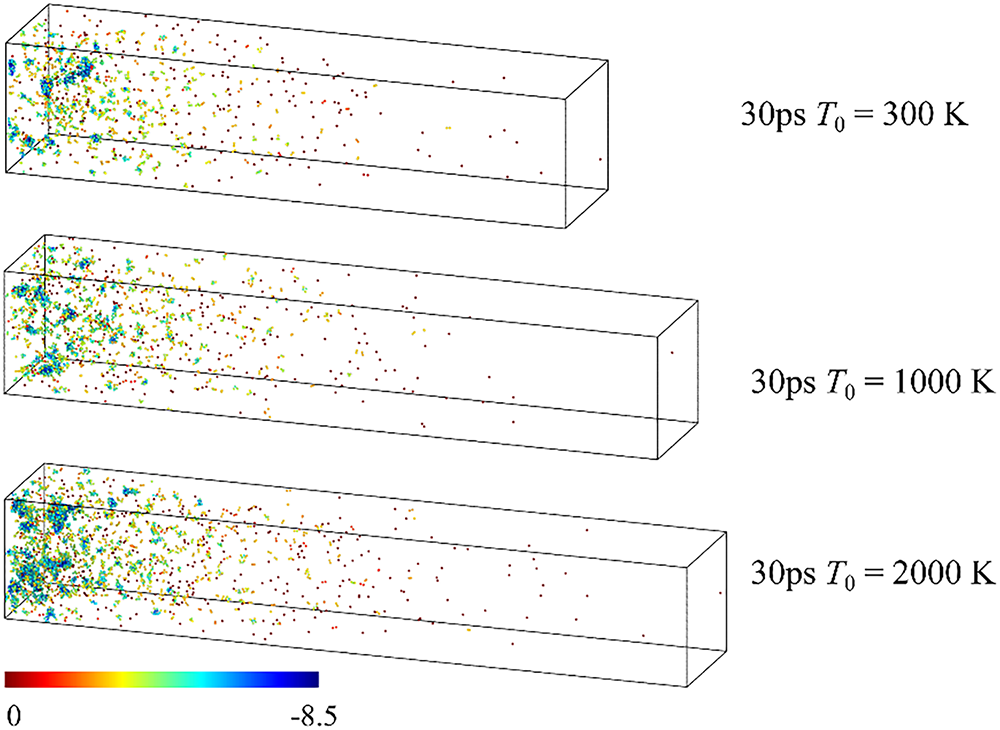
Figure 14: Atom emission at Up = 4.0 km/s, 30 ps, colored by potential energy (PE)
The apparent contradiction between reduced spall strength, delayed void nucleation, and increased void density under elevated temperatures can be reconciled through integrated analysis of spall strength data, void evolution dynamics, and microstructural observations. Notably, thermal softening dominates the high-temperature response: at a shock velocity Up = 1.0 km/s, the direct spall strength decreases from 19.60 GPa at 300 K to 15.49 GPa at 2000 K (a 35% reduction, as shown in Table 1), arising from weakened atomic bonding. This is evidenced by reduced post-shock recovery of the BCC lattice and a higher fraction of disordered atoms, as quantified via adaptive common neighbor analysis (ACNA).
Mechanistically, the 3–5 ps delay in void nucleation at 2000 K (vs. 300 K as shown in Fig. 11) stems from accelerated pre-existing dislocation motion under elevated temperatures. These dislocations relieve initial tensile stress, requiring prolonged accumulation to reach the critical stress for void nucleation—consistent with the increased structural disorder observed, which lowers resistance to dislocation glide.
Consequently, post-nucleation void density is amplified by thermal softening: at 34 ps, 25 voids are observed at 2000 K (vs. 12 at 300 K as shown in Fig. 11), as weakened atomic bonds cannot counteract tensile forces driving void expansion. This sequential mechanism—stress relief by dislocations inducing nucleation delay, followed by bond weakening promoting void proliferation—resolves the seemingly contradictory high-temperature spallation behavior in single-crystalline Ta.
The temperature-dependent void dynamics observed in this study resolve the “temperature-void paradox” that has not been addressed in prior Ta spallation research. As illustrated in Fig. 11, elevated temperatures delay void nucleation while simultaneously increasing final void density—an effect driven by thermal softening. This softening weakens atomic bonds, reducing the material’s resistance to void growth and limiting post-shock BCC structure recovery. For micro-spallation Up ≥ 3.0 km/s, this thermal effect exacerbates damage: as seen in Fig. 13, smaller and more numerous voids form, and Fig. 14 shows intensified atomic ejection from the free surface at higher temperatures—consistent with the study’s existing observations of shock-induced melting and structural disorder.
3.3 Analysis of Free Surface Velocity Profiles
At shock loading conditions, free-surface velocity data serves as a fundamental diagnostic tool for evaluating material dynamic response. Experimental visualization of damage progression during spallation is inherently constrained, making it challenging to directly link specific features of the velocity profile to the underlying failure mechanisms. Molecular dynamics simulations address this limitation by enabling detailed temporal and spatial tracking of the damage process. In this study, two characteristic time points are examined for their relevance to damage analysis: t1, represent to the first velocity drop, and t2, marking the onset of the pullback signal.
Fig. 15 presents free-surface velocity alongside damage analysis data at 300 K. From Fig. 15, it could be founded that at Up = 1.0 km/s classical spallation happens; at Up = 2.0 and 3.0 km/s micro-spallation occurs. For classical spallation (Fig. 15a), t1 aligns with the initiation of void growth, indicating that the first velocity reduction corresponds to the start of void nucleation, as illustrated in the right panel. By t2, significant void coalescence has taken place: the voids almost extend across the entire cross-section of the model, and the appearance right-hand spall fragment is observable. This confirms that the pullback signal indicates the conclusion of the spallation process.
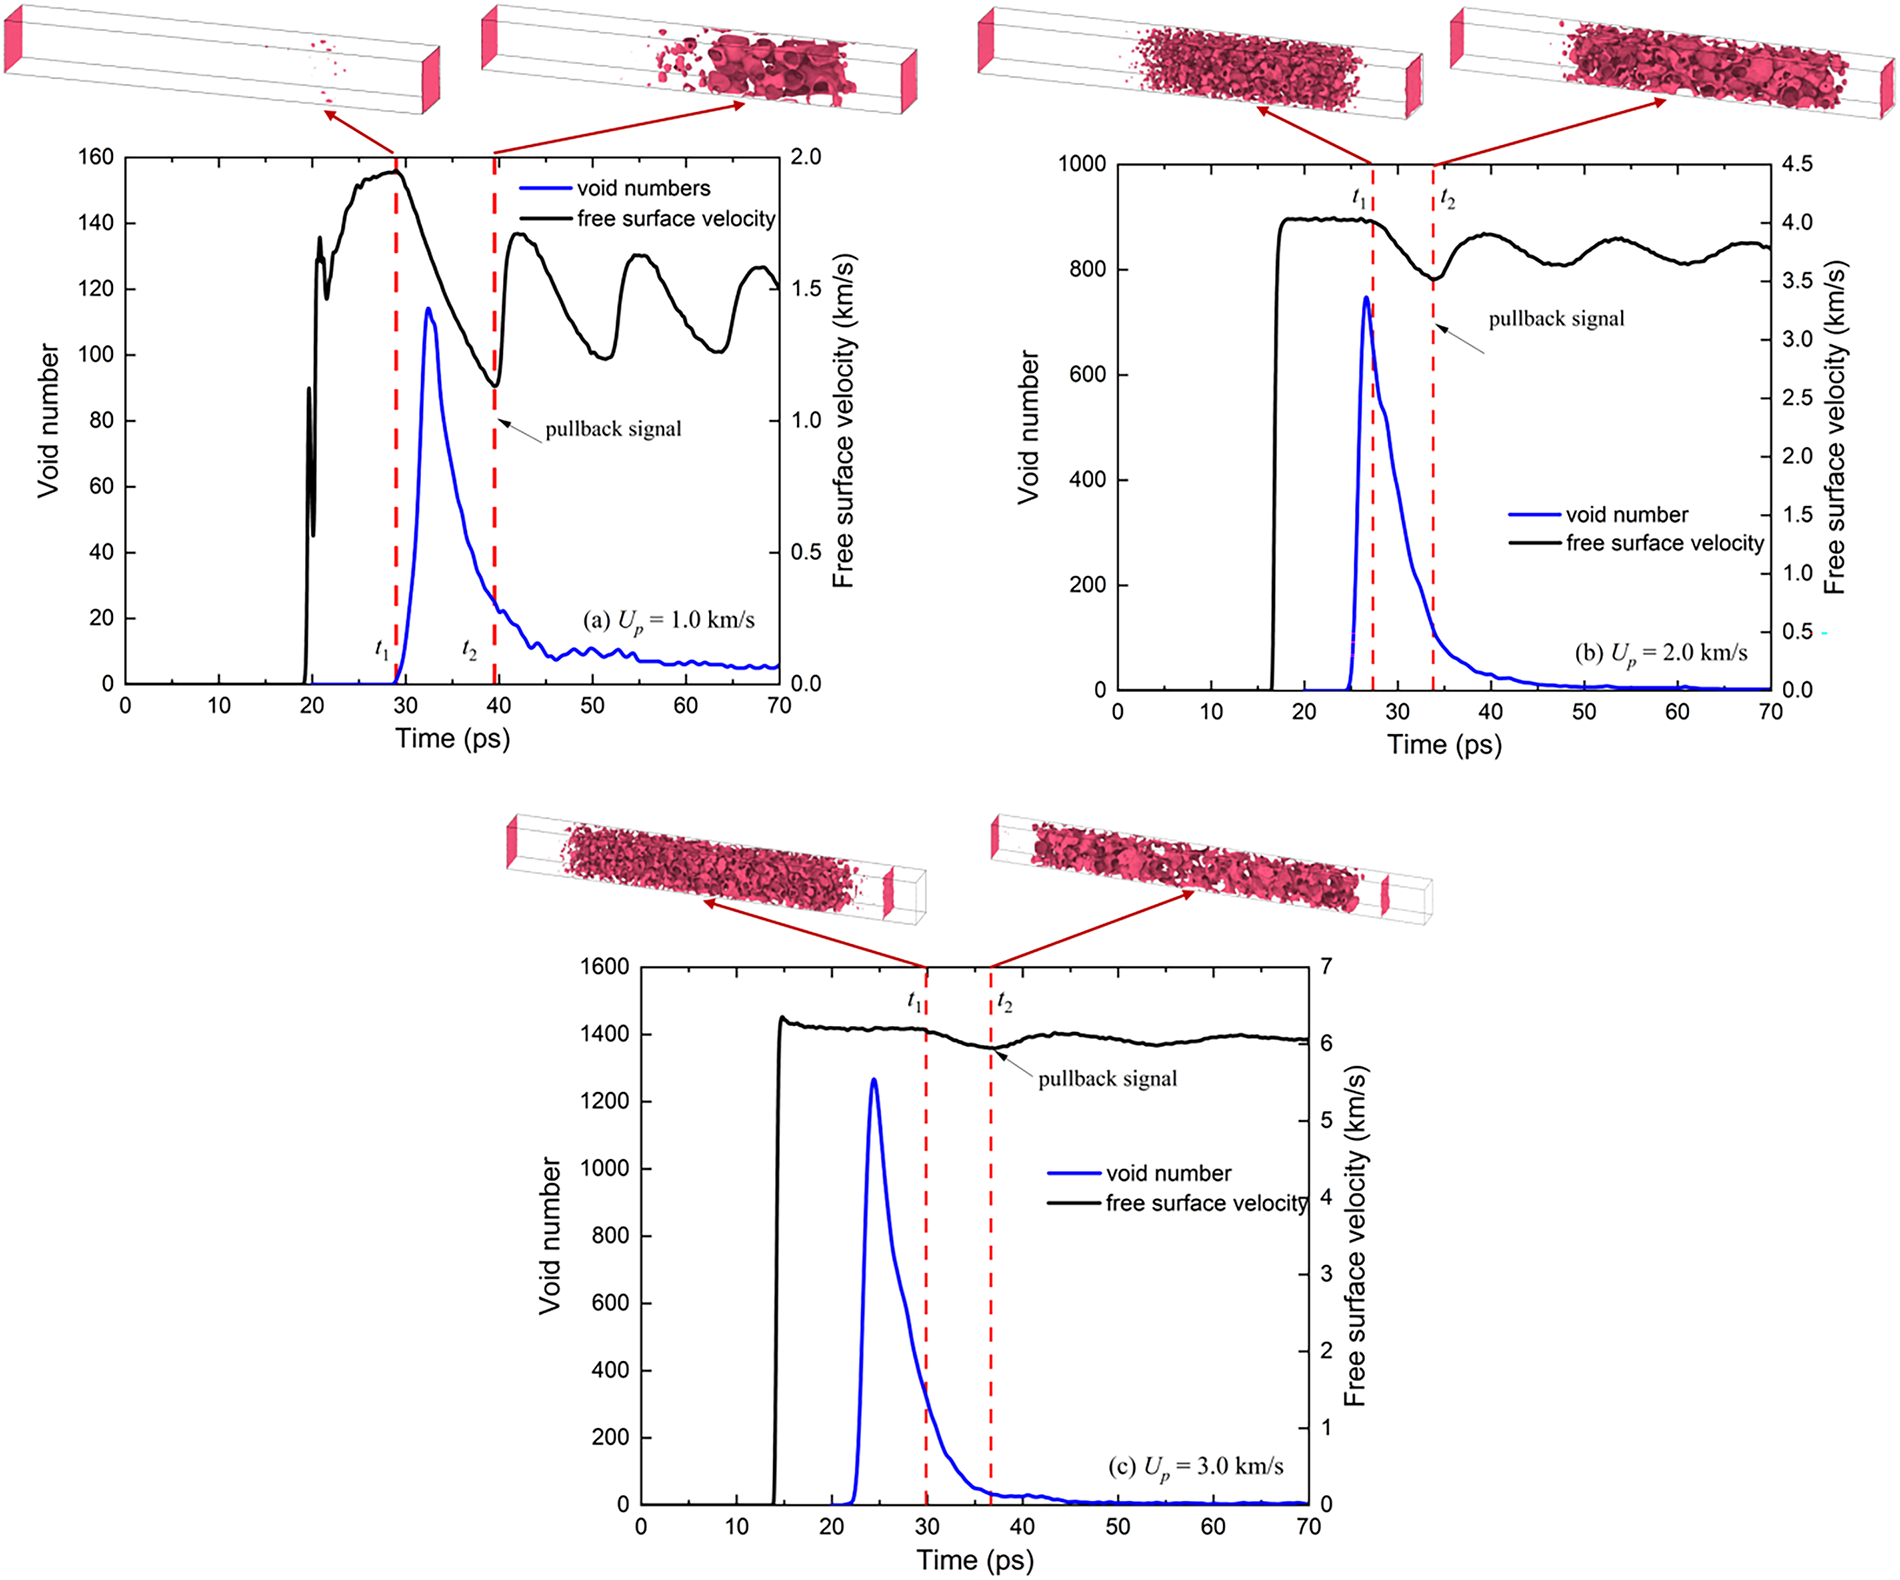
Figure 15: Free-surface velocity and void number evolution (a) Up = 1.0 km/s, (b) Up = 2.0 km/s, and (c) Up = 3.0 km/s
At higher shock velocities (Fig. 15b,c, micro-spallation regime), void nucleation precedes t1, with the delay between nucleation and t1 becoming more pronounced at Up = 3.0 km/s—a key distinction from classical spallation, where t1 no longer represents void nucleation. The physical origin of t1 in micro-spallation is tied to melt ejection, as supported by integrated analysis of Fig. 14 (atomic ejection) and Fig. 15 (velocity/void dynamics). Temporally, t1 synchronizes strictly with the onset of intense melt ejection: at Up = 2.0 km/s, t1 = ~18 km/s coincides with a sharp surge in ejected atoms (from ~50 to ~200 atoms, tracked via the same atomic configuration analysis as Fig. 14); at Up = 3.0 km/s, t1 = = 22 ps overlaps with an even more pronounced ejection (from ~80 to ~300 atoms). Mechanistically, this velocity drop arises from momentum conservation: micro-spallation is characterized by shock-induced complete melting (validated via RDF/ACNA in Section 3.2), and molten atomic clusters escaping the free surface at t1 carry away system momentum, directly reducing the free-surface velocity of the remaining material. Further, void nucleation in micro-spallation begins at ~12–15 ps (Fig. 15b,c, void number curves)—5–8 ps earlier than t1—confirming t1 is decoupled from void formation and driven by melt ejection.
Nevertheless, t2 retains its physical significance across both regimes, corresponding to cross-section-spanning void structures and the formation of discrete spall layers (as shown in the right panels of Fig. 15b,c). Thus, even in micro-spallation, the pullback signal reliably indicates spall layer formation.
This work establishes regime-specific correlations between free-surface velocity features and damage mechanisms, advancing the qualitative links reported in prior studies [2,29]. For classical spallation Up ≤ 1.5 km/s, Fig. 15a shows the first velocity drop (t1) corresponds to void nucleation, while the pullback signal (t2) marks spall layer formation. In micro-spallation Up ≥ 3.0 km/s, t1 no longer aligns with nucleation (voids form earlier, per Fig. 15c) but instead reflects molten atom ejection, though t2 remains a reliable indicator of spall layer formation. As shown in Fig. 5, elevated temperatures further modulate these signals: they delay t2 and weaken the Hugoniot Elastic Limit (HEL) response-trends that align with thermal softening and provide a practical basis for inferring spall modes from experimental velocity data, even in extreme shock environments.
In this study, NEMD simulations were employed to systematically investigate the effect of initial temperature on the shock response of single-crystal tantalum (Ta), covering a broad range of shock velocities (0.75–4.0 km/s) and initial temperatures (300–2000 K). The conclusions, aligned with the proposed research objectives, are summarized as follows:
(1) A three-regime spallation framework for single-crystalline Ta were identified based on shock velocity (Up). When Up ≤ 1.5 km/s, classical spallation prevails: Ta remains in the solid state throughout the process, undergoing reversible BCC–FCC/HCP phase transitions (transient transformation during compression and partial recovery after unloading), accompanied by well-defined void nucleation, growth, and coalescence, with no melting and the material ultimately fracturing into large, intact spall layers. When Up ≥ 3.0 km/s, micro-spallation occurs, characterized by complete shock-induced melting, the formation of highly disordered atomic configurations, and extensive fragmentation. An intermediate regime is observed for 2.0 km/s ≤ Up ≤ 2.5 km/s, with partial melting accompanying damage evolution. Across all velocity conditions, spall strength shows a consistent decline with increasing initial temperature, which reflects the thermal softening effect.
(2) Elevated temperatures modulate microstructural damage evolution via a dual mechanism. Void dynamics are temperature-sensitive: higher temperatures delay nucleation but increase void count, expanding the spall region and fragment number due to reduced spall strength. For micro-spallation Up ≥ 3.0 km/s, shock-induced melting exacerbates damage, with smaller, more numerous voids and atomic ejection from the free surface, which intensifies with temperature. Free surface velocity profiles as damage indicators
Elevated initial temperatures exhibit significant regulatory effects on structural evolution and damage progression of Ta. Specifically, they promote structural disorder: the post-shock recovery ability of BCC structures diminishes, while the fraction of disordered phases increases. Void dynamics are also temperature-sensitive: higher temperatures delay the onset of void nucleation but increase the total void count, which in turn expands the spall region and raises the number of fragments—this is attributed to reduced spall strength under thermal softening. For the micro-spallation regime (Up ≥ 3.0 km/s), shock-induced melting is exacerbated by elevated temperatures, resulting in smaller and more numerous voids; meanwhile, atomic ejection from the free surface is intensified, and this intensification becomes more pronounced with increasing temperature.
(3) Regime-specific correlations between free-surface velocity profiles and damage mechanisms are established, providing a quantitative tool for experimental spall mode inference: In classical spallation, the first velocity drop (t1) corresponds to the onset of void nucleation, and the pullback signal (t2) marks the formation of spall layers. In micro-spallation, t1 no longer reflects void nucleation—this is due to shock-induced pre-melting that causes atomic disorder and early void nucleation—yet t2 remains a reliable indicator of spall layer generation. Additionally, elevated temperatures delay the occurrence of the t2 signal and weaken the Hugoniot Elastic Limit (HEL) signal, which is consistent with the thermal softening effect reducing the material’s elastic deformation capacity.
This work clarifies the critical role of initial temperature in modulating spallation regime transitions, microstructural damage, and free-surface velocity signatures of single-crystalline Ta under extreme shock loading. The quantified three-regime framework and temperature-dependent damage mechanisms provide essential insights for predicting the failure of Ta-based components in high-temperature shock environments.
Acknowledgement: Not applicable.
Funding Statement: This research was funded by the Changsha Municipal Natural Science Foundation (Grant No. kq2402024) and Chengdu Polytechnic Scientific Research Platform (23KYPT01).
Author Contributions: The authors confirm contribution to the paper as follows: Conceptualization, methodology, writing—original draft preparation, Yuntian Wang; software, investigation, Taohua Liang and Yuan Zhou; data curation, validation, Weimei Shi and Lijuan Huang; funding acquisition, supervision, Yuzhu Guo. All authors reviewed the results and approved the final version of the manuscript.
Availability of Data and Materials: The data that support the findings of this study are available from the Corresponding Author, Yuzhu Guo, upon reasonable request.
Ethics Approval: Not applicable.
Conflicts of Interest: The authors declare no conflicts of interest to report regarding the present study.
References
1. Li X, Zhang ZB, He PF, Sun C, Jiang B, Liang XB. Research status and prospect of tantalum and tantalum-based alloy. Rare Met Mater Eng. 2023;52(3):1131–42. (In Chinese). [Google Scholar]
2. Antoun T, Curran DR, Razorenov SV, Seaman L, Kanel GI, Utkin AV. Spall fracture. New York, NY, USA: Springer; 2003. [Google Scholar]
3. Yang X, Zhao H, Gao X, Chen Z, Zeng X, Wang F. Molecular dynamics study on spallation fracture in single crystal and nanocrystalline tin. J Appl Phys. 2022;132(7):075903. doi:10.1063/5.0099331. [Google Scholar] [CrossRef]
4. Chen B, Li Y, Şopu D, Eckert J, Wu W. Molecular dynamics study of shock-induced deformation phenomena and spallation failure in Ni-based single crystal superalloys. Int J Plast. 2023;162(1):103539. doi:10.1016/j.ijplas.2023.103539. [Google Scholar] [CrossRef]
5. Kanel GI, Razorenov SV, Bogatch A, Utkin AV, Grady DE. Simulation of spall fracture of aluminum and magnesium over a wide range of load duration and temperature. Int J Impact Eng. 1997;20(6–10):467–78. doi:10.1016/s0734-743x(97)87435-0. [Google Scholar] [CrossRef]
6. Tigli A, Sahin H, Dizdar KC, Dispinar D. Determination of effect of hydrogen on strength of aluminum by MD simulation. Appl Phys A. 2022;128(9):822. doi:10.1007/s00339-022-05981-4. [Google Scholar] [CrossRef]
7. Millett JCF, Fensin SJ, Owen GD, Eftink BP, Lear C, Whiteman G, et al. The mechanical and microstructural response of single crystal aluminium to one dimensional shock loading: the effects of orientation. Acta Mater. 2023;246:118727. doi:10.1016/j.actamat.2023.118727. [Google Scholar] [CrossRef]
8. Ashitkov SI, Komarov PS, Struleva EV, Agranat MB, Kanel GI, Khishchenko KV. The behavior of tantalum under ultrashort loads induced by femtosecond laser. J Phys Conf Ser. 2015;653:012001. doi:10.1088/1742-6596/653/1/012001. [Google Scholar] [CrossRef]
9. Hahn EN, Germann TC, Ravelo R, Hammerberg JE, Meyers MA. On the ultimate tensile strength of tantalum. Acta Mater. 2017;126:313–28. doi:10.1016/j.actamat.2016.12.033. [Google Scholar] [CrossRef]
10. Zaretsky EB. Experimental determination of the dynamic tensile strength of liquid Sn, Pb, and Zn. J Appl Phys. 2016;120(2):025902. doi:10.1063/1.4958798. [Google Scholar] [CrossRef]
11. Wang L, Shen L, Yi J, Yang X, Peng Y, Ding J, et al. Prediction model of dynamic fracture toughness of nickel-based alloys: combination of data-driven and multi-scale modelling. Eur J Mech A. 2026;116:105892. doi:10.1016/j.euromechsol.2025.105892. [Google Scholar] [CrossRef]
12. Yang X, Tian Y, Zhao H, Wang F, Wang L, Lin M, et al. Coupling of spallation and microjetting in aluminum at the atomic scale. Phys Rev B. 2024;110(2):024113. doi:10.1103/physrevb.110.024113. [Google Scholar] [CrossRef]
13. Hahn EN, Fensin SJ, Germann TC, Gray GTIII. Orientation dependent spall strength of tantalum single crystals. Acta Mater. 2018;159:241–8. doi:10.1016/j.actamat.2018.07.073. [Google Scholar] [CrossRef]
14. Wang L, Zhao F, Zhao FP, Cai Y, An Q, Luo SN. Grain boundary orientation effects on deformation of Ta bicrystal nanopillars under high strain-rate compression. J Appl Phys. 2014;115(5):053528. doi:10.1063/1.4864427. [Google Scholar] [CrossRef]
15. Tang MX, Li C, Cai Y, Luo SN. Deformation twinning to dislocation slip transition in single-crystal tantalum under dynamic compression. J Mater Sci. 2022;57(10):6026–38. doi:10.1007/s10853-022-06975-6. [Google Scholar] [CrossRef]
16. Tramontina D, Erhart P, Germann T, Hawreliak J, Higginbotham A, Park N, et al. Molecular dynamics simulations of shock-induced plasticity in tantalum. High Energy Density Phys. 2014;10:9–15. doi:10.1016/j.hedp.2013.10.007. [Google Scholar] [CrossRef]
17. Li W, Hahn EN, Yao X, Germann TC, Zhang X. Shock induced damage and fracture in SiC at elevated temperature and high strain rate. Acta Mater. 2019;167:51–70. doi:10.1016/j.actamat.2018.12.035. [Google Scholar] [CrossRef]
18. Plimpton S. Fast parallel algorithms for short-range molecular dynamics. J Comput Phys. 1995;117(1):1–19. doi:10.1006/jcph.1995.1039. [Google Scholar] [CrossRef]
19. Ravelo R, Germann TC, Guerrero O, An Q, Holian BL. Shock-induced plasticity in tantalum single crystals: interatomic potentials and large-scale molecular-dynamics simulations. Phys Rev B. 2013;88(13):134101. doi:10.1103/physrevb.88.134101. [Google Scholar] [CrossRef]
20. Liu H, Song H, Zhang H, Duan X, Zhang T, Liu H, et al. Melting of tantalum under high pressure: in situ X-ray diffraction and ab initio molecular dynamic simulations. J Appl Phys. 2025;137(20):205905. doi:10.1063/5.0260857. [Google Scholar] [CrossRef]
21. Zhou TT, He AM, Wang P, Shao JL. Spall damage in single crystal Al with helium bubbles under decaying shock loading via molecular dynamics study. Comput Mater Sci. 2019;162:255–67. doi:10.1016/j.commatsci.2019.02.019. [Google Scholar] [CrossRef]
22. Ju SP, Huang CC, Chen HY. Illuminating the mechanical responses of amorphous boron nitride through deep learning: a molecular dynamics study. Comput Mater Sci. 2024;232(1):112664. doi:10.1016/j.commatsci.2023.112664. [Google Scholar] [CrossRef]
23. Wang MM, Dang R, Parakh A, Lee AC, Li Z, Chariton S, et al. Nanotwinned alloys under high pressure. Acta Mater. 2025;285:120654. doi:10.1016/j.actamat.2024.120654. [Google Scholar] [CrossRef]
24. Song W, Yu Y, Guan Y. Role of void shape on shock responses of nanoporous metallic glasses via molecular dynamics simulation. Int J Mech Sci. 2022;218:107076. doi:10.1016/j.ijmecsci.2022.107076. [Google Scholar] [CrossRef]
25. Ehrich HJ, Dollmann A, Grützmacher PG, Gachot C, Eder SJ. Automated identification and tracking of deformation twin structures in molecular dynamics simulations. Comput Mater Sci. 2024;236:112878. doi:10.1016/j.commatsci.2024.112878. [Google Scholar] [CrossRef]
26. Degirmenci U, Yildiz YO. Examination of mechanical behaviour of fullerene doped aluminium matrix composite produced by sintering process. Mater Today Commun. 2024;38:107916. doi:10.1016/j.mtcomm.2023.107916. [Google Scholar] [CrossRef]
27. Li J, Dong L, Zang X, Zhang X, Zhao W, Wang F. Study on micro-crack propagation behavior of single-crystal α-Ti under shear stress based on molecular dynamics. Mater Today Commun. 2020;25:101622. doi:10.1016/j.mtcomm.2020.101622. [Google Scholar] [CrossRef]
28. Stukowski A. Computational analysis methods in atomistic modeling of crystals. JOM. 2014;66(3):399–407. doi:10.1007/s11837-013-0827-5. [Google Scholar] [CrossRef]
29. He L, Wang F, Zeng X, Yang X, Qi Z. Atomic insights into shock-induced spallation of single-crystal aluminum through molecular dynamics modeling. Mech Mater. 2020;143:103343. doi:10.1016/j.mechmat.2020.103343. [Google Scholar] [CrossRef]
30. Xiang M, Cui J, Yang Y, Liao Y, Wang K, Chen Y, et al. Shock responses of nanoporous aluminum by molecular dynamics simulations. Int J Plast. 2017;97(1):24–45. doi:10.1016/j.ijplas.2017.05.008. [Google Scholar] [CrossRef]
31. Marsh SP. LASL shock Hugoniot data. Oakland, CA, USA: University of California Press; 1980. [Google Scholar]
32. Signor L, de Rességuier T, Dragon A, Roy G, Fanget A, Faessel M. Investigation of fragments size resulting from dynamic fragmentation in melted state of laser shock-loaded tin. Int J Impact Eng. 2010;37(8):887–900. doi:10.1016/j.ijimpeng.2010.03.001. [Google Scholar] [CrossRef]
33. Thomas T. Plastic disturbances whose speed of propagation is less than the velocity of a shear wave. Indiana Univ Math J. 1958;7(6):893–900. doi:10.1512/iumj.1958.7.57050. [Google Scholar] [CrossRef]
34. de Rességuier T, Signor L, Dragon A, Roy G. Dynamic fragmentation of laser shock-melted tin: experiment and modelling. Int J Fract. 2010;163(1):109–19. doi:10.1007/s10704-009-9378-8. [Google Scholar] [CrossRef]
Cite This Article
 Copyright © 2026 The Author(s). Published by Tech Science Press.
This work is licensed under a Creative Commons Attribution 4.0 International License , which permits unrestricted use, distribution, and reproduction in any medium, provided the original work is properly cited.
 Downloads
 Citation Tools